hydroelectric power plant (plta) of ...4)/ajsc2017(6.4...ramdhan halid siregar1, syahrizal2,...
TRANSCRIPT

Asian Journal of Natural & Applied Sciences Vol. 6(4) December 2017 __________________________________________________________________________________________________________________________________________________________________________________________________________________________________________________________________________________________________________________________________________________________________________________________________________________________________________________________________
Copyright © 2017 Leena and Luna International, Chikusei, Japan.
1 | P a g e (株) リナアンドルナインターナショナル, 筑西市,日本
ISSN: 2186-8476, ISSN: 2186-8468 Print
www.ajsc. leena-luna.co.jp
HYDROELECTRIC POWER PLANT (PLTA) OF PEUSANGAN
1 AND 2 4X22MW AT SUBSISTEM ACEH
Ramdhan Halid Siregar1, Syahrizal
2, Muhammad Arifai
3
1- 3Department of
Electrical Engineering, Universitas Syiah Kuala, Banda Aceh,
INDONESIA.
ABSTRACT
Hydroelectric power plant contributes much for modern people who use electric
equipment. This study aims to analyze the power flow of the 150kV Aceh Power
System under maximum loading conditions before and after the entry of Peusangan
hydropower in 2018. The addition of new power plants is one way to fulfill people's
need for electric energy so that a power flow study is needed to see the impact of the
addition. The problem of this research is limited to determining the value of the
substation voltage, active power flow and reactive power on various channels and
power losses before and after Peusangan hydropower comes. The method of power
flow approach that will be used in this research is Gauss-Seidel method with
accuracy factor 0.0001 through simulation with the help of ETAP 12.6.0 software.
The simulation is done in two scenarios: 1) Power System of 150kV Aceh at present;
and 2) Entrance of Peusangan Power Plant on Power System 150kV Aceh. The
simulation result shows that the Banda Aceh substation is a substation near the
undervoltage limit on the upcoming Aceh 2018 subsystem with the value of the
voltage is 137.14 kV or 91.43%. The highest active power and reactive power after
the addition of the power plant are on the Lhokseumawe - Arun channel of 105,897
MW and 51,734 Mvar. The highest power losses after the inclusion of new power
plants occurred on the Sigli - Banda Aceh line of 1,309 kW and 4,705 kvar.
Keywords: Power Flow, ETAP, Interconnection System, Aceh
INTRODUCTION
The availability of electric energy especially in Aceh has become a serious public issue It is
noted the modernity need electrical energy and has become an inseparable part of human
life. The growing number of people in Aceh and the development of the people's economy
each year will lead to an increase in the demand for electricity in Aceh, so that the amount of
electric power must be increased in order to keep up with the increasing needs of the
community. One way to increase the availability of electric power is by adding new plants.
With the inclusion of new plants into the system that has been there before it will have an
impact on the system.
One of the power plants in Aceh that will be planned for the addition is PLTA Peusangan 1
and 2. In principle, this hydroelectric project has been started from 1995, but due to various
obstacles this project was delayed for more than 12 years, then in 2011 hydropower
development project Peusangan 1 and Peusangan 2 in Central Aceh Regency are seen to be
resumed and targeted to strengthen the North Sumatera of electricity system, especially in
Aceh in 2018.
Power flow study is one way that can be done to determine the effect caused by the addition
of new generators in electrical systems. One of the information obtained from the power flow
study is the voltage and power flow of the power system after the addition of a new power
Asian Journal of Natural & Applied Sciences Vol. 6(4) December 2017 __________________________________________________________________________________________________________________________________________________________________________________________________________________________________________________________________________________________________________________________________________________________________________________________________________________________________________________________________
ISSN: 2186-8476, ISSN: 2186-8468 Print
www.ajsc.leena-luna.co.jp
Leena and Luna International, Chkusei, Japan. Copyright © 2017
(株) リナアンドルナインターナショナル, 筑西市,日本 P a g e | 2
plant. This information can be used to evaluate the work of the electric power system and
analyze the generation and loading conditions.
BASIC THEORY
Power System
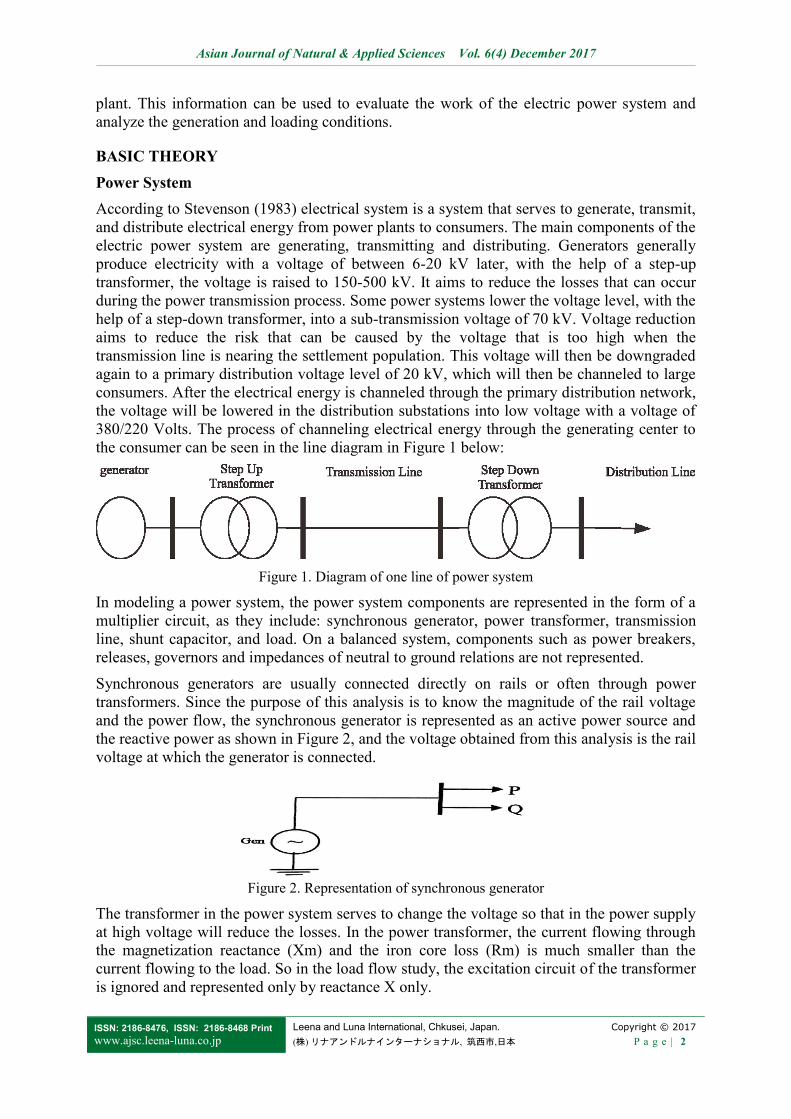
According to Stevenson (1983) electrical system is a system that serves to generate, transmit,
and distribute electrical energy from power plants to consumers. The main components of the
electric power system are generating, transmitting and distributing. Generators generally
produce electricity with a voltage of between 6-20 kV later, with the help of a step-up
transformer, the voltage is raised to 150-500 kV. It aims to reduce the losses that can occur
during the power transmission process. Some power systems lower the voltage level, with the
help of a step-down transformer, into a sub-transmission voltage of 70 kV. Voltage reduction
aims to reduce the risk that can be caused by the voltage that is too high when the
transmission line is nearing the settlement population. This voltage will then be downgraded
again to a primary distribution voltage level of 20 kV, which will then be channeled to large
consumers. After the electrical energy is channeled through the primary distribution network,
the voltage will be lowered in the distribution substations into low voltage with a voltage of
380/220 Volts. The process of channeling electrical energy through the generating center to
the consumer can be seen in the line diagram in Figure 1 below:
Figure 1. Diagram of one line of power system
In modeling a power system, the power system components are represented in the form of a
multiplier circuit, as they include: synchronous generator, power transformer, transmission
line, shunt capacitor, and load. On a balanced system, components such as power breakers,
releases, governors and impedances of neutral to ground relations are not represented.
Synchronous generators are usually connected directly on rails or often through power
transformers. Since the purpose of this analysis is to know the magnitude of the rail voltage
and the power flow, the synchronous generator is represented as an active power source and
the reactive power as shown in Figure 2, and the voltage obtained from this analysis is the rail
voltage at which the generator is connected.
Figure 2. Representation of synchronous generator
The transformer in the power system serves to change the voltage so that in the power supply
at high voltage will reduce the losses. In the power transformer, the current flowing through
the magnetization reactance (Xm) and the iron core loss (Rm) is much smaller than the
current flowing to the load. So in the load flow study, the excitation circuit of the transformer
is ignored and represented only by reactance X only.

Asian Journal of Natural & Applied Sciences Vol. 6(4) December 2017 __________________________________________________________________________________________________________________________________________________________________________________________________________________________________________________________________________________________________________________________________________________________________________________________________________________________________________________________________
Copyright © 2017 Leena and Luna International, Chikusei, Japan.
3 | P a g e (株) リナアンドルナインターナショナル, 筑西市,日本
ISSN: 2186-8476, ISSN: 2186-8468 Print
www.ajsc. leena-luna.co.jp
The transmission line is represented according to the transmission class. Representation of
the transmission line is divided into 3 classes namely (Hutauruk, 1985):
1. Short transmissions
2. Medium transmission
3. Long transmission
In this case, the class division of the transmission line corresponds to the magnitude of the
channel capacitance to the ground. Capacity to the ground is a function of the distance from
the transmission line. For short transmission lines the magnitude of the capacitance to the
ground can be neglected. For medium-sized channels the magnitude of the capacitance is not
negligible, but not so large that the capacitance to the ground can be considered centralized.
For long transmission the magnitude of the capacitance price can not be considered
centralized but rather evenly distributed along the channel.
In analyzing electric power systems, there are three ways to represent a load, such as:
a. Representation of load with fixed power. In this case the active power (MW), as
well as the reactive power (MVAR) are considered constant. This load
representation is used for power flow studies.
b. Representation of loads with fixed currents.
c. Representation of load with fixed impedance.
To represent a load with a fixed impedance, the power absorbed by the load is converted into
a series or parallel impedance. The representation of loads with fixed impedances is usually
used in the stability study of electrical power systems. When real power (MW) and reactive
(MVAR) are assumed to be known and the magnitude is maintained constant then the
impedance Z is calculated as follows:
Z= 𝑉
𝐼=
|𝑉|2
𝑃−𝑗𝑄 (1)
In the power system analysis besides using quantities in electric units, it also uses quantities
that describe the value as a fraction of the reference value. The value that becomes a
reference is usually a rating or full load value. This quantity is called per unit (abbreviated
p.u). The definition of per unit is described in the following equation.
Per Unit =𝑡𝑟𝑢𝑒 𝑣𝑎𝑙𝑢𝑒 (𝑒𝑙𝑒𝑐𝑡𝑟𝑖𝑐 𝑞𝑢𝑎𝑛𝑡𝑖𝑡𝑦)
𝑏𝑎𝑠𝑒 𝑜𝑟 𝑟𝑒𝑓𝑒𝑟𝑒𝑛𝑐𝑒 (𝑠𝑎𝑚𝑒 𝑞𝑢𝑎𝑛𝑡𝑖𝑡𝑦) (2)
Some practitioners describe the value per unit as a percentage of its basic value.
Interconnection System
The interconnection system is a power system consisting of several power plants and
substations (GIs) interconnected (connected to each other) through transmission lines and
serving the existing load on the entire substation (GI) (Marsudi, 2005).
In the interconnection system, all plants need to be coordinated in order to achieve minimum
cost of generation, of course with regard to quality and reliability. The quality and reliability
of the supply of electricity involves frequency, voltage and disturbance. Similarly, the issue
of power distribution which also needs to be observed in the interconnection system in order
that there is no transmission equipment that is overloaded.

Asian Journal of Natural & Applied Sciences Vol. 6(4) December 2017 __________________________________________________________________________________________________________________________________________________________________________________________________________________________________________________________________________________________________________________________________________________________________________________________________________________________________________________________________
ISSN: 2186-8476, ISSN: 2186-8468 Print
www.ajsc.leena-luna.co.jp
Leena and Luna International, Chkusei, Japan. Copyright © 2017
(株) リナアンドルナインターナショナル, 筑西市,日本 P a g e | 4
Power Flow
Power flow study is a study conducted to obtain information about the power flow or system
voltage in steady operating conditions. This information is needed to evaluate the
performance of the power system and to analyze the conditions of generation and loading
(Cekdin, 2007).
In the study of power flow, buses are divided into 3 types, namely:
1. Swing rail (swing or slack bus)
This rail is used as a reference wherein known parameters are voltage magnitude (| V |) and
phase voltage angle (∂). Swing rail is required on the system because the P and Q values for
each rail can not be determined first. Generally in the calculation of power flow there is only
one swing rail.
2. Rail load (P-Q bus)
The parameters known in the load rail are active power (P) and and reactive power (Q). The
active power and reactive power of the load are known from the load estimation, while the
active and reactive power of the generator (if any) has been determined. The pure load rail
has a value of PG = 0 and QG = 0.
3. Rail control (P-Q bus)
The known parameters are active power (P) and voltage magnitude (| V |), where P is
determined and | V | kept constant with reactive power injection. In this rail, the active power
and reactive power of the load are known from the load estimation.
Power flow studies are useful for:
1. Planning and development of electricity network of power flow studies provides
information on the impact of new load loading, adding new generation, adding
transmission lines, interconnecting with other systems, and so on.
2. Determination of loading of electrical system equipment such as transmission line
and transformer at present or future condition.
3. Determination of the best operating conditions of electric power system
4. Provide input data for noise calculations and stability studies.
Gauss-Seidell Method
The Gauss-Seidel method is one of the methods used in power flow. The digital completion
for this load flow problem, will follow a looping process by setting approximate values for
unknown bus voltages and computing a new value for each bus voltage of the approximate
values obtained from the previous iteration process. So we get a new set of voltage values for
each bus and then used to calculate the set of next iteration bus voltage. Each calculation of a
new set of voltages is called iteration. The iteration process is repeated continuously until the
changes that occur on each bus are less than a minimum value that has been determined
(Mahendra, 2011).
Modeling a rail of a power system in Fig. 3 is an impedance in a system that has been
converted into a perunit (pu) admittance.
Asian Journal of Natural & Applied Sciences Vol. 6(4) December 2017 __________________________________________________________________________________________________________________________________________________________________________________________________________________________________________________________________________________________________________________________________________________________________________________________________________________________________________________________________
Copyright © 2017 Leena and Luna International, Chikusei, Japan.
5 | P a g e (株) リナアンドルナインターナショナル, 筑西市,日本
ISSN: 2186-8476, ISSN: 2186-8468 Print
www.ajsc. leena-luna.co.jp
Figure 3 Typical bus in power system
In the Gauss-Seidel method, to find the value is as follows:
𝑉𝑖(𝑘+1)
𝑃𝑖𝑠𝑐ℎ−𝑗𝑄𝑖
𝑠𝑐ℎ
𝑉𝑖∗(𝑘) +∑ 𝑦𝑖𝑗𝑉𝑗
(𝑘)
∑ 𝑦𝑖𝑗 𝑗 ≠ 𝑖 (3)
If the equations above are solved back to see Pi and Qi, then the equation is as follows:
𝑃𝑖(𝑘+1)
= ℜ {𝑉𝑖∗(𝑘)
[𝑉𝑖(𝑘) ∑ 𝑦𝑖𝑗 − ∑ 𝑦𝑖𝑗𝑉𝑗
(𝑘)𝑛𝑗−1
𝑛𝑗−0 ]} 𝑗 ≠ 𝑖 (4)
𝑄𝑖(𝑘+1)
= −ℑ {𝑉𝑖∗(𝑘)
[𝑉𝑖(𝑘) ∑ 𝑦𝑖𝑗 − ∑ 𝑦𝑖𝑗𝑉𝑗
(𝑘)𝑛𝑗−1
𝑛𝑗−0 ]} 𝑗 ≠ 𝑖 (5)
The iteration process will continue if there is no tolerance value. The complete procedure of
the Gauss Sheidel method is as follows:
a. Assume the value of Vi* and find the settlement to get Vi(1)
b. If (Vi(1)
– Vi(0)
) ≤ the value of tolerance , the calculation is stopped and Vi = Vi (1)
c. This process continues until the bus ends.
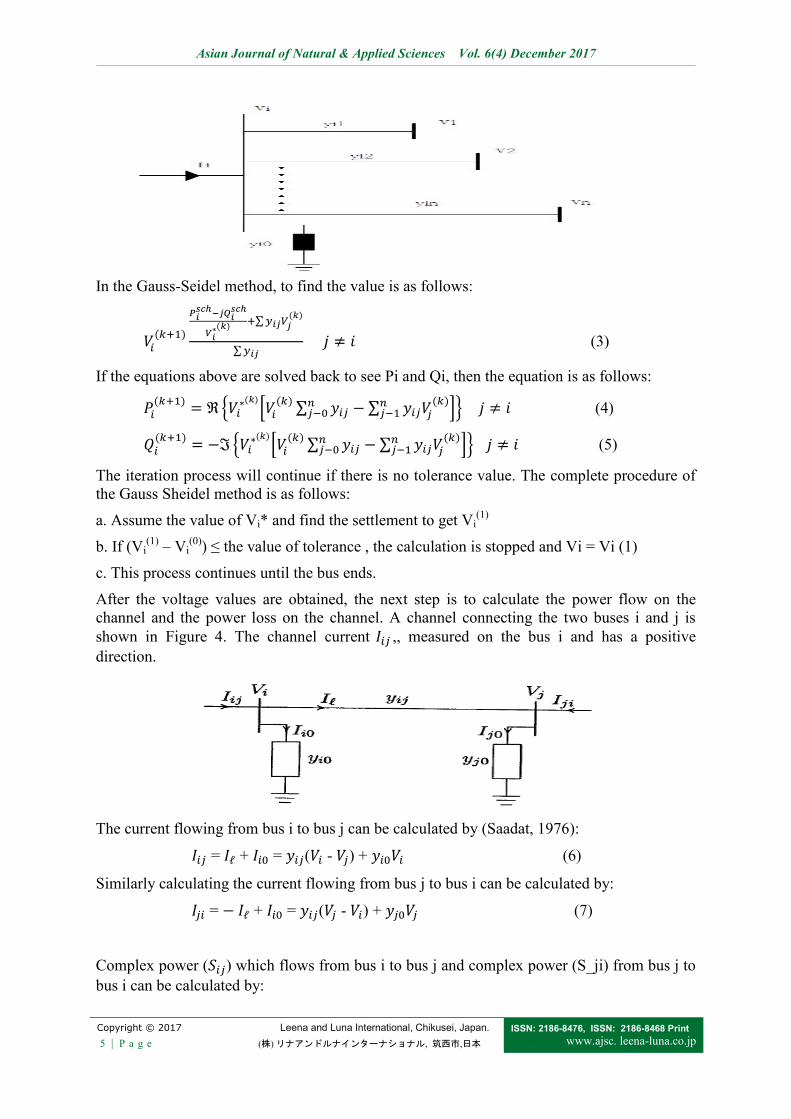
After the voltage values are obtained, the next step is to calculate the power flow on the
channel and the power loss on the channel. A channel connecting the two buses i and j is
shown in Figure 4. The channel current 𝐼𝑖𝑗 ,, measured on the bus i and has a positive
direction.
The current flowing from bus i to bus j can be calculated by (Saadat, 1976):
𝐼𝑖𝑗 = 𝐼ℓ + 𝐼𝑖0 = 𝑦𝑖𝑗(𝑉𝑖 - 𝑉𝑗) + 𝑦𝑖0𝑉𝑖 (6)
Similarly calculating the current flowing from bus j to bus i can be calculated by:
𝐼𝑗𝑖 = − 𝐼ℓ + 𝐼𝑖0 = 𝑦𝑖𝑗(𝑉𝑗 - 𝑉𝑖) + 𝑦𝑗0𝑉𝑗 (7)
Complex power (𝑆𝑖𝑗) which flows from bus i to bus j and complex power (S_ji) from bus j to
bus i can be calculated by:

Asian Journal of Natural & Applied Sciences Vol. 6(4) December 2017 __________________________________________________________________________________________________________________________________________________________________________________________________________________________________________________________________________________________________________________________________________________________________________________________________________________________________________________________________
ISSN: 2186-8476, ISSN: 2186-8468 Print
www.ajsc.leena-luna.co.jp
Leena and Luna International, Chkusei, Japan. Copyright © 2017
(株) リナアンドルナインターナショナル, 筑西市,日本 P a g e | 6
𝑆𝑖𝑗= 𝑉𝑖𝐼∗
𝑖𝑗 (8)
𝑆𝑗𝑖= 𝑉𝑗𝐼∗𝑗𝑖 (9)
The power loss at line i to j is the sum of the power flow from equation (8) and equation (9),
so that it is obtained:
𝑆𝐿 𝑖𝑗 = 𝑆𝑖𝑗 + 𝑆𝑗𝑖 (10)
RESEARCH METHODS
The study was conducted using Gauss-Seidell method. The study was conducted in April
2016 and for the location under consideration was the 150kV Aceh power system.
This research requires tools and materials that are as follows:
1. Laptop
2. ETAP Software 12.6.0
3. Data system of generator and distributor of Aceh subsystem
Figure 4. Diagram of the research work flow

Asian Journal of Natural & Applied Sciences Vol. 6(4) December 2017 __________________________________________________________________________________________________________________________________________________________________________________________________________________________________________________________________________________________________________________________________________________________________________________________________________________________________________________________________
Copyright © 2017 Leena and Luna International, Chikusei, Japan.
7 | P a g e (株) リナアンドルナインターナショナル, 筑西市,日本
ISSN: 2186-8476, ISSN: 2186-8468 Print
www.ajsc. leena-luna.co.jp
The research steps include:
1. Stage of Preparation
The purpose of the preparatory phase of the study is to prepare and collect information in the
form of data needed to perform the analysis. These data include the active and reactive power
of each load bus, the impedance of the transmission line connecting each busbar, and a
diagram of one line of the 150kV Aceh power system.
2. Data Calculation Phase
The data calculation is done using softwareETAP 12.6.0 to get its power flow.
The analysis is done with two scenarios, the current condition and the inclusion of PLTA
Peusangan in 2018. In the first scenario, the load value used is the peak load in April of 2016.
While in the second scenario, the load value used is the peak load in 2018 because PLTA
Peusangan is planned to enter into the subsystem of Aceh in 2018. The results of the analysis
are to look at and compare the values of voltage, active power, reactive power, and network
losses of the two scenarios. Figure 4 shows the flowchart for the power flow calculation
process using ETAP 12.6.0 software.
RESULT AND ANALYSIS
Results of Active Power Flow Simulation and Reactive Power
From Figure 5 it can be seen that the highest active current flow prior to the addition of the
power plant is in the Lhokseumawe-Arun channel of 94.693 MW, and after the entry of the
new generation the highest active power flow is still on the Lhokseumawe-Arun channel of
105.897 MW.
Figure 5. Chart comparison of channel power
Figure 6. Graphic comparison of channel reactive power
From Figure 6 it can be seen that the highest reactive power flow prior to the addition of the
plant is found in the Lhokseumawe-Arun channel of 44.56 Mvar, and after the entry of the
new generation the highest reactive power flow is still on the Lhokseumawe-Arun channel of
51.734 Mvar.
Channel Power Loss Results
From Figure 7 it can be seen that the highest active loss before the addition of the plant is in
the Lhokseumawe-Arun channel of 999 kW, and after the entry of the new generation, the
highest active power losses are found in the Sigi-Banda Aceh channel of 1,309 kW.

Asian Journal of Natural & Applied Sciences Vol. 6(4) December 2017 __________________________________________________________________________________________________________________________________________________________________________________________________________________________________________________________________________________________________________________________________________________________________________________________________________________________________________________________________
ISSN: 2186-8476, ISSN: 2186-8468 Print
www.ajsc.leena-luna.co.jp
Leena and Luna International, Chkusei, Japan. Copyright © 2017
(株) リナアンドルナインターナショナル, 筑西市,日本 P a g e | 8
Figure 7. Graphic comparison of active power
loss of channel
Figure 8. Graphic comparison of reactive power
loss channels
From Figure 8 it can be seen that the highest reactive power losses prior to the addition of the
power plant are on the Nagan-Sigli channel of 5179 kvar, and after the entry of the new plant
the highest reactive power loss is still in the Nagan-Sigli channel of 4981kvar.
Voltage Results of each Substation
Figure 9. Graph of the substation comparison voltage
From the graph of the voltage ratio in figure 9 above, it can be seen down the entry of PLTA
Peusangan 1 and 2 into the next subsystem of Aceh 2018 not too able to repair the existing
substations voltage, this is due to subsystem load growth of 15% in 2018. One of the
substations that increased the voltage is the substation Bireun previously valued at 145.517
kv to 145.613 kv, this is because the location of the substation Bireun directly connected with
substations powerhouse PLTA Peusangan.
CONCLUSION
1. The addition of the 88 MW Peat Hydro Power Plant to the Aceh sub-system in 2018
will reduce the power supply from the Pangkalan Brandan slack bus by 40.8 MW to
33.4 MW.
2. Highest active power and reactive power after Peusangan hydropower entry occurred
on channel Lhokseumawe - Arun yitu for 105,897 MW and 51,734 Mvar.

Asian Journal of Natural & Applied Sciences Vol. 6(4) December 2017 __________________________________________________________________________________________________________________________________________________________________________________________________________________________________________________________________________________________________________________________________________________________________________________________________________________________________________________________________
Copyright © 2017 Leena and Luna International, Chikusei, Japan.
9 | P a g e (株) リナアンドルナインターナショナル, 筑西市,日本
ISSN: 2186-8476, ISSN: 2186-8468 Print
www.ajsc. leena-luna.co.jp
3. Loss - the greatest loss of power at the time prior to the entry of the Peusangan
hydroelectric power plant in the Aceh subdistrict of 2016 occurred in the
Lhokseumawe - Arun channel of 999 kW and 3,591 kvar and the greatest losses at the
time of entry of the Peusangan hydro power plant on the Aceh subsystem in 2018
occurred on the Sigli - Banda Aceh line of 1,309 kW and 4,705 kvar.
4. Substation of Banda Aceh became the main substation near the undervoltage limit on
the subsystem of Aceh 2018 with the value of the voltage is 137.14 kv or 91.43%.
REFERENCES
[1]. Al-Shaalan, Abdullah M. (2013). Technical and Economical Merits of Power Systems
Interconnection. Journal of Power and Energy Engineering, 1, 1-7.
[2]. Cekdin, C. (2007). Power System, Sample Problem and Solution Using Matlab. Andi
Yogyakarta, Yogyakarta.
[3]. Jamal, Agus and Syahputra, Ramadoni. (2014). Power Flow Control of Power Systems
Using UPFC Based on Adaptive Neuro Fuzzy. IPTEK, Journal of Proceeding Series, 1,
218-224.
[4]. Hutauruk, T. S. (1985). Power Transmission. Erlangga.
[5]. Marsudi, D. (2005). Power Generation. Erlangga, Jakarta.
[6]. Meier, Alexandra von, (2006). Electric Power Systems: A Conceptual Introduction.
John Wiley & Sons, Inc., Hoboken, New Jersey. Canada.
[7]. Power Systems Engineering Research Center (PSERC). (2007). The Electric Power
Industry and Climate Change: Power Systems Research Possibilities. Regents of
Arizona State University.
[8]. Saadat, H. (1999). Power system analysis. McGraw-Hill
[9]. Stevenson, W. D. (1975). Elements of power system analysis.
[10]. Wang, Xiao-Ping, Carlos J. Garc´ıa-Cervera, and Weinan. (2001). A Gauss–Seidel
Projection Method for Micromagnetics Simulations. Journal of Computational Physics,
171, 357–372.