hybrid active/passive jet engine noise … active/passive jet engine noise suppression system ......
TRANSCRIPT
NASA/CR--1999-208875
Hybrid Active/Passive Jet Engine Noise
Suppression System
NSL-RPT-98-002
C.A. Parente and N. Arcas
Northrop Grumman Corporation, Bethpage, New York
B.E. Walker and A.S. Hersh
Hersh Acoustical Engineering, Inc., Westlake Village, California
E.J. Rice
E.J. Rice Consulting, Westlake, Ohio
Prepared under Cooperative Agreement NCC3-379
National Aeronautics and
Space Administration
Lewis Research Center
February 1999
https://ntrs.nasa.gov/search.jsp?R=19990032037 2018-05-19T13:48:24+00:00Z

NASA Center for Aerospace Information7121 Standard Drive
Hanover, MD 21076
Price Code: A09
Available from
National Technical Information Service
5285 Port Royal Road
Springfield, VA 22100Price Code: A09
FOREWORD
This final report covers the work performed under a National Aeronautics andSpace Administration (NASA) Contract No. NCC3-379 for the period February 10, 1995through February 10, 1997. The work was accomplished by Advanced System &Technology (AS&T) of Northrop Grumman Corporation (NGC), Bethpage, New York, andits team members, Hersh Acoustical Engineering (HAE), Inc. of Westlake Village,California and E. J. Rice Consulting of Westlake, Ohio under the sponsorship of a NASAAerospace Industry Technology Program Cooperative Agreement.
The work was administered under the technical direction of Mr. Dennis Huff, NASALewis Research Center (LeRC) Contracting Officer Technical Representative. Mr.
Wayne Girard, LeRC, was the NASA Contract Adminstrator.Dr. B. E. Walker, VP of HAE was responsible for the design and fabrication of the
active control hardware/software components. He was also responsible for conductingthe active control ANC and ADP test programs at LeRC. Dr. E. J. Rice of E. J. RiceConsulting was responsible for the design of the passive liner. He was also responsiblefor conducting the passive ANC and ADP test programs. Mr. M. J. Peter and Mr. C.Weizenecker of NGC were responsible for the structural design and fabrication of thepassive components. Mr. C. Parente of NGC was the overall Program Managerresponsible for coordinating all the fabrication and test activities. The key personnelassociated with the program, and their areas of responsibility include:
• NorthropC. Parente ..............................N. Arcas ................................M. Peter ..................................C. Weizenecker .....................C. Auer ..................................J. Nardiello ............................W. Oelcher ............................R. Zambito .............................A. Madden ..............................J. Martorana ..........................
Grumman Corporation (Team Lead)Program ManagerAcoustic Analysis/TestStructural DesignMaterials & Process
Tooling DesignMetallic FormingLead Composite TechnicanCompo Technician/System InstallationComposite TechnicianComposite Technican
• Hersh Acoustical Engineering, Inc.Dr. Alan S. Hersh ..................Dr. B. Walker ...........................J. Celano .................................
M. Spencer .............................
Program Coordinator/System IntegrationActive/Software DesignHardware FabricationDSP Programmer
• E. J. Rice ConsultingE. J. Rice .................................. Passive Liner Design
• NASA Lewis Research CenterD. L. Huff ...................................
L. J. Heidelberg ......................D. Sutliff ..................................W. Grosser .............................L. Bartos .................................B. Fite ......................................D, Elliott ...................................S. Wnuk ..................................
AITP Technical RepresentativeANCF/ADP Research CoordinatorANCF Research CoordinatorADP Operations EngineerADP Operations EngineerADP Test CoordinatorADP Data AcquisitionANCF Operations Engineer


Section
1
2
3
4
CONTENTS
INTRODUCTION & SUMMARY
1.1 Introduction
1.1.1 AITP Program and Goals
1.1.2 Background
1.1.3 Proposed Concept
1.1.4 Organization of the Report
1.2 Summary
PASSIVE SEGMENTED LINERS
2.1 Overview of Passive Segmented Liner Concept
2.2 Rice Optimized Impedance Design Code
2.2.1 Eigenvalue Calculation for Attenuating Liner Sections
2.2.2 Segmented Circular Duct Sound Propagation Theory
THEORY AND DESIGN OF ACTIVE CONTROL SYSTEM
3.1 Eigenvalue Decomposition Hardware/Software
3.1.1 Cylindrical Modes
3.1.2 Rotor/Stator Tones - Spinning Waves
3.1.3 Stationary Components of Spinning Waves
3.1.4 Circumferential Mode Separation
3.1.5 Mode Aliasing
3.1.6 Radial Mode Separation3.1.7 Active Mode Excitation
3.2 Actuator/Noise Source Mode Interaction
3.3 Active Control Actuators and Active Resonators
3.4 Active Control Algorthms
3.4.1 Multi-Channel Filtered X Algorithm
3.4.2 Adaptive Quadrature Algorithm
Page1
1
1
2
CONCEPT VALIDATION IN NASA LeRC ANCF FAN TEST FACILITY
4.1 HAE No Flow Calibration Tests
4.1.1
4.1.2
4.1.3
4.1.4
4.1.5
4.2 ANCF
4.2.1
4.2.2
4.2.3
4.2.4
Test Apparatus
Microphone Array Tests
Uniform and Segmented Liner DesignsPassive Liner Insertion Loss Tests
Active and Active/Passive Hybrid Liner Insertion LossTests
Fan Test ProgramANCF Test Facility
Transducer Array Descriptions
Data Acquisition SystemApplied Active Control Alogorithms and Signal
Processing
3
4
7
7
9
9
11
13
13
13
13
14
14
15
15
16
16
17
18
18
18
21
22
22
23
23
27
27
28
2829
30
31
Section4.2.5
4.2.6
4.2.7
4.2.8
ANCF Acoustic Liner DesignANC Barrel Fabrication
Modal Measurement Results and Phase Translation
Initial Estimate of ANCF Passive SuppressorPerformance
Test Results
0 Additional Comments
5 CONCEPT VALIDATION IN NASA LeRC 9x15 LOW SPEED WINDTUNNEL FACILITY USING THE ADP FAN
5.1 ADP Test Facility
5.2 ADP Inlet Suppressor Design and Construction
5.2.1 Acoustic Liner Design5.2.2 Barrel Fabrication
5.3 Data Acquisition System
5.4 ADP Measurement Program5.5 Modal Phase Measurements and Translation With Position5.6 Test Results
5.6.1 In-Duct Measurements
5.6.2 Far-Field Radiation Considerations
6 COMMERCIALIZATION OF HYBRID LINER CONCEPT
6.1 Commercialization Plan Summary6.2 Commercial Product or Service
6.3 Market Assessment
6.4 Aircraft Certification Requirements
6.5 Environmental Requirements
6.6 Development Tasks
6.7 Development Schedule
6.8 Development Task Summary
7 ORGANIZATION DESCRIPTION & VENTURE MANAGEMENT
7.1 Financial Plan
8 REFERENCES
9 ILLUSTRATIONS
A APPENDIX A - REVIEW OF ACTIVE HELMHOL1-Z RESONATORCONCEPT
A.1 Basic Concept
A.2 Experimenta ! Validation of the Active Resonator ConceptA.2.1 Anechoic Termination Demonstration
A.2.2 Side-Branch Demonstration
Page32
33
34
36
36
39
43
43
44
44
45
46
49
51
51
51
53
55
55
56
57
59
59
60
61
59
63
64
65-66
69-142
143
143
144
144
146
iv
ILLUSTRATIONS
Fig.1.1
2.13.1a
3.1b
3.1C
3.2
3.3a, b
4.1
4.2a, b4.3
4.44.5
4.6
4.7
4.8
4.9
4.10
4.11
4.12a, b4.13
4.14
Simplified Diagrams of Engine Nacelle, ShowingDevelopment of the Adaptive Segmented Liner ConceptSchematic Model of the Axial Segmented LinerRadial Pressure Distributions of Modes (-9,0) and (-9,1) andLeast Favorable Combination for Interaction with WallMounted Passive Treatment
Radial Pressure Distributions of Modes (-9,0) and (-9,1) andMost Favorable Combination for Interaction with WallMounted Passive Treatment
Ratio of Wall Pressure to Space-Average Sound Pressurevs. Amplitude Ratio and Phase Difference Between Modes(-9,0) and (-9,1)
Active Resonator and Actuator Mounting Detail for Active
Segment of Adaptive Segmented Liner in ANCF Test Typical
of 32 Spaced 4.5 inches Axially and 22.5 ° Azimuthally
Amplitude and Phase Response and Deviations forActuators
Used in ANCF Adaptive Segmented Liner TestsSchematic Diagram of HAE 24-inch Duct for TestingPrototype Liners at Modes (1,0) and (1,1)HAE Spinning Mode Rig With Test Barrel InstalledTheoretical Sound Pressure Distributions of Radial Modesin HAE, ANCF and ADP Ducts
Optimum Impedance Determination for Uniform Liner HAE 2
Attenuation Sensitivity of Liner 2 of Two Segment Liner HAE3 Liner 1 Impedance Fixed at 0.076-i1.171
Attenuation Sensitivity of Liner I of Two Segment Liner HAE3 Liner 2 Impedance Fixed at 0.49-i0.34
Attenuation Spectra for Uniform and Two Segment Optimizedfor 1,050 Hz, D=24.125 inches, HAE No Flow Tests
Attenuation Spectra for Two Segment Liner HAE 3 ShowingEffect of Second Radial Mode Phase
Cutaway Diagram of Hybrid Liner Installation on NASA/LeRCANCF Fan
Hybrid Active/Passive Barrel Installed on the ANCF Rig atNASA LeRC
Rear View of ANCF Rig Located in the NASA LeRC AnechoicDome
Acoustic Actuator for the ANC and the ADP Test
Schematic Diagram of Active/Passive Segmented LinerMeasurements at NASA LeRC ANCF FacilityOptimum Impedance Determination for Uniform Liner ANC 1
Page
697O
71
72
73
74
75
7677
7879
8O81
82
83
84
85
868788
89
V
Fig=
4.15
4.16
4.17
4.18
4.19
4.20
4.21
4.22
4.23
4.24
4.25
4.26
4.274.28
4.29
4.304.31
4.32
ILLUSTRATIONS (Cont.) PageAttenuation Sensitivity of Liner 2 of Two Segment Liner ANC2 Liner 1 Impedance Fixed at 0.554-il.914 90Attenuation Sensitivity of Liner 1 of Two Segment Liner ANC2 Liner 2 Impedance Fixed at 0.788-i0.522 91
Measured Phase Difference Between the (4,1) and (4,0)Modes Inlet Rake Transducers at 33.94 Inches Ahead of
Rotor Tip Leading Edge 92
Measured Modal Coefficient Magnitude of the (4,0) and (4,1)Modes Inlet Rake Transducers at 33.94 Inches Ahead of
Rotor Tip Leading Edge 93Phase Difference Between the (4,1) and the (4,0) ModesEstimated at the Beginning of the Acoustic Liner 94Phase Difference Between the (4,1) and the (4,0) Modes atthe Inlet Lip Probe Location; Measured and Projected 95Calculated Attenuation of Inlet Acoustic Liners at 2BPF for All
Three Inlet Passive Acoustic Treatments, NASA ANC Fan
Stage 96Calculated Attenuation of Inlet Acoustic Liners at 2BPF for All
Three Inlet Passive Acoustic Treatments, NASA ANC Fan
Stage 97Calculated and Experimental Attenuation of Inlet TwoSegment Passive Acoustic Liner ANC 2 at 2BPF, NASA ANCFan, 16 Blades With 14 Rods 98
Calculated and Experimental Attenuation of Inlet TwoSegment Passive Acoustic Liner ANC 2 at 2BPF, NASA ANCFan, 16 Blades With 14 Rods 99
Measured Modal Coefficient Magnitude of the (4,0) and (4,1)Modes Inlet Rake Transducers Near Inlet Lip 100Measured Modal Acoustic Attenuation of the Three ANC 101
Liners at 2BPF NASA ANC Fan StageFar-Field Noise Directivity, Baseline and Two-Segment Liner 102Far-Field Noise Attenuation for the Two-Segment PassiveLiner NASA Lewis ANC Fan Stage, Tone at Twice Blade 103Passage FrequencyFar-Field Noise Attenuation for Hybrid Active/Passive LinerNASA Lewis ANC Fan Stage, Tone at Twice Blade PassageFrequency 104Far-Field Noise Directivity, Hardwall Baseline 105Ratios of Mode (4,1) to (4,0) Amplitudes in NASA/LeRCANCF Fan Inlet as Measured with NASA Rotating Rakeand HAE Flush Mounted Microphone Arrays 106
Differences of Mode (4,1) to (4,0) Phases in NASNLeRCANCF Fan Inlet as Measured with NASA Rotating Rakeand HAE Flush Mounted Microphone Arrays 106
vi
Fig.4.33
4.34a, b
4.35a b
4.36a, b
4.37a b
4.38a b
4.39a, b
4.40
4.41
4.42
4.43
4.44
4.45a
4.45b
5.1a
5.1b
5.1c
ILLUSTRATIONS (Cont.) PageComparison of ANCF Baseline Mode Structure of Two InletAxial Stations 107
Comparison of Duct Modes Generated by NGC/HAE ActiveLiner Segment Upstream and Downstream Actuators withPassive Segment Covered, Fan Stationary 108Comparison of Duct Modes in NASA/LeRC ANCF Fan InletNGC/HAE Adaptive Segmented Liner, Fan 1886 RPMControl Off vs. Control On 109Comparison of Duct Modes in NASA/LeRC ANCF Fan Inlet
NGC/HAE Adaptive Segmented Liner, Fan 1886 RPM"Modal" vs. Axial Station Error Microphone Arrays 110Comparison of Duct Modes in NASA/LeRC ANCF Fan InletNGC/HAE Adaptive Segmented Liner, Fan 1886 RPM
Mode (4,0) vs. Mode (4,1) Sensing Error Microphone Arrays 111NGC/HAE Adaptive Segmented Liner In-Duct PerformanceSummary With Passive Segment Covered in NASA/LeRCANCF Fan Inlet 112
NGC/HAE Adaptive Segmented Liner In-Duct PerformanceSummary Wrth Passive Segment Exposed in NASA/LeRCANCF Fan Inlet 113
Mode m=4, Insertion Loss Performances of AdaptiveSegmented Liner and Its Constituent Elements inNASA/LeRC ANCF 48" Fan Test Facility 114Far-Field Forward Directivity of NASA/LeRC ANCF Fan1886 RPM, Hardwall and NGC/HAE Adaptive SegmentedInlet Liner with Control Off and On 115
Far-Field Forward Directivity of NASA/LeRC ANCF Fan1850 RPM, Hardwall and NGC/HAE Adaptive SegmentedInlet Liner with Control Off and On 116
Far-Field Forward Directivity of NASA/LeRC ANCF Fan
1800 RPM, Hardwall and NGC/HAE Adaptive SegmentedInlet Liner with Control Off and On 117
Far-Field Forward Directivity of NASA/LeRC ANCF Fan
1750 RPM, Hardwall and NGC/HAE Adaptive SegmentedInlet Liner with Control Off and On 118
NASA/LeRC ANCF 48" Fan- Far-Field 0-60 Degree PowerAttenuation 119
NASA/LeRC ANCF 48" Fan- Far-Field 0-90 Degree PowerAttenuation 119
View of Hybrid Active/Passive ADP Inlet Mounted for Far-FieldTesting in the LeRC 9x15 Wind Tunnel 120ADP Barrel Shown With Acoustic Drivers Mounted Near the
Barrel Attachment Flange 121ADP Barrel Mounted on the ADP Engine Core Duct in theLeRC 9x15 Wind Tunnel for Testing 121
vii
Figw
5.2
5.3
5.4
5.5
5.6a
5.6b5.7a5.7b5.8
5.9
5.10a
5.10b
5.11a
5.11b
5.12a
5.12b
5.10a
5.10b
ILLUSTRATIONS (Cont.) PageAttenuation Contours for Uniform ADP 1 Acoustic Liner 2BPF
= 3255 Hz, 5425rpm, mode lobes m=9 122Attenuation Contours for Two Segment ADP 2 Liner 2BPF=3255 Hz, 5425 rpm, liner (2) nearest inlet lip is varied here, 123m=9
Attenuation Contours for Two Segment ADP 2 Liner 2BPF=5425rpm, liner (1) nearest rotor is varied here, m=9 124Drawing of the ADP Hybrid Active/Passive Barrel Attached tothe ADP Fan Rig 125Schematic Diagram of Dual Active Resonator ActuatorEmployed in ADP Adaptive Segmented Inlet Liner 126
Photograph of an ADP Driver 126ADP Actuator Free Field Sound Pressure Levels 127
ADP Actuator FreeField Phase Response 127Schematic Diagram of Active/Passive Segment LinerMeasurements in P&W ADP Fan 128
Rotating Rake Installed on the ADP Barrel in the NASA LeRC9x15 Wind Tunnel 129Circumferential and Radial Mode Sound Powers Produced
by NGC/HAE Adaptive Segmented Liner in ADP Fan Inlet with 130Passive Segment CoveredSum of Radial Mode Relative Sound Powers in
Circumferential Modes Produced by NGC/HAE AdaptiveSegmented Liner in ADP Fan Inlet with Passive SegmentCovered 131Circumferential and Radial Mode Relative Sound Powers inADP Fan Inlet with Hardwall Baseline 132
Sum of Radial Mode Relative Sound Powers inCircumferential Modes in ADP Fan Inlet with HardwallBaseline 133Circumferential and Radial Mode Relative Sound Powers in
ADP Fan Inlet with NGC/HAE Adaptive Segmented Liner,Control Off 134Sum of Radial Mode Relative Sound Powers inCircumferential Modes in ADP Fan Inlet with NGC/HAE
Adaptive Segmented Liner, Control Off 135Circumferential and Radial Mode Relative Sound Powers in
ADP Fan Inlet with NGC/HAE Adaptive Segmented Liner,Control On 136Sum of Radial Mode Relative Sound Powers inCircumferential Modes in ADP Fan Inlet with NGC/HAE
Adaptive Segmented Liner, Control On 137
viii
Fig.5.11
5.15
5.16
5.17
5.18
A1
A2
A3
A4
A5
ILLUSTRATIONS (Cont.) PageCircumferential Mode m = -9 Sound Power Reduction byUniform Passive, Segmented Passive, Adaptive Segmented(Control Off) and Adaptive Segmented (Control On) Liners inP&W 22 Inch ADP Fan in NASNLeRC 9 x 15 Wind Tunnel at
Mach 0.1 in the Design (Approach) Speed Range 138Calculated and Experimental Attenuation of Inlet UniformPassive Acoustic Liner NSL960001 at 2BPF 139
Calculated and Experimental Attenuation of m=-9 ModesOnly Segmented Passive Liner 140Calculated and Experimental Attenuation of m=-9 ModesOnly Hybrid Active/Passive Liner 141Tone Protrusion Above Background ADP Hardwall Inlet Far-Field 9x15 Wind Tunnel Tests, Aft Barrier in Place 142Control Volume Used in Model Derivation of Active Control
Helmholtz Resonator Concept 149Schematic Diagram of Active Control Resonator CalibrationEquipment 150Absorption Coefficient Performance Improvement AchievedWith Active Control Resonator 151Schematic of Active Resonator Side-Branch Attenuation Test
Set-up 152Transmission Loss Performance Improvement AchievedWith Side Branch Active Control Resonator 153
ix

TABLES
NO.
2.14.1
4.2
4.3
4.4
4.5
4.6
4.7
5.1
5.2
6.1a
6.1b
6.1c
6.2
6.3
6.4
7.1
Effect of Wall Boundary Condition on Mode Propagation Angle
Summary of HAE/ANCF Experimental Program Test Matrix
NASA/AITP Demonstration Summary
Summary of Mode Generation and Separation Using Inner/Outer
Array Synthesizer and Axially Spaced Wall Microphones
HAE Barrel Acoustic Impedance Data
Summary of Active/Passive Treatment Measurements in HAE
Duct Facility
Parameters of the NASA ANCF Fan Test Rig FacilityANC Test Barrel Acoustic Impedance Data
ADP Barrel Acoustic Impedance Values
Summary of Experimental ADP Program Test MatrixTotal Aircraft in Service
New Aircraft To Be Manufactured
Aircraft Forecast
New Aircraft Sales Forecast
Hybrid Suppressor Estimated Development Schedule
Hybrid Active/Passive Development TasksCommercialization Cost Estimate
Page8
21
21
23
26
28
29
34
46
49
57
58
58
58
61
62
63
xi


1 - INTRODUCTION
1.1 INTRODUCTION
1.1.1 AITP Program and Goals
The Aerospace Industry Technology Program (AITP) was established bythe National Aeronautics and Space Administration (NASA) to promote industryresearch and development ideas and efforts that would focus on dual-purposeaerospace technologies and concepts that have a potential for commercial
application. The goal of the AITP program is to "strengthen US industry byadvancing high-payoff aerospace technologies defined by industry that will leadto important commercial products and applications in U. S. industries and maysignificantly support future NASA missions". Grumman Aerospace Corporation(GAC), a subsidiary of the Northrop Grumman Corporation (NGC), as theproject lead and its team members, E. J. Rice Consulting (EJR) and HershAcoustical Engineering, Inc. (HAE) proposed an innovative program for the
development and demonstration of a hybrid active/passive acoustic technologyfor commercial jet aircraft nacelles. The project titled "Adaptive and ImprovedPassive Acoustic Suppression of Aircraft Engines" was a two year cost shareprogram that encompassed the investigation of two mutually synergistictechnologies of active and passive suppression of turbofan engine noise andwas awarded NASA Cooperative Agreement No. NCC3-379. The team coupledthe engine liner design and manufacturing expertise of NGC with a teamcapable of producing the technology for developing the next generation ofengine noise suppressors. The end objective was to apply this new innovativetechnology to achieve the goals, set by NASA, to reduce commercial aircraftnoise by the turn of the century. The goals of this program are:
(1) Developing the analytical, manufacturing, and numerical tools todesign efficient sound absorbing axially segmented liners,
(2) Validating the hybrid active/passive concept by measuring theperformance of candidate axially-segmented liners in laboratory testsat HAE, the Active Noise Control Fan (ANCF) Facility at LewisResearch Center (LeRC) and the ADP fan rig in the NASA LeRC 9' x15' Wind Tunnel.
1.1.2 BackgroundThe proposed advanced liner nacelle concept was motivated by the
excessive and annoying noise to which communities located adjacent tocommercial airports are often exposed, from aircraft landing, takeoff and fly-
over maneuvers. Recognizing this, NASA has proposed a goal of increasin_l0 -=the efficiency of liner nacelle duct treatment by 25 Yorelative to 1992 technology
by the year 2000. It is generally recognized in the aircraft industry that it will bedifficult to achieve this using conventional passive liner design technology.
Despite many years of intensive research, jet engine noise remains asone of the major pollution problems facing communities located near militaryand civilian airports. This is not surprising because the suppression of jet
engine noise is inherently complex, involving the interaction between differentphysical phenomena such as: (1) radial and spinning modes with three-
dimensional flows containing transverse velocity and (in the engine exhaust)thermal gradients which refract the sound, (2) subsonic and supersonicaccelerating mean flows, (3) combustion noise and (4) resonance's andnatural or forced hydrodynamic and acoustic instabilities. As a consequence of
the complexity of these mechanisms and their (nonlinear) interactions, very few"practical" guidelines have evolved to allow the engine designer to predict, let
alone control, jet engine noise inlet and exhaust noise in a given design.The control of jet engine noise is often confronted empirically in the
hardware test and development phase by installing arrays of passive sound
absorbing liners consisting of fine wire-mesh screens bonded to cavity-backedperforates (i.e., Helmholtz resonators). The need to improve aircraftperformance and efficiency while decreasing community noise taxes the
acoustic suppression capability of the sound absorbing treatment that line theducts of turbofan engines. New ultra-high-bypass engines with shorter inletand exhaust ducts have even less room for acoustic treatment. Thus, moreeffective treatment is required than is currently available. Much of the treatmentused currently has a very limited frequency range over which it is effective; thusmultiple areas of treatment are required to address noise in extended
frequency ranges. If the treatment could be effective for several or all frequencycomponents simultaneously, then all of the treatment area would be availablefor each component.
1.1.3 Proposed Concept
The objective of this research program is to assess the potential andpracticality of developing the hybrid active-passive sound absorbing linerconcept as a scheme to efficiently attenuate excessive turbofan engine noise.The scheme is based upon the idea of combining the recently developed activenoise control Helmholtz resonator concept 2 with the multi-segmented passiveliner concept originally developed in the 1970's 39 to create a hybrid active-passive sound-absorbing segmented liner system.
The sound absorbing hybrid active-passive liner concept is illustrated in
Figure 1.1 for an aircraft inlet. The sound field is represented by a vectornormal to the wave-front. For this example the initial sound field radiating fromthe fan is shown propagating at a very small angle to the duct axis. This sound
field represents a nearly plane-wave or for a spinning mode a high mode cut-off ratio sound field. As a simplification, the wave does not experience manyencounters with the acoustically treated walls and is not highly attenuated in ashort duct. Rice 1° has shown that modification of the boundary conditions at
the duct wall can alter the propagation angle for a duct mode and that thispropagation angle is intimately related to mode cut-off ratio, attenuation in theduct liner, and the far-field radiation angle 11-_3. In the first configuration of Figure
1.1, the uniform acoustic liner configuration, the nearly axial propagating soundfield is shown entering the suppressor. The uniform liner can be optimized forthis sound field by the proper choice of honeycomb resonator backing depth
2
and face sheet resistance properties. Some reasonable sound attenuation
might be obtained for this uniform dissipative liner. An improved acoustic linerconfiguration is illustrated by the second configuration in Figure 1.1, the two-segment liner configuration. The properties of the initial segment are selectedto increase the effective angle of propagation of the sound entering the seconddissipative liner section. The properly designed two-segment liner can provideimproved attenuation over the uniform liner of the same total length. Howeveras discussed in Section 2, this tuned system may provide improved
performance only over a narrow range of engine speed around the designpoint. To overcome this limitation, this initial mode conditioning segment canbe replaced by an active driver system configuration as shown in Figure 1.1.This is the advanced hybrid liner concept developed and validated in this
research program. The active-passive hybrid suppressor system .allows theinitial mode conditioning section to adapt to compensate for the v_irying inputsound conditions. The output sound signal is monitored and used in a controlsystem to obtain the desired overall suppression results. In addition to
substituting for the initial passive system, the active system can provideadditional benefits. Some modal cancellation and reflection may be occurringas well as some dissipation in the active resonator cavities.
The hybrid noise reduction method uses active control techniques not to
reflect, cancel or absorb noise, but, instead, to scatter or redistribute energyamong modes to maximize the effectiveness of the passive sound absorbingelement. Less acoustic energy is needed for input into the engine duct relative
to conventional active control schemes because the acoustic energy is onlyredirecting the sound field, not dynamically interacting with it to cancel or
absorb it. In addition, the precision required for matching the amplitude andphase, and the problems inherent with complicated higher-order spinning andradial modes, is reduced. The new concept replaces the passive modescattering segment with arrays of active control Helmholtz resonators to
achieve efficient sound absorption over wide RPM bandwidths! As such, thehardware and software demands will be significantly reduced.
1.1.4 Organization of the Report
The report is organized as follows. Following this Introduction, Sections
2 and 3 describe respectively the theory and design of the passive segmentedliner and the corresponding theory and design of the active control system.This is followed in Sections 4 and 5 with summaries of the two experimentalprograms designed to validate the hybrid liner concept. Section 4 describesthe research program conducted in the NASA Lewis Research Center ANCF
test facility and Section 5 describes the research program conducted in theNASA Lewis Research Center 9'x 15' Wind Tunnel Facility. Section 6discusses the commercialization of the hybrid liner concept. Section 7
describes the proposed commercialization organization. The report closeswith a detailed explanation of the active control Helmholtz resonator concept, anintegral component of the active control system, in Appendix A.
1.2 SUMMARYIn the suppression of noise from turbofan engines, the need to provide
attenuation of tones generated by rotor wake/stator vane interactioncompromises the basic configuration of the engine and affects the design ofbroadband sound absorbing liners. A novel adaptive segmented liner concepthas been developed that employs active control elements to modify the in-ductsound field to enhance the tone-suppressing performance of passive linerelements. This could potentially allow engine designs that inherently producemore tone noise but less broadband noise, or could allow passive liner
designs to more optimally address high frequency broadband noise.A proof-of-concept validation program was undertaken, consisting of the
development of an adaptive segmented liner that would maximize attenuationof two radial modes in a circular or annular duct. The liner consisted of a
leading active segment with dual annuli of axially spaced activeHelmholtzresonators, followed by an optimized passive liner and then an array of sensingmicrophones. A control algorithm minimized acoustic signals at the sensingmicrophone array by adjusting the excitation of the active resonators. Theactive resonators included electro-acoustical actuators designed to satisfyspecific requirements of resonator excitation in each phase of thedevelopment.
Three successively complex versions of the adaptive liner wereconstructed and their performances tested relative to the performance ofoptimized uniform passive and segmented passive liners. These began withstatic tests in a 24-inch diameter duct excited electro-acoustically with modes
(1,0) and (1,1) at a single frequency (1050 Hz). This test demonstratedattenuation well in excess of 40 dB and clear superiority of the adaptivesegmented liner over the all-passive liners.
The second test series was conducted in the NASA/LeRC 48-inch
diameter Active Noise Control Facility (ANCF) facility, using inlet spoiler rods to
generate intense twice blade passage frequency (2-BPF) tones with modes(4,0) and (4,1). Comprehensive tests were conducted over an extended fanspeed range 1550 - 1886 RPM, corresponding to a 2BPF frequency of 827 -1006 Hz. The adaptive segmented liner provided attenuation up to 35 dB andwas superior to the all-passive liners with the exception that at the optimizeddesign speed, the segmented passive liner provided equal attenuation. The
salient result of the test series was that the attenuation provided by theadaptive segmented liner exceeded by several dB the sum of the active andpassive segments measured separately, demonstrating a synergism thatenhances overall liner performance.
The final test was conducted using the Pratt & Whitney 22-inchAdvanced Ducted Propulsor (ADP) fan in the NASNLeRC 9x15 wind tunnel.The liner was designed to operate at 5450 RPM (approach speed), addressing
modes (-9,0) and (-9,1) at 2-BPF. Insertion loss tests were conducted over afan speed range of 5250 - 8450 RPM, corresponding to frequencies 3150 -5070 Hz at 2-BPF. The adaptive segmented liner provided up to 19 dBattenuation and outperformed the passive liners over the speed range 5250 -
4
6225 RPM. At speeds over 6000 RPM the adaptive segmented liner also
controlled a third radial mode (-9,2). The salient results of the tests were: The
adaptive segmented liner performed well in a high flow speed model fan inlet
environment, was successfully scaled to a high sound frequency and
successfully attenuated three radial modes using sensor and active resonator
arrays that were designed for a two mode, lower frequency environment.

6
2 - PASSIVE SEGMENTED LINERS
This section presents a brief overview of the passive segmented liner
design concept that was investigated extensively in the 1970's by industry and
NASA. It also describes an optimized impedance liner code recently developed
by Dr. E. J. Rice that was used to design the segmented passive liner
component of the hybrid liner system.
2.1 OVERVIEW OF PASSIVE SEGMENTED LINER CONCEPT
Ducts with multi-segmented acoustic treatment (often called phasedtreatment) have been extensively studied in the past. Sawdy et al. 3'4, Patterson
et al. s Lester and Posey 6'7, Clark 8 and Baumeister 9, investigated semi-infinite
rectangular ducts with two dimensional sound fields. Cases with no flow and
steady flow in the exhaust duct mode were considered. References 3-5 also
included experimental programs to verify the theory. The sound was-introduced
into the flow duct through an exponential horn in an effort to provide plane wave
excitation to the uniform and multi-segmented acoustic liners. Reasonable
agreement with theory was obtained in most cases. Where agreement was
not good, iterative adjustments in the initial modal structure and the wall
impedance provided results in good agreement with the experiments. The
adjustments were judged to be within the expected error of the experiment.Lester and Posey 6'_ investigated circular ducts with multi-sectioned
acoustic liners with no steady flow in the duct. Most of the studies were
conducted with acoustic inputs of a plane wave or of a point source on the ductaxis. Both of course produce axisymmetric excitation. However, one very
important additional case was studied using the calculated modal output froma high speed twelve inch fan using a computer code developed by Clark et al. 8.
To our knowledge, this is the only investigation in which an attempt was made
to simulate an acoustic input to the uniform and segmented acoustic liners
which resemble that of the spinning modes produced by the rotor wake-stator
interaction of a fan stage.
All of the above studies showed large potential increases in acoustic
attenuation for the segmented ducts over that of a uniform acoustic liner for an
intermediate frequency or wavelength range. For the two dimensional
rectangular ducts the best potential was at a frequency such that the duct
height/sound wavelength was about 1.5. For the round duct, the ductdiameter/sound wavelength was about 1.3. For the simulated fan stage
modes, a reasonable increase in attenuation for the two and three segment
liners (three better than two) over that of the uniform liner occurred even thoughthe fan tone frequency was well out of the optimum range. 6'7
The above studies also provided conclusions regarding why the
segmented acoustic treatment worked well. The optimum initial section
always tended toward a purely reactive impedance with very low resistance and
thus very little dissipation of sound energy. The conclusion was thus that the
first section set up the sound modes for later sections to attenuate. It
accomplished this by scattering the sound into radial modes combinations that
damp faster in the resistive sections. This is certainly part of the answer, but
as mentioned above, the boundary condition can have a substantial effect onthe angle of propagation of each individual mode, which can provide increased
attenuation in later sections due to increased angles of propagation relative tothe duct axis. The following table provides an example of these propagationangle changes.
Table 2.1 Effect of Wall Boundary Condition on Mode Propagation Angle
Duct Mode Angle in Hard Wall Duo1 Angle in Soft Wall Duct
Four lobe, first radial 28.1 ° 43.3 °
57.0 °Four lobe, secondradial
88.6 °
The calculations are for the first and second radial modes of the four
lobed sound pressure pattern in a round duct. All eigenvalues are real sincethe wall impedance for the hard duct is infinite and for the soft duct it is zero(pressure release boundary). Notice that the conclusion that increasedattenuation, due to scattering into the higher radial modes, is reasonable sinceeven within the hard duct the angle of propagation for the second radial is
substantially larger than that of the first radial (57.0 ° vs. 28.1°), which would
result in higher attenuation within the resistive section. Also observe that foreach individual mode the angle of propagation is increased resulting inincreased attenuation in the resistive section. The combined effect of the
modal scattering to higher modes and the increased angle of propagation ofeach individual mode probably provides the increased attenuation of thesegmented liners.
To our knowledge, the last publication on segmented liners wasprovided by Baumeister ° in November 1979. He conducted a statistical study inwhich he introduced substantial variations in the input sound modal structureand the wall impedance of the segmented acoustic liners. The loss inperformance of the liners due to these variations and the lack of substantialbandwidth improvement over uniform liners led Baumeister to conclude that
the segmented liners were not worth pursuing in spite of the large potentialincreases in the attenuation for properly designed and tuned liners. About thissame time the emphasis in noise reduction research shifted to the advanced
turboprop with the emphasis on cabin noise. The turboprop has nosurrounding shroud and interest in duct acoustics, uniform or segmented,waned and was discouraged.
We believe that no further progress has been made regardingsegmented liners for turbofan ducts. The problem of turbofan community noisehas again returned with the proposed ultra-high by-pass turbofan. This
configuration presents an increased challenge due to the short ducts (relativeto the diameter) which makes it very difficult to provide the required fan noiseattenuation with conventional acoustic treatment. The large diameter and
structurally restricted blade number has however brought the duct diameter tosound wavelength ratio closer to the optimum for segmented treatment. Inaddition, better control of manufacturing tolerances on acoustic treatment canovercome some of the acoustic performance degradation calculated byBaumeister 14. If additional impedance control is required, the recently
developed active resonator concept can be used to provide precise tuning andrequired tracking of the acoustic impedance as duct conditions change. Alsothe segmented liner concept has not really been optimized for the spinningmodes that might be expected from modern high by-pass turbofan engines.
2.2 RICE OPTIMIZED IMPEDANCE DESIGN CODE
The passive segmented duct acoustic suppressor theory is importanthere because it is used to design the passive portion of the active-passive
hybrid suppressor. During this early stage in the development of the active-passive hybrid suppressor the active section is viewed as replacing the firstsection of the passive segmented acoustic liner. The first section of the
segmented liner is considered as a set-up section that conditions the acousticinput to the passive attenuating section to provide the optimum results asdefined by the goal of the suppressor design. This goal may be maximumacoustic power attenuation, as used in this concept verification study, oroptimum radiation directivity reduction as might be desired to achievemaximum EPNL reduction. The passive segmented acoustic liner theory issummarized here with the details left to the references. The schematic
drawing of the two segment circular duct shown in Figure 2.1 will be used inthe following discussion.
2.2.1 Eigenvalue Calculation for the Attenuating Liner SectionsAt the heart of any acoustic propagation code for soft wall ducts is the
eigenvalue search routine which provides the eigenvalues or characteristicnumbers for each of the duct modes. The eigenvalues are complex numbersfor these modes in the soft wall duct sections 15 as represented by Liner 1 and
Liner 2 in Figure 2.1. Extensive effort was invested in developing an eigenvaluesearch routine that provides reliable results upon which the rest of the codes
depend. If an eigenvalue is missed, the modal system is not complete and thepressure and axial velocity matching across the liner interface will not becorrect. Omitting an eigenvalue will cause irregularities of contour plots ofattenuation in the impedance plane, which have usually been interpreted aslocal minima or maxima in papers in the literature. If a double value isinadvertently returned (iteration to the same value from different starting values)the matrix determinant will be zero and the solution will "blow up." Iteration is
required since the equations can not be solved explicitly for the eigenvaluesgiven the wall impedance. The wall impedance can be solved explicitly giventhe eigenvalue. For the no-flow code, a very careful assessment of the wallimpedance relative to each mode optimum impedance was made to determinethe proper iteration strategy. In some regions of the impedance plane relative
9
to a particular mode optimum, only one mode should be pursued and a properstarting value for the iteration is provided. In another impedance region, twosoftwall modes should be pursued which have nearly the same eigenvalue
amplitude but different phases. In another region two modes must be pursuedwhich have similar phases but different amplitudes. These wall impedanceregions are always relative to the optimum impedance of the particular mode
under consideration. The efficient calculation procedure is to have a correlatingequation for the optimum eigenvalues from which the optimum impedance can
then be immediately calculated to start the iteration for arbitrary wallimpedance. This correlation was available for the inlet with no-flow and wasused to provide a very efficient calculation procedure.
Another eigenvalue problem had to be considered, that reported byZorumski and Mason 16. It is well known that at the optimum impedance foreach mode, two modal solutions collapse into one. They have Shown thatthese two functions orthogonal to each other merge into the single solution thatis orthogonal to itself. This means that the properly weighted Bessel functionsquared integral, which is essential in the modal coefficient determination (inthe denominator) is equal to zero. Zorumski and Mason have shown that analternate solution exists with a linear modification to the Bessel function. This
concept was checked out by evaluating the Bessel function integrals near theoptimum impedance. They are certainly correct; the integral goes to zero as theoptimum is approached. However, the impedance must be very close to theoptimum for the integral to be very small. Thus rather than going to thealternate solution at the optimum, if the optimum should be inadvertently hit thewall impedance is changed slightly to avoid the problem and still provide twodistinct modal solutions which are sufficiently different to allow the calculationsto proceed.
The eigenvalue search code for no-flow was tested and found to be veryrobust. Double value problems were essentially eliminated. The routine worksto very high lobe number or Bessel function order, perhaps to m = 70 beyondwhere we would use it. A double precision complex version has also beenwritten to be consistent with the needs in the matrix inversion process.
For the case of flow in the duct, the eigenvalue calculation isconsiderably more complex. To properly simulate an aircraft inlet a wallboundary layer must also be considered. As in the no-flow case the wallimpedance under consideration is compared to the optimum wall impedancefor each mode to determine starting values for the iteration procedure. Toaccomplish this a new correlation of the optimum wall impedance for anarbitrary mode had to be developed. Four correlations were needed for theamplitude and phase for the two wave directions. The two wave directions are
required since upstream and downstream waves behave differently when flowand boundary layers are present and both directions must be considered when
reflections are considered. Several thousand optimum impedancecalculations were performed and stored to provide data for the requiredcorrelations. The parameter space includes Mach number M = 0 to +/-0.6,
frequency parameter TI= fD/c = 1 to 20, boundary layer displacement thickness
10
to effective wavelength ratio d*/[_,(1 + M)] = 0 to 2.5, and boundary layer
displacement thickness to duct radius ratio d*/rD = 0 to 0.2. Some definitions
are: frequency f, duct diameter D, speed of sound c, boundary layer
displacement thickness d* and sound wavelength X. The optimum
eigenvalues had to be further refined with an additional iteration to ensure
proper convergence for wall impedances that might lie near any mode
optimum.
2.2.2 Segmented Circular Duct Sound Propagation Theory
The initial computer code was written to solve the acoustic wave
equation in a circular duct with no steady flow. The procedure followed that ofZorumski 17 which considers multiple radial mode input to a multiple
segmented soft-wall duct as pictured in Figure 2.1. The multi-segmented duct
has up to three finite length soft-wall sections with infinite length hard-wall
sections as input and output sections. Up to ten radial modes, for anycircumferential lobe number mode, can be input in the first hard-wall section.
Up to ten radial modes (same number as chosen for the input section) are
carried throughout the remaining sections. In the hard-wall sections, the
eigenvalues for the modes are just the zero-slope solutions for the Bessel
function. In the soft-wall sections, the eigenvalues are complex as determined
by the complex wall impedance equation for each section. The number of ductsections and radial modes can of course be increased if desired, but the
numbers chosen here should be sufficient for the present purposes. At each
duct interface (hard to soft, soft to soft, soft to hard) continuity of acoustic
pressure and axial acoustic velocity are required. This provides sufficient
equations to solve for reflected modes in the input hard section, transmittedand reflected modes in all of the intermediate soft-wall sections, and for
transmitted output waves in the final hard-wall section. The number of
equations and unknown modal coefficients is equal to twice the number ofmodes times the number of liner interfaces. Thus if ten radial modes are used
with two acoustic liners (three interfaces) a 60 by 60 matrix must be inverted to
solve for the sixty unknown modal coefficients. Axial acoustic power iscalculated on each side of each interface to insure continuity of power across
the interface. As mentioned in the previous section, extreme care was
exercised in the development of the soft-wall eigenvalue solution programs,which are the heart of the acoustic codes. Iterative procedures are required to
solve for these complex eigenvalues. Care must be taken to develop routines
that do not produce duplicate eigenvalues which will cause the blow-up of thematrix inversion subroutine, or to miss an eigenvalue which can give a falseindication of a local maximum or minimum in the attenuation contours. In spite
of this attention to precision, occasionally an eigenvalue is missed. For the
results to be shown in this report, the contours are smooth with only one
maximum indicated showing that the eigenvalue search routine was
successfully negotiated over the impedance range shown.
11
With the addition of duct flow and the wall boundary layer, the proceduredeveloped by Rice TM was used. Outside of the boundary layer a uniform flow
region is used. The solutions in the uniform flow region are the standard
Bessel functions. From the interface of the uniform flow region and theboundary layer outer edge, to the acoustic liner wall surface a Runge-Kuttaintegration is performed using one hundred steps to complete the solution ofthe wave equation. Within the boundary layer a linear profile is assumed nearthe wall and this merges into a 1/Tth-power velocity profile away from the wall.The acoustic intensity equation of Goldstein 19 was used to calculate theacoustic power for the hardwall input modes, output modes, and for the
softwall modes on the acoustic liner side of each interface (see Figure 2.1).During the check-out phase of the computer code, acoustic power wasobserved to match across each interface which indicated that the acousticpressure and axial velocity were properly matched across each interface.
12
3 - THEORY AND DESIGN OF ACTIVE CONTROL SYSTEM
This section describes the theoretical basis for the design of the active
control system, which consists of the following components: (1) eigenmode
identification and decomposition hardware/software, (2) mode scattering activecontrol Helmholtz resonator hardware/software and (3) controller
hardware/software. Adiscussion of the active helmholtz resonator concept is
provided in the Appendix.
3.1 EIGENMODE DECOMPOSITION HARDWARE/SOFTWARE
3.1.1 Cylindrical modes
The pressure field of sound propagating in cylindrical or annular ducts
can be represented as a superposition of eigenmodes in the form
m =-"_ n:=0
where Jm and Ym are Bessel functions of the first and second kind and the axial
wavenumber kzmn is
_ _M _ 4k2 _ _ _ M 2 _
k _c ° (2)k..,. = 1- M 2 '; =-
where M is the flow mach number and with the + sign referring to downstream
propagation and -sign to stream propagation. The eigenvalues _n and
coefficients _mn satisfy the boundary conditions at the duct walls [in a circular
duct, [3rnn = 0]. The index m is the circumferential mode order (number of lobes)
while the index n is the radial mode order (number of nodal radii). For
purposes of illustration and comparison, the radial distributions for the various
circular and annular duct geometry's in this study are presented in Figure 4.3 ofSection 4.
Modes with positive values of m are considered "spinning" in thedirection of fan rotation and vice versa. Modes with complex values of kzmn are
considered to be cut off, which occurs for frequencies lower than
(fco).,. = c°°_m" '_ -M2 (3)2_
3.1.2 Rotor/Stator Tones - Spinning Waves
Tyler and Soffrin 2° demonstrated that an axial flow fan with B rotor blades
and V stator vanes radiates periodic sound structured as duct modes at blade
passage harmonic h with circumferential indices mq determined from
mq = hB - qV; q = any integer (4)
13
For example, a fan with 16 blades and 14 vanes will radiate mode mq =.., -12, 2, 16, .oetc. at BPF, mq = .... -10, 4, 18, .. etc, at 2BPF and so forth. The
mixture of radial mode orders n for each of the circumferential modes dependson the details of the sound generation process. Only modes with cut-off
frequencies foo below the appropriate blade passage harmonic frequencyhBDI2_ (_ = 2_RPM/60) will actually radiate acoustic power.
3.1.3 Stationary Components of Spinning Waves
In typical fan designs, the radiated field at each blade passage harmonicis often dominated by sound in a single m order with multiple radial orders.
The single m order defines a spinning wave in which only the phase isdependent upon the azimuthal angle in the duct:
P=. (_,O,z,t)= P..(r,z,t)e "e (5)
For resolving mode m orders using simple arrays of stationarymicrophones, it is useful to employ the identity:
e 'me= cos(m0)+ i sin(rn0) (6)
and to note that multiplication by i is equivalent to introducing a phase shift of
90 °. This provides two stationary wave components of the mth order spinning
wave, which can then be resolved with stationary microphone arrays using real-valued processor weightings.
3.1.4 Circumferential Mode Separation
In a complex sound field in which advance knowledge of the modecontent is available, active control approaches that address the modes arepreferred to a more general approach because fewer control channels arerequired. This is the situation in a turbofan engine environment, where themode structure of rotor/stator noise is dictated by the axisymmetric elements of
the sound source. Aside from the controller itself, transducer arrays arerequired to activate the active Helmholtz resonators and to sample the resultantsound field to provide the appropriate system error signals.
For control addressing a particular m order mode set (possibly withmultiple radial orders), it is desired to provide error microphones that separatethe addressed m order from others that may be present and also from random
noise due to flow and fan broadband radiation. For an array of N azimuthallyequally spaced microphones at a given axial position, orthogonality makes itpossible to use simple weighting and summing networksstationary wave mode components:
N N
P,..co,=_Pj(O)cos(j'O) P,,,..,,,=_Pj(O)sin(/'O)j=l j=l
to isolate the
(7)
where Pj is the sound pressure at the./_ microphone in the annular array. An
especially convenient approach is N = 4m, in which case the weighting factorsare all +1, 0 or -1.
While signals from the addressed modes add coherently in theweighted summing networks, non-addressed modes (see subsequent
14
discussions on mode aliasing) are rejected by orthogonality. Flow noise adds
incoherently so that a signal to noise ratio (SNR) improvement of 10 log(N/2) is
achieved on each of the two stationary mode outputs. Note that if N = 2m (the
Nyquist number) only the cosine component may be resolved, but that the
signal to noise improvement is 10 log(N). If the circumferential mode order is
well known, then N = 2m is viable.
3.1.5 Mode Aliasing
When sampling a sound field with an annular array of N equally spaced
microphones and using summations with real weightings to isolate the sine
and cosine stationary wave components of arbitrary circumferential mode m,
the following series of modes will be measured:
+ rn + qN; q = any integer (8)
For example, for target mode m = 4 and N = 16, modes m = -28,-20,-12, -4, 4,
12, 20, 28 etc. would all be sensed equally by the array. Using complex
weights on the microphones or equivalently by combining the sine and cosine
components
Pm= Pro.cos+ imm,sin (9)
eliminates the +m ambiguity so that the mode aliasing series becomes
m+qN; q = any integer - (10)
or for the prior example, modes m = -28, -12, 4, 20 etc. are sensed equally
while all others are rejected due to mode orthogonality.
3.1.6 Radial Mode SeparationIn a hard wall circular or annular duct, multiple radial order modes for a
given circumferential order may be isolated using weighted combinations of
radially spaced microphones. However, the circumferential mode separationmust be done first, and this implies a very large microphone array within the
duct or else a rotating rake system as is employed by NASA. For application in
a real environment, it is necessary to employ an axially/circumferentially spaced
microphone array, flush mounted in the duct wall(s). The circumferential
elements of the array may be used to separate mode m orders as discussedabove. The axial distribution in each m order can then be analyzed one-
dimensionally to separate the n or radial orders based on their axial wave
number kzmn. The number of axially spaced microphone annuli required toisolate the radial modes is equal to the number of incident modes plus the
number of reflected modes. The separation process is then a simultaneous
linear equation solution
Pmj : _ (e'&''''z' + Rm, e'k-,'"z' )Pr,, (11)n
where PrnjiS the (measured) sound pressure in circumferential mode m at axial
station z/ and Prn,, and RmnPmn are the incident and reflected radial modecomponent amplitudes to be determined.
15
In the proof-of-performance tests, two radial modes were addressed at asingle m order. With very weak reflections expected in the 48" ANCF or 22" ADPinlet duct/bell-mouth, two axially spaced microphone arrays would be requiredto resolve the two radial modes. To allow for reflection of the less cut-on mode
in the ANCF test program, a third row of microphones was employed.
3.1.7 Active Mode Excitation
In order to interact with duct modes of circumferential order m a sound
source array is required that is capable of radiating mode m in the duct.
Analogous to the microphone array discussion, an annular array of N equallyspaced actuators, excited with equal amplitude and with phase that follows thetrace of the mode at the duct wall, will radiate modes
m+.qN; q = any integer (12)
in the duct. The number of actuators in the array must therefore be selectedsuch that modes m + N and m - N are cut off at the frequency of operation. Itshould be noted that each actuator in the array individually couples into all cuton m-orders. One thus depends upon the orthogonality of the circumferentialmode structures and the source phase distribution to eliminate coupling ofenergy into modes of unwanted m-order. This requires that the actuators beequally spaced around the annulus.
The annular source actuator array at a given axial station will radiate
energy in a target circumferential or m-order, distributed among radial or n-order components in a ratio that depend upon the relative mode strengths atthe duct wall, the cut-off ratios of the modes and the axial extent of theactuators.
3.2 ACTUATOR/NOISE SOURCE MODE INTERACTION
The intent of the active components of the hybrid liner is to scatter sound
energy from lower radial orders to higher radial orders, thus increasing theabsorption efficiency of the passive liner elements. Alternatively, the activecomponents can be thought of as re-phasing the modes so that the ratiobetween wall pressure and total sound energy is maximized in the region of thepassive liner.
2 2
Wall PressureRatio - RP_'"t_ (13)
2_P(rYrdr0
where P is the sum of the sound pressures in the modes. As an example,Figures 3.1a and b illustrate that in a relatively simple two-mode environment,the sum of the two modes can either decrease or increase the degree to whichenergy is concentrated near the wall. Figure 3.1c shows the nature of theinteraction for modes (9,0) and (9,1) as a function of relative mode amplitudeand phase, normalized to the case of mode (9,0) alone. When the wallpressure is nearly zero because of destructive interference between modes,
16
the energy loss to a passive absorber of finite length would be small. Bycontrast, as shown in Figure 3.1c, when the wall pressure is maximized, therate of absorption by the passive absorber would be greatly enhanced,offsetting energy added to the system by the actuators. The active controlsystem would be required to seek a balance between added energy andinhanced passive absorption elements.
The simplest approach to the balancing discussed above would beusing a single row of active resonators as a scattering impedance acoustically
upstream of the passive liner. The effectiveness would be dependent upon thephase relationship between the noise source generated modes at the axiallocation of the active resonators (or actuators). If the phases between themodes are opposite, the actuators would increase the energy in one modewhile reducing it in the other. If the phases of the modes were nearly equal, theactuators could reduce energy in both simultaneously.
A more universal approach would be to incorporate two or more rows of
active resonators to form a distributed scattering impedance area. This wouldhave the further advantage of allowing resonator actuators to be phased axiallyto interact more efficiently with specific modes or groups of modes.
In the actual hybrid liner implementation, two rows of actuators, spacedapproximately 3/8 wavelength were installed immediately ahead of the passiveliner. The closed loop control system was programmed to minimize soundenergy transmitted past the entire assembly, with the active resonator elementassuming the role appropriate to the incident mode mixture.
3.3 ACTIVE CONTROL ACTUATORS AND ACTIVE RESONATORS
The above discussions of actuator array configurations are based onmodal excitation and anti-aliasing considerations. Equally important are thecapabilities to provide acoustic signals of adequate amplitude to interact withthe fan noise and to withstand potentially high amplitude pressure fluctuationswithin the engine fan environment. In addition, with thought toward finalapplication, actuators were sought that were inexpensive, lightweight andcompact.
For operation in the frequency range 800 to 1000 Hz, conventional
electrodynamic loudspeakers are efficient and reliable, but are neitherlightweight nor compact. Further, they typically have lightweight diaphragmsthat would be susceptible to damage from intense fluctuating pressures.
The next readily available transducer type is piezo-electric or piezo-ceramic, bonded to an aluminum diaphragm. This approach is compact and
lightweight and can be designed to have a high mechanical impedance,protecting it form fluctuating ambient pressure. The disadvantage is that thehigh mechanical impedance restricts vibration amplitude. At frequencies of800 to 1000 Hz, the approximately 120 dB sound pressure levels expected in
the ANCF test facility are indicative of acoustic particle displacement on theorder 1-mil, readily attained in electro-dynamic drivers, but requiring high drivelevels and robust construction in a piezo-ceramic/aluminum disc transducer.
17
Figure 3.2 shows a diagram of the circular piezo-ceramic transducerused for the ANCF demonstration. Each of 32 transducers was used as the
base of an active Helmholtz resonator, tuned just above the maximum 2BPFfrequency of the ANCF fan (1006 Hz). Figure 3.3a and b are amplitude and
phase response plots for the actuators, showing the high degree of uniformityas required for minimal modal aliasing.
For the ADP tests, the design of the active resonator was modified byswitching the location of the piezo-ceramic actuator to the wall or nearest the
noise source. A slot adjacent to the actuator element and the cavity behind theactuator form the resonator, which act to increase the output at the low end ofthe desired response range.
3.4 ACTIVE CONTROL ALGORITHMS.
In the simplest sense, the function of the active control system in thehybrid liner is to apply signals to the active resonator actuators with appropriateamplitude and phase to minimize the sound pressure at the array of errormicrophones. Because the system objective is suppression of the rotor/statorinteraction tone, a reference signal is obtained from a fan tachometer or othernon-acoustical pickup that produces or can be processed to produce a BPFharmonic tone or tone series. Two different approaches to this function wereused.
3.4.1 Multi-Channel Filtered X Algorithm.Transfer functions are established between the two active resonator
arrays and the sine and cosine components of three error microphone annuli
using random noise injection at the resonator actuators. The reference signalis processed by one multi-tap finite impulse response (FIR) filter per actuatorarray channel and sent to the actuator drive amplifiers. The FIR filter has nofeedback paths and therefore can synthesize filters with zeros only. The errormicrophone signals are cross-correlated with the FIR filter tap weights andnew tap weights are computed based on the errors and the system transferfunctions. The process is repeated until the sum of the squares of the errorsignals is minimized. For a detailed description of the Filtered-X controlalgorithm, see (Reference 21).
3.4.2 Adaptive Quadrature AlgorithmThe filtered-X algorithm uses delay lines to model the acoustical transfer
functions of the fan and active noise control system elements. For controllingquasi-steady tones, the transfer function can be re-cast as an amplitude ratioand phase shift or two parameters per control channel. In a high frequencyenvironment such as the ADP engine model, a control algorithm that acts on
signal parameters instead of the signals themselves offers a significantadvantage in processing requirements.
The adaptive quadrature or A-Q algorithm measures the fan signal andthe signals from all resonator rows at all error microphone rows using fan BPFharmonic tone injection. The algorithm computes the minimum-norm actuatordrive vector (complex) that will combine with the fan noise to produce a
minimum in the sum of the squares of the error signals. Following the initial
18
adaptation, the system sequentially perturbs the real and imaginary parts of the
actuator drive signals and determines on-line corrections to maintain the
minimization of the error signals.
Unlike the Filtered-X algorithm, which processes a reference signal for
application to the resonator actuators, the A-Q algorithm generates the real and
imaginary parts of control signals using DSP lookup tables and uses a fan
tachometer only for system timing. The results of the "solver" in the algorithm
are multipliers for the reference signals, so that the actual control calculationscan be carried out at a slower rate than the signal I/O.
19

20
4 - CONCEPT VALIDATION IN NASA LeRC ANCF FAN TEST FACILITY
A two-phase test program was undertaken in the NASA Lewis Research
Center ANCF 48-inch fan facility to validate the hybrid active-passive
segmented liner concept. The first step was a static test in the HAE No-Flow24-inch duct facility, with the primary purpose of verifying flush mounted
microphone techniques for radial mode separation and stable operation of the
active element of the segmented liner. Three test liners were designed,constructed and their acoustic performance measured in terms of insertion
loss.
The second step was a full diagnostic and verification measurement
series in the NASA ANCF fan facility. A series of tests consisting of mode
resolution by microphone arrays, mode generation by actuator arrays, insertion
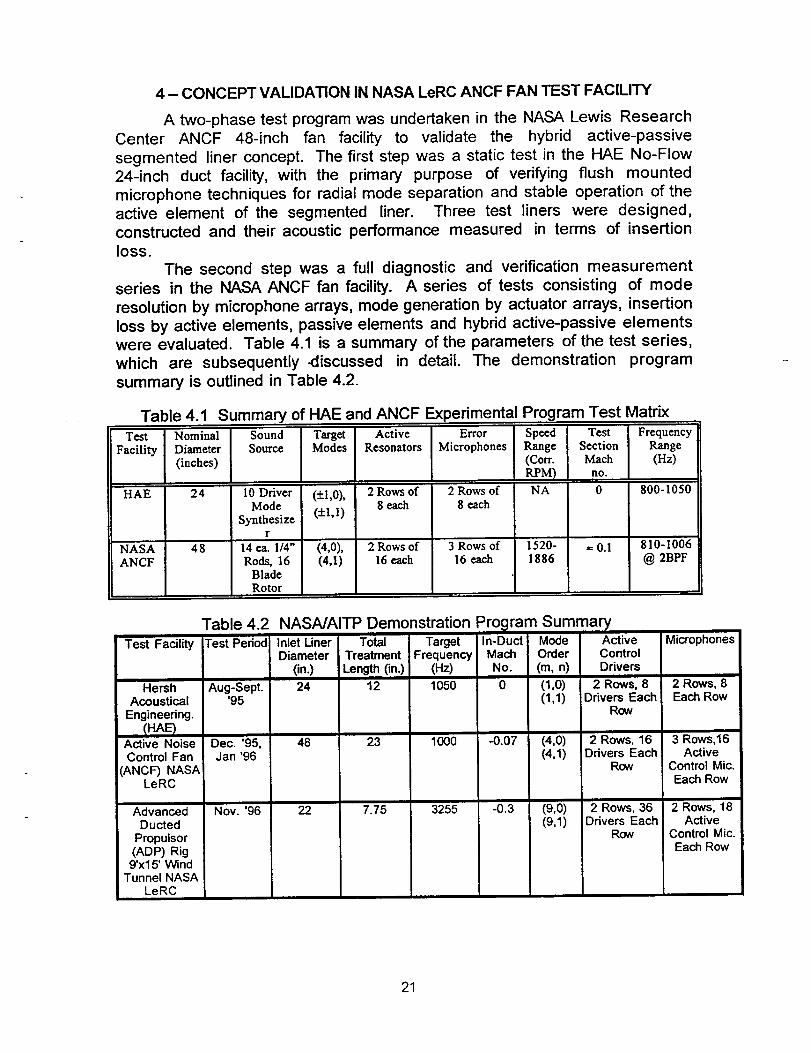
loss by active elements, passive elements and hybrid active-passive elementswere evaluated. Table 4.1 is a summary of the parameters of the test series,
which are subsequently _discussed in detail. The demonstration program
summary is outlined in Table 4.2.
Table 4.1 Summary of HAE and ANCF Experimental Program Test Matrix
Test
Facility
HAE
NASAANCF
Nominal SoundDiameter Source
(inches)
24 I0 DriverMode
Synthesizer
48 14 ca. 1/4"Rods, 16
BladeRotor
Target ActiveModes Resonators
(-+1,0), 2 Rows of8 each
(_+1,1)
(4,0), 2 Rows of(4,1) 16 each
Error SpeedMicrophones Range
(Corr.R.PM)
2 Rows of NA8 each
3 Rows of 1520-16 each 1886
Test FrequencySection RangeMaeh (Hz)
no.
0 800-1050
=o.1 81O-lOO6@ 2BPF
Test Facility
HershAcoustical
Engineering.(HAE)
Active NoiseControl Fan
(ANCF) NASALeRC
AdvancedDucted
Propulsor(ADP) Rig9'x15' Wind
Tunnel NASALeRC
Table 4.2 NASA/AITP Demonstration Program Summary
Test Period
Aug-Sept.'95
Dec. '95,Jan '96
Inlet LinerDiameter
(in.)
24
48
22
TotalTreatmentLength (in.)
12
23
7.75
TargetFrequency
(H_1050
In-Duct Mode ActiveMach Order ControlNo. (m, n) Drivers
0 (1,0) 2 Rows, 8(1,1) Drivers Each
Row
1000 -0.07 (4,0)(4.1)
3255 -0.3 (9,0)(9,1)
Nov.'96
i 2 Rows, 16IDrivers Each
Row
2 Rows, 36Drivers Each
Row
Microphones
2 Rows, 8Each Row
ii
3 Rows,16Active
Control Mic.Each Row
2 Rows, 18Active
Control Mic.Each Row
21
4.1 HAE NO FLOW CALIBRATION TESTS
4.1.1 Test Apparatus
As observed on the drawing of Figure 4.1a and b and in the photographsof Figure 4.2a and b, the HAE facility was constructed with two 48-inch lengthsand one 24-inch length of fiberglass reinforced plastic duct. The test linerswere inserted between the two 48-inch sections and the active resonatorelements, when used, were installed in the 24-inch section and inserted
acoustically upstream of the liners. The source end of the duct assembly wasfitted with a cylindrical duct mode synthesizer on the end wall consisting ofeight outer radius (r = 10-inches) drivers and two inner radius (r = 4.1-inches)drivers. These-could be driven from controlled amplitude and phase coherent
signal sources to allow generation of modes (_+1,0) and (_+1,1) withpredetermined complex ratios. The load end of the duct was terminated with 4-inch thick acoustically absorptive foam for most of the tests, but other
terminations, including a hard wall, free radiation and a foam wedge were alsoused. The 48 inch duct sections were fitted with numerous microphone ports,with axial spacing corresponding to one-half axial wavelength for modes (1,0)and (1,1) at test frequency 1050 Hz. In addition, the facility included fourexisting eight-element circumferential arrays of microphones, spaced 3-inchesaxially and radially traversing pressure and pressure gradient sensors atlocations immediately upstream and downstream of the test liner insertionpoint.
Figure 4.3a shows the radial distributions of desired modes (1,0), (1,1)and undesired mode (3,0) in the circular duct. Driver radius ratios were 0.34and 0.83, resulting in maximum coupling from the inner array to mode (1,1) and
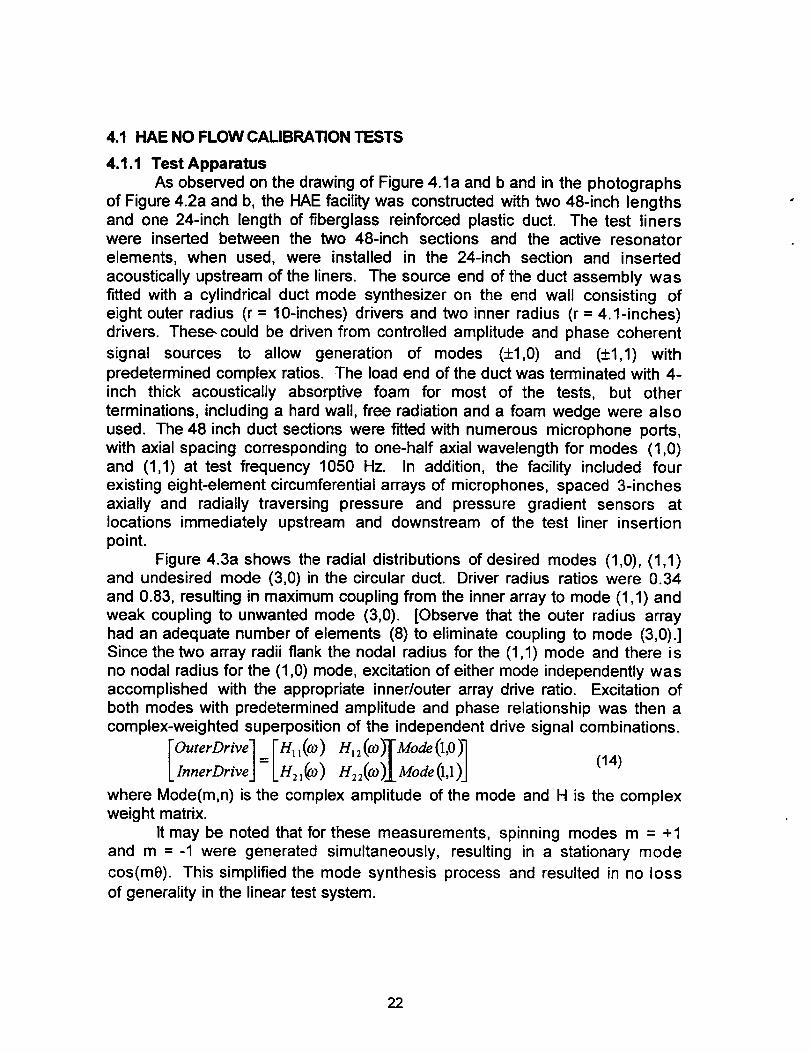
weak coupling to unwanted mode (3,0). [Observe that the outer radius arrayhad an adequate number of elements (8) to eliminate coupling to mode (3,0).]Since the two array radii flank the nodal radius for the (1,1) mode and there isno nodal radius for the (1,0) mode, excitation of either mode independently wasaccomplished with the appropriate inner/outer array drive ratio. Excitation ofboth modes with predetermined amplitude and phase relationship was then acomplex-weighted superposition of the independent drive signal combinations.
.l (,oyfMo e(1,0)1InnerDrive- LH=,(co) ModeO,1)J (14)
where Mode(m,n) is the complex amplitude of the mode and H is the complexweight matrix.
It may be noted that for these measurements, spinning modes m = +1and m =-1 were generated simultaneously, resulting in a stationary mode
cos(m0). This simplified the mode synthesis process and resulted in no loss
of generality in the linear test system.
22
4.1.2 Microphone Array TestsOne element in the active control approach was the use of flush
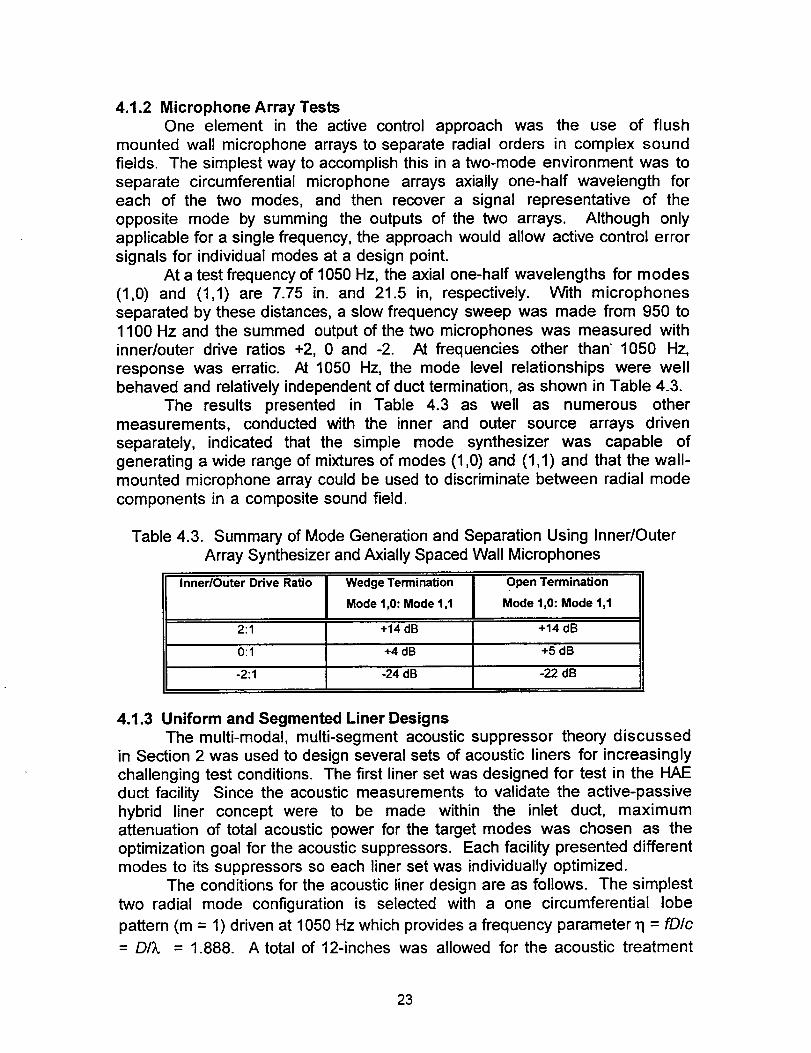
mounted wall microphone arrays to separate radial orders in complex soundfields. The simplest way to accomplish this in a two-mode environment was toseparate circumferential microphone arrays axially one-half wavelength foreach of the two modes, and then recover a signal representative of theopposite mode by summing the outputs of the two arrays. Although onlyapplicable for a single frequency, the approach would allow active control errorsignals for individual modes at a design point.
At a test frequency of 1050 Hz, the axial one-half wavelengths for modes(1,0) and (1,1) are 7.75 in. and 21.5 in, respectively. With microphonesseparated by these distances, a slow frequency sweep was made from 950 to1100 Hz and the summed output of the two microphones was measured withinner/outer drive ratios +2, 0 and -2. At frequencies other than 1050 Hz,response was erratic. At 1050 Hz, the mode level relationships were wellbehaved and relatively independent of duct termination, as shown in Table 4.3.
The results presented in Table 4.3 as well as numerous othermeasurements, conducted with the inner and outer source arrays drivenseparately, indicated that the simple mode synthesizer was capable ofgenerating a wide range of mixtures of modes (1,0) and (1,1) and that the wall-mounted microphone array could be used to discriminate between radial mode
components in a composite sound field.
Table 4.3. Summary of Mode Generation and Separation Using Inner/OuterArray Synthesizer and Axially Spaced Wall Microphones
Inner/Outer Drive Ratio Wedge Termination Open Termination
Mode 1,0: Mode 1,1 Mode 1,0: Mode 1,1
2:1 +14 dB +14 dB
0:1 +4 dB +5 dB
-2:1 -24 dB -22 dB
4.1.3 Uniform and Segmented Liner DesignsThe multi-modal, multi-segment acoustic suppressor theory discussed
in Section 2 was used to design several sets of acoustic liners for increasingly
challenging test conditions. The first liner set was designed for test in the HAEduct facility Since the acoustic measurements to validate the active-passivehybrid liner concept were to be made within the inlet duct, maximumattenuation of total acoustic power for the target modes was chosen as theoptimization goal for the acoustic suppressors. Each facility presented differentmodes to its suppressors so each liner set was individually optimized.
The conditions for the acoustic liner design are as follows. The simplesttwo radial mode configuration is selected with a one circumferential lobe
pattern (m = 1) driven at 1050 Hz which provides a frequency parameter T1= fDIc
= DI;L = 1.888. A total of 12-inches was allowed for the acoustic treatment
23
either uniform or two sectioned giving a total L/D = 0.5. It was desired that the
lower radial mode that is harder to attenuate should carry the largest acousticpower so the zeroth radial mode amplitude Ao = 2.0 and a first radial mode
amplitude A1 = 1.0 were chosen. It was determined from exercising the linercode that a phase difference between the modes of 135 degrees gave the bestresults at 1050 Hz so this phase was chosen. These mode amplitudes and
phases could be achieved easily in the HAE rig since the sound is produced bydriver arrays in one end wall.
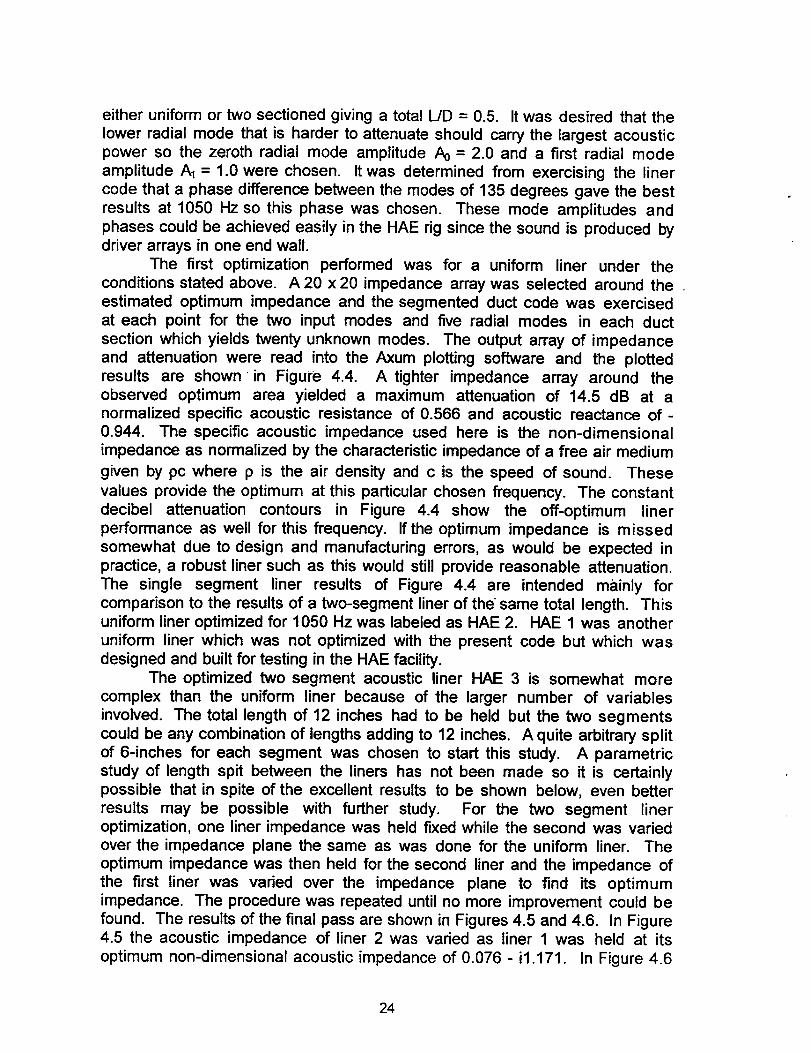
The first optimization performed was for a uniform liner under the
conditions stated above. A 20 x 20 impedance array was selected around theestimated optimum impedance and the segmented duct code was exercisedat each point for the two input modes and five radial modes in each duct
section which yields twenty unknown modes. The output array of impedanceand attenuation were read into the Axum plotting software and the plottedresults are shown in Figure 4.4. A tighter impedance array around theobserved optimum area yielded a maximum attenuation of 14.5 dB at anormalized specific acoustic resistance of 0.566 and acoustic reactance of-0.944. The specific acoustic impedance used here is the non-dimensionalimpedance as normalized by the characteristic impedance of a free air medium
given by pc where p is the air density and c is the speed of sound. These
values provide the optimum at this particular chosen frequency. The constantdecibel attenuation contours in Figure 4.4 show the off-optimum linerperformance as well for this frequency. If the optimum impedance is missedsomewhat due to design and manufacturing errors, as would be expected inpractice, a robust liner such as this would still provide reasonable attenuation.
The single segment liner results of Figure 4.4 are intended mainly forcomparison to the results of a two-segment liner of the same total length. Thisuniform liner optimized for 1050 Hz was labeled as HAE 2. HAE 1 was anotheruniform liner which was not optimized with the present code but which wasdesigned and built for testing in the HAE facility.
The optimized two segment acoustic liner HAE 3 is somewhat morecomplex than the uniform liner because of the larger number of variables
involved. The total length of 12 inches had to be held but the two segmentscould be any combination of lengths adding to 12 inches. A quite arbitrary splitof 6-inches for each segment was chosen to start this study. A parametricstudy of length spit between the liners has not been made so it is certainlypossible that in spite of the excellent results to be shown below, even better
results may be possible with further study. For the two segment lineroptimization, one liner impedance was held fixed while the second was variedover the impedance plane the same as was done for the uniform liner. The
optimum impedance was then held for the second liner and the impedance ofthe first liner was varied over the impedance plane to find its optimumimpedance. The procedure was repeated until no more improvement could befound. The results of the final pass are shown in Figures 4.5 and 4.6. In Figure4.5 the acoustic impedance of liner 2 was varied as liner 1 was held at its
optimum non-dimensional acoustic impedance of 0.076 - i1.171. In Figure 4.6
24
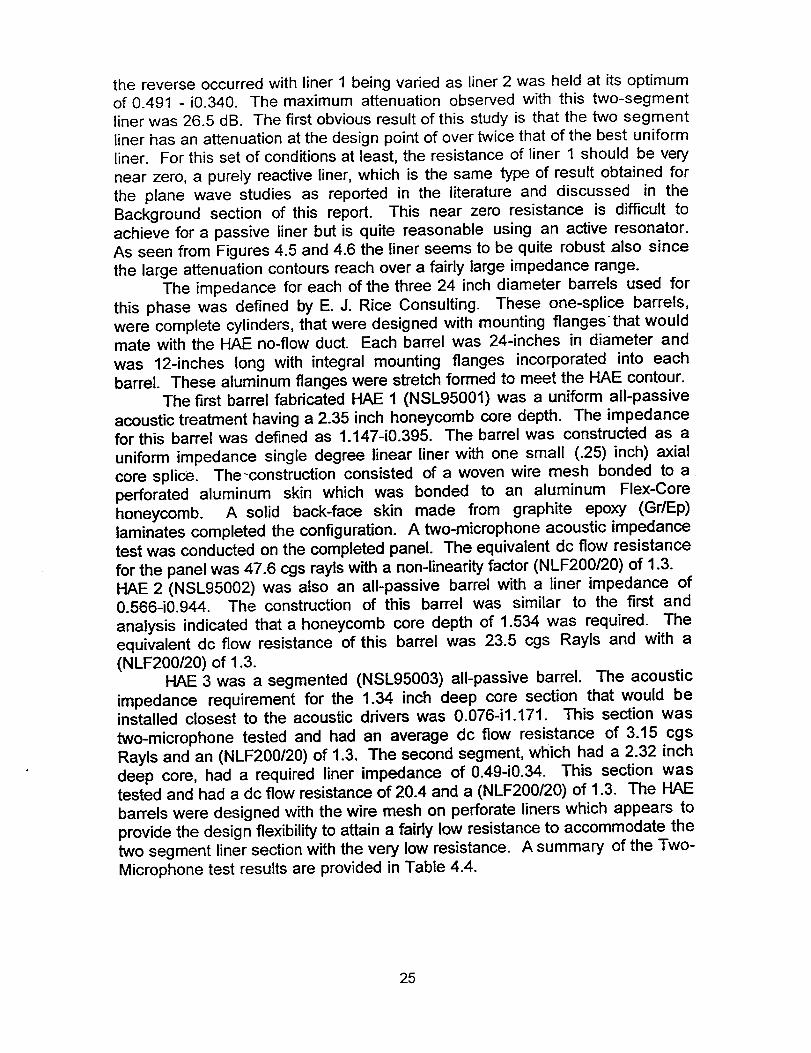
the reverse occurred with liner 1 being varied as liner 2 was held at its optimumof 0.491 -i0.340. The maximum attenuation observed with this two-segmentliner was 26.5 dB. The first obvious result of this study is that the two segmentliner has an attenuation at the design point of over twice that of the best uniformliner. For this set of conditions at least, the resistance of liner 1 should be verynear zero, a purely reactive liner, which is the same type of result obtained forthe plane wave studies as reported in the literature and discussed in the
Background section of this report. This near zero resistance is difficult toachieve for a passive liner but is quite reasonable using an active resonator.
As seen from Figures 4.5 and 4.6 the liner seems to be quite robust also sincethe large attenuation contours reach over a fairly large impedance range.
The impedance for each of the three 24 inch diameter barrels used for
this phase was defined by E. J. Rice Consulting. These one-splice barrels,were complete cylinders, that were designed with mounting flanges that wouldmate with the HAE no-flow duct. Each barrel was 24-inches in diameter and
was 12-inches long with integral mounting flanges incorporated into eachbarrel. These aluminum flanges were stretch formed to meet the HAE contour.
The first barrel fabricated HAE 1 (NSL95001) was a uniform all-passiveacoustic treatment having a 2.35 inch honeycomb core depth. The impedancefor this barrel was defined as 1.147-i0.395. The barrel was constructed as a
uniform impedance single degree linear liner with one small (.25) inch) axialcore splice. The-construction consisted of a woven wire mesh bonded to a
perforated aluminum skin which was bonded to an aluminum Flex-Corehoneycomb. A solid back-face skin made from graphite epoxy (Gr/Ep)laminates completed the configuration. A two-microphone acoustic impedancetest was conducted on the completed panel. The equivalent dc flow resistancefor the panel was 47.6 cgs rayls with a non-linearity factor (NLF200/20) of 1.3.HAE 2 (NSL95002) was also an all-passive barrel with a liner impedance of0.566-i0.944. The construction of this barrel was similar to the first and
analysis indicated that a honeycomb core depth of 1.534 was required. Theequivalent dc flow resistance of this barrel was 23.5 cgs Rayls and with a(NLF200/20) of 1.3.
HAE 3 was a segmented (NSL95003) all-passive barrel. The acousticimpedance requirement for the 1.34 inch deep core section that would beinstalled closest to the acoustic drivers was 0.076-i1.171. This section was
two-microphone tested and had an average dc flow resistance of 3.15 cgsRayls and an (NLF200/20) of 1.3. The second segment, which had a 2.32 inch
deep core, had a required liner impedance of 0.49-i0.34. This section wastested and had a dc flow resistance of 20.4 and a (NLF200/20) of 1.3. The HAEbarrels were designed with the wire mesh on perforate liners which appears toprovide the design flexibility to attain a faidy low resistance to accommodate the
two segment liner section with the very low resistance. A summary of the Two-Microphone test results are provided in Table 4.4.
25
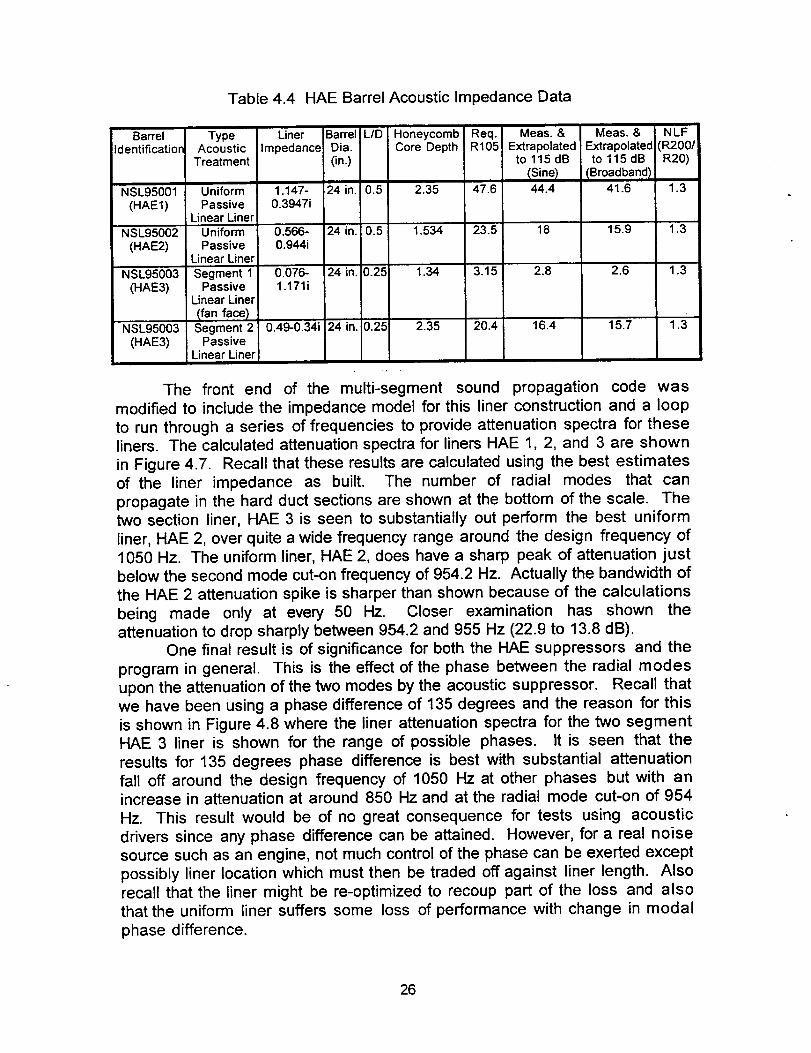
Table 4.4 HAE Barrel Acoustic Impedance Data
Barrel Type!Identification Acoustic
Treatment
Liner Barrel LID Honeycomb Req. Meas. & Meas. & NLFilmpedance Dia. Core Depth R105 Extrapolated Extrapolatedi(R200/
(in.) to 115 dB to 115 dB R20)ISine) IBroadbandl
1.147- 24 in. 0.5 2.35 47.6 44.4 41.6 1.30.3947i
NSL95001 Uniform(HAE1) Passive
Linear LinerNSL95002 Uniform
(HAE2) PassiveLinear Liner
NSL95003 Segment 1(HAE3) Passive
Linear Liner
(fan face)NSL95003 Segment 2
(HAE3) PassiveLinear Liner
0.566- 24 in. 0.5 1.534 23.5 18 15.9 1.30.944i
0.076- 24 in. 0.25 1.34 3.15 2.8 2.6 1.31.171i
0.49-0.34i 24 in. 0.25 2.35 20.4 16.4 15.7 1.3
The front end of the multi-segment sound propagation code was
modified to include the impedance model for this liner construction and a loop
to run through a series of frequencies to provide attenuation spectra for theseliners. The calculated attenuation spectra for liners HAE 1, 2, and 3 are shown
in Figure 4.7. Recall that these results are calculated using the best estimatesof the liner impedance as built. The number of radial modes that can
propagate in the hard duct sections are shown at the bottom of the scale. Thetwo section liner, HAE 3 is seen to substantially out perform the best uniform
liner, HAE 2, over quite a wide frequency range around the design frequency of
1050 Hz. The uniform liner, HAE 2, does have a sharp peak of attenuation just
below the second mode cut-on frequency of 954.2 Hz. Actually the bandwidth of
the HAE 2 attenuation spike is sharper than shown because of the calculations
being made only at every 50 Hz. Closer examination has shown the
attenuation to drop sharply between 954.2 and 955 Hz (22.9 to 13.8 dB).One final result is of significance for both the HAE suppressors and the
program in general. This is the effect of the phase between the radial modes
upon the attenuation of the two modes by the acoustic suppressor. Recall thatwe have been using a phase difference of 135 degrees and the reason for this
is shown in Figure 4.8 where the liner attenuation spectra for the two segmentHAE 3 liner is shown for the range of possible phases. It is seen that the
results for 135 degrees phase difference is best with substantial attenuation
fall off around the design frequency of 1050 Hz at other phases but with anincrease in attenuation at around 850 Hz and at the radial mode cut-on of 954
Hz. This result would be of no great consequence for tests using acoustic
drivers since any phase difference can be attained. However, for a real noise
source such as an engine, not much control of the phase can be exerted except
possibly liner location which must then be traded off against liner length. Also
recall that the liner might be re-optimized to recoup part of the loss and alsothat the uniform liner suffers some loss of performance with change in modal
phase difference.
26
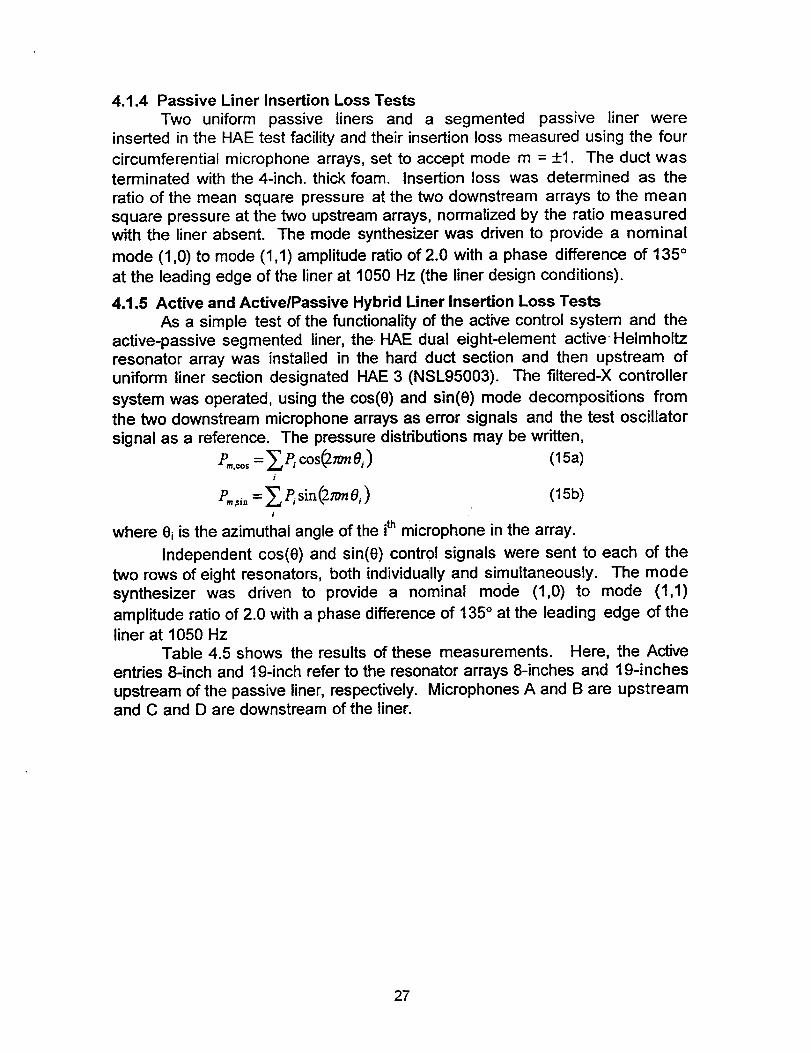
4.1.4 Passive Liner Insertion Loss Tests
Two uniform passive liners and a segmented passive liner wereinserted in the HAE test facility and their insertion loss measured using the four
circumferential microphone arrays, set to accept mode m = _+1. The duct wasterminated with the 4-inch. thick foam. Insertion loss was determined as the
ratio of the mean square pressure at the two downstream arrays to the mean
square pressure at the two upstream arrays, normalized by the ratio measuredwith the liner absent. The mode synthesizer was driven to provide a nominal
mode (1,0) to mode (1,1) amplitude ratio of 2.0 with a phase difference of 135 °
at the leading edge of the liner at 1050 Hz (the liner design conditions).
4.1.5 Active and Active/Passive Hybrid Liner Insertion Loss TestsAs a simple test of the functionality of the active control system and the
active-passive segmented liner, the HAE dual eight-element active Helmholtzresonator array was installed in the hard duct section and then upstream ofuniform liner section designated HAE 3 (NSL95003). The filtered-X controller
system was operated, using the cos(e) and sin(e) mode decompositions from
the two downstream microphone arrays as error signals and the test oscillator
signal as a reference. The pressure distributions may be written,
P,,.=o,= ___.P_cos(2mn(Y,) (15a)i
Po,,.=,T_,P, o,) (15b)i
where 0_is the azimuthal angle of the ith microphone in the array.
Independent cos(0) and sin(0) control signals were sent to each of the
two rows of eight resonators, both individually and simultaneously. The modesynthesizer was driven to provide a nominal mode (1,0) to mode (1,1)
amplitude ratio of 2.0 with a phase difference of 135 ° at the leading edge of theliner at 1050 Hz
Table 4.5 shows the results of these measurements. Here, the Active
entries 8-inch and 19-inch refer to the resonator arrays 8-inches and 19-inches
upstream of the passive liner, respectively. Microphones A and B are upstreamand C and D are downstream of the liner.
27
Table 4.5.
Treatment Microphone Array Amplitude
None
Summary of Active/Passive Treatment Measurements in HAE Duct
AverageAtten (dB)
Passive Active A B C D
None None 174.38 337.26 242.32 97.84 3.2
HAE 3 None 132.67 277.72 84.69 40.32 10.3
None 8" 2 ! 6.29 338.02 35.22 54.00 15.9
None 19" 505.1 449.60 56.71 82.87 16.6
HAE 3 19" 286.07 221.31 30.03 9.92 21.2
HAE 3 8" 219.13 301.31 1.40 5.78 35.9
HAE 3 8"& 19" 462.68 354.47 0.28 2.40 >40
414.61 422.73 0.29 0.30 >408" & 19"
The results of this preliminary test were indicative of the interactive
synergy of the hybrid liner concept. Observe that combined attenuation ofpassive liner HAE 3 and the active resonators 8-inch. upstream is nearly 10 dB
greater than the sum of the attenuation of the two elements measuredindividually. The two final entries in Table 4.5 suggest that the two activeresonator arrays provided greater attenuation with two rows of activeresonators was below the system noise floor.
4.2 ANCF FAN TEST PROGRAM
4.2.1 ANCF Test FacilityThe Active Noise Control Facility (ANCF) is located in the NASA LeRC's
Aeroacoustic Propulsion Laboratory (APL), a hemispherical anechoic (to 125Hz) test facility. This APL is a 130-foot diameter geodesic dome with a fullyanechoic arena with treated walls and floors. This facility has provisions for far-field noise measurements with microphones located at a 50-foot radius atangles of 6 °. The ANCF uses a 16-bladed variable pitch rotor and wasconfigured with stator vanes to provide specific mode generation andpropagation. The drive consists of a 125 horsepower electric motor, and twodrive shafts connected by a belt. The fan and associated structure is located ata centerline height of 10-feet. A maximum tip Mach number of 0.35 can beachieved with the fan which corresponds to a corrected speed of 1886 RPM.The duct has a constant 48-inch diameter. The length of the inlet for the test
was adjusted to accommodate the treatment and to move the rotating rake tovarious positions in the duct. The rotating rake permits measurements of thespinning acoustic mode structure. The rake is mounted to a small section ofthe wall and is designed to rotate at 1/100 of the fan speed. Microphones aremounted at several radial locations to measure the radial pressure profile. AnInflow Control Device (ICD) was installed for these tests that allowed static
28
testing. This ICD removes large scale, random turbulence and ground vorticesthat could interact and cause unwanted tones. A complete description of this
facility is contained in Heidelberg et al. 2223 and the key fan parameters are
provided in Table 4.6.
Table 4.6 Operating Parameters of the NASA ANCF Fan Test Rig Facility
Blade Number 16
Spoiler Rods 14Inlet Duct Diameter 4 ft.
Modes at BPF (m,n)Modes at 2-BPF (m,n)
Maximum RPMMaximum BPF 503 HzMaximum 2-BPF 1006 Hz
(2,0), Cutoff 273 Hz(4,0), Cutoff 476 Hz(4rl)r Cutoff 830 Hz1886
A cutaway diagram of the ANCF fan, as operated in this program, is
shown in Figure 4.9. A photograph of the facility viewed from the side of the fan
rig is shown in Figure 4.10 and from the rear in Figure 4.11. In order to
generate an initial sound field with strong signal-to-noise ratio and a
preponderance of energy in a low radial order mode, the stator vanes wereremoved and 14 rods, each of one-quarter inch diameter, were installed
immediately upstream of the rotor. The result was a 2BPF sound field
consisting of spinning mode order m = 4, radial orders n = 0 and 1 as shown in
Figure 3.1b, with approximately 2.9:1 amplitude ratio of mode (4,0) to mode
(4,1) at 1886 RPM (1006 Hz). The blade passage fundamental and other blade
passage harmonics were present as well, but were not addressed by thedemonstration tests.
4.2.2 Transducer Array Descriptions
The target modes were (4,0) and (4,1) at 2BPF, using 14 spoiler rodsand a 16 blade rotor in the inlet of the 48-inch ANCF fan. Fan operating speeds
were 1520-1886 RPM, corrected to 59 ° ambient temperature (1117 ft/sec
sound speed), producing mean flow of nominally Mach 0.1 in the fan inlet.
Error microphone arrays consisted of three annuli of 16 equally spaced
Knowles Type BT1755 electret condenser microphone, each with individually
trimmed preamplifier, flush mounted in the ANCF inlet duct using nylon inserts/transfer tubes of diameter 0.05-inch and nominal length 0.75-inch. The
microphones were spaced axially 0, 7.25 and 11.25-inches relative to the
downstream row, corresponding to the axial half wavelength for modes (4,0)
and (4,1) respectively at 1886 RPM fan speed. This would allow on-line radial
mode separation at this fan speed only. Outputs of the individual microphonesin each annulus were weighted by the cosine and/or sine of their modal
azimuthal angle and summed to produce mode m = 4 stationary wave outputs.
(Note that with 16 microphones, the weighting factors for m = 4 are all either +1,
29
-1 or 0.) These modal outputs were used for active control error signals andwere monitored to indicate control system effectiveness.
Active Helmholtz resonator arrays consisted of two annuli of 16 equallyspaced resonators, 4.5-inches diameter and 0.5-inch deep, with a 2-inchdiameter orifice covered with 30% open perforated metal and very low
resistance wire mesh screen. The base of each resonator was a speciallymachined aluminum disk with a piezoceramic actuator element cemented to
the back side. Each actuator was driven by an individually trimmed pulse-widthmodulated power amplifier. Figure 4.12a is a photograph of one of theactuators used for the ANC tests shown along side one of the ADP actuators inFigure 4.12b, which will be discussed in a later section.
As discussed previously, terminated tube frequency responsemeasurements were taken for 49 actuators, with results as shown in Figure3.4a and b, which indicates very uniform response characteristics among theactuators except near the primary mechanical resonance. The best matched
32 actuators were graded and grouped for use in the active resonators.
Variations among actuators were trimmed in situ to within 2% amplitude and 2 °
phase by adjusting voltage/current feedback on the individual power amplifiers.Initially, the 16 active resonators in each annulus were activated by
separate control channels for the cosine and sine stationary wave components
for mode rn = +4. In the final configuration, a single control signal was used for
each annulus. The control signal was split into cos(e)t) and sin(o_t)components using a Hilbert transform processor (two analog delay lines with
constant 90 ° phase difference). These signal components were used to drive
the cos(me) and sin(me) elements of the active resonator annuli, respectively.
[Note that with N = 4m, the cosine and sine resonator arrays are physicallyseparate, alternating around the annulus.]
4.2.3 Data Acquisition System
Performance measurements in the NASNLeRC ANCF were made usingin-duct modal power ("Rotating Rake") and far-field stationary microphone arraytechniques. Again this rotating rake system is discussed in detail inReferences 22 and 23. The in-duct system consists of six pressuremicrophones, spaced on a radial boom that scans the sound field at a fixedaxial station in the duct by rotating at a known fraction of the fan rotation speed(one percent in the case of ANCF). Circumferential mode orders are resolvedbased on Doppler shift of the measured sound spectrum. Radial mode ordersare resolved by least-square curve fits of the radial sound distribution to aseries of up to six Bessel functions of the appropriate circumferential order.Again this rotating rake system is discussed in detail in References 22 and 23.
The far-field measurement system is a semi-circular array of 28
stationary pressure microphones spaced approximately 6 ° on anapproximately 40-foot radius.
3O
For the hybrid liner tests, electrical drive signals to the active elementactuator arrays were recorded on computer disks for assessment of activecontrol solution vectors versus incident sound field characteristics and systemperformance.
In-duct modal 2BPF tone sound pressure measurements and far fieldsound pressure measurements were taken over a fan speed range 1520 to1886 RPM (corrected to 1117 ft/sec sound speed) for the following fan and inletconfigurations:
i. Cast aluminum inlet spools for hard-wall baseline data
ii. Uniform passive inlet liner L/D 0.5
iii. Segmented passive inlet liner L/D 0.5
iv. Hybrid active-passive segmented inlet liner, active only, passiveelement covered
• Active off
• Upstream resonator actuators only
• Downstream resonator actuators only
• Upstream and downstream resonator actuators
i. Hybrid active-passive segmented inlet liner
• Active off
• Upstream resonator actuators only
• Downstream resonator actuators only
• Upstream and downstream resonator actuators
Figure 4.13 is a schematic diagram of the active/passive measurementsystem utilized in the ANCF Facility.
4.2.4 Applied Active Control Algorithms and Signal Processing
Active control signal processing was completed using a Spectrum, quadTexas Instruments TMS320C40 floating point DSP system, programmed forsingle reference, four error channel and two/four output channel fittered-X
processing.The active control reference signal was obtained from the 128x pulse
train output of the fan shaft encoder. The encoder was divided by 4 in a binarydivider, giving a 32 shaft order (2BPF) square wave, which was then filtered toprovide a 2BPF sine wave.
All signal paths were conditioned using band pass filtering to restrictsignals to the range 400-1200 Hz.
System monitoring was conducted using Data Translation/Hewlett-Packard DT-VEE data acquisition/processing/display software and a DataTranslation type DT2821-G-16SE high speed analog I/O interface. Thefollowing system signals were monitored and samples thereof stored on diskfor subsequent analysis:
• Modal sound pressure signals from six microphone mode separators
31
• Filtered reference signal
• Control signals to two annular active resonator arrays
• Unprocessed microphone signals from one microphone in each of threeannular arrays
The DT-VEE processing and display provided on-line indications of thefollowing information:
• Modal sound pressure PSD display for six microphone modeseparators
• Sound pressure waveforms from three unprocessed microphonesignals
• Control signal waveforms for two active resonator annuli
These were used for on-line assessment of liner performance and actuatordrive levels.
4.2.5 ANCF Acoustic Liner DesignThe conditions for the acoustic liner design are as follows. The duct
diameter for the ANC facility is nominally 48-inches. Modal information wasobtained using the NASA LeRC rotating microphone rig. In order to obtain adominant lower radial mode for the two mode system, the case where 14 rodsmounted in front of the 16 rotor blades must be used. At a rotor rotation of 1886RPM, the 16 blade rotor produces a tone of 1005.9 Hz at twice the bladepassage frequency. With the 14 rods inserted a four lobed circumferential
mode is produced with two propagating radial modes. The mode amplitude
ratio of Ao/A1 = 2.92 was provided by L. Heidelberg of NASA LeRC. The rotatingprobe microphones are located 29.16-inches forward of the start of the
proposed acoustic treatment. The measured phases were _0 = -123.186° and
_1 = -134.072 ° relative to a reference signal. When these phases are projected
29.16 inches toward the rotor the result is $1 - $0 = 105°. The above conditions
provide a frequency parameter 1"1= fD/c = D/Z = 3.5978. A total of 23-inches
was allowed for the acoustic treatment either uniform or two sectioned giving atotal L/D = 0.4792.
The liner optimizations were performed the same as for the HAE
acoustic liners. A 20 x 20 impedance matrix was used to provide inputs to themulti-segment circular duct sound propagation code. The acoustic attenuation,at each wall impedance, was calculated and the results fed to AXUM softwareto perform contour plots. Results for the uniform liner ANC 1 are shown in
Figure 4.14. The optimum specific acoustic impedance is 1.159 -i1.324 withthe maximum attenuation of 14.3 decibels. In Figure 4.14 again it is seen thatthe uniform acoustic liner case is quite robust with substantial attenuationsbeing achieved over quite a large portion of the impedance plane. For the two
segment acoustic liner, ANC 2, the optimum conditions are shown in Figures4.15 and 4.16. In Figure 4.15 the impedance of liner 1 is held constant at its
optimum value of 0.554-il.914 while liner 2 is varied throughout the impedance
32
plane. The very large potential for attenuation with the ANC liner compared tothat of the HAE 3 two-segment liner can be seen by comparing Figure 4.15 with
Figure 4.5. The scales for the two figures are about the same so a directcomparison can be made. The region of the impedance plane encompassedby the 25 dB contour for the ANC 2 case is much larger than that for the HAE 3case. The maximum attenuation for the ANC 2 case is 51.0 dB but the
impedance region for this high attenuation is quite tight as seen by the closespacing of the higher attenuation contours in Figure 4.15. In Figure 4.16 theANC 2 liner attenuation in the liner segment 1 impedance plane is shown while
holding the liner 2 acoustic impedance at its optimum value of 0.788 - i0.522.The noticeable difference between this result and that for the HAE 3 two
segment liner in Figure 4.6 is that for ANC 2 the liner 1 segment is not justreactive at its optimum. The optimum impedance in Figure 4.16 should bequite easy to obtain using passive sections only. This difference is due to the
higher circumferential lobe number (4 vs. 1) and the higher frequencyparameter (3.60 vs. 1.89) with the latter probably being the most significant.
The third acoustic suppressor used in this concept validation program,the active-passive hybrid suppressor, uses the same liner 2 segment as thetwo-segment suppressor, ANC 2. This current hybrid liner designphilosophyuses the active driver system as a replacement for the set-up or modeconditioning section 1 while retaining the dissipative liner 2.
The theoretical results show dramatic advantages for the two segmentliner over the uniform liner of the same length. For the two cases shown so far
it appears that the two segment passive liner has the potential to double thedecibel attenuation over that of the same length uniform liner.
4.2.6 ANC Barrel FabricationThree test barrels were fabricated for the ANC test program. The
impedance of each of these barrels was defined as described in the previoussection. ANC 1 (NSL95005) was constructed with a 48°inch diameter, a 23-inch acoustic liner length and a constant honeycomb core depth of 1.29-inches.The resistance goal was 48.1 Rayls and the final value achieved was 51.9
(sine testing) and 52.9 broadband testing.ANC 2 (NSL95006) was a 48-inch diameter barrel with the total 23-inch
acoustic liner length divided into two liner segments. The segment adjacent tothe fan face was composed of a 10-inch/ength with a 0.97-inch deep core. Theresistance goal for this segment was 23.0 Rayls. The segment closest to theinlet lip was composed of a thirteen inch length with a 2.13-inch core depthhaving a resistance goal of 32.7 Rayls. Two-microphone tests yielded an
average resistance of 40.7 Rayls at 1384 Hz. for the thirteen inch segment and29.4 Rayls at 2842 Hz. for the ten inch segment. Sine wave excitation tests forthe 2.13-inch deep segment were conducted at a frequency of 1400 Hz. Anaverage resistance of 41.8 Rayls was obtained. For the 0.97-inch deepsegment a frequency of 2800 Hz. was used and average resistance of 27.4Rayls was obtained.
33
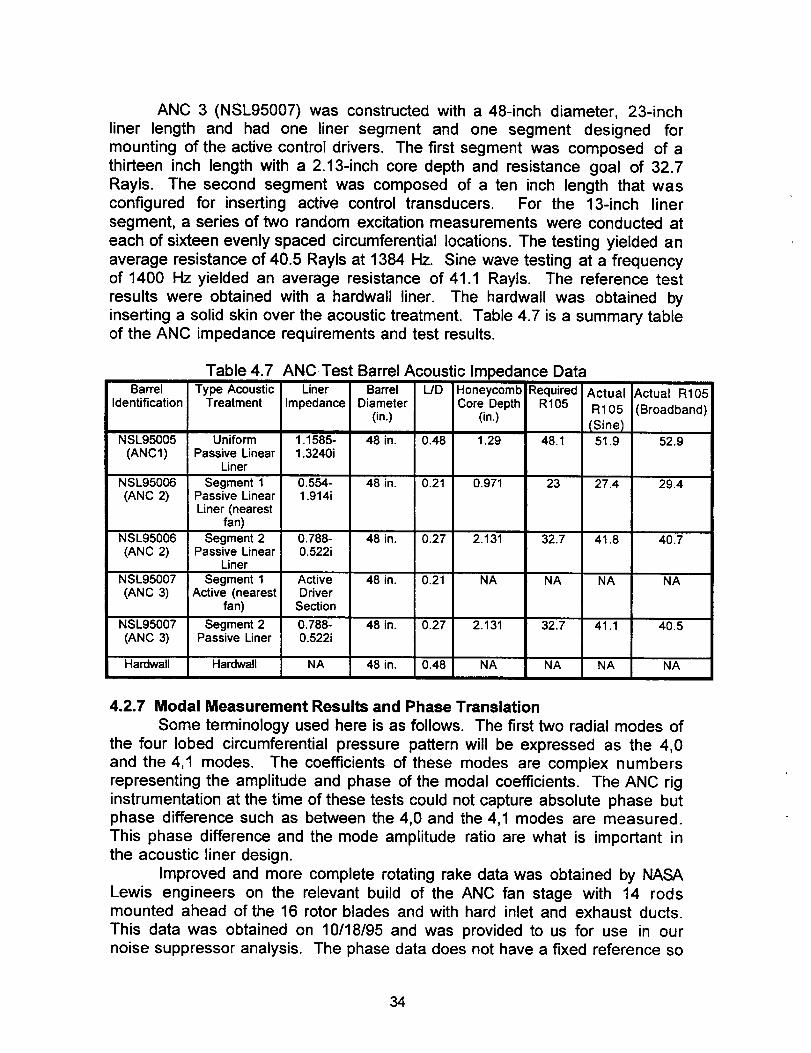
ANC 3 (NSL95007) was constructed with a 48-inch diameter, 23-inchliner length and had one liner segment and one segment designed formounting of the active control drivers. The first segment was composed of athirteen inch length with a 2.13-inch core depth and resistance goal of 32.7Rayis. The second segment was composed of a ten inch length that wasconfigured for inserting active control transducers. For the 13-inch linersegment, a series of two random excitation measurements were conducted at
each of sixteen evenly spaced circumferential locations. The testing yielded an
average resistance of 40.5 Rayls at 1384 Hz. Sine wave testing at a frequencyof 1400 Hz yielded an average resistance of 41.1 Rayls. The reference testresults were obtained with a hardwall liner. The hardwall was obtained byinserting a solid skin over the acoustic treatment. Table 4.7 is a summary tableof the ANC impedance requirements and test results.
Table 4.7 ANCTest Barrel Acoustic Impedance Data
Barrel Type Acoustic Liner Barrel LID Honeycomb Required Actual Actual R105
Identification Treatment Impedance Diameter Core Depth R105 R105 (Broadband)(in.) (in.)
(Sine)NSL95005 Uniform 1.1585- 48 in. 0.48 1.29 48.1 51.9 52.9
(ANC1) Passive Linear 1.3240iLiner
NSL95006 Segment 1 0.554- 48 in. 0.21 0.971 23 27.4 29.4(ANC 2) Passive Linear 1.914i
Liner (nearestfan)
NSL95006 Segment 2 0.788- 48 in. 0.27 2.131 32.7 41.8 40.7(ANC 2) Passive Linear 0.522i
Liner
NSL95007 Segment 1 Active 48 in. 0.21 NA NA NA NA(ANC 3) Active (nearest Driver
fan) Section
NSL95007 Segment 2 0.788- 48 in. 0.27 2.131 32.7 41.1 40.5(ANC 3) Passive Liner 0.522i
Hardwall Hardwall NA 48 in. 0.48 NA NA NA NA
4.2.7 Modal Measurement Results and Phase Translation
Some terminology used here is as follows. The first two radial modes ofthe four lobed circumferential pressure pattern will be expressed as the 4,0and the 4,1 modes. The coefficients of these modes are complex numbersrepresenting the amplitude and phase of the modal coefficients. The ANC riginstrumentation at the time of these tests could not capture absolute phase butphase difference such as between the 4,0 and the 4,1 modes are measured.
This phase difference and the mode amplitude ratio are what is important inthe acoustic liner design.
Improved and more complete rotating rake data was obtained by NASALewis engineers on the relevant build of the ANC fan stage with 14 rodsmounted ahead of the 16 rotor blades and with hard inlet and exhaust ducts.
This data was obtained on 10/18/95 and was provided to us for use in ournoise suppressor analysis. The phase data does not have a fixed reference so
34
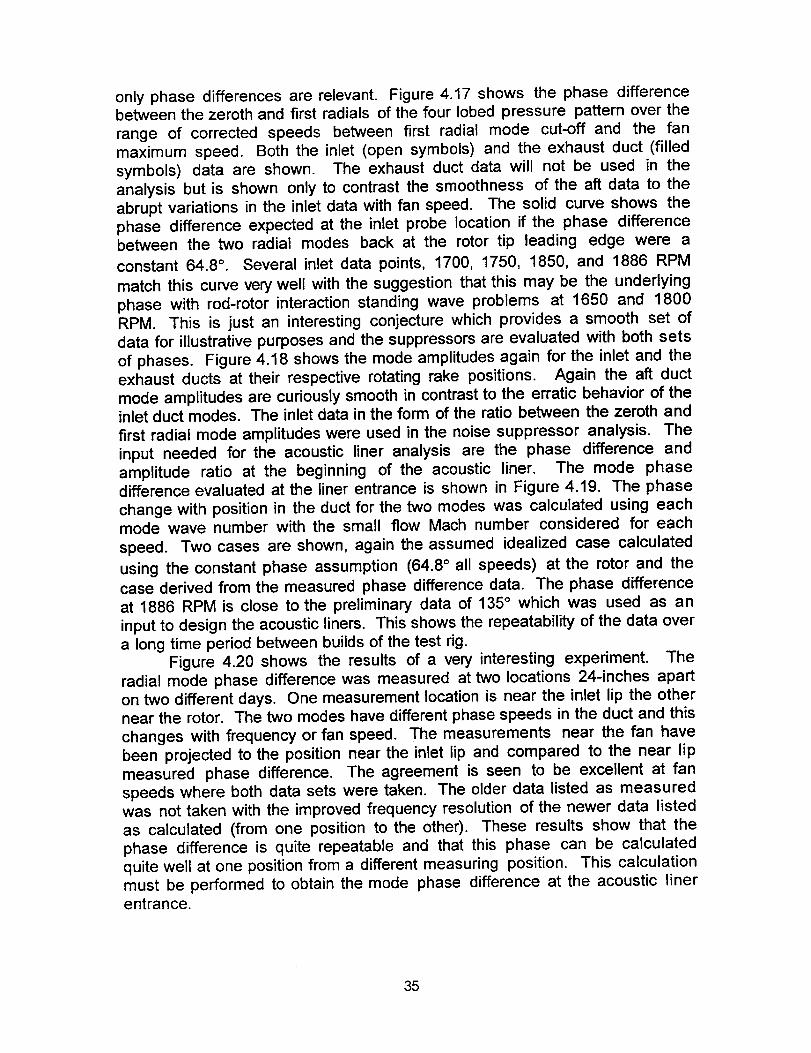
only phase differences are relevant. Figure 4.17 shows the phase differencebetween the zeroth and first radials of the four lobed pressure pattern over therange of corrected speeds between first radial mode cut-off and the fanmaximum speed. Both the inlet (open symbols) and the exhaust duct (filledsymbols) data are shown. The exhaust duct data will not be used in theanalysis but is shown only to contrast the smoothness of the aft data to theabrupt variations in the inlet data with fan speed. The solid curve shows thephase difference expected at the inlet probe location if the phase differencebetween the two radial modes back at the rotor tip leading edge were a
constant 64.8 °. Several inlet data points, 1700, 1750, 1850, and 1886 RPM
match this curve very well with the suggestion that this may be the underlyingphase with rod-rotor interaction standing wave problems at 1650 and 1800
RPM. This is just an interesting conjecture which provides a smooth set ofdata for illustrative purposes and the suppressors are evaluated with both setsof phases. Figure 4.18 shows the mode amplitudes again for the inlet and the
exhaust ducts at their respective rotating rake positions. Again the aft ductmode amplitudes are curiously smooth in contrast to the erratic behavior of theinlet duct modes. The inlet data in the form of the ratio between the zeroth and
first radial mode amplitudes were used in the noise suppressor analysis. The
input needed for the acoustic liner analysis are the phase difference andamplitude ratio at the beginning of the acoustic liner. The mode phase
difference evaluated at the liner entrance is shown in Figure 4.19. The phasechange with position in the duct for the two modes was calculated using eachmode wave number with the small flow Mach number considered for each
speed. Two cases are shown, again the assumed idealized case calculated
using the constant phase assumption (64.8 ° all speeds) at the rotor and the
case derived from the measured phase difference data. The phase differenceat 1886 RPM is close to the preliminary data of 135 ° which was used as aninput to design the acoustic liners. This shows the repeatability of the data overa long time period between builds of the test rig.
Figure 4.20 shows the results of a very interesting experiment. Theradial mode phase difference was measured at two locations 24-inches aparton two different days. One measurement location is near the inlet lip the othernear the rotor. The two modes have different phase speeds in the duct and thischanges with frequency or fan speed. The measurements near the fan have
been projected to the position near the inlet lip and compared to the near lipmeasured phase difference. The agreement is seen to be excellent at fanspeeds where both data sets were taken. The older data listed as measuredwas not taken with the improved frequency resolution of the newer data listedas calculated (from one position to the other). These results show that thephase difference is quite repeatable and that this phase can be calculatedquite well at one position from a different measuring position. This calculationmust be performed to obtain the mode phase difference at the acoustic linerentrance.
35
4.2.8 Initial Estimate of ANCF Passive Suppressor PerformanceThe first evaluation of the performance of the acoustic liners uses the
idealized inputs of constant phase difference at the rotor (solid symbols Figure4.19 and the constant amplitude ratio of 2.92 used for the liner designs. Theseidealized results are shown in Figure 4.21. The segmented duct providessignificantly more attenuation than the uniform duct of the same length at thehigher speeds as the design conditions are most closely approached. Recallthat ANC 3 represents the 13-inch second section of ANC 2 which is used witha 10-inch active section but which is not considered here. The addition of the
10-inch passive section to ANC 3 (as represented by ANC 2) is seen to
quadruple the attenuation dramatically illustrating the benefit of segmentedacoustic treatment.
When the radial mode phase differences and amplitudes as derivedfrom the experimental data Figures 4.18 and 4.19 are used in the acoustic liner
analysis, more erratic results are obtained as shown in Figure 4.22. Thesegmented liner still greatly outperforms the other liners at the design speed.It appears that the full length uniform liner is less sensitive to input changessince the performance ofANC 1 in Figures 4.21 and 4.22 are quite similar. It isnot surprising that a high performance concept might be more sensitive torequiring the inputs be similar to the design inputs. When the active section isadded to complete the liner ANC 3, the erratic modal input will be seen to beaccommodated and attenuation maintained over a wide speed range.
4.2.9 Test Results
The ANC liners were tested as follows. In 1996 the hybrid active-passiveliner ANC 3 was tested with the 13-inch passive section covered with analuminum sheet to provide a baseline for the 10-inch active upstream sectionand to obtain the purely active control performance. Runs 794 to 809 providedfar-field noise measurements with the rotating probe removed. The inletrotating probe located in the near lip position was used for runs 810 to 826.The aft mounted rotating rake was used for runs 827 and 828. Hybrid linerANC 3 was tested in the true active-passive mode also in 1996. Tests wereconducted over the speed range with active control off, two rows of drivers
operating, upstream drivers only and then downstream drivers only operating.Runs 834 to 864 utilized the inlet rotating rake in the near lip position and runs865 to 897 provided far-field noise data with the rotating rake removed. NASApersonnel conducted aft rake tests, runs 898 to 903. The segmented passiveliner, ANC 2, was tested in 1995 with the inlet rotating rake mounted near theinlet lip for mode measurement runs 904 to 917. Far-field noise data werethen obtained in runs 918 to 931 with the rake removed. The uniform 23-inch
long liner, ANC 1, was tested in 1995. Inlet mode measurements were taken
during runs 932 to 944 and far-field noise measurements during runs 945 to956. The passive liner tests were taken with corrected speed increments of 25RPM to provide improved frequency resolution.
36
The experimental acoustic power attenuation performance of the two-segment liner ANC 2 for the four lobed modes 4,0 and 4,1 at twice the bladepassage frequency (2BPF) is shown in Figure 4.23. Also shown is atheoretical attenuation for these modes. The theory is based on the forward ornear lip position of the rotating rake data of 10/18/1995 as projected to the inputplane of the acoustic liner. This is the same calculation as presented in thePassive Suppressor Theory section. The 25 dB suppression of the acoustic
power at the design point 1886 RPM corrected is seen to be quite large andalso the agreement with theory is seen to be quite excellent particularly at thehigher speeds. The fall off in performance with speed reduction is of noconsequence here. The objective was to provide a theory that could predict theliner performance and to show that at an optimum design point the twosegment liner is much better than a uniform liner of the same total length.Another objective of the study was to show that a hybrid liner could be
developed that would control this performance fall off. This will be shownshortly.
In Figure 4.24 the same experimental results of Figure 4.23 are shownwith a slightly different theoretical calculation of the ANC 2 suppressorperformance. This calculated performance was based upon modalmeasurements near the rotor and then projected to the liner input plane. The
peak near 1750 RPM is predicted with almost unbelievable accuracy. At thedesign point of 1886 rpm corrected speed this calculation does not do as wellas was shown in Figure 4.23. This is mainly due to the different modalamplitude ratios measured in the two different baselines. A small parametric
study was performed and shown by the solid symbols at 1886 RPM. Thehigher amplitude ratios produce the higher predicted attenuations and thisresult is consistent with the results of the two baselines. It appears that thetheory is quite excellent with only the input choices causing problems.
Most of the erratic behavior of the suppressor performance with enginespeed as shown in Figures 4.23 and 4.24 is produced by the equally erraticbehavior of the modal amplitudes as shown in Figure 4.25. This modalamplitude data is the same as one of the baselines also shown in the PassiveLiner Theory section. The passive liners were designed for a modal amplituderatio of Ao/A1 = 2.9 at 1886 RPM corrected. The recent baselines have not
achieved this ratio even at 1886 RPM and deviate dramatically from this atlower speeds.
A summary of the experimental performance of the three ANC inletsuppressors is shown in Figure 4.26. The erratic nature of the results with fanspeed are believed to be produced by the erratic nature of the 4,0 and 4,1acoustic mode amplitude and phase caused by the rod rotor interaction as wasdiscussed above. The uniform liner is providing about 15 dB of suppression at
the design speed. The maximum suppression of about 25 dB is obtained withthe passive two-segment liner. The active-passive hybrid suppressor isperforming very well at the design speed providing a suppression of about 21
dB. Note that the performance as presented here considers only the reductionof the 4,0 and the 4,1 modes at the blade passage frequency harmonic (2BPF).
37
These are the only propagating modes with the rods mounted in front of the
ANC fan at the design speed. The active element of the suppressor doessuffer some mode spill-over which further limits its performance and this
behavior is discussed in another section of this report. As the fan speed isreduced, the high performance of the two segment passive liner falls off
dramatically probably due to the erratic mode amplitude and phase changes.However, it should be recognized that a finely tuned system like this will in
general be more susceptible to input changes than the poorer performinguniform liner. Note that the active-passive hybrid system is able to overcome
even these substantial input changes. This is of course the goal of thisprogram to show that the hybrid system can overcome the loss in performanceof the highly tuned system.
The performance of the hybrid and the passive liners based uponinternal duct mode measurements for the NASA ANC fan stage tests weresummarized above. It is also of interest to evaluate the suppressors basedupon far-field noise results, especially for the ANC fan since the upstream rodsproduced fan tones far above the background noise. Figure 4.27 shows thefar-field tone noise directivity for the hard-wall baseline and the two-segmentpassive liner for the two highest fan speeds tested. The tone considered here
is twice the blade passage frequency. Significant directivity lobes are observedfor the inlet and the aft tone noise for the hard wall baseline case. For the
highest speed (1886 RPM) which is the two-segment liner design point, theinlet lobe is seen to be essentially eliminated by the two-segment noisesuppressor. No attenuation is seen for the aft lobe which is as expected sinceno aft duct suppressor was included. Note that at about 41 degrees, a deepcut in the forward noise lobe occurs for the 1886 rpm case. This is due to thecancellation occurring between the two modes (4,0 and 4,1) in the far-field. At1850 rpm the phase between these two modes is modified somewhat and
less cancellation occurs. Liner attenuation can not be evaluated at this anglefor the highest speed.
The far-field inlet noise attenuation for the two-segment passive liner isshown in Figure 4.28. At the design speed (1886 rpm) a large attenuation of 25decibels is observed. This is the same as the modal power reductionmeasured in the duct. This large noise reduction in the far-field is possiblebecause the tone level is far above (about 35 dB) the broadband noise leveland this is due to the strong rod wake-rotor interaction. For 1886 rpm a dashedline has been drawn through the data points bridging the noise cancellationpoint at 41 degrees. As the fan speed is increased the performance of the two-segment passive liner falls off due to changing modal amplitudes and phasesjust as occurred in the duct mode power measurements previously reported.
The far-field tone noise attenuation for the hybrid active-passive liner isshown in Figure 4.29. The results are again for the tone at twice the blade
passage frequency, and the hybrid liner has just the downstream driversoperating. Large inlet noise lobe attenuation is observed, and this attenuation
is seen to be maintained with speed much better than that of the passive linersystem. The active control has been able tocope with the dramatic changes in
38
mode amplitude and phase. These results provide additional confirmation ofthe superior performance of the hybrid active-passive liner system very similarto that provided by the internal duct mode measurements. Note also that thepeak attenuation moves to larger angle with reduced fan speed. This is justthe result of the tone modes radiating at larger angle due to the mode cut-offratios being reduced toward unity as the fan speed is reduced.
The experimental far-field radiation directivity for the design speed of1886 RPM is again shown in Figure 4.30 along with a theoretical radiationdirectivity. The theoretical results were obtained following the procedure ofRice 24. The angle location and breadth of the modal radiation was calculated,
but the magnitudes of the two modes were adjusted and a power summationmade to best fit the experimental directivity. Notice that the deep plunge in theexperimental data at about 43 ° occurs at about the point where the two modesare of equal magnitude. If the two modes (4,0 and 4,1) are nearly out of phasethis would account for the large cancellation in the experimental data. The 4,0mode radiation peaks at about 25 ° and the 4,1 mode peaks at about 50 ° .When the segmented and hybrid suppressor radiation directivity attenuationare compared to the theoretical radiation directivity, the hybrid liner Figure 4.29
appears to mainly attenuate the 4.0 mode and the segmented passivesuppressor Figure 4.28 must attenuate both radials to have the attenuationpeak at 35 °. The far field noise data for the ANCF fan as shown in Figure 4.30is probably dominated by aft fan noise for angles more than 60 or 70 °.
4.2.10 Additional Comments
The following presents a summary of the results of measurements thatdemonstrate the functional performance of the hybrid active-passivesegmented liner and its constituent elements.
Figures 4.31 and 4.32 illustrate the radial mode resolving capability ofthe flush mounted wall microphone array, as measured in the hardwallbaseline duct configuration. Circumferential order spinning mode m = +4sound pressures from the sin/cos components at the three axial stations
P-re.S,,..,.,= (P..oo,+/P.,i.)/2 (16b)
were presumed to be a linear combination of upstream traveling (4,0) and (4,1)modes and downstream traveling (reflected) (4,1) modes
P4,M,_=}:)4o eik'#'+'z_ +P4ae_k''''+'''*+ R .P..e-_''L-,'" (17)• 4,! 4,1
where k_,n_ is the axial wave number for mode (m,n) and ZMiC is the axialcoordinate of the microphone array. Reflection of mode (4,0) was ignoredbased on the duct dimensions and sound wavelength. Figures 4.31 and 4.32present the ratio of mode amplitudes and difference in mode phases betweenmodes (4,1) and (4,0) at the downstream edge of the fixed array, together withthe mode amplitude ratio and phase difference data measured with the NASA
rotating rake. There is a clear agreement between the two sets of
39
measurements, indicating both that the microphones and mode separationnetworks provide a faithful indication of the m = 4 sound pressure at each axialstation and that the low (4,0) reflection presumption is warranted.
Figures 4.33a and b are 3D bar graphs showing the 2BPF modestructure of the baseline measurement at two axial locations for fan speed
1886 RPM. With the exception of some minor differences in the m _ 4 modes,
the two are nearly equal. The total 2BPF tone power is approximately 118.8 dB,of which 118.7 dB is mode m = 4. The 103 dB remainder is from spuriousmodes, most prominently m = +2, -1,-4 and +8 or a "targeted to spurious"mode ratio of about 15.5 dB. At the inlet plane measurement station, mode(4,0) has a power level of 118.2 dB and mode (4,1) a power level of 109.3 dB(amplitude ratio 0.3 on the outer duct wall). This illustrates the utility of theANCF fan with rods as a test site for active control of sources with specific welldefined modal structures.
Figures 4.34a and b are 3D bar graphs showing the modes radiated bythe two sets of active resonators when driven from an oscillator signalsimulating the 1886 RPM fan reference. The fan was stationary and thepassive element of the liner was covered with aluminum sheet. Note that the"Upstream" drivers are the active resonators closer to the (covered) passiveliner element. In both cases, modes (4,1) and (4,0) are nearly equal at 109-110 dB (112-113 dB sum). The "targeted to spurious" ratio is 7.5 dB for theupstream resonators and 10 dB for the downstream resonators, poorer thanthe fan but adequate to demonstrate the functionality of the hybrid liner system.It may be noted by comparison to Figures 4.33a and b that the (4,0) : (4,1) ratiofor the active resonators is dissimilar from that of the fan. A single activeresonator row would therefore be unable to cancel fan noise.
[Note - As discussed previously, the original system design concept was toprovide control channels for the two stationary components of the m = 4spinning mode individually, to allow control of m = -4 energy radiated by the fan.It was determined that this was unnecessary and detrimental to the systemoperation. The system was revised, using Hilbert transform processors toderive quadrature signals required to drive the spinning mode from a singlecontrol signal per resonator array.]
For use in the active-passive hybrid liner, the microphone arrays werepositioned such that at the design fan speed of 1886 RPM, separate "error"signals could be derived easily for modes (4,0) and (4,1). This was done byspacing the three arrays (identified as A, B and C in flow-wise order) so thatpairs (B, C) and (A, C) were 112 wavelength apart for modes (4,0) and (4,1)respectively. Summing the signals from one pair of microphone arrays wouldthen reject that mode, providing an error signal for the opposite mode (asdiscussed for the HAE tests). Although this approach was the most effectiveembodiment of the system at the design speed, it was found that at lower fanspeeds, more reliable operation was achieved using separate error signalsfrom two of the microphone arrays, with A and C being somewhat preferableand used for all reported test results except as specifically identified otherwise.
4O
Figures 4.35a, b show control on vs. control off modal plots for the fullactive-passive hybrid liner at the design speed, using the "modal" error signal
combinations described above. Observe by comparison to the baseline plots
that mode m = 4 power has been reduced by over 33 dB and that total 2BPF
sound power has been reduced by over 15 dB. Figures 4.36a, b provide a
comparison between the full "modal" error signal and the A & C array errors.
The latter achieved approximately 3 dB less attenuation, but still reduced m = 4
by over 30 dB. By contrast, Figures 4.37a and b show the results for individual
modal error. Observe that with microphones B + C used for error, mode (4,0) is
less well attenuated and vice versa, demonstrating that the system adapts tocontrol the mode for which the error signal is most representative.
Figure 4.38a shows the mode m = 4 sound power level vs. fan speed for
baseline, control off, and upstream, downstream and both resonator rows
active with the passive liner covered. Figure 4.38b shows the total 2BPF sound
power levels under the same conditions. These give an indication of the
capability of the active resonator arrays to control the dual mode sound fieldalone and in pairs. Note that the total attenuation at 2BPF is less than that at
mode m = 4 because of modal impurities of both the fan source and the active
resonator arrays.
Figure 4.39a shows the mode m = 4 sound power level vs. fan speed for
baseline, control off, and upstream, downstream and both resonator rows
active, but with the passive portion of the liner exposed. These demonstrate
the capability of the hybrid active-passive segmented liner to suppress modal
inlet tones with single and dual rows of active resonators, disregarding modal
spillover. Observe that the system provides significant attenuation with a single
active resonator row but that performance depends strongly on which row isactivated.
Figure 4.39b shows the total 2BPF sound power level vs. fan speed for
baseline, control off, and upstream, downstream and both resonator rows
active, but with the passive portion of the liner exposed. Observe that this
demonstrates the total tone reduction, including the effects of modal distortion
introduced by the fan and by the liner.Finally, Figure 4.40 shows a summary of the attenuation in mode m = 4
at 2BPF, relative to baseline, provided by the constituent elements of the hybridliner, the sum of the constituent attenuation and the overall measured
attenuation as a function of fan speed. Over the range of speeds 1750 to 1886
RPM, the overall attenuation exceeded the sum of the constituents by
approximately 5 dB, illustrating the synergy of the active/passive segmented
liner concept.
On the basis of the 2BPF tone attenuation results shown in Figure 4.39b,
approximately 15 dB reduction in far field 2BPF noise radiated toward the fan
inlet is expected. Figures 4.41 to 4.44 show forward quadrant directivity
patterns for baseline, control-off and control-on (both resonators, microphones
A and C) conditions, which illustrate the effect of the hybrid liner on forward
radiated noise. Figure 4.45a and b shows the reduction in radiated 2BPFsound power as a function of fan speed.
41
In general, the degree of far-field 2BPF noise reduction agrees
reasonably well with the in-duct measurements for directivity angles up to
approximately 60 ° as shown in Figure 4.45a. For the full 90 ° quadrant, shown
in Figure 4.45b, the overall reduction was significant, but limited by sideline
radiation. The far-field levels near 90 ° were likely contaminated by the radiation
coming around from the aft duct and possibly direct radiation from the casing of
the hybrid liner, which was fully exposed. In a more practical installation, an
outer cowling might reduce this latter flanking radiation.
42
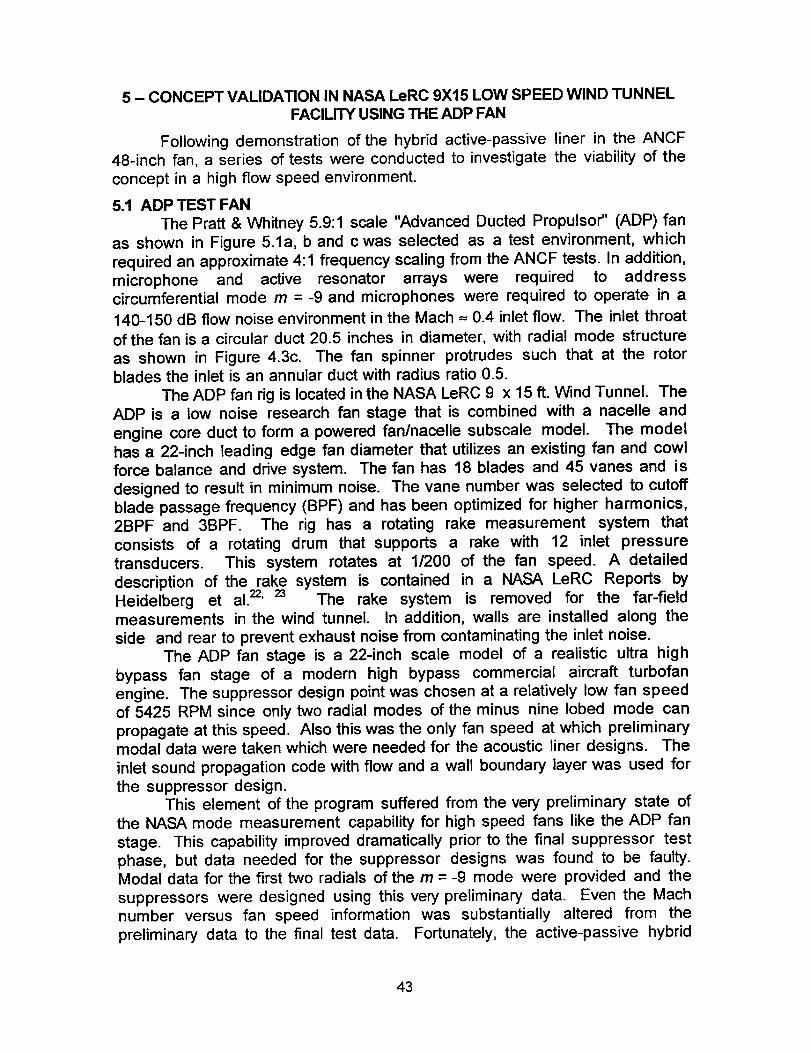
5 - CONCEPTVALIDATIONIN NASA LeRC 9X15LOW SPEEDWIND TUNNELFACILITYUSINGTHEADPFAN
Following demonstration of the hybrid active-passive liner in the ANCF48-inch fan, a series of tests were conducted to investigate the viability of the
concept in a high flow speed environment.
5.1 ADP TEST FAN
The Pratt & Whitney 5.9:1 scale "Advanced Ducted Propulsor" (ADP) fan
as shown in Figure 5.1a, b and c was selected as a test environment, which
required an approximate 4:1 frequency scaling from the ANCF tests. In addition,
microphone and active resonator arrays were required to addresscircumferential mode m = -9 and microphones were required to operate in a
140-150 dB flow noise environment in the Mach -- 0.4 inlet flow. The inlet throat
of the fan is a circular duct 20.5 inches in diameter, with radial mode structure
as shown in Figure 4.3c. The fan spinner protrudes such that at the rotorblades the inlet is an annular duct with radius ratio 0.5.
The ADP fan rig is located in the NASA LeRC 9 x 15 ft. Wind Tunnel. TheADP is a low noise research fan stage that is combined with a nacelle and
engine core duct to form a powered fan/nacelle subscale model. The modelhas a 22-inch leading edge fan diameter that utilizes an existing fan and cowl
force balance and drive system. The fan has 18 blades and 45 vanes and is
designed to result in minimum noise. The vane number was selected to cutoff
blade passage frequency (BPF) and has been optimized for higher harmonics,2BPF and 3BPF. The rig has a rotating rake measurement system that
consists of a rotating drum that supports a rake with 12 inlet pressure
transducers. This system rotates at 1/200 of the fan speed. A detailed
description of the rake system is contained in a NASA LeRC Reports byHeidelberg et al.22' 23 The rake system is removed for the far-fieldmeasurements in the wind tunnel. In addition, walls are installed along the
side and rear to prevent exhaust noise from contaminating the inlet noise.
The ADP fan stage is a 22-inch scale model of a realistic ultra high
bypass fan stage of a modern high bypass commercial aircraft turbofanengine. The suppressor design point was chosen at a relatively low fan speed
of 5425 RPM since only two radial modes of the minus nine lobed mode can
propagate at this speed. Also this was the only fan speed at which preliminarymodal data were taken which were needed for the acoustic liner designs. The
inlet sound propagation code with flow and a wall boundary layer was used for
the suppressor design.This element of the program suffered from the very preliminary state of
the NASA mode measurement capability for high speed fans like the ADP fan
stage. This capability improved dramatically prior to the final suppressor test
phase, but data needed for the suppressor designs was found to be faulty.Modal data for the first two radials of the m = -9 mode were provided and the
suppressors were designed using this very preliminary data. Even the Machnumber versus fan speed information was substantially altered from the
preliminary data to the final test data. Fortunately, the active-passive hybrid
43
suppressor is sufficiently adaptable to accommodate these questionableinputs. The following liner designs are based upon the preliminary data inputs.
5.2 ADP INLET SUPPRESSOR DESIGN AND CONSTRUCTION
5.2.1 Acoustic Liner DesignThe modal amplitudes and relative phases were provided at the throat of
the inlet. The phases were translated to the acoustic liner leading edge usingthe local wave number based on the local radius and Mach number in a ten
step procedure. The design calculations proceeded in a manner similar to thatof the HAE and ANC acoustic liners. A 20 x 20 matrix in the wall impedance
plane was used to perform a series of acoustic power calculations and theresults were plotted as attenuation contours in the impedance plane.
The results of the acoustic design of the passive uniform liner is shownin Figure 5.2. An attenuation of over 10 dB is seen to be possible in spite of thevery short liner with WD = 0.37. The non-dimensional optimum impedance isseen to have a 2.395 resistive component and a -2.224 reactive component.These values are normalized by the free air impedance. The optimum designof the two segment passive liner was performed using an iterative procedurevarying one segment while holding the other fixed and then reversing theprocedure. The final iterations are shown in Figures 5.3 and 5.4. Theimpedance characteristics required of the second segment (furthest from thefan stage) are shown in Figure 5.3. About 16 dB attenuation appears to bepossible with the two segment liner which would be a very impressiveperformance with such a short liner. The optimum impedance is seen to bequite usual with a normalized resistance of 1.061 and reactance of-1.567. Thefirst liner section (nearest the fan stage) is seen to be quite unusual as shown
in Figure 5.4. A very large negative reactance is required to achieve this highperformance. The normalized optimum resistance could be 2.53 while thereactance must be -10.61. This large negative reactance results in a very thinliner for this small scale fan stage. This two segment liner design is specific tothe very preliminary design conditions provided for the ADP fan stage at thisspeed. The modal amplitudes and phase difference as provided by NASALewis engineers are shown on the figure. Over the axial length of the liner theduct radius varies somewhat which causes a change in the phase velocity ofthe modes. The change in the phase difference between the 9,0 and 9,1modes was calculated over one inch length increments and accumulated over
the full length of the liner. An average duct diameter was then used thatprovided this same phase change over the full length of a constant diameterduct.
The nature of the attenuation-impedance characteristics for the firstsection of the two section liner as shown in Figure 5.4 are seen to be quitedifferent from those of the other liner sections. No real optimum is found in thehigh attenuation region. A range for the liner resistance is shown with thelower value probably preferred since this is even quite high (2.53). The usualtype of attenuation contours can be found in the lower right side (small
44
resistance, reactance near zero) of Figure 5.4 where the values for the uniformliner would be approached. The high attenuation region of Figure 5.4 does
suffer from a limited number of converged modes which would be considered
cut-off if the duct were hard. However, the acoustic power balances very well
across the duct segment interfaces and no discontinuous behavior of the liner
performance is apparent. The use of the set-up liner for ADP 2 as shown in
Figure 5.4 was considered to be high risk due to its very unusual high
frequency resonance (thin depth) which may be useless at the lower design
frequency if the actual modal inputs were dramatically different than the design
inputs. This turned out to be true when the improved data were obtained.However, it was realized that the active section would replace this thin section
in the hybrid active/passive barrel and would be adaptive enough to overcome
this deficient input data.
Improved modal input data was obtained using a hardwall baseline inlet
which was tested during the same NASA 9x15 wind Tunnel entry as theacoustic liner tests. Since no reliable preliminary data was available before
this entry, no preliminary suppressor performance calculations were made.
The theoretical calculations for the passive ADP suppressors will thus be
presented along with the experimental data in a later section.
5.2.2 Barrel Fabrication
Four different barrel sections were designed for testing in the ADP rig.
The first barrel, designated as ADP 1 (NSL96001), was designed as an all-
passive barrel having a single core depth linear liner acoustic treatment. Thesecond barrel, designated as ADP 2 (NSL96002), is a segmented passive
barrel having two different acoustic impedance's. The impedance
requirements for the liner segment that is located closest to the fan face of the
ADP fan rig were specified as a normalized resistance of 2.53 to 5.05 and
normalized reactance of-10.61 at a frequency of 3255 Hz. The impedance tests
were conducted with a dual microphone impedance tube. Normalized
reactance values averaged minus 10 at 3200 Hz. Resistance values
measured using the impedance tube were higher than obtained with dc flow
measurements. This is due to experimental error obtained for measurements
with a high reactance value. For this small depth liner the dc flow
measurements more accurately describe the resistance. The third barrel,
designated as ADP 3 (NSL96003), is a hybrid active/passive liner which has
the active section located next to the fan and the optimized passive linear liner
acoustic treatment forward. The drawing for this component is shown in Figure
5.5. The impedance values for all the barrels are shown in Table 5.1.
45
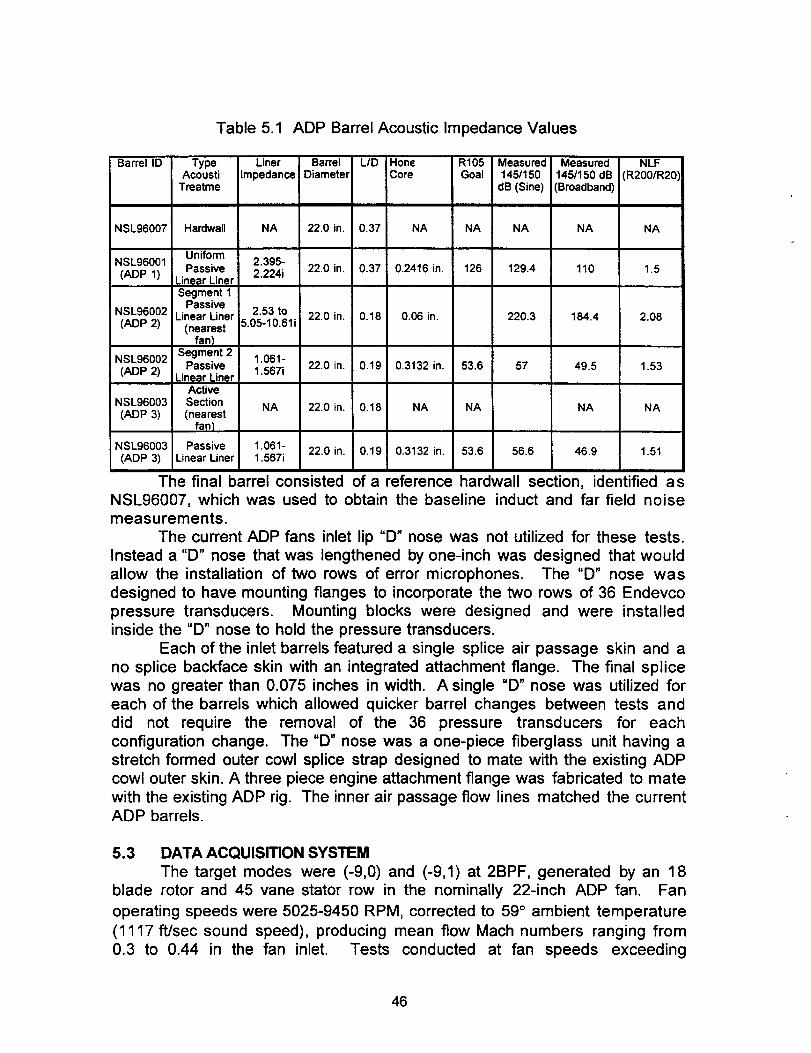
Table 5.1 ADP Barrel Acoustic Impedance Values
Barrel ID Type Liner Barrel LID Hone R105 Measured Measured NLFAcousti Impedance! Diameter Core Goal 1451150 145/150 dB (R200/R20)
Treatme dB (Sine) (Broadband)
NSL96007 Hardwall NA 22.0 in. 0.37 NA NA NA NA NA
UniformNSL96001 2.395-
Passive 2.224i(ADP 1) Linear Liner
Segment 1Passive
NSL96002 Linear Liner 2.53 to(ADP 2) (nearest 5.05-10.61i
fan)
NSL96002 Segment 2 1.061-Passive 1.567i
(ADP 2) Linear LinerActive
NSL96003 Section NA(ADP 3) (nearest
fan)
22.0 in. 0.37 0.2416 in. 126 129.4 110 1.5
22.0 in, 0.18 0.06 in. 220.3 184.4 2.08
22.0 in. 0.19 0.3132 in. 53.6 57 49.5 1.53
22.0 in. 0.18 NA NA NA NA
NSL96003 Passive 1.061- 22.0 in. 0.19 0.3132 in. 53.6 56.6 46.9 1.51(ADP 3) Linear Liner 1.567i
The final barrel consisted of a reference hardwall section, identified asNSL96007, which was used to obtain the baseline induct and far field noisemeasurements.
The current ADP fans inlet lip "D" nose was not utilized for these tests.Instead a "D" nose that was lengthened by one-inch was designed that wouldallow the installation of two rows of error microphones. The "D" nose wasdesigned to have mounting flanges to incorporate the two rows of 36 Endevcopressure transducers. Mounting blocks were designed and were installedinside the "D" nose to hold the pressure transducers.
Each of the inlet barrels featured a single splice air passage skin and ano splice backface skin with an integrated attachment flange. The final splicewas no greater than 0.075 inches in width. A single "D" nose was utilized foreach of the barrels which allowed quicker barrel changes between tests anddid not require the removal of the 36 pressure transducers for eachconfiguration change. The "D" nose was a one-piece fiberglass unit having astretch formed outer cowl splice strap designed to mate with the existing ADPcowl outer skin. A three piece engine attachment flange was fabricated to mate
with the existing ADP rig. The inner air passage flow lines matched the currentADP barrels.
5.3 DATA ACQUISITION SYSTEM
The target modes were (-9,0) and (-9,1) at 2BPF, generated by an 18blade rotor and 45 vane stator row in the nominally 22-inch ADP fan. Fan
operating speeds were 5025-9450 RPM, corrected to 59 ° ambient temperature(1117 ft/sec sound speed), producing mean flow Mach numbers ranging from
0.3 to 0.44 in the fan inlet. Tests conducted at fan speeds exceeding
46
approximately 6000 RPM included additional radial mode components aboveand beyond the two for which the demonstration system was designed. At themaximum speed, five radial order modes were cut on in the fan inlet.
The microphone array used in the ADP tests represents a doublesimplification relative to the ANCF test array. First, the number of annuli wasreduced from three to two based on the success of the ANCF tests with two
annuli used for error detection. Second, the number of microphones in theannuli were reduced to the Nyquist minimum of 2m, based on NASA data
showing that mode m = -9 was heavily predominant over mode m = +9, so thatpotential for mode aliasing was not a significant issue. Therefore, errormicrophone arrays consisted of two annuli of 18 equally spaced Endevco type8510B-1 (1 psi rating) strain gauge pressure transducers, flush mounted in theADP fan inlet "D" nose. The microphones were spaced axially 1.0-inch, orapproximately 1/2 wavelength at the design speed of 5425 RPM (3255 Hz) and
approximately 0.4 wavelength at the maximum test speed.Outputs of the individual microphones in each annulus were weighted by
the inverse of their calibration sensitivities and by the cosine and/or sine of theirmodal azimuthal angle and summed to produce mode m = 9 stationary waveoutputs. (Note that with 18 microphones, the weighting factors for m = 9 are alleither +1 or -1.) These modal outputs were used for active control error signalsand were monitored to indicate control system effectiveness.
Active Helmholtz resonator arrays consisted of two annuli of 36 equallyspaced resonators. The resonators were designed and fabricated especiallyfor the high frequency application on the ADP scale model engine and werebuilt in axial pairs to simplify fabrication and installation. As shown in thedrawing in Figure 5.6a and b the resonators are approximately 1-inch squareand 0.4-inch deep and are designed with the active element on the front, ratherthan at the base as for the ANCF tests. The size of these drivers are shown in
contrast to the ANCF drivers in Figure 4.12a.The Helmholtz resonator is formed by the slot orifice at the end of the
actuator and the cavity behind the actuator. At frequencies between 3,000 and3,500 Hz, acoustic radiation is primarily due to resonant flow in the orifice. Thistransitions to direct radiation by the actuator at higher frequencies. The primary
mechanical resonance is approximately 5200 Hz and the Helmholtz resonanceapproximately 3,200 Hz. The operation of the active resonator can be likened tothat of the traditional "bass-reflex" loudspeaker, although it has significantly
dissimilar mechanical and electrical properties.Because of the frequency dependent distributed radiation area of the
paired active resonators, the effective axial spacing was approximately 2-inches at 3,000-3,500 Hz, with a gradual transition to approximately 1.25-inches at higher frequencies.
Free field frequency response measurements were taken for 41 activeresonator pairs. A summary of the results is shown in Figure 5.7a and b, whichindicates very uniform response characteristics among the actuators exceptnear the primary mechanical resonance. The best matched 36 pairs of
resonators were graded and grouped in sets of three for installation in the liner.
47
With 36 active resonators per annulus and a control target mode m = -9,there were four resonators per circumferential wavelength, the same as for the
ANCF tests. This then requires excitation signals of phase 0 °, 90 °, 180 ° and
270 ° which where provided by the Hilbert transform processor. If the response
characteristics of the resonators were perfectly matched, an entire annuluscould be ddven by four power amplifiers, one for each of the phases, drivingnine resonators each. It was elected instead to drive three resonators per
amplifier, allowing compensation for minor response variations by amplifiergain and voltage/current feedback adjustments. A total of 24 switching poweramplifiers were thus used to drive the 72 miniature active resonators.
Active control signal processing was done on a Spectrum, quad TexasInstruments TMS320C40 floating point DSP system, programmed for externallyclocked, two error channel and two output channel Adaptive Quadrature
processing.The active control timing reference signal was obtained from the 128x
pulse train output of the fan shaft encoder. Control signals were synthesized bythe control algorithm, based on the ratio of the sound frequency to the encoderpulse rate
where n is the BPF harmonic, B is the number of rotor blades, P is the number
of pulses per fan revolution and q is the encoded pulse count. In the test case,nB/P = 9/32 (i.e., a 32 place lookup table spans nine cycles).
The active control algorithm determined the real and imaginary parts ofthe drive signal required for each resonator annulus that would combine withthe fan 2BPF tone to produce a null at both microphone annuli.
All signal paths were conditioned using band pass filtering to restrictsignals to the range 3000-5500 Hz.
System monitoring was done using Data Translation/Hewlett-PackardDT-VEE data acquisition/processing/display software and a Data Translationtype DT2821-G-16SE high speed analog I/O interface. The following systemsignals were monitored and samples thereof stored on disk for subsequentanalysis:
• Modal sound pressure signals from two microphone array mode
separators
• Filtered cosine reference signal
• Control signals to two annular active resonator arrays
• Unprocessed microphone signals from one microphone in each of twoannular arrays
• NASA far field microphone signal during far-field testing
The DT-VEE processing and display provided on-line indications of thefollowing information:
• Modal sound pressure PSD display for two microphone modeseparators and (when used) the NASA far field microphone
48
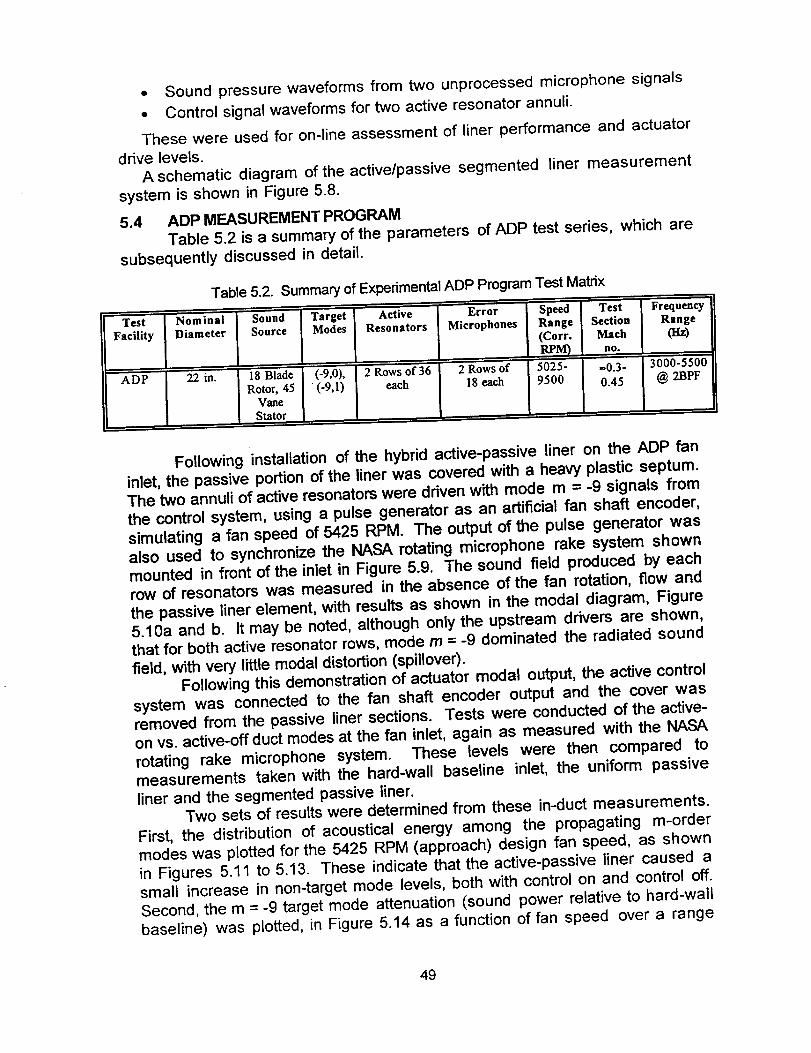
• Sound pressure waveforms from two unprocessed microphone signals
• Control signal waveforms for two active resonator annuli.
These were used for on-line assessment of liner performance and actuatordrive levels.
A schematic diagram of the active/passive segmented liner measurement
system is shown in Figure 5.8.
5.4 ADP MEASUREMENT PROGRAM
Table 5.2 is a summary of the parameters of ADP test series, which are
subsequently discussed in detail.
Table 5.2. Summary of Experimental ADP Program Test Matrix
Test
Facility
NominalDiameter
Sound Target ActiveSource Modes Resonators
ADP 22 in. 18 Blade
Rotor, 45Vane
Stator
(-9,o),(-9A)
Error
Microphones
2 of36 2Row ofeach 18 each
SpeedRange(Corr.
I_M)5025-
9500
Test FrequencySection Range
Mach (Hz)nO.
=0.3- 3000-5500
0.45 @ 2BPF
Following installation of the hybrid active-passive liner on the ADP faninlet, the passive portion of the liner was covered with a heavy plastic septum.
The two annuli of active resonators were driven with mode m = -9 signals from
the control system, using a pulse generator as an artificial fan shaft encoder,
simulating a fan speed of 5425 RPM. The output of the pulse generator was
also used to synchronize the NASA rotating microphone rake system shown
mounted in front of the inlet in Figure 5.9. The sound field produced by eachrow of resonators was measured in the absence of the fan rotation, flow and
the passive liner element, with results as shown in the modal diagram, Figure
5.10a and b. It may be noted, although only the upstream drivers are shown,that for both active resonator rows, mode m = -9 dominated the radiated sound
field, with very little modal distortion (spillover).
Following this demonstration of actuator modal output, the active control
system was connected to the fan shaft encoder output and the cover wasremoved from the passive liner sections. Tests were conducted of the active-
on vs. active-off duct modes at the fan inlet, again as measured with the NASA
rotating rake microphone system. These levels were then compared tomeasurements taken with the hard-wall baseline inlet, the uniform passive
liner and the segmented passive liner.Two sets of results were determined from these in-duct measurements.
First, the distribution of acoustical energy among the propagating m-order
modes was plotted for the 5425 RPM (approach) design fan speed, as shown
in Figures 5.11 to 5.13. These indicate that the active-passive liner caused a
small increase in non-target mode levels, both with control on and control off.
Second, the m = -9 target mode attenuation (sound power relative to hard-wall
baseline) was plotted, in Figure 5.14 as a function of fan speed over a range
49
that included between two and five radial components. Figure 5.14 presents asummary of the results of the ADP measurements of the adaptive segmentedliner as compared to the optimized uniform passive and segmented passiveliners. It shows the attenuation achieved by each liner over the design fanspeed range of the system, as well as one speed above this range. It may benoted from the figure that all tested liners appear to perform poorly at fan speed5625 RPM. This is the result of a partial null in fan rotor/stator tone generationat this speed. The important results demonstrated by Figure 5.14 are asfollows:
1. The adaptive segmented liner consistently outperforms the passiveliners over the range of speeds 5225-6225 RPM. This is particularlytrue at the system target design speed 5425 RPM and below, wherethe adaptive segmented liner outperformed the optimized uniformpassive liner by 8 to 10 dB.
2. On average, the uniform passive liner outperforms the adaptivesegmented liner when the active control element is inactive. This isexpected, as the passive portion of the adaptive segmented liner isonly approximately 60% as long as the uniform liner, and they are ofthe same design. However, it may be noted that at the lowest testspeed, 5225 RPM, the inactive adaptive segmented linerperformance exceeds that of the uniform passive by over 3 dB. Thisresults from passive absorption of the active Helmholtz resonators,whose natural tuning frequency is approximately 3 kHz (5000 RPM).This is an important aspect of the active resonator approach to activecontrol actuator implementation. It provides an acoustical boundarythat does not remove effective area from the passive liner, but ratherallows a re-tuning to frequency ranges for which the passive liner
may be ineffective.
3. The successful performance of the adaptive segmented liner at 6225RPM bodes well for the potential simplification of active controlsystems using the synergistic active/passive hybrid approach foraddressing multiple radial modes. At this speed, three radial modesare well cut on in the fan inlet duct, whereas the active system withtwo rows of actuators and two rows of error microphones wasdesigned only for control of fields with up to two radial modecomponents.
4. The ineffective performance of the passive segmented liner resultedfrom use of incorrect mode mixture data in the design of the liner.The design was based on preliminary measurements of theamplitude and phase relationships between modes (-9,0) and (-9,1)in the fan inlet. These proved to differ substantially from the actualmode mixtures, and led to incorrect specification for the impedance
of the initial, scattering liner segment.
50
Two series of measurements were conducted using the NASA far-field
microphone traverse system. In the first series, measurements were taken of
the full radiation pattern of the fan, fore and aft, for active control on and off
conditions with the active-passive liner. A barrier wall was then installed toblock aft-radiated noise and far-field measurements were taken for active
control on and off conditions with the active-passive liner as wall as for the
hard-wall baseline, uniform passive and segmented passive liners. Because
the ADP fan inlet noise is dominated by broadband components, thesemeasurements indicate no clear reduction of far-field noise with the active
control system on vs. off.
5.5 MODAL PHASE MEASUREMENTS AND TRANSLATION WITH POSITION.
The modal amplitudes and phases were measured at the ADP inlet
throat using the rotating rake in the same manner as in the ANC fan tests. A
computer code was written to calculate the modal phase at any position in the
inlet given the throat phase measurement and Mach number. The internal
contours of the inlet, including the center-body, were programmed into the
code. One hundred small steps were used to calculate the phase change with
each step representing a short cylinder using the local average Mach numberand inner and outer radii. The distances from the throat included a one inch
constant radius throat section, a four inch passive dissipative liner, and a
3.696-inch initial or set-up liner for the segmented liner case. Unfortunately the
segmented and hybrid liner tests had a different baseline than the uniform linerwith the latter inadvertently having an interstage liner in place during the test. A
fully hard interstage section was installed before the segmented and hybridliner tests.
Recall that some initial questionable input data was supplied by NASA
Engineers early in the program to allow design of the ADP suppressors. Thisinitial data was throat Mach number, M_, = -0.3, mode amplitude ratio, AI/Ao =
0.72, and mode phase difference at the liner entrance, _), - (I)0 = 17-7° at
corrected fan speed of 5425 RPM. More reliable data were taken during the
test entry in the 9 x 15 Anechoic Wind Tunnel during which the suppressors
were tested. The baseline tests for the uniform liner provided M_ = -0.3773,
ALIA0 = 0.427, _)_- _0= 3.23 °. The completely hardwall baseline tests to be used
for the segmented liner provided M_rt =-0.3773, ALIA0 = 1.33, and _), - _0 = -
21.37 °. Recall that the phase values have been translated to the leading edgeof the liners 8.696-inches downstream from the throat where the
measurements were made. Note that the input data "as tested" are
considerably different than the "as designed" values. As shown in thediscussion of the HAE and ANC suppressors, performance is very sensitive to
input conditions. Thus optimized passive liner designs for the ADP inlet werenot achieved.
5.6 TEST RESULTS
5.6.1 In-Duct Measurements
51
For each fan speed, the data measured at the inlet lip were translated tothe leading edge (nearest fan) of the uniform liner NSL96001 and these results
were used in the segmented liner sound propagation code discussed earlierin this report. The measured acoustic impedance as provided by NorthropGrumman engineers for liner NSL96001 were used for the theoreticalcalculations. The experimental acoustic power attenuation for the m = -9
modes and the theoretical comparison are shown in Figure 5.15. Note thatthere are two radials at the lower speeds and six radial modes at the higherspeeds considered here. The comparison is seen to be very good consideringthe highly complex experimental and theoretical procedures required here. The
one point at 6225 RPM may involve a resonance and reflection (third mode justcut-on) from the fan or termination that is not considered in the theory.
The same procedure was used for the segmented passive linerNSL96002. Again the acoustic impedance for the two liner sections asmeasured by Northrop Grumman were used in the theoretical calculations.
The comparison of the experimental and theoretical acoustic powerattenuation for the m = -9 radial modes are shown in Figure 5.16. Thecomparison is seen to not be as good as for the uniform liner shown above. At
low fan speeds where only two modes are present, the agreement isreasonable, but as more modes propagate at the higher speeds the
experiment is showing greater attenuation than the theory predicts. Anyexplanation of the theory-data comparison is pure conjecture at this time, but itshould be recalled that the segmented liner is very sensitive to the modal inputvalues and these are not known with great precision.
Some interesting calculations were performed for the 4-inch longpassive section of the active-passive hybrid suppressor NSL96003. Theamplitude and phase of all of the input radial modes were varied to providemaximum acoustic power attenuation of the m = -9 radial modes. Thecalculation started at the low frequencies where only two radial modespropagate and progressed to the higher frequencies where four radial modes
propagate using the previous optimized calculation as the new starting point.This calculation represents an attempt at estimating the performance of the
active-passive hybrid suppressor if the active section acts only to modify theinput modal structure which is then fed to the passive section for suppression.The calculations are shown in Figure 5.17 as the solid round symbols. Theexperimental results for the active-passive hybrid suppressor are also shown
with the drivers on and off. With the drivers off the suppression is provided bythe passive section and by the passive effect of the driver resonator cavities.These experimental results in general are considerable but lower than thetheoretical results. With the drivers turned on the experimental results areseen to generally exceed the calculated results. The experimental results nowencompass several mechanisms. One is of course the modification of the
input modes to maximize the passive liner suppression as was included in thecalculations. In addition there is the passive suppression of the driverresonators and probably a modal reflection effect due to the active section
which all together produce the high observed attenuation.
52
5.6.2 Far-Field Radiation Considerations
The ADP fan noise tones at twice blade passage (2BPF) are the tones of
interest in the far-field especially near the suppressor design'speed where only
two radial modes of the m = -9 mode propagates. The protrusion of these
tones above the broadband background are shown in Figure 5.18. It is seen
that the tones stand out only about 9 dB above the background for the
maximum case and only about 4 to 6 dB around the design speed. This is not
enough margin to adequately study the large attenuation achieved by the active-
passive hybrid suppressor. Since the in-duct measurements have shown thevalidity of the suppressor concept, the far-field data will not be used at this time.
53

54
6 - COMMERCIALIZATION OF HYBRID LINER CONCEPT
Aircraft noise is one of the most serious long-term environmentalproblems facing the aviation industry today. Vehement opposition by airportneighbors and community groups has constrained capacity and limitedoperations at many of the nation's major airports. Airport proprietors and civicofficials, in turn, are pressuring the US Congress and the federal governmentto adopt stricter aircraft noise rules. Air carriers, frustrated by the multiplicity ofrestrictive local airport rules, are also pressuring the US Government topreempt the rights of airport proprietors to restrict aircraft operations.
Given the strong sentiments in the US and Europe for strong new ruleson aircraft noise, it is clear aircraft owners and operators will be forced either toreplace noisier non-compliant aircraft or retrofit them to meet the newregulations. The exact timetables vary among the proposals, but all wouldhave the effect of cutting short the normal lives of these aircraft.
The overall objective of this venture is to develop superior jet engineacoustic treatments that will reduce noise emissions and satisfy or exceedanticipated future federal and local noise regulations. Northrop GrummanCorporation (NGC) has vast amounts of experience in designing and buildingacoustic treatments for commercial jet engine nacelles. Many of the worldscommercial aircraft including the B747, B767, MD11, Fokker 100, A300, A310,and A330 have acoustic treatments designed and manufactured by NGC.Current Federal Aviation Administration (FAA) Federal Aviation Regulation (FAR)
Part 36 Stage 3 and impending new noise regulations being implemented inEurope and Asia threaten to render obsolete many of the worlds currentcommercial aircraft, some less than 20 years old. There are still many older
higher noise level Stage 2 aircraft that have a productive economic life expectedto be over 40 years. In addition, more stringent noise regulations, =Stage 4",are being debated within the international aviation groups as local airportcommunities, especially in Europe, demand restricted hours of operation andeven quieter aircraft. New commercial aircraft designs are now specifyingnoise margins, beyond Stage 3, of at least 4-6 dB for each of the three requiredground measurement locations (takeoff, sideline and approach), thus makingthe use of an all-passive acoustic treatment difficult. Limitations in inletacoustic area and aerodynamic considerations dictate that a new technologywill be needed to meet future aircraft noise requirements.
6.1 COMMERCIALIZATION PLAN SUMMARY
An economical solution is needed to reduce aircraft engine noise tolevels that will meet FAR 36 Stage 3 and future noise regulations. Based oneconomic analysis for a mid-sized aircraft, hush kits sell for $3M and newengine costs are $12M. The cost of replacement aircraft range from $35M(737-600) to $175M (747-400). Hush kit development is the cost-effectivesolution if aircraft performance is not compromised. In addition, low cost,lightweight, and highly efficient duct attenuators for new aircraft offer a uniquesolution to future noise requirements. Based on economic analysis there are a
55
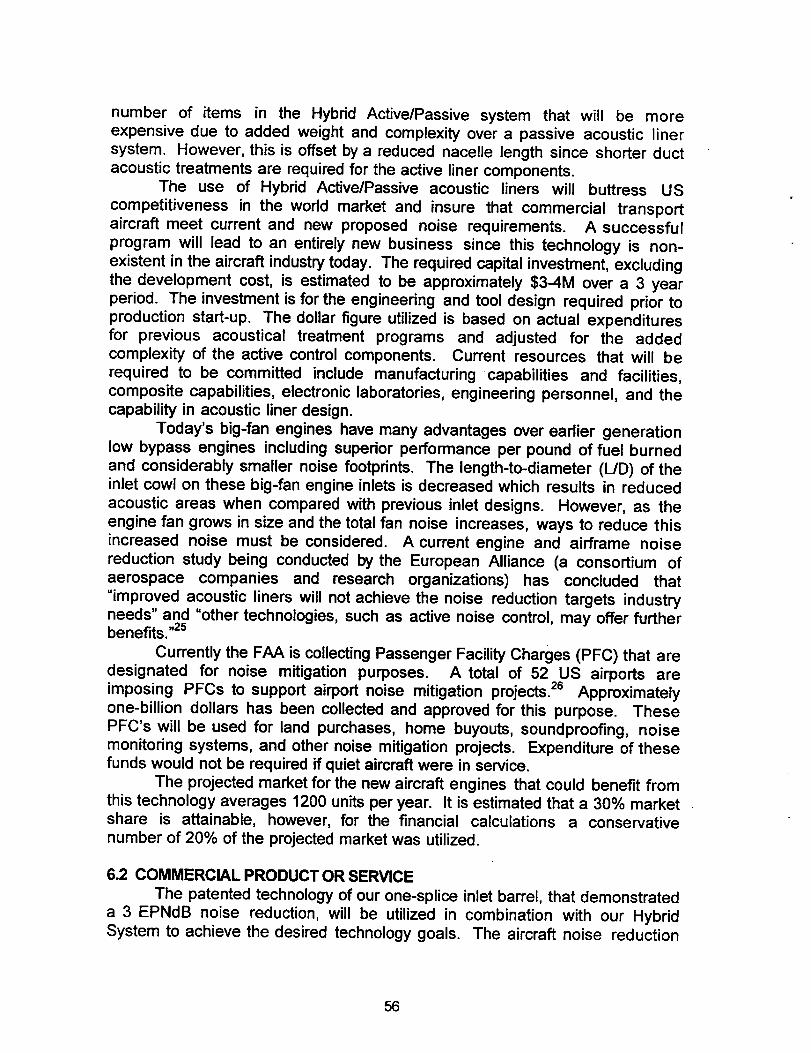
number of items in the Hybrid Active/Passive system that will be moreexpensive due to added weight and complexity over a passive acoustic linersystem. However, this is offset by a reduced nacelle length since shorter ductacoustic treatments are required for the active liner components.
The use of Hybrid Active/Passive acoustic liners will buttress UScompetitiveness in the world market and insure that commercial transportaircraft meet current and new proposed noise requirements. A successfulprogram will lead to an entirely new business since this technology is non-existent in the aircraft industry today. The required capital investment, excludingthe development cost, is estimated to be approximately $3-4M over a 3 yearperiod. The investment is for the engineering and tool design required prior toproduction start-up. The dollar figure utilized is based on actual expendituresfor previous acoustical treatment programs and adjusted for the addedcomplexity of the active control components. Current resources that will berequired to be committed include manufacturing capabilities and facilities,composite capabilities, electronic laboratories, engineering personnel, and thecapability in acoustic liner design.
Today's big-fan engines have many advantages over earlier generationlow bypass engines including superior performance per pound of fuel burnedand considerably smaller noise footprints. The length-to-diameter (L/D) of theinlet cowl on these big-fan engine inlets is decreased which results in reducedacoustic areas when compared with previous inlet designs. However, as theengine fan grows in size and the total fan noise increases, ways to reduce thisincreased noise must be considered. A current engine and airframe noise
reduction study being conducted by the European Alliance (a consortium ofaerospace companies and research organizations) has concluded that"improved acoustic liners will not achieve the noise reduction targets industryneeds" and "other technologies, such as active noise control, may offer furtherbenefits."2s
Currently the FAA is collecting Passenger Facility Charges (PFC) that are
designated for noise mitigation purposes. A total of 52 US airports areimposing PFCs to support airport noise mitigation projects. 26 Approximatelyone-billion dollars has been collected and approved for this purpose. These
PFC's will be used for land purchases, home buyouts, soundproofing, noisemonitoring systems, and other noise mitigation projects. Expenditure of thesefunds would not be required if quiet aircraft were in service.
The projected market for the new aircraft engines that could benefit from
this technology averages 1200 units per year. It is estimated that a 30% marketshare is attainable, however, for the financial calculations a conservativenumber of 20% of the projected market was utilized.
6.2 COMMERCIAL PRODUCT OR SERVICE
The patented technology of our one-splice inlet barrel, that demonstrateda 3 EPNdB noise reduction, will be utilized in combination with our Hybrid
System to achieve the desired technology goals. The aircraft noise reduction
56
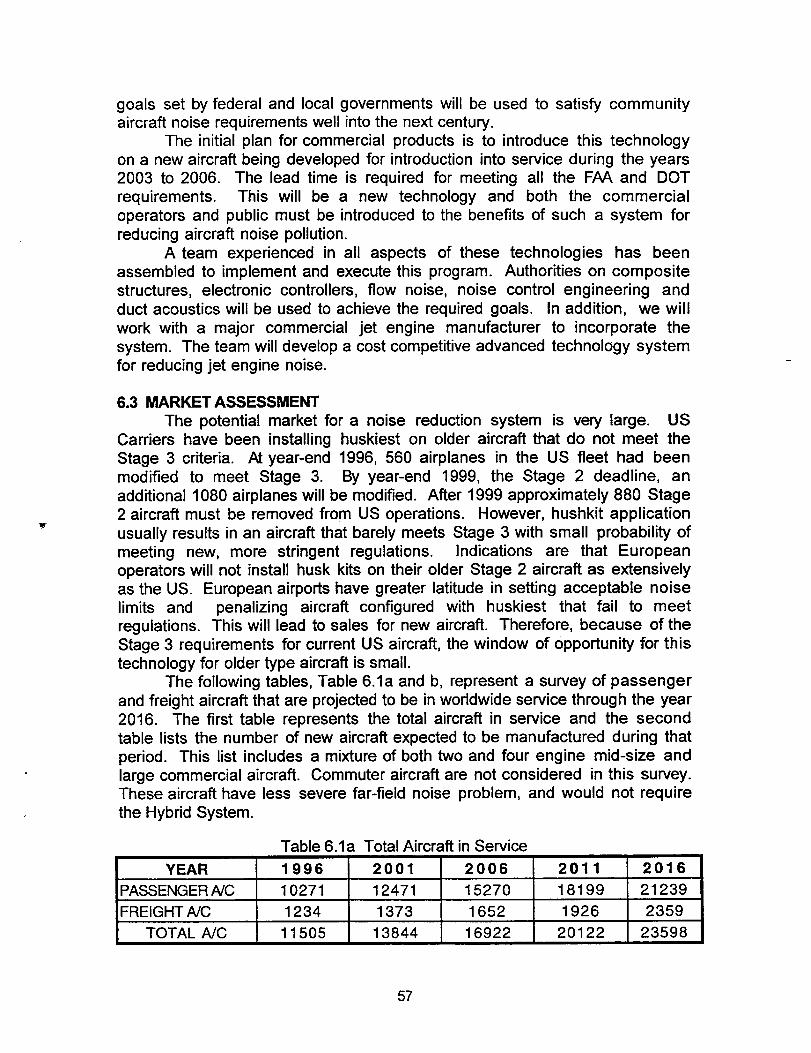
goals set by federal and local governments will be used to satisfy communityaircraft noise requirements well into the next century.
The initial plan for commercial products is to introduce this technology
on a new aircraft being developed for introduction into service during the years
2003 to 2006. The lead time is required for meeting all the FAA and DOT
requirements. This will be a new technology and both the commercial
operators and public must be introduced to the benefits of such a system for
reducing aircraft noise pollution.
A team experienced in all aspects of these technologies has been
assembled to implement and execute this program. Authorities on compositestructures, electronic controllers, flow noise, noise control engineering and
duct acoustics will be used to achieve the required goals. In addition, we will
work with a major commercial jet engine manufacturer to incorporate the
system. The team will develop a cost competitive advanced technology system
for reducing jet engine noise.
6.3 MARKET ASSESSMENT
The potential market for a noise reduction system is very large. US
Carriers have been installing huskiest on older aircraft that do not meet the
Stage 3 criteria. At year-end 1996, 560 airplanes in the US fleet had been
modified to meet Stage 3. By year-end 1999, the Stage 2 deadline, an
additional 1080 airplanes will be modified. After 1999 approximately 880 Stage
2 aircraft must be removed from US operations. However, hushkit application
usually results in an aircraft that barely meets Stage 3 with small probability of
meeting new, more stringent regulations. Indications are that European
operators will not install husk kits on their older Stage 2 aircraft as extensively
as the US. European airports have greater latitude in setting acceptable noise
limits and penalizing aircraft configured with huskiest that fail to meet
regulations. This will lead to sales for new aircraft. Therefore, because of the
Stage 3 requirements for current US aircraft, the window of opportunity for this
technology for older type aircraft is small.
The following tables, Table 6.1a and b, represent a survey of passenger
and freight aircraft that are projected to be in worldwide service through the year
2016. The first table represents the total aircraft in service and the second
table lists the number of new aircraft expected to be manufactured during that
period. This list includes a mixture of both two and four engine mid-size and
large commercial aircraft. Commuter aircraft are not considered in this survey.These aircraft have less severe far-field noise problem, and would not require
the Hybrid System.
YEAR
PASSENGER A/C
FREIGHT A/C
TOTAL A/C
Table 6.1a Total Aircraft in Service
1996 2001 2006
10271 12471 15270
1234 1373 1652
11505 13844 16922
2011 2016
18199 21239
1926 2359
20122 23598
57
YEAR
Table 6.1b New Aircraft To Be Manufactured*
TOTAL A/C
1997- 2002- 2012-
3708
2007-
2001 2006 2011 2016
PASSENGERNC 3626 3509 4040 4364 15539
FREIGHTA/C 82 111 212 218 623
3620 4252
* 90% Two-engines, 10% Four engines
4582
CUM
TOTAL
16162
Market studies forecast approximately 730 new aircraft per year for the
next ten years or 7300 aircraft with 16,000 engines as listed in Table 6.1c.
Table 6. lc Aircraft Forecast
I Currently 1998-2007 2007 Year-End FleetAircraft 11,500 7300 16,800"
I Engines >25,000 16,000 36,500* Assumes 2000 aircraft retired
Of the foregoing total market, financial projections were based on
production start up in 2000 and obtaining a very conservative 12.9% of the newaircraft market, as shown in Table 6.2.
Table 6.2 New Aircraft Sales Forecast
YEAR 2 000 200 1 2 002 200 3 2 004 TOTAL
NEW AIRCRAFT 730 730 730 73.0 730 3650SALES
ENGINES 1460 1460 1460 1460 1460 7300
FORECAST SALFS 91 152 213 245 245 946
% OF MARKET 6.25% 14.58% 16.67% 16.67%10.42% 12.90%
It is estimated that during the years from 2002-2006 we will be able tocapture 10-15% of the new aircraft markets. This percentage will increase in
succeeding years as the airport traffic volume increases and the overall noise
levels increase. During the years 2007-2011 the market percentage is
expected to rise to 25% and hold through the year 2016.
There are three known solutions to the noise problem, re-engine the
aircraft, install hush kits, and purchase replacement aircraft. A re-engine
program will cost approximately $12M per engine. Hush kits cost $1-3M per kit
but increase fuel consumption. They require hush kit ejectors which impose
drag and weight penalties. Replacement aircraft start at $35M or greater and
are designed to meet Stage 3 requirements. These new aircraft would have a
58
difficulty meeting a "Stage 4" criteria. Our solution will cost approximately $1-1.3M per unit (depending on the type engine) and provide "Stage 4" results forthese new aircraft.
There is a major opportunity to capture a large share of the market giventhe absence of technological and economic solutions currently available. Thisopportunity would also apply to the foreign marketplace. Based on projectionsof commercial aircraft engine active noise control research being conducted inEurope, we have a two year lead on their research development.
6.4 AIRCRAFT CERTIFICATION REQUIREMENTS
Certification of the Hybrid System requires the approval of a number of
federal organizations prior to introduction into the commercial aircraft fleet. Inaddition, the flight safety issues for this system must be understood and
implemented. Airworthy requirements for the nacelle, engine, and aircraft mustbe determined and tests conducted in order to meet compliance.
The issue of fan blade-out requirements for the system is an additionalconcern because of the potential of installing the acoustic drivers in the critical
blade-out zone. Fan blade fragments must not penetrate the nacelle if theacoustic drivers are installed within +/-15 ° angle of the center of the fan plane ofrotation. These requirements must be satisfied by blade-out qualification tests
and/or analysis.The matter of system durability will affect the sale of the system. The
acoustic drivers, controllers and error microphones must have sufficientdurability to convince the operators to purchase this system. Aspects such ascomponent repair and ease of replaceability must be addressed. During the
next stage of development, on-site calibration procedures of the individual andcombined components must be developed.
6.5 ENVIRONMENTAL REQUIREMENTS
Aircraft nacelles are exposed to severe environments. Each of the hybrid
system components must be tested under conditions that will be defined byFAA regulations. The FAA or company Designated Engineering Representative(DER) will specify which of the components will require test and which can bequalified by analysis. It is expected that components that are totally new incommercial use will undergo extensive testing for specific life cycles. Asampling of some of the environmental conditions that must be considered arelisted below:
• Sonic fatigue• Vibration
• Impact resistance• Erosion resistance
• Salt spray• Freeze/thaw effects
• Lightening strike• EMI protection• Water and skydrol absorption resistance and drainage requirements
59
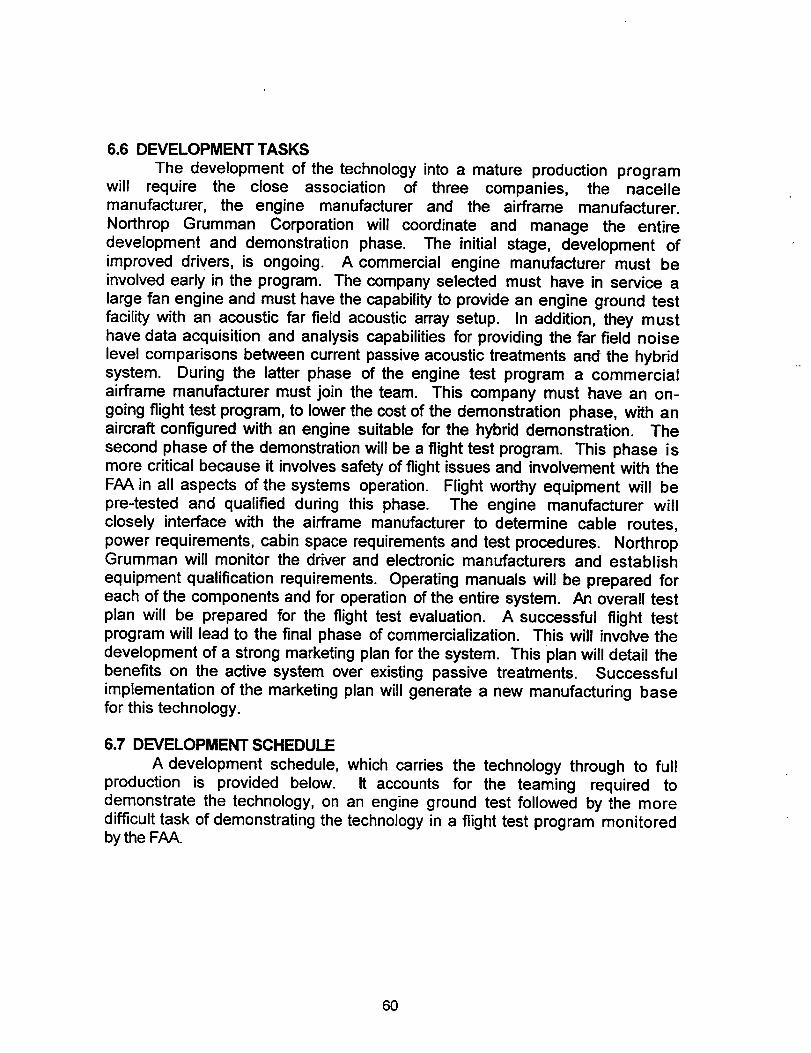
6.6 DEVELOPMENTTASKSThe development of the technology into a mature production program
will require the close association of three companies, the nacellemanufacturer, the engine manufacturer and the airframe manufacturer.Northrop Grumman Corporation will coordinate and manage the entiredevelopment and demonstration phase. The initial stage, development ofimproved drivers, is ongoing. A commercial engine manufacturer must beinvolved early in the program. The company selected must have in service alarge fan engine and must have the capability to provide an engine ground testfacility with an acoustic far field acoustic array setup. In addition, they musthave data acquisition and analysis capabilities for providing the far field noiselevel comparisons between current passive acoustic treatments and the hybridsystem. During the latter phase of the engine test program a commercialairframe manufacturer must join the team. This company must have an on-going flight test program, to lower the cost of the demonstration phase, with anaircraft configured with an engine suitable for the hybrid demonstration. The
second phase of the demonstration will be a flight test program. This phase ismore critical because it involves safety of flight issues and involvement with the
FAA in all aspects of the systems operation. Flight worthy equipment will bepre-tested and qualified during this phase. The engine manufacturer willclosely interface with the airframe manufacturer to determine cable routes,power requirements, cabin space requirements and test procedures. NorthropGrumman will monitor the driver and electronic manufacturers and establish
equipment qualification requirements. Operating manuals will be prepared foreach of the components and for operation of the entire system. An overall testplan will be prepared for the flight test evaluation. A successful flight testprogram will lead to the final phase of commercialization. This will involve the
development of a strong marketing plan for the system. This plan will detail thebenefits on the active system over existing passive treatments. Successfulimplementation of the marketing plan will generate a new manufacturing basefor this technology.
6.7 DEVELOPMENT SCHEDULE
A development schedule, which carries the technology through to fullproduction is provided below. It accounts for the teaming required todemonstrate the technology, on an engine ground test followed by the moredifficult task of demonstrating the technology in a flight test program monitoredby the FAA.
60
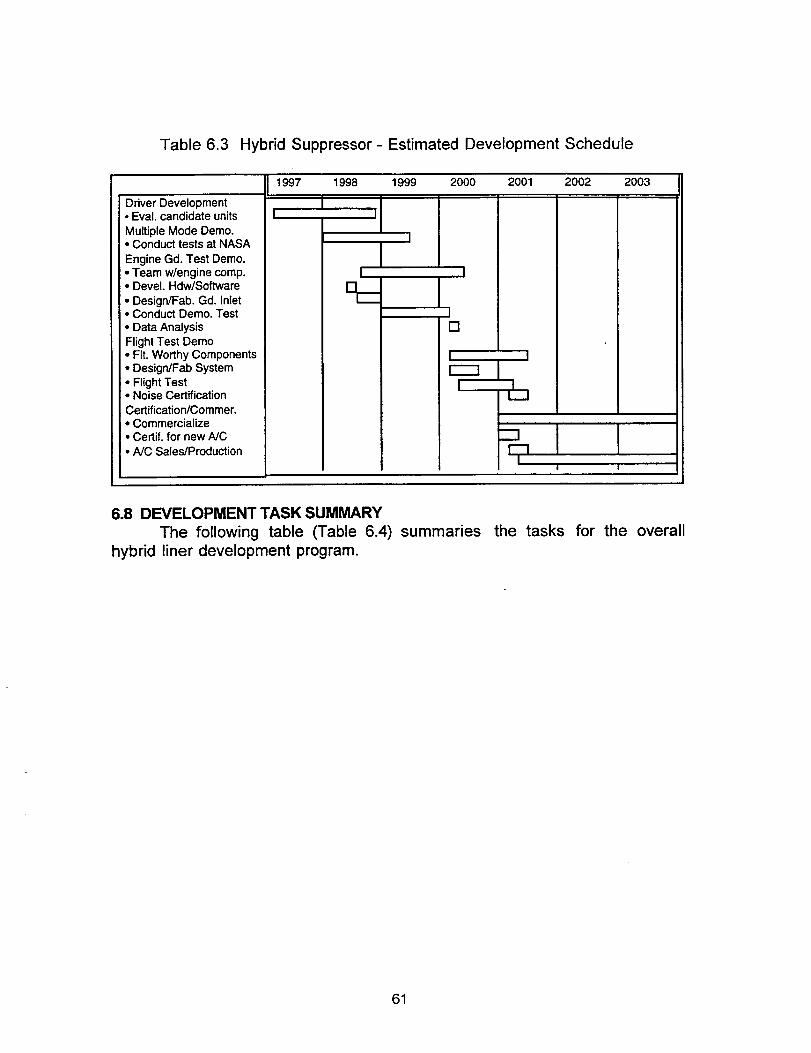
Table 6.3 Hybrid Suppressor- Estimated Development Schedule
Driver Development• Eval. candidate units
Multiple Mode Demo.• Conduct tests at NASA
Engine Gdo Test Demo.• Team w/engine comp.• Devel. Hdw/Software
• Design/Fab. Gd. Inlet• Conduct Demo. Test
• Data AnalysisFlight Test Demo• Fit. Worthy Components• DesigrdFab System
• Flight Test• Noise Certification
Certification/Commer.• Commercialize• Certif. for new NC
• A/C Sales/Production
1997 1998 1999 2000 2001 2002 2003
I
I--
I.J[]
-'1
I r
6.8 DEVELOPMENT TASK SUMMARY
The following table (Table 6.4)
hybrid liner development program.
summaries the tasks for the overall
61
Table 6.4
Hybrid Active/Passive Noise SuppressorDevelopment Tasks
TASK Northrop Grumman Responsibility Engine Company Responsibility Airframe Manufacturer
Responsibility
• Program Prime Collaboration CollaborationManagement andCoordination
• Phase I Development of high intensity NoneFeasibility Study acoustic ddvers.
• Phase II
Full Scale EngineGround Test
• Phase IIIFlight TestDemonstrationProgram
• Phase IVCertification andCommercialization
Overall design and fabrication ofinlet modifications required forinstallation of Hybrid System.Hardware and softwaredevelopment. Coordination of alltest activities.
Overall design and fabrication ofinlet and flight worthy modificationof hardware. Hardware/softwaremodification for flight. Coordinationof all test activities.
Overall design and fabrication ofHybrid System for environmentaltests. All documentation forcertification of Hybrid system andcomponents,
Provide induct noise levels to
permit the design of the HybridSuppressor treatment. Provideinduct noise levels for driverdevelopment. Conduct additionalmode testing as part of the NASAAST Program.
Provide induct noise levels to_ermit design of Hybridtreatment. Provide an engine and'engine test stand for staticground test. Provide dataacquisition, data reduction, andevaluation of results. Provideoperational consultation asrequired.
Provide induct noise levels to)ermit the design of the HybridSuppressor treatment. Provideoperational consultation asrequired.
Provide induct noise levels topermit the design of the HybridSuppressor treatment. All enginerelated certification activitiesincluding engine control andhardware modifications andcertification documentation.
None
Provide aircraft for flighttest program. Provideacoustic test site fornoise certificationprogram.
Prime responsibility forcertification activities.Provide certification testplan, aircraft andassociated support.
62
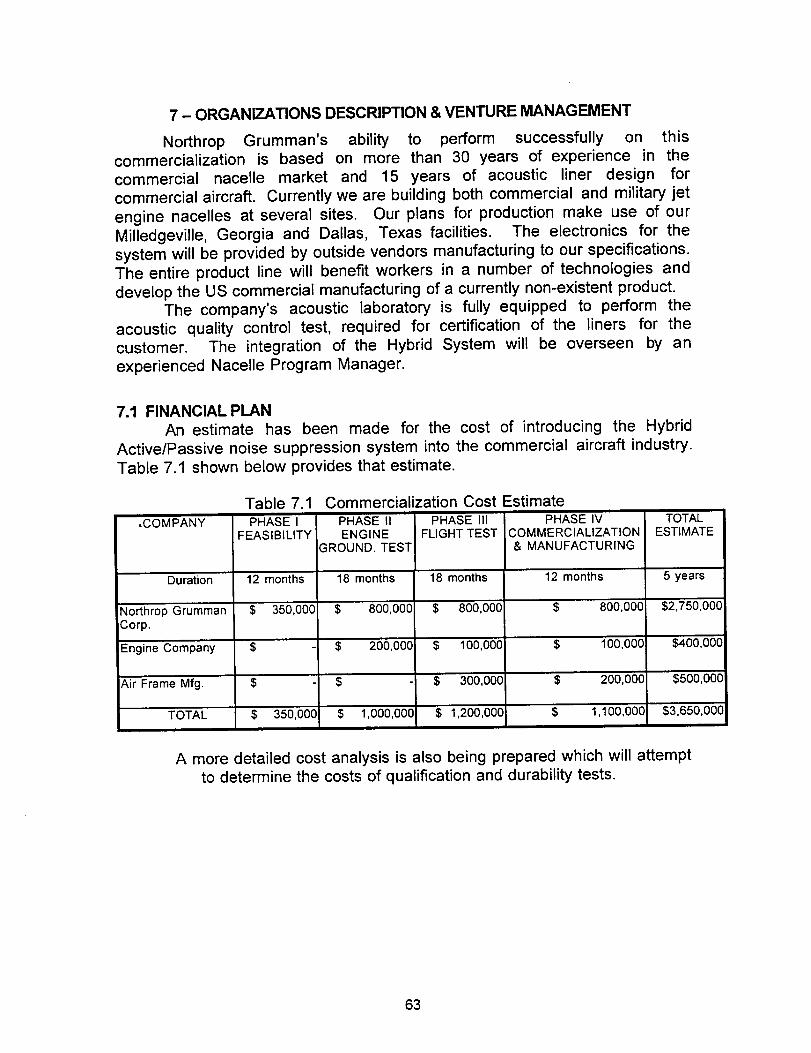
7 - ORGANIZATIONS DESCRIPTION & VENTURE MANAGEMENT
Northrop Grumman's ability to perform successfully on thiscommercialization is based on more than 30 years of experience in thecommercial nacelle market and 15 years of acoustic liner design forcommercial aircraft. Currently we are building both commercial and military jet
engine nacelles at several sites. Our plans for production make use of ourMilledgeville, Georgia and Dallas, Texas facilities. The electronics for thesystem will be provided by outside vendors manufacturing to our specifications.The entire product line will benefit workers in a number of technologies anddevelop the US commercial manufacturing of a currently non-existent product.
The company's acoustic laboratory is fully equipped to perform theacoustic quality control test, required for certification of the liners for thecustomer. The integration of the Hybrid System will be overseen by anexperienced Nacelle Program Manager.
7.1 FINANCIAL PLAN
An estimate has been made for the cost of introducing the HybridActive/Passive noise suppression system into the commercial aircraft industry.Table 7.1 shown below provides that estimate.
,COMPANY
Table 7.PHASE I
FEASIBILITY
Duration 12 months
Northrop Grumman $ 350,000Corp.
,Engine Company $
Air Frame Mfg.
TOTAL
$ -I
$ 350,000
Commercialization Cost EstimatePHASE IIENGINE
GROUND. TEST
PHASE IIIFLIGHT TEST
PHASE IVCOMMERCIALIZATION& MANUFACTURING
TOTALESTIMATE
18 months 18 months 12 months 5 years
$ 800,000 $ 800,00G $ 800,000 $2,750,000
$ 200,000 $ 100,000 $ 100,000 $400,000
$ 300,000
$ 1,200,000
° $ 200,000
$ 1,100,000$ 1,000,000
$500,000
$3,650,000
A more detailed cost analysis is also being prepared which will attemptto determine the costs of qualification and durability tests.
63

64
REFERENCES
1. Published goals of the NASA Advanced Subsonic Transport program.
2. US Patent 5,119,477, Hersh et al., issued June 2, 1992.
3. Sawdy, D.T., Beckemeyer, R.J., and Patterson, J.D., "Optimum SegmentedAcoustic Liners for Flow Ducts," A76-25129, Paper D6, 90 th MeetingAcoustical Society of America, San Francisco, Ca., November 3-7, 1975.
4. Sawdy, D.T., Beckemeyer, R.J., and Patterson, J.D., "Analytical andExperimental Studies of an Optimum Multisegment Phased Liner NoiseSuppression Concept," NASA CR-134960, 76N22976, May 1976.
5. Patterson, J.D., Sawdy, D.T., and Beckemeyer, R.J., "Experimental-AnalyticalCorrelation of Optimum Duct Acoustic Liner Performance," A76-25856,ASME Preprint 76-GT-126, ASME Gas Turbine Conference and Productshow, New Orleans, La., March 21-25, 1976.
6. Lester, H.C., and Posey, J.W., "Duct Liner Optimization for TurbomachineryNoise Sources," NASA TM X-72789, November 1975.
7. Lester, H.C., and Posey, J.W., Optimal One-Section and Two-SectionCircular Sound-Absorbing Duct Liners for Plane-Wave and MonopoleSources without Flow," NASA TN D-8348, December 1976.
8. Clark, T.L., Ganz, U.W., Graf, G.A., and Westall, J.S., "Analytic Models ofDucted Turbomachinery Tone Noise Sources," NASA CR-132443, 1974.
9. Baumeister, K.J., "Evaluation of Optimized Multisectioned Acoustic Liners",AIAAJournal, Vol. 17, No. 11, pp.1185-1192, November 1979.
10. Rice, E.J., "Modal Propagation Angles in Ducts with Soft Walls and TheirConnection with Suppressor Performance," AIAA Paper 79-0624, March1979.
11. Rice, E.J., "Inlet Noise Suppressor Design Method Based Upon theDistribution of Acoustic Power with Mode Cutoff Ratio," NASA CP-2001, Vol.3, p. 883, 1976.
12. Rice, E.J., "Multimodal Far-Field Acoustic Radiation Pattern Using Mode
Cutoff Ratio," ..AIAAJournal, Vol. 16, pp. 906-911, September 1978.
13. Rice, E.J., "Optimum Wall Impedance for Spinning Modes-A Correlation withMode Cutoff Ratio," Journal of Aircraft, Vol. 16, No. 5, pp. 336-343, May 1979.
14. Baumeister, K.J., "Generalized Wave Envelope Analysis of SoundPropagation in Ducts With Stepped Noise Source Profiles and Variable AxialImpedance," NASA TM X-71674, March 1975.
15. Rice, E.J., "Attenuation of Sound in Soft-Walled Circular Ducts," AFOSR-
UTIAS Symposium on Aerodynamic Noise, Toronto, Canada, May 20-21,1968.
65
16.Zorumski, W.E., and Mason, J.P., "Multiple Eigenvalues of Sound-AbsorbingCircular and Annular Ducts," Journal Acoustic. Soc. Am., Vol. 55, No. 6, June1974.
17. Zorumski, W.E., "Acoustic Theory of Axisymmetric Multisectioned Ducts,"NASA TR R-419, May 1974.
18. Rice, E.J., "Spinning Mode Sound Propagation in Ducts with AcousticTreatment and Sheared Flow," AIAA 75-519, also NASA TM X-71672, March1975.
19. Goldstein, M.E., Aeroacoustics, McGraw-Hill International Book Company,New York, NY.
20. Tyler, J.M., Sofrin, T.G., "Axial Flow Compressor Noise Studies," SAE Trans.,Vol. 70, 1962, pp. 309-332.
21. Morgan, D.R.,,"Analysis of Multiple Correlation Cancellation Loop With a
Filter in the Auxiliary Path," IEEE Trans. Acoustic., Speech, SignalProcessing, Vol. ASSP-28, pp. 454-467, August 1980.
22. Heidelberg, L.J., Hall, D.G., "Inlet Acoustic Mode Measurements Using aContinuously Rotating Rake," Journal of Aircraft, Vol. 4 No. 32 pp. 761-763,July-August 1995.
23. Heidelberg, J.J., Hall, D.G., Bridges, J.E., and Nallasamy, M., "A UniqueDucted Fan Test Bed For Active Noise Control and AeroAcoustics
Research," NASA TM 107213, AIAA-(6-1740, Second AIANCEASAeroacoustics Conference, May, 1996.
24. Rice, E.J., "Aircraft Inlet Noise Radiation Model, Static, Flight and BellmouthEffect," AIAA 96-1774, May 1996.
25."Europe Eyes Further Noise Control Studies", Aviation Week & SpaceTechnology, p. 49, March 24,1997.
26. "PFS's," Airport Noise Report, Vol. 9, Number 8, May 19, 1997.
66

ILLUSTRATIONS
67

68
I.L
EQ_0
ao-
om
cD"-'10
z Ec G)
W.>
E_c_
om Lore
rTo"10
c).E
o_
¢I)C/)
n
.m
oDi,B
,.Q
7-
c-
E
0
i--
EO
°_
oNI.B
r7
o_
co_
._J
c_ol
cO
_D
co_
°_
¢1)
n
o
I-
c_
,.-J
.>_
(I)C_
n
69
8._j _-
_oRWJ_rroO_LU n-rz
_>_ o_
_ rr ZD"_ "-5o_WO
CD
WO3
1.1.1
@ _o,,, 3
__
_ __ _
, _,,o6_Z
Z Z
r/? (_
I-- \ 0 n'O _ _
o o_
i---
e-o-
f-
E
g _
_ o
"oo
Et-O
7O
G)
m •
'10 Q3
C_'_
_- C
..._0
_ .o_
_._-m
0>
LL
I'
I
I
I
I
I
//
t .
i."
o
0
°
°
l, o
I
\
I
I
I
E
e-
0 0 _
I •
I
I
I
I
i "
I i
I
° i
I
• I
I
" I
".. I
,,
I I I
0 0 (D!
0 0 0I I I
cO0
0
0
cO
0
CY
0
c5
cooO
!
0o_
rr
oc
°_
_3
n-
71
E
-o_.
o_-a.
(_ --_•---. 0
e4
o.o
.Q__"r" L,.
._oa c-
_o
0
mi,
i
a3o
E
0") O_ a,1vv e,_
• (D O_
0 0 _
(D
d
\
o
" II !
' 1t
•|ll \
°
I I
_ oo d
I
°
1
I
|
I
I
I
I
I
I
I
I
!
I
I
°
O40
I
d!
0
d
d
b-d
o
d
d
00
o
oJo
d
, 0
0 OI I
0
00c"
co,_
rr"
72
FIGURE 3.1 cRatio of Wall Pressure to Space-Average Sound Pressure vs. Amplitude
Ratio and Phase Difference Between Modes (-9,0) and (-9,1)
18(
16(
14C
1L_
100
8O
6O
40
2O
Ratio of Wall _e to Average Pressure Across Duct
1.0
.'..\_ /
o / " \ :° k
-ill//'' tl ,../ /-0.5 -0.0 0.5 1.0
/
o"
/
(-1.0 1.5
Log An_itude Rato of Second to F31stR=:i_ Mode
73
PIEZD ACTUATOR
AMPLIFIER BOX
ALUMINUM RING
PLASTIC RING
ADAPTOR PLATE
4,4000
RGURE 3.2
Active Resonator and Actuator Mounting Detail for ActiveSegment of Adaptive Segmented Liner in ANCF Test
Typical of 32 Spaced 4.5 inches Axially and 22.5 ° Azimuthally
74
140
ANCF Actuator Terminated Tube Phase Response
4.5 inch Diameter Tube, 10 volt Excitation
i
_1
03
¢-
135
130
125
120
115
110
105
100
95
90
360
330
3OO
27O
240
210
180
150
120
90
6O
3O
o
e of 49
d DeviationI
45
0 200 400 600 800 1000 1200 1400
Frequency - Hz
ANCF Actuator Terminated Tube Phase Response
4.5 Inch Diameter Tube, 10 volt Excitation
3.5 _"{3
i
C3 o
°_
2.5a
2 _e-
I_Average of 49
-"_ Standard Deviation
d
/\
0.5
0
1600
36
33
3O
27
24 _a
i
21 ,--o
._
18 _
15Q
¢-
9 -03
200 400 600 800 1000 1200 1400
Frequency - Hz
FIGURE 3.3 a, bAmplitude and Phase Response and Deviations for Actuators
Used in ANCF Adaptive Segmented Liner Tests
1600
75
'.'<_/ZO
t_
#.-
bJZ0
O.1:2
W _"
zu, _u
_o_1
/
o 0
0 0
\
1
°1o
m
I
II, _
I
"N
}-,,-
U 1--
121..
Ev_.- "T (/)
ILl o
_.o_
,-.j
.oo
m2Ea.
L)
76
Jov
"o
v
m
q)
n7
o% o'_
7oo
°_
c-O
°_
0")
UJ
I
77
g
< /I-.k ,.
X ..
\\
.- o o d o 0 o," o, o o -7
epn_!ldwV lepoI_ leu0!suew!@U0N
0
0
I
0 0c-
O o-
n
• ._
0
n,o ..o
N
0
0
0
0
%
0
li,,.I .
• d
..-" _ .....U
\ ._N
(N O
o Z
.................... i.-_................... ,,,. o
.- 0 o d o o o o o o_-,,
epn;!ldWV lep0IAl leu0!suew!(S-UON
.... I .... I .... I ....IX(.II .... I .... _'''I .... I .... I ....
mLL
= -./
I.l. /...
_ / "<
//
f
vvv
0
0
0 rr
!
0 0
_5 .m_
N
0
0 z
0
0 _ _0 _I" _ 0 _ _ _ cO 0 °
,- d o d o o o o o o" _-
epn_!ldu_v lep01Al leuo!suewK]-U0N
0
O0
o
nnn<
LL0Z<
m-<T
°--
o
LU_I1_ r,"
o
I.i.cO
o--
°--
°--
C3
ID
r-
O(D
o°--
o
c-I-
78
I I I
0
\\
J
IItilii i/
//
i/
i/
//
//
,/
c,I
0I
!
!
I
0
o¢..)
1.)
0
.1
<
1.)
<
,41.)
oouelst.soz zouF'I
8O
<0
° __c5
"7, C
"r, _
o -_ "_
I
<0
° _,,,I
oourls_.soI Iou_.7
81
e-
E _
0 0
_ 0
<E0
"_'_
II
0
_0
°_
_u
sI_q!o_p 'uo!lenu_lle _u!"l
82
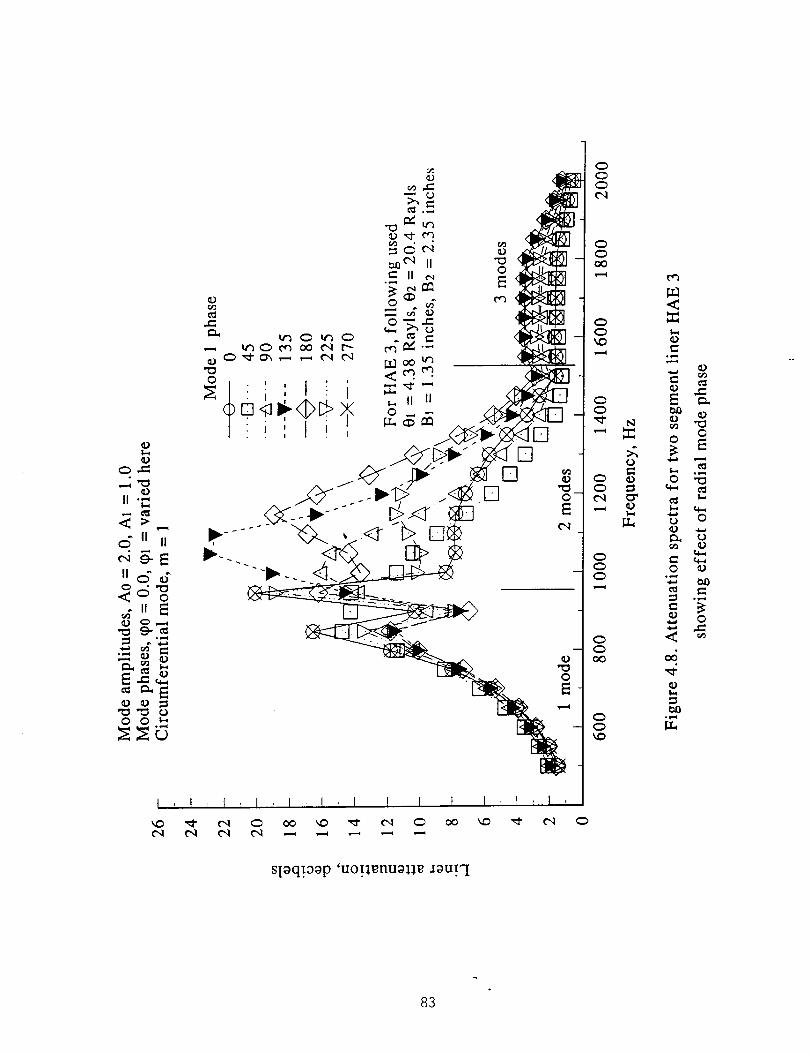
II "'_
<>
o" wl u
0
0.If E
""q
0 0 _
0
[]
000o,1
<
[z_ o o
0 ""_
0
0_0 o4
.,-_
I I I I
sloq_.oo p 'uo._lenu_11_ _ou!"I
83
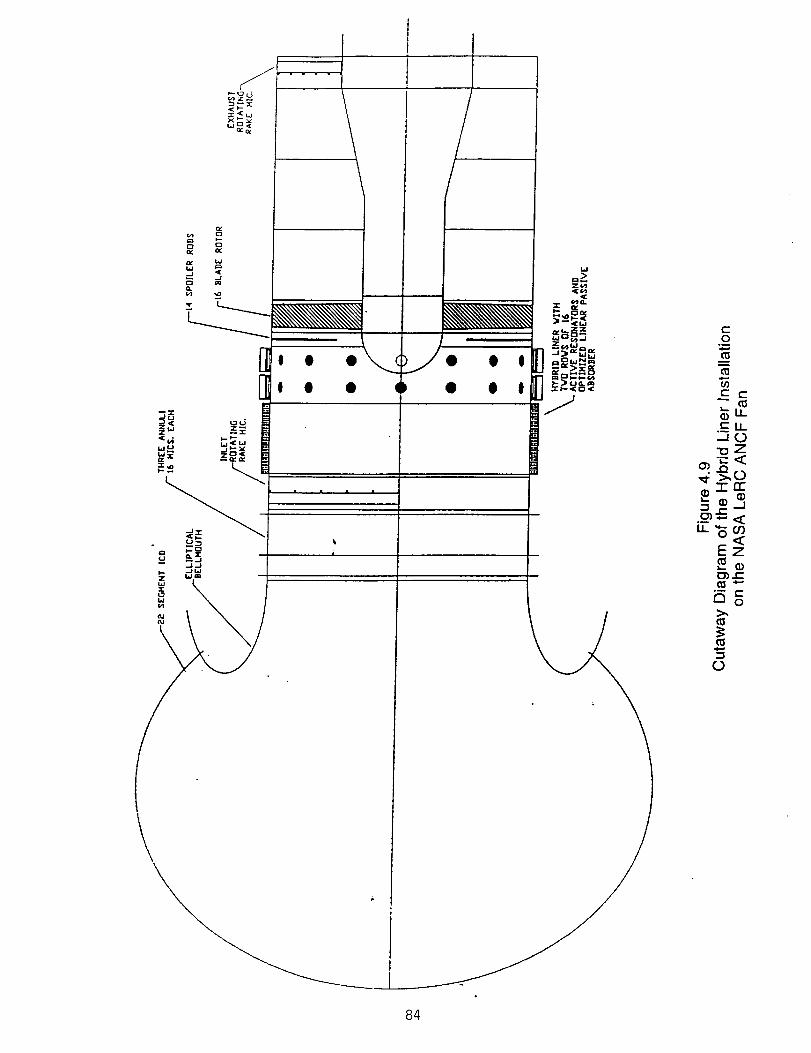
,.-,
11
,_ZW Z_N_
w_
;.. JwZ W_
\
1w
z_
O •
I O
0o_
,0,-,
C
_"- Ito_
7o7__<o .-,r-n.-
.__U-_U)
Iz
i:
0
84
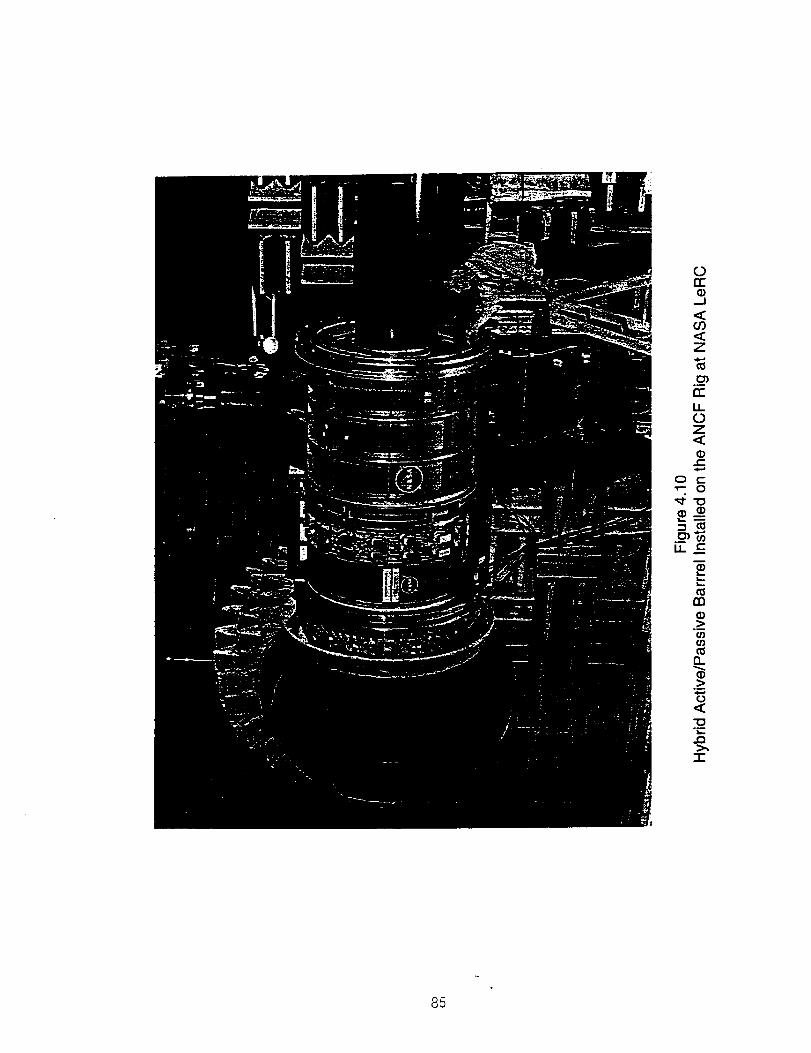
n-
.-I
O9
Z
o_
n-I.I_
Z
0
0
,, =
nn
.__fcJ
O_
cb
"ID-__
-r
85
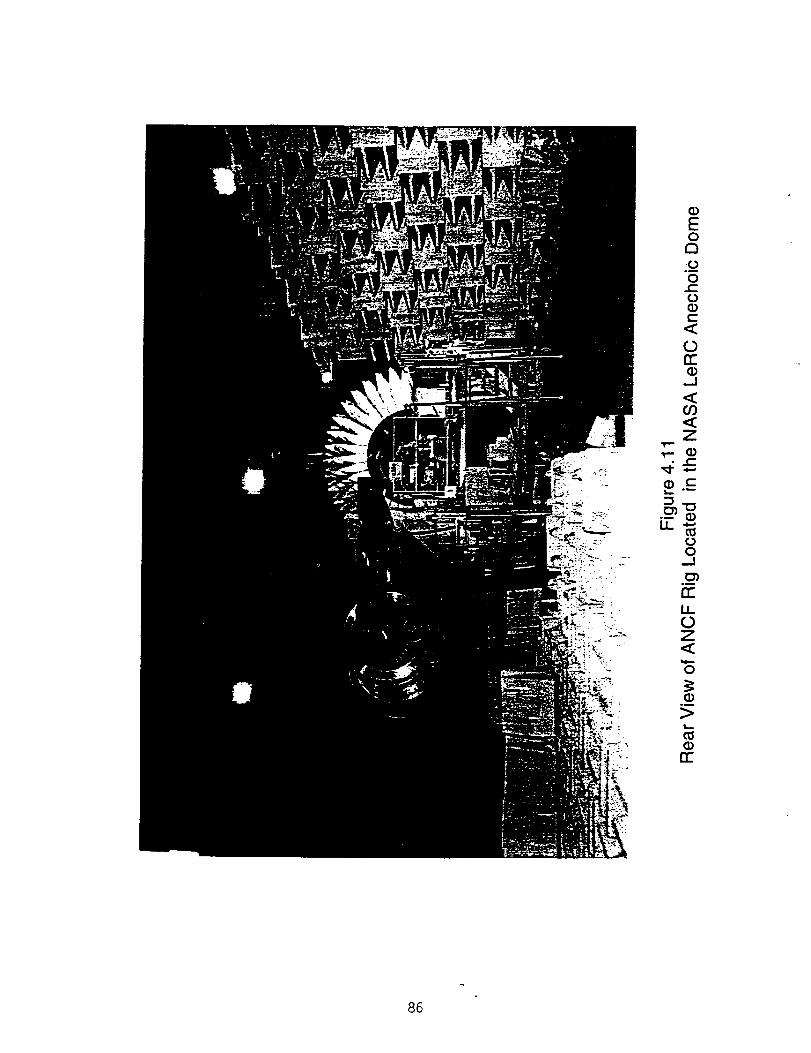
Eor_.f3
o(-.(3
(-<
rr
.J<OO<Z
(-
°_
LL_
Q-JE:r)
o_
ITu_(2Z<o
._
>
rr
86
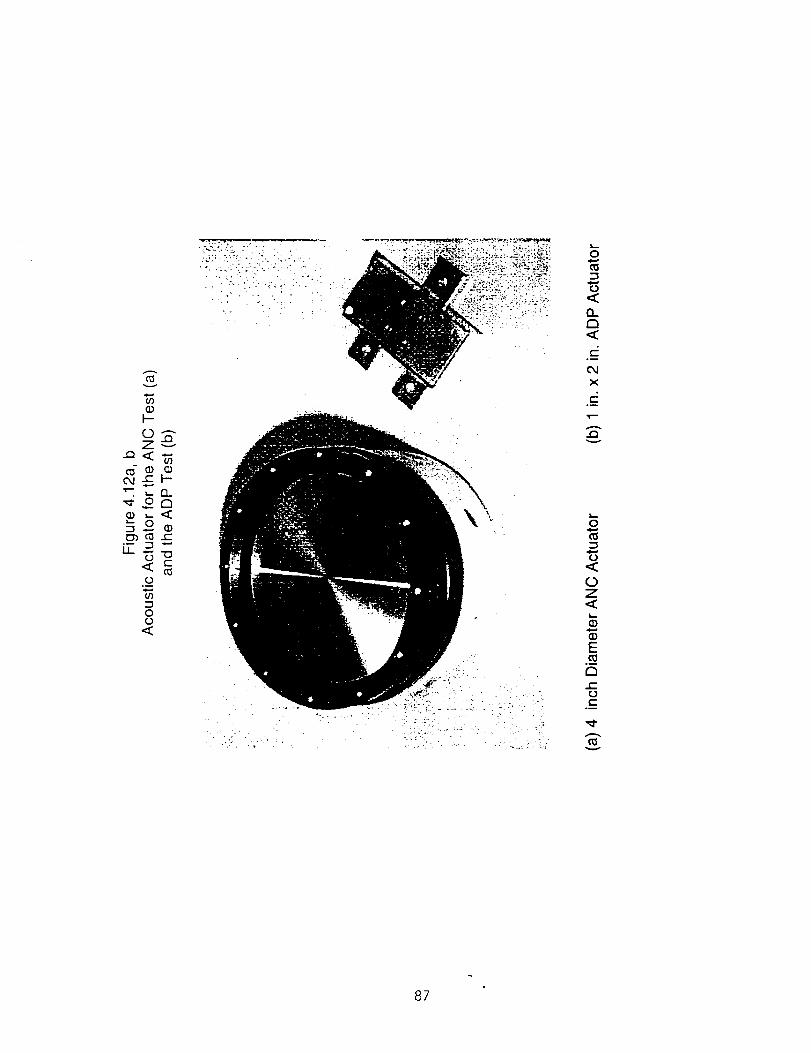
v
co(1)H-
OnZv
_m mOj c- I---
T-- _- Q_
_ _<_
1.1_ .,--
°_
0
(..)
Q_C_
0,I
X
..Qv
(..)
0Z
(I)
(I)
E
C_(-
(--
87
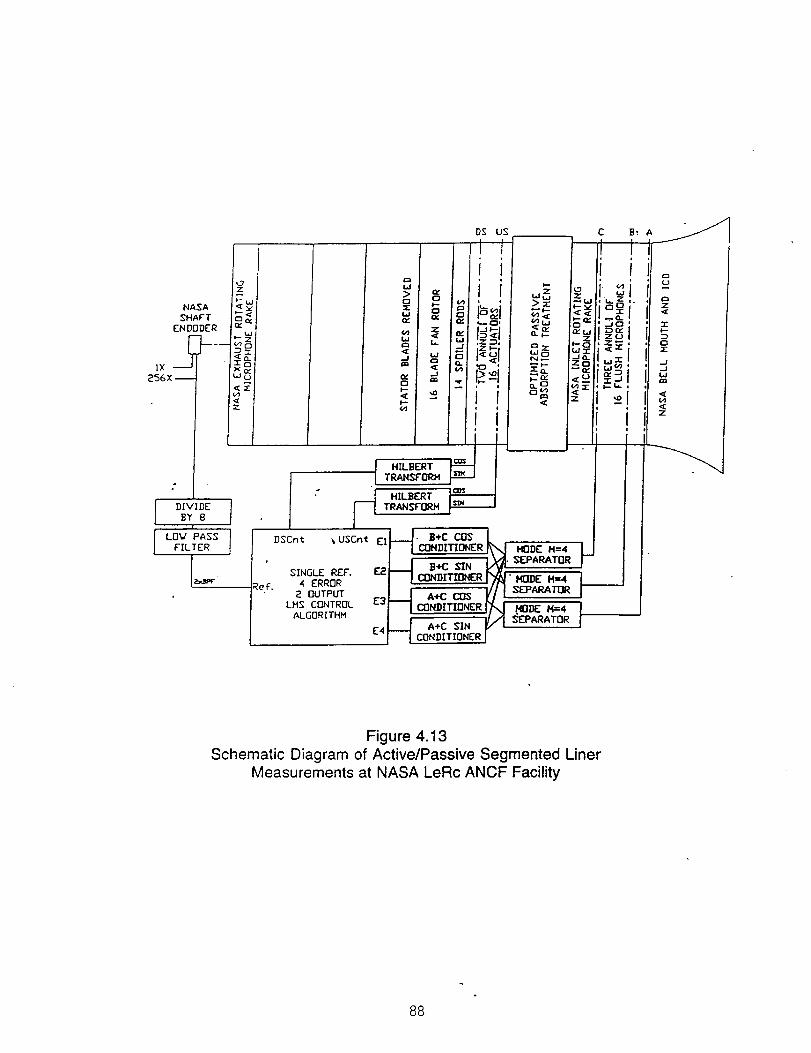
,,_9Z
NASA ___ -";
SHAFT c_ _y
ENDODER
1X _u
256X -- - '2
I
I DIVIDEIBY 8
I Lo_'_AssFILTER [DSCnt t USCnt El
SINGLE REF. F_.2
4 ERROR
2 OUTPUTLMS CONTROL E3
ALGORITHM
£4
bJ
> (x0 (D:E t-¢,j 0(E iv
(4 ZI,i <£¢:_ i.
<E ¢.j-J ¢=
OC -J
I--
p-
HILBERT
TRANSFORM
HIt.BERT
TRANSFORM
DS US
I tI 1I f
W ,Z -a,
_ a
It
i i
C B; A
II I:, ,
"_W -
-- ,-/_j J--_ _z,_, ! zu
-_ _ ,_,_,
n u
. B+C COS:]]NI)I|IO R _J MODE M=4 I
I B+C SIN _,. SEPARATOR
"_ coNDrnoE_/_W'._E._ i__ _/ ! :_EPARATOR
A+C COS
CONDITIONER /'_ .MODE M=4 I___J A+C SIN I,/"ISEPARATOR
I CONDITIONER
m
Z<{:
-Jr"
El
..J
.Jt,J,..r,
..,¢
<[Z
Figure 4.13Schematic Diagram of Active/Passive Segmented Liner
Measurements at NASA LeRc ANCF Facility
88
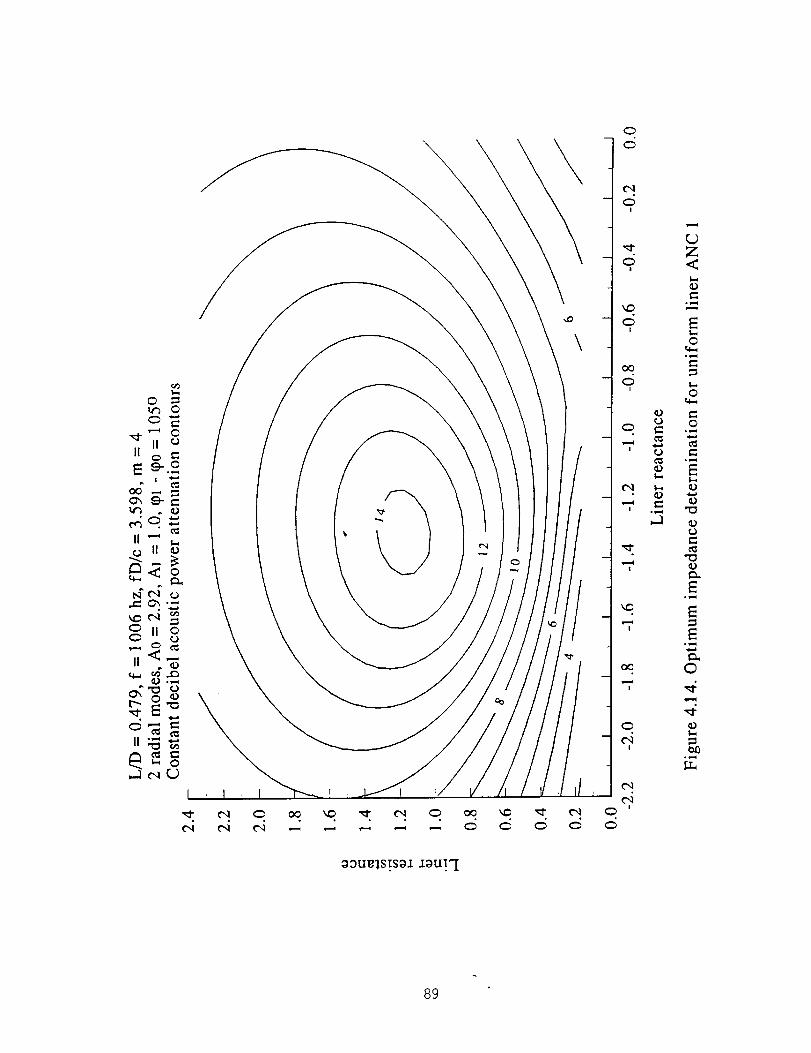
\
\
89
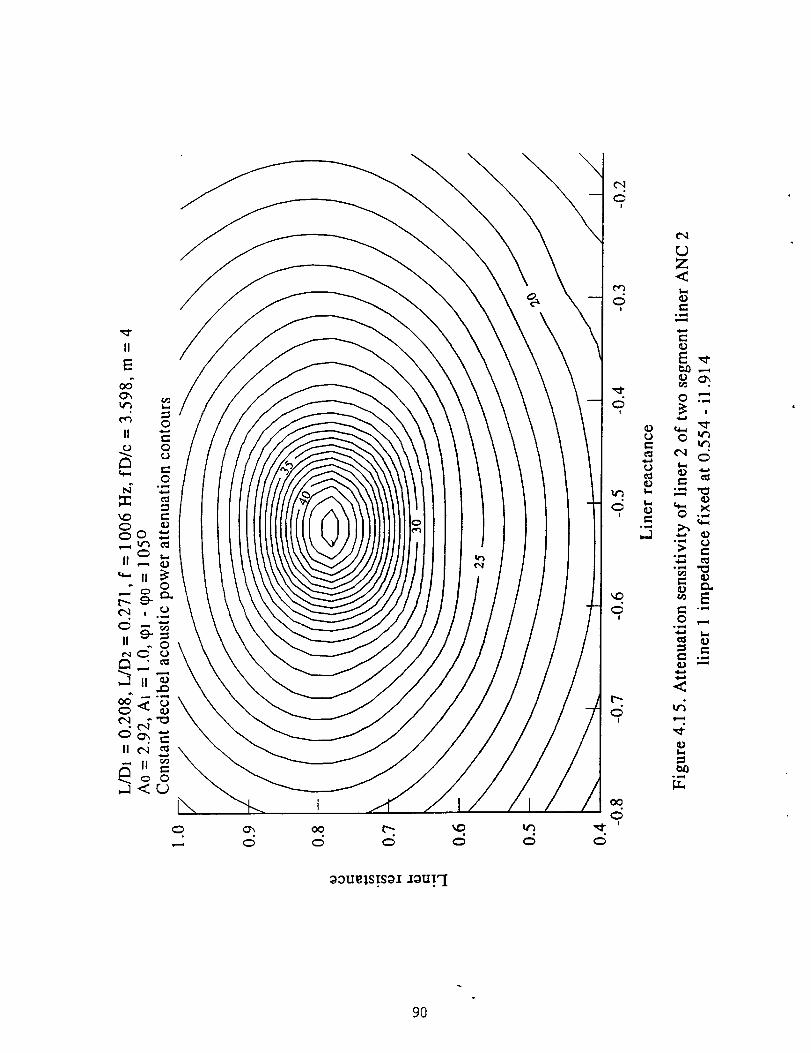
II
E
\
\
I
II!
/!
/
/
/
/
c,I0
I
o
° _,,,q
r.)2:<
0v,,_
E-_-
o,p,_
<
,4
em° _,,,,q
9O
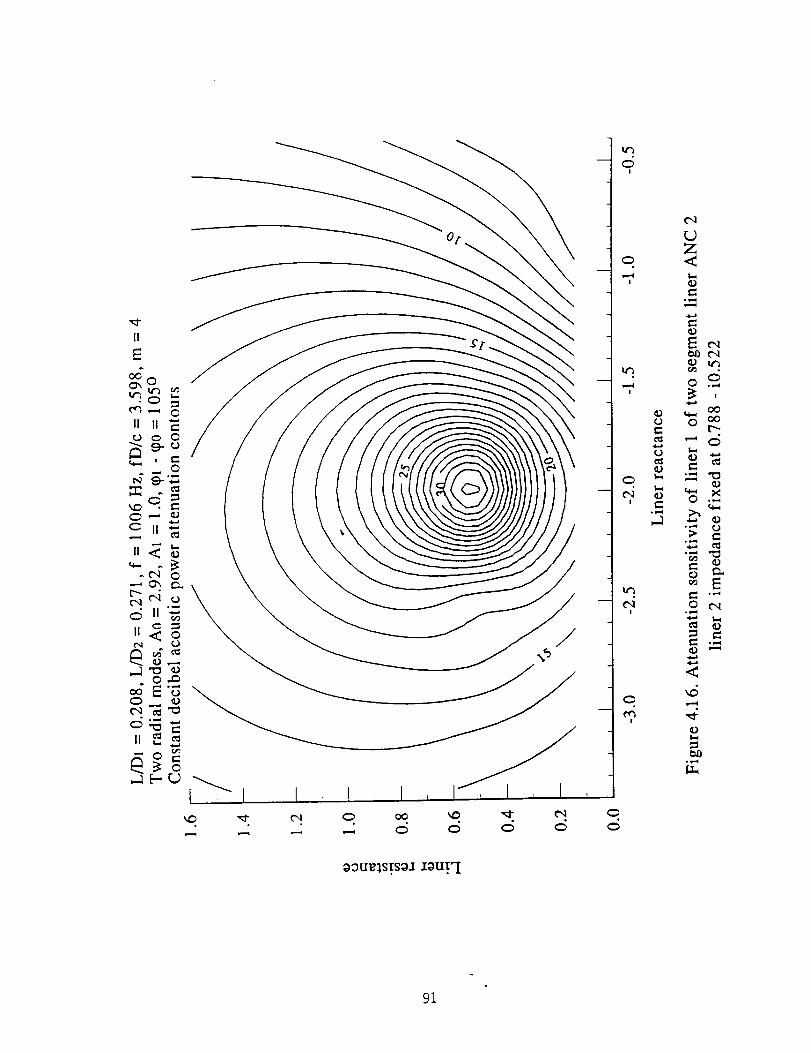
I_1 I I I
!
--r
d
-- C',lI
!
0
0
0
e_• w,,,,i
2:
0 _
0 _L._
0 C',I
0
o,_,i
oou_s._soI zouFI
91
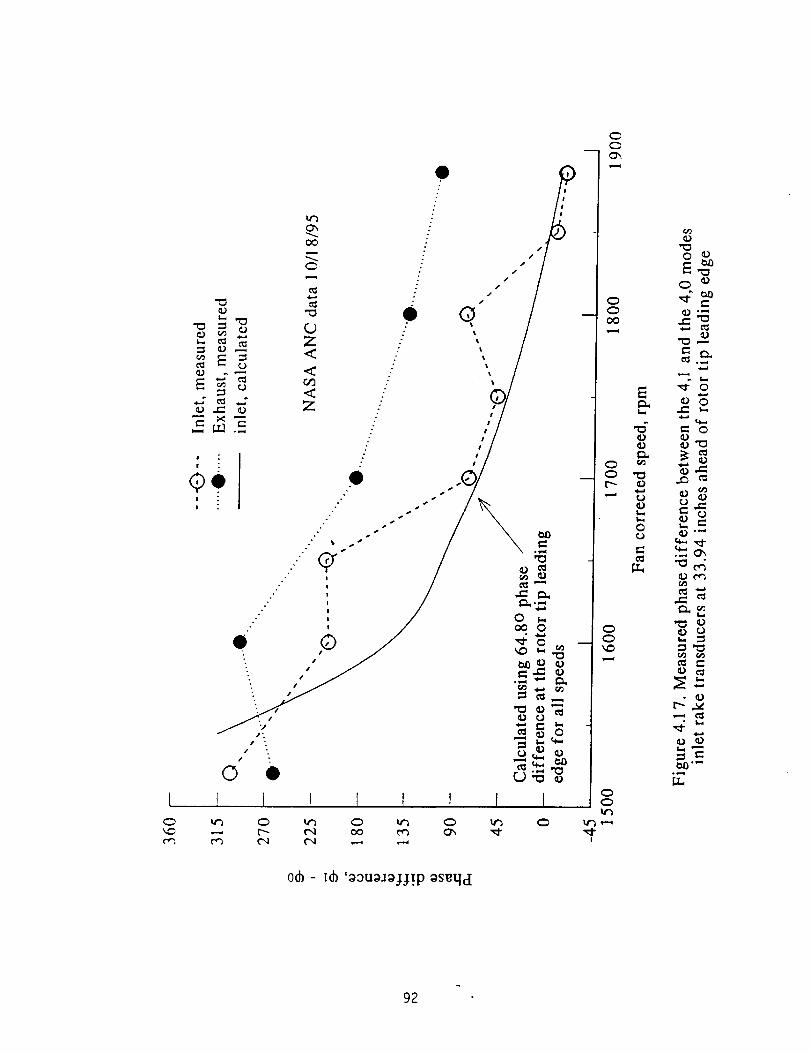
I
°°
.o
o/
I
I
I
I
E
0
0o
=
0 _
E _
e-
o
_ o
_ o
e- oo
o_ - [_ 'oouol;_jjTp oS_tld
92
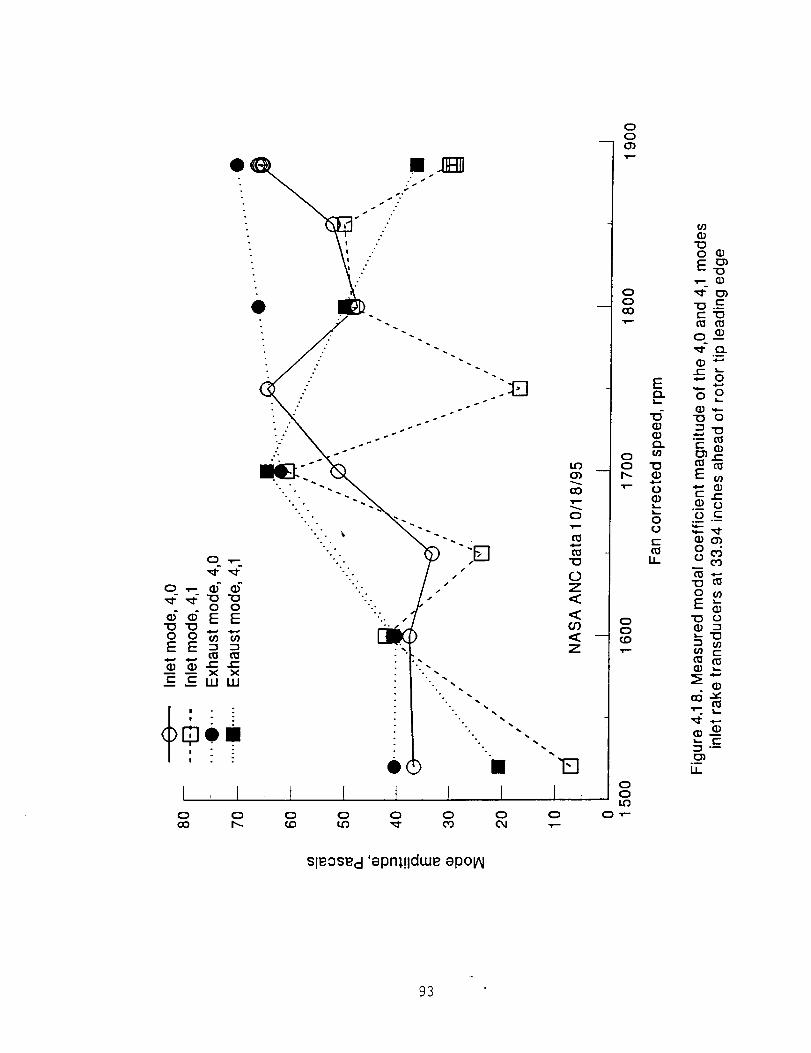
o
.
• ) []
I I I
0
Eo_
"0.--c-13
o__•_- O.
°_
•_ 0
oO
13 0
CO _-
E_
oo_
0 c-o_ °_
O_
03
0 _0
E_
¢._ e-
_ o_
°_
IJ_
SleOSecl 'epn;!ldwe epo_
93
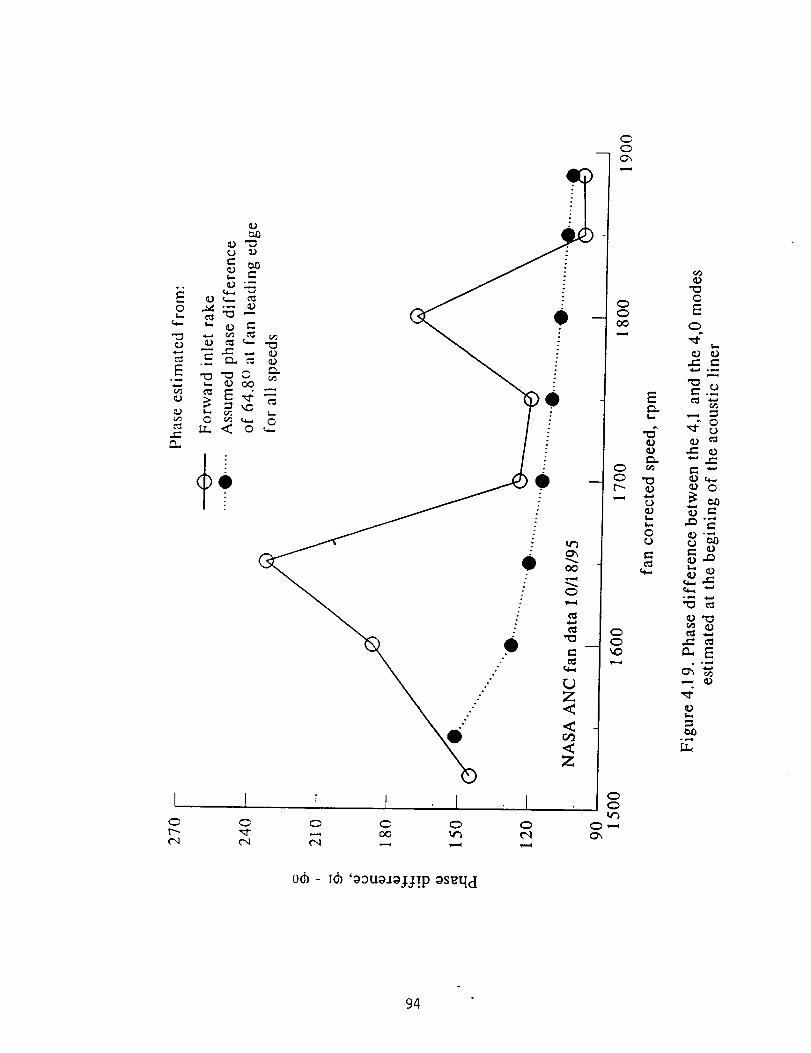
I ! i t I0 C 0 0 _
t0
o_ - t(b '0ou0._ogg!p 0s_qd
g
goo
o
o_DI.,I
0o
o
0t=
,.-.._
_c oo _
o q..o 0
,,_x-
m _
,4
94
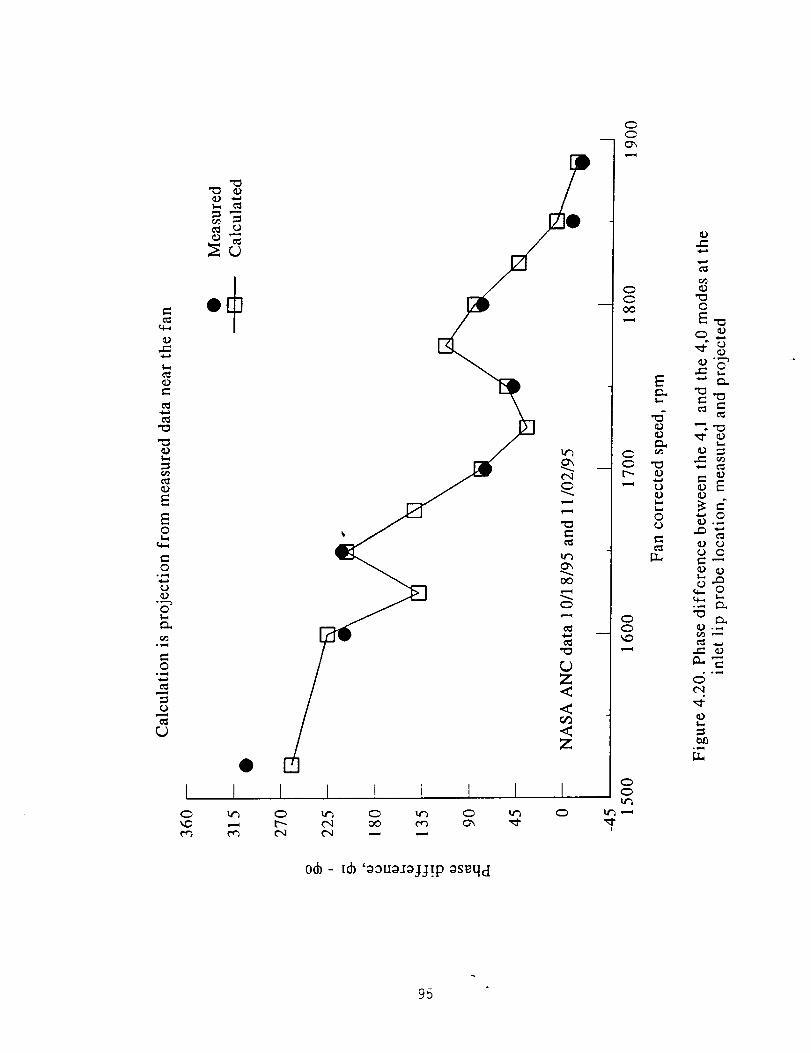
¢)
t_
ill
E
E0$.q
0° ,...q
¢..)
° ....-%0
c-O
° _..,t
0
¢I10
I0
I I I I I ! I I0 tt% 0 It_ 0 _ 0t"- 04 oo t'_ _ _"04 04 ,.--, ,.--
0(b - t* 'o0uo.t_jj!p os_qd
CC
00
0t_
00
0
!
E
r_
o
t._,t._,
0o
0
_E
o 0
°,,_ _
e"
95
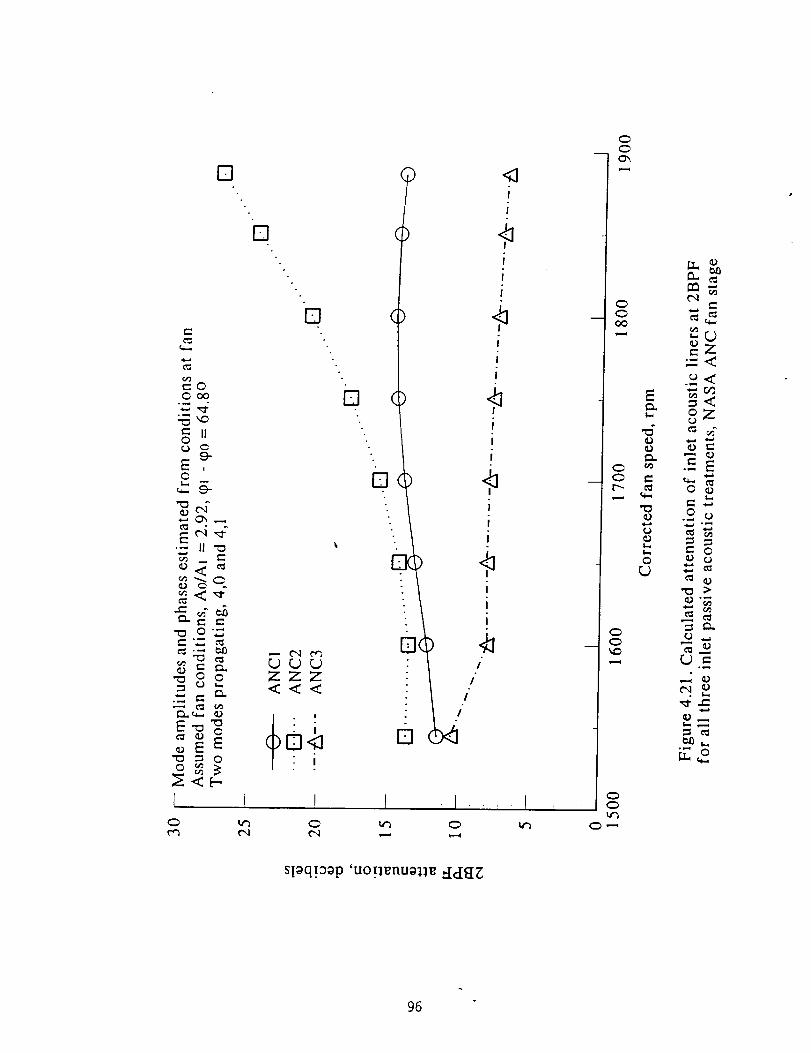
El
v1
¢..
0oo
¢" II0
c9-
E ,0
•-- II'_
_<,_"
r_ e- e-
•"_ o-_
o_
_E E
I
o
ZZZ<<<
!i
O
c_u_ br_
(.q ,..
!
i
!
I
I
I
i
4I
!
i!
I
!
i
f ' " ' I
00_
E
0
C_'-"
c-'J
_-Z
°,_
=<
_z
=E
0 _
.__ _
_o
_'_
r..) ,-
t'N _
lall_
_ o
sl_q.t3op 'uo!lgnuolle :[_flE
96
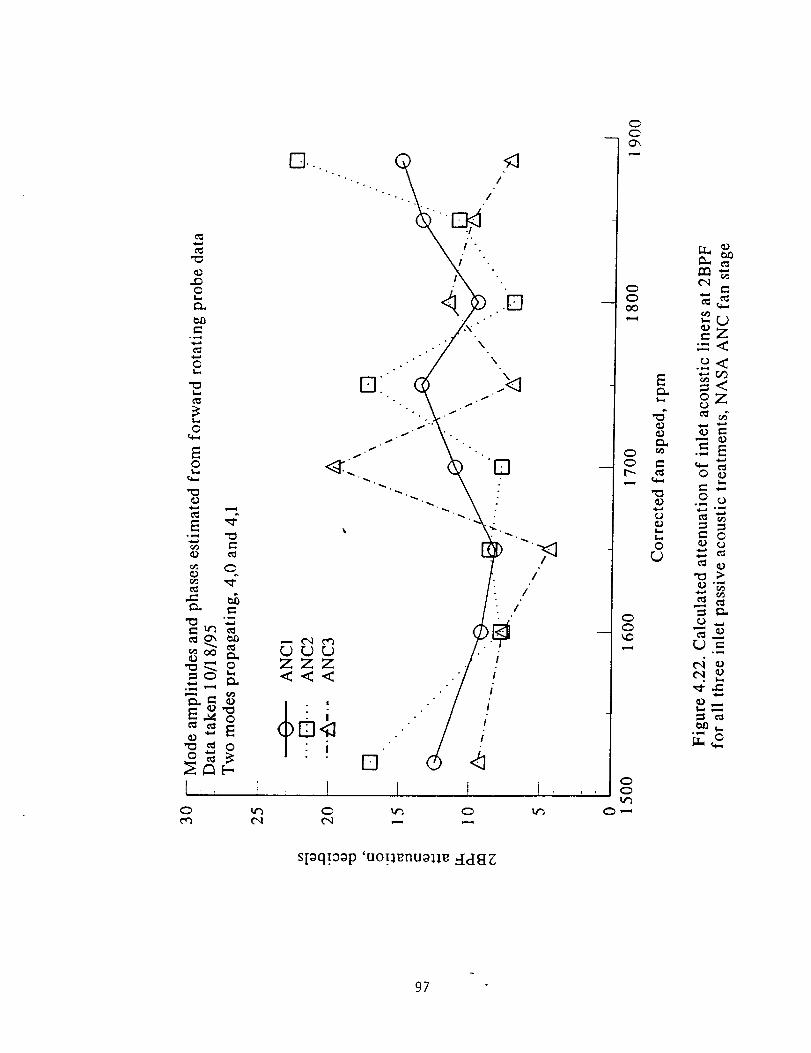
!
!
/
I"
!
. _°
iiii
I
!
4I
Ee_
o
_m
=Z
=<
ez
.5 E
r..) ,-°_
_ o
sloq!oo p 'uo!l_nuolle dd_{E
97
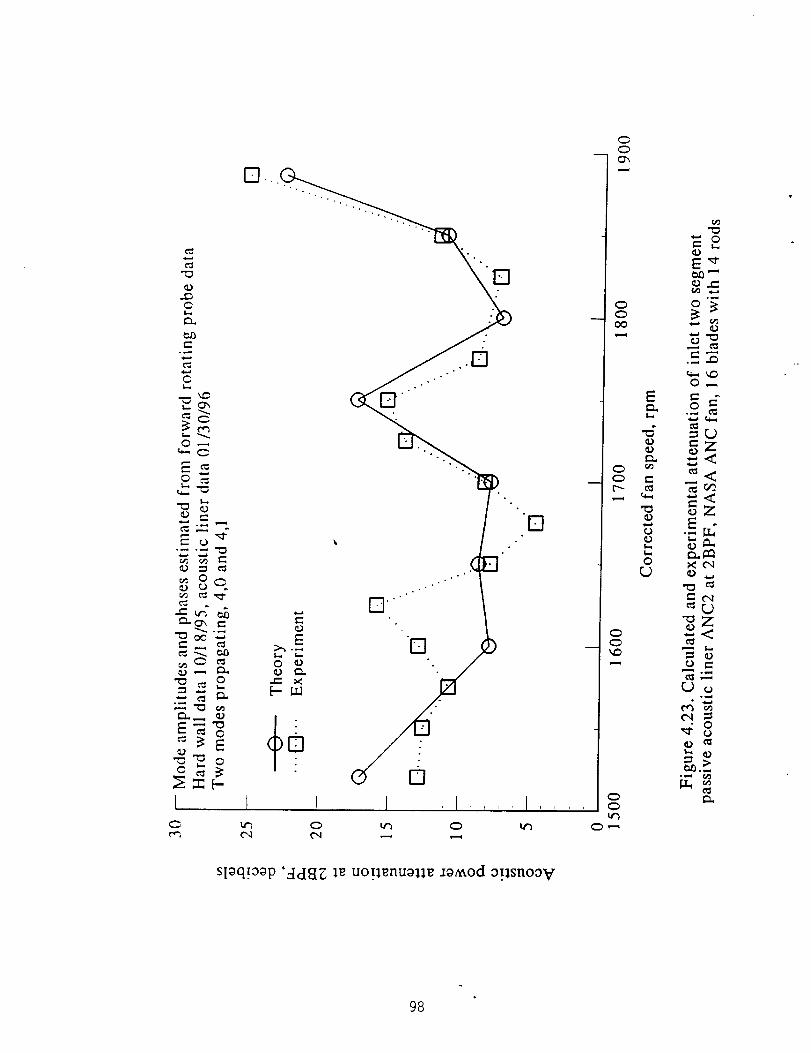
0
C_mo.-
E-_-n 0
I
] , . . . ° . . , . . . , ° , , , , . ° , . . . . , , .
"''°D
,.F1
E
0
x
["_1' "
I3
,.-1
El
I r I I I0 _ 0 _ 0
00
0000
E
-n"
"00
0
0
00
00
0,-'_
=.o
o-_
°_
0--,
=(.)'-Z
_z
_t'xl
r..) U
./o
m_
sloq!ooP 'ddaE le uo.tll_ntla111_ ._omod o._lsnoo V
98
• °
0
sloq._ooP 'ddffE le uo!lenuzlle ._0h_od o_.lsnoo V
00
goo
o
o
0
r_
00x.O
00
0,.._
_.o¢2
E_Ca_ ""
o
0 ,...,
"Z
6z
_C',l
_ t",l
_U_Z
e_
°_
Uo
4_
99
c_q
(.3
r_
o-_
_ 0
0 0 .-
NN _-0
E
e-
I p f0 0 0
0o _
J
%
I I J I0 0 0 0
Slr0Sr d '_pnl!ldtur 0pOlAI
0o
_'_ 0
z_
"El1
0O_
0
0
0
E
0
r._
0
E
e-
°_
0'_
o
0
E_e-
N,,40,1
U.,
I00
sloq.map 'ddffE lr uo!lgnuollr _oaxod o!lsnoo V
0
oo
r-,
q)
<o_E
o_
o
_r..)_z
E<
@r.¢l<
101
am
i
t
[]
sloq!_o p '[OAO I olnsso._d puno S
¢.q
Oli
e_
I
0
¢o
onN0
_m
.m
L,i
0
eM
i
o
i
t-:¢'q
a_
.I
102
0
0t_
0
<
¢q
g:_ ¢q.#...a
E
0
o r,.)Z
°_ ._.._
eq ,<"_" Z
sloq!o_p 'uo!l_nuoll_ os!o N
103
°
I t I I I0
o
e,,I
¢,..1
a= E_el
0
0,-, r_
•"_ Zo "<
o Z
sloqioop 'uo!l_nuollu os_.o/_
104
1
00
I
i Ii I
°°°0°
sleq!0ep 'le^el eJnsseJd pun09
1,9 >,o_
_JO"
03
Z r-
°_
O
>,
O
._ "13"10 O
E
!
U_(-
c5=
= O.-_ Z
105
1.2
O
0.8_o
e_
E<E 0.6
0
"_ 0.4
0
0.2
HAE Amplitude (4,1)/(4.0)
- - -4,- - - NASA Amplitude (4,1)/(4,0)
210
1500 1550 1600 1650 1700 1750 ,1800
Corrected Fan Speed o RPM
FIGURE 4.31Ratios of Mode (4,1) to (4,0)Amplitudes in NASA/LeRCANCF Fan Inlet as Measured with NASA Rotating Rake
and HAE Flush Mounted Microphone Arrays
1850
ANCF Comparison of Rotating Rake and Rush Microphone Mode Resolution
1900
180
150
P 12oO_o
9O
Ou 60C
_ 30
" 0Q
m•- -30n
_ -6O
_ -1200
_ -_so
-180
-210
-240
1500
_1P"
'_-_Ir---'HAE Phase (4,1)-(4,0)
- - -_- - -NASA Phase (4.1}_4,0)
1550 1600 1650 1700 1750 _800
Corrected Fan Speed- RPM
RGURE 4.32Differences of Mode (4,1) to (4,0) Phases in NASA/LeRCANCF Fan Inlet as Measured with NASA Rotating Rake
and HAE Flush Mounted Microphone Arrays
1850 1900
106
PWLtot
ANCF Baseline
1886 RPM 2BPF
Rake Near Rod Plane
FIGURE 4.33 a, bComparison of ANCF Baseline Mode Structure at Two Inlet Axial Stations
I_ o
II_
110
107
PWL = 1133 dB Active Passive Liner Hardwall
tot Upstream Resonators
iili i iiili i ii1886RilFanStationary115 ...." °'-3. " • "-.° : : °° • : °'4.. • :
110 .-i.... .:." :• ..-" : °..o.". . : "'_.. : .,o_ _ i..i.._ _ ii i- 'y, ..o°" .o ..°°"
9$ ...."'"i...'".... "'"
gO
PWLto t = 1122 dB
Active Passive Liner Hardwall
Downstream Resonators
1886 RPM Fan Stationary
6
FIGURE 4.34 a, bComparison of Duct Modes Generated by NGC/HAE Active Liner Segment Upstream and
Downstream Actuators with Passive Segment Covered, Fan Stationary
108
PWLto t = 109.7 dB Active Passive Liner
Both Drivers, Mics A+C & B+C
PWLto t = 103.2 dB
Active Passive Liner
Both Drivers, Mics A+C & B+C
Control On 1886 RPM
FIGURE 4.35 a, bComparison of Duct Modes in NASA/LeRC ANCF Fan Inlet
NGC/HAE Adaptive Segmented Liner, Fan 1886 RPMControl Off vs. Control On
120
11_
110
lOS
109
cL
PWLto t = 103.2 dB
PWLto t = 102.2 dB
Active Passive Liner
Both Drivers, Mics A & C
Control On 1886 RPM
FIGURE 4.36 a, bComparison of Duct Modes in NASNLeRC ANCF Fan Inlet
NGC/HAE Adaptive Segmented Uner; Fan 1886 RPM"Modal" vs. Axial Station Error Microphone Arrays
ii0
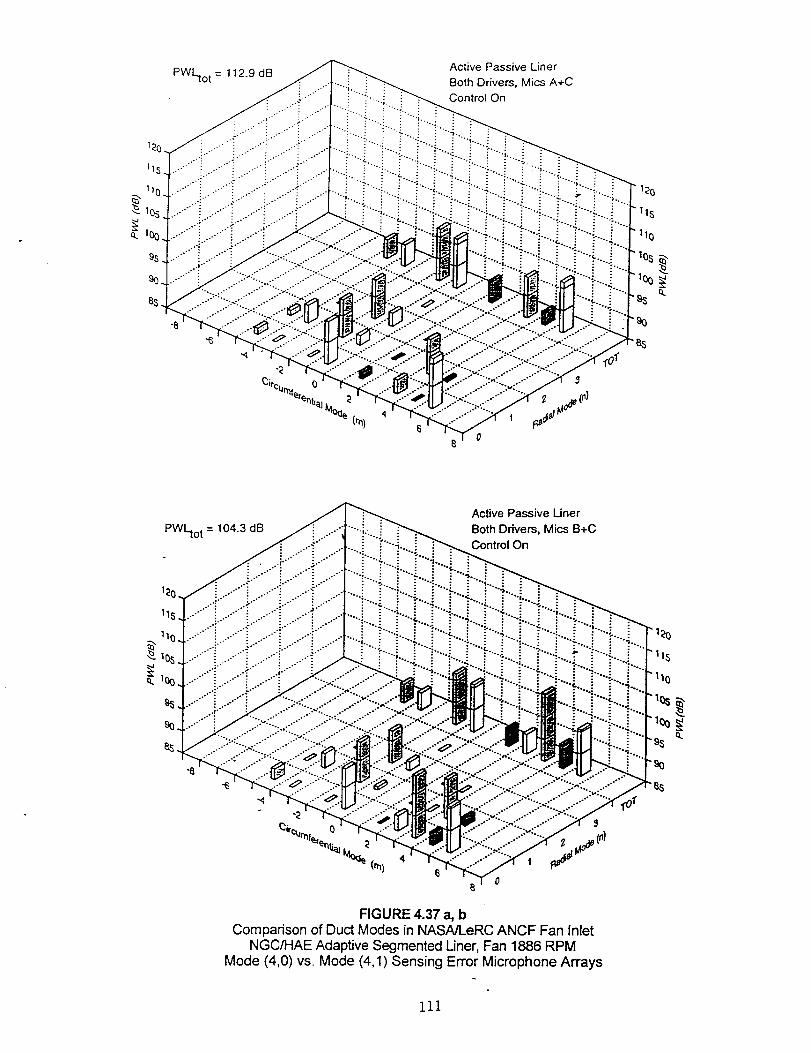
PWLto t = 112.9 dB
°o,°.
Active Passive Liner
Both Drivers, Mics A+C
Control On
...-"
rof
PWLto t = 104.3 dB
Active Passive Uner
Both Drivers, Mics B+C
Control On
e.
0
FIGURE 4.37 a, bComparison of Duct Modes in NASA/LeRC ANCF Fan Inlet
NGC/HAE Adaptive Segmented Uner, Fan 1886 RPMMode (4,0) VSoMode (4,1) Sensing Error Microphone Arrays
11_
110
111
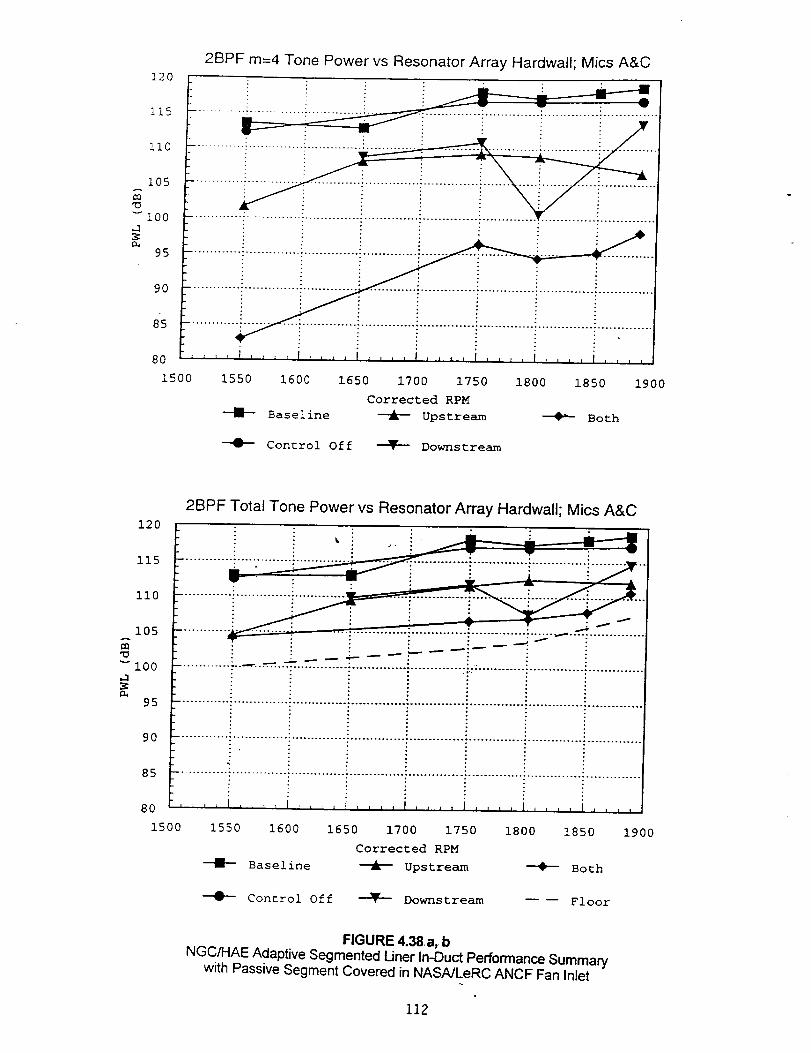
2BPF m=4 Tone Power vs ResonatorArray Hardwall; Mics A&C
115 ...........
I05
v I00.l
95
_o .............i.............................::.............i i .........................................
.... i .... t,,,,i,,,,I,,,, ,,,, ,,,,i,,,,'
85
8O
1500 1550 1600 1650 1700 1750 1800 1850 1900
Corrected RPM
--_ Baseline --_ Upstream _ Both
Control Off --_ Downstream
2BPF Total Tone Power vs Resonator Array Hardwall; Mics A&C120
_ ............_._ .............._.............i .............+.._..
IZIIIIII ii105
i00 ................... -=: -%: .'::T -_. :.'_ ............ i ............. :_.': ..........................................,-I
5 .......................................................... ; ...........................................................
90 ............. : ........................................................... : ............................................
85 ............. : ........................................................... : ............................................
80 , , , , ] , ' _ _ I ' _ ; , i , , , I .... I .... 1 .... I ....
1500 1550 1600 1650 1700 1750 1800 1850 1900
Corrected RPM
Baseline _ Upstream + Both
Control Off _ Downstream Floor
FIGURE 4.38a, bNGC/HAE Adaptive Segmented Liner In-Duct Performance Summary
with Passive Segment Covered in NASA/LeRC ANCF Fan Inlet
112
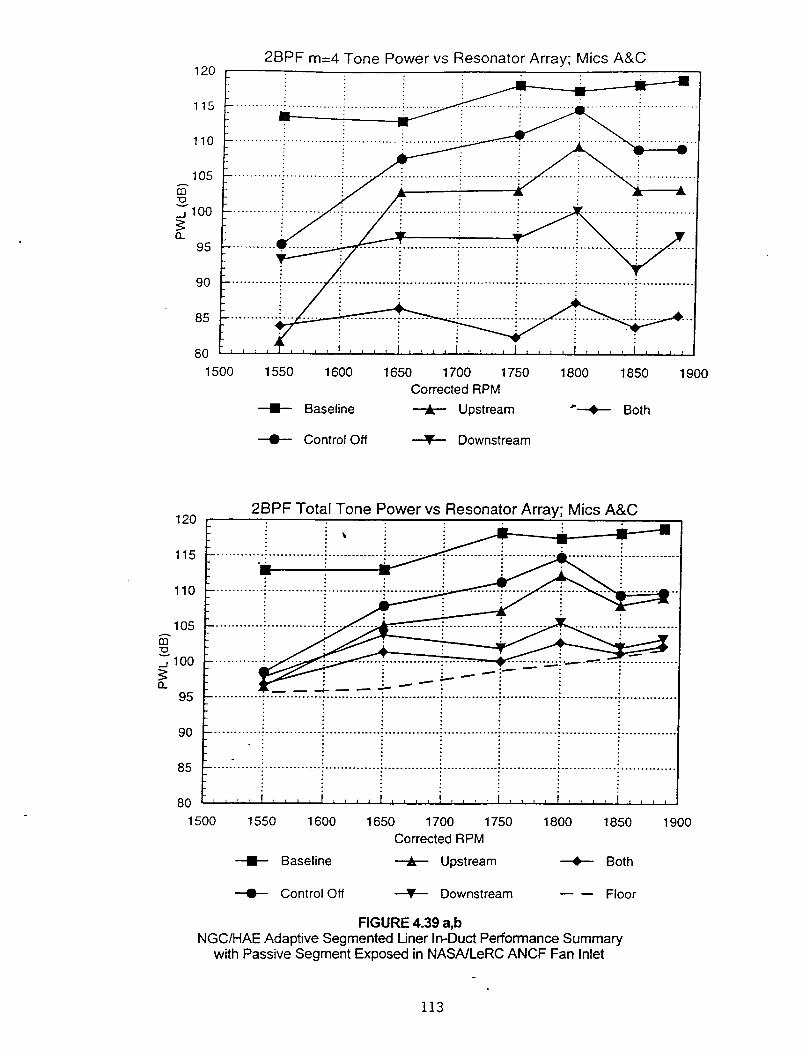
120
115
110
105
E1oo
£I.
95
9O
85
8O
15O0
2BPF m=4 Tone Power vs Resonator Array; Mics A&C
1550 1600 1650 1700 1750 1800 1850 1900
Corrected RPM
Upstream *--_ Both--I-- Baseline
--0-- Control Off Downstream
1202BPF Total Tone Power vs Resonator Array; Mics A&C
9O
85
8O
1500
115 ...........:- .............i...............
oiiiii!iii ii105
100n
95 ............. : ............................. i .............. i ...........................................................
...... " ....... : .............. : .............. .. ........................................................... ; ..............
.... I .... I .... I ............ , _ , , t ....
1550 1600 1650 1700 1750 1800 1850 1900
Corrected RPM
Baseline Upstream Both
Control Off _ Downstream Floor
FIGURE 4.39 a,b
NGC/HAE Adaptive Segmented Liner In-Duct Performance Summarywith Passive Segment Exposed in NASA/LeRC ANCF Fan Inlet
113
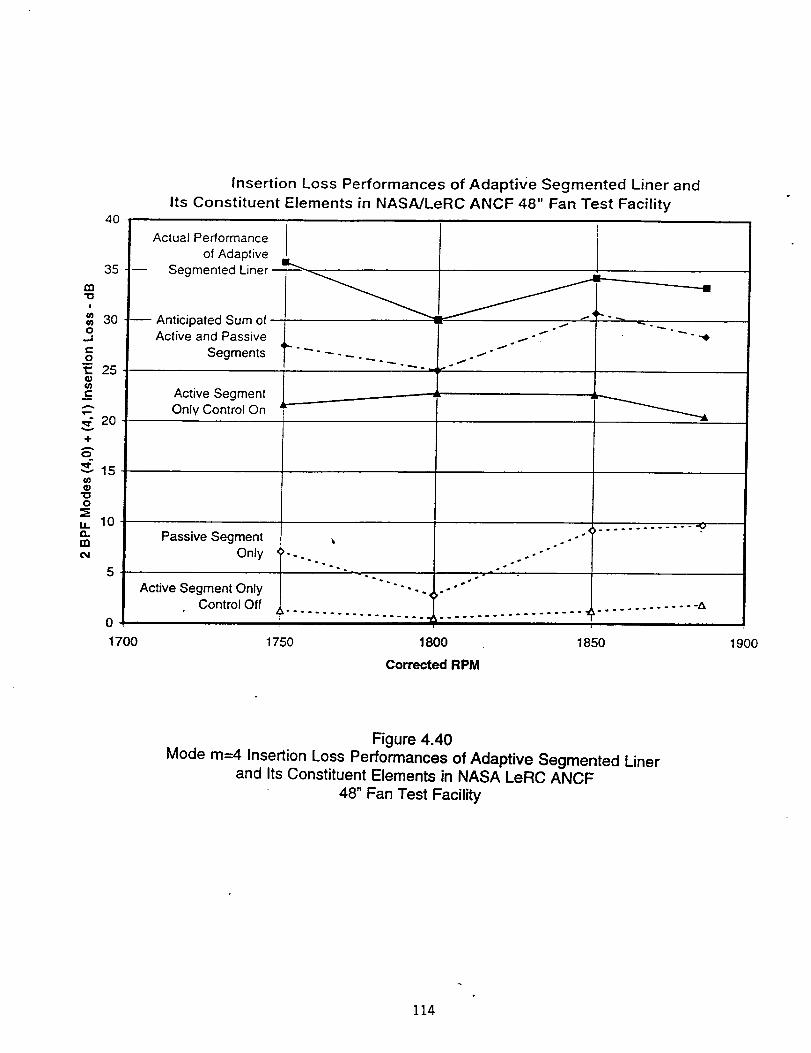
40
Insertion Loss Performances of Adaptive Segmented Liner and
Its Constituent Elements in NASA/LeRC ANCF 48" Fan Test Facility
35
m
30
o,o=
E 25
e.,
,,_ 20
'4"
---" 15
0
,, 10
m
5
0
1700
Actual Performance
of Adaptive
-- Segmented Liner-
Anticipated Sum of -Active and Passive
Segments
Active SegmentOnly Control On
Passive Segment
Only
Active Segment OnlyControl Off
.__.--.--j
j,o
.<
o
o
1750 1800 1850 1900
Corrected RPM
Figure 4.40
Mode m=4 Insertion Loss Performances of Adaptive Segmented Linerand Its Constituent Elements in NASA LeRC ANCF
48" Fan Test Facility
114
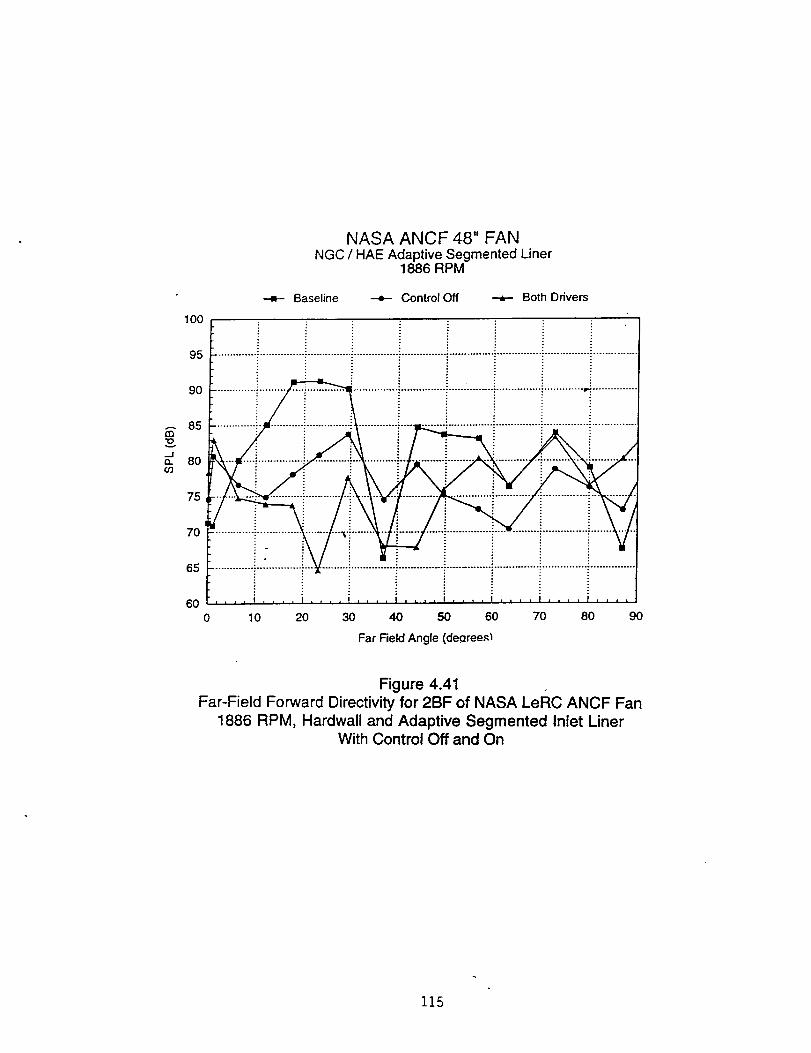
100
NASA ANCF 48" FANNGC / HAE Adaptive Segmented Liner
1886 RPM
•--=- Baseline -4-- Control Off _ Both Drivers
a3
.J(:L03
95
9O
85
8O
75
7O
65
6O0 10 20 30 40 50 60 70 80 90
Far Field Angle (de{zree._
Figure 4.41
Far-Field Forward Directivity for 2BF of NASA LeRC ANCF Fan
1886 RPM, Hardwall and Adaptive Segmented Inlet LinerWith Control Off and On
115
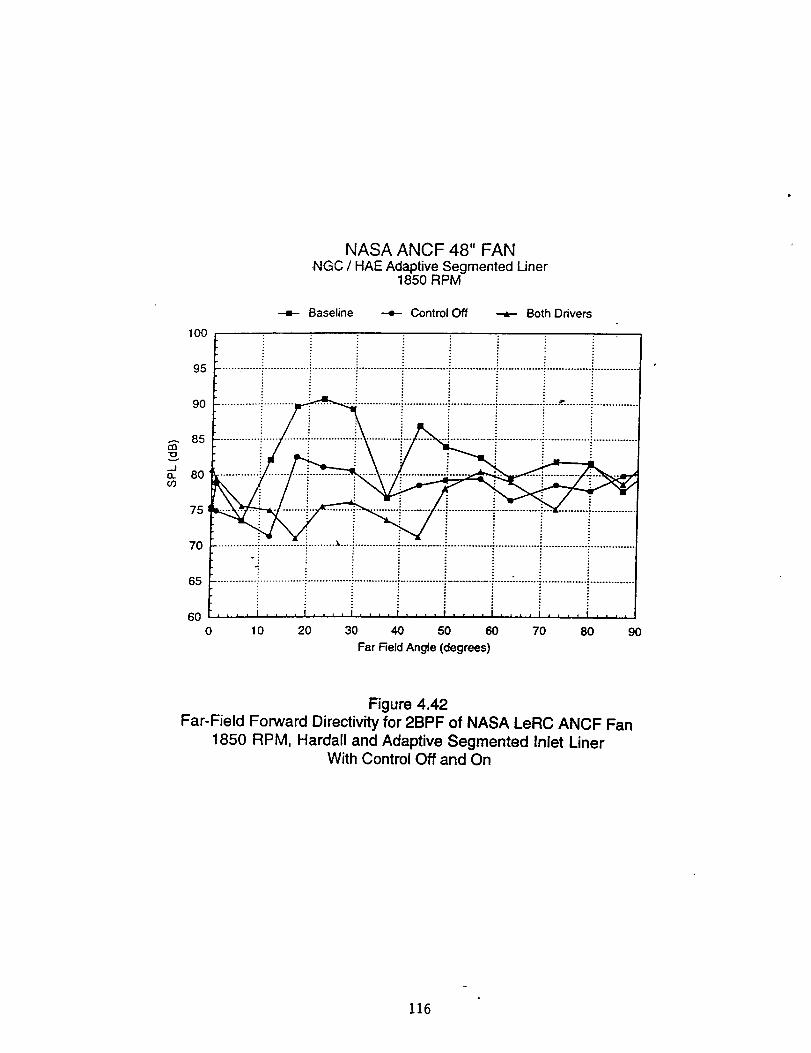
A(33
'10
O,.
09
100
95
90
85
8O
75
7O
65
6O
0
NASA ANCF 48" FANNGC / HAE Adaptive Segmented Liner
1850 RPM
--=- Baseline --e- Control Off _ Both Drivers
Figure 4.42Far-Field Forward Directivity for 2BPF of NASA LeRC ANCF Fan
1850 RPM, Hardall and Adaptive Segmented Inlet LinerWith Control Off and On
116
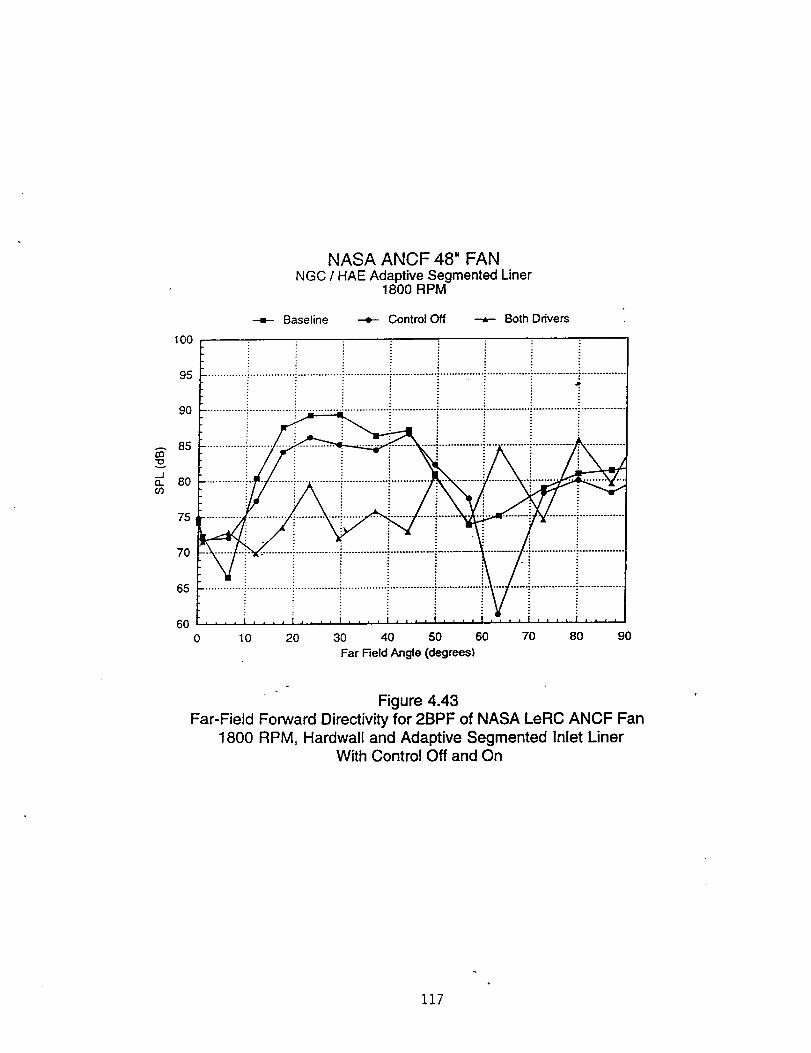
100
NASA ANCF 48" FANNGC / HAE Adaptive Segmented Liner
1800 RPM
--=- Baseline --e-- Control Off ---e- Both Drivers
95
9O
Bs
8o
75
70
65
6O
.............................. .:............................... .:......................... T..................... ' ............... "...............: • a..
10 20 30 40 50 60 70 80 90
Far Field Angle (degrees)
Figure 4.43Far-Field Forward Directivity for 2BPF of NASA LeRC ANCF Fan
1800 RPM, Hardwall and Adaptive Segmented Inlet LinerWith Control Off and On
117
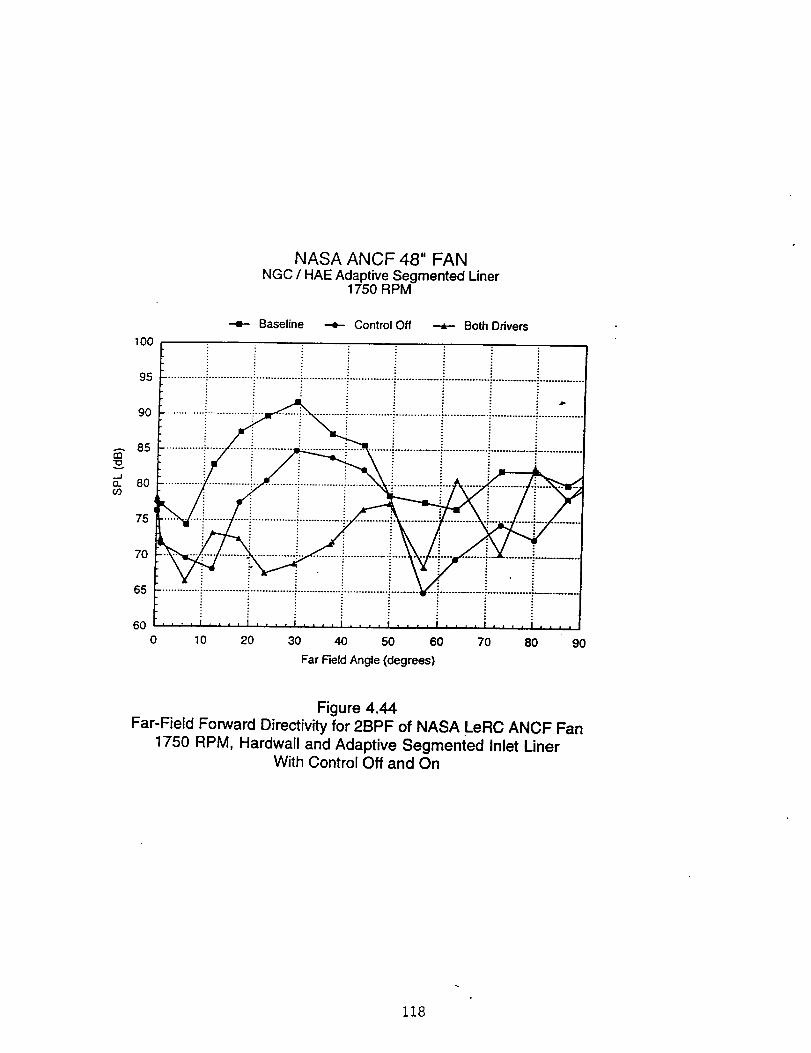
NASA ANCF 48" FANNGC / HAE Adaptive Segmented Liner
1750 RPM
10o
Baseline + Control Off _ Both Drivers
95 .............................................................................................................................. ; ..............
9O
8s
75
70
65
60 .... a .... t .... t .... t .... f ........ t .... I ....
0 10 20 30 40 50 60 70 80 90
Far Field Angle (degrees)
Figure 4.44Far-Field Forward Directivity for 2BPF of NASA LeRC ANCF Fan
1750 RPM, Hardwall and Adaptive Segmented Inlet LinerWith Control Off and On
118
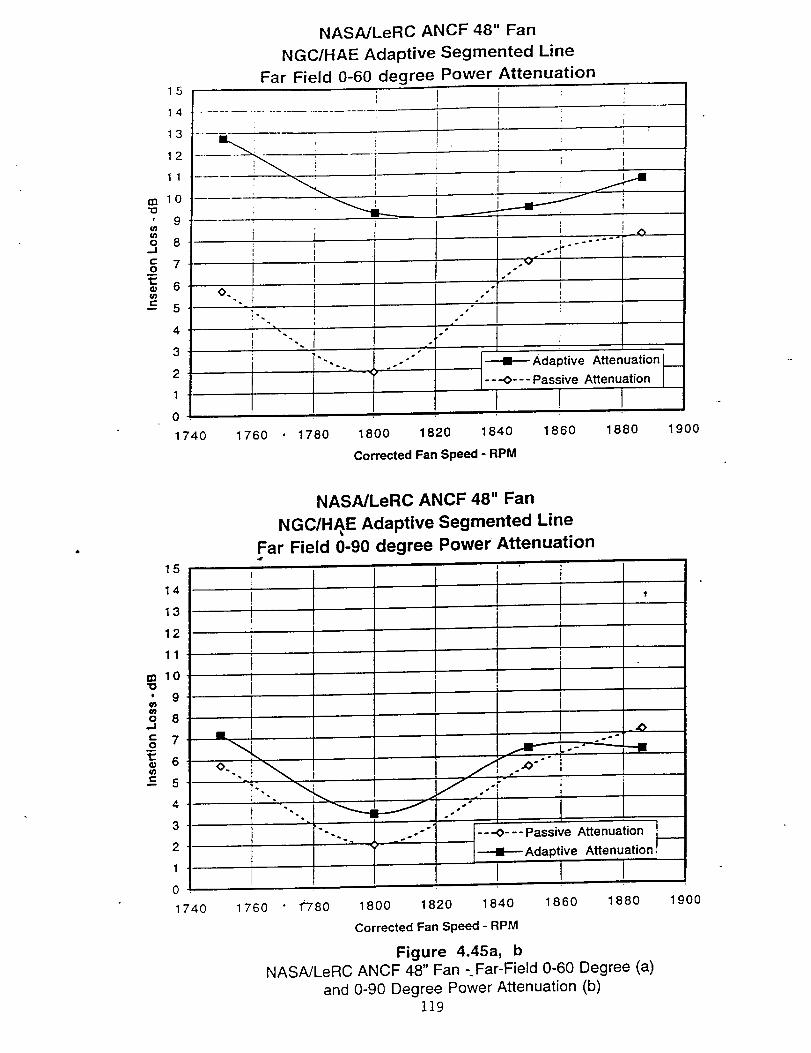
m
#
O
--J
Co
1:O_
P
15
14
13
12
11
lO
9
8
7
6
5
NASA/LeRC ANCF 48" Fan
NGC/HAE Adaptive Segmented Line
Far Field 0-60 degree Power Attenuation
4
3
2
1
0
1740
Ii
ii
, I
Ji
F
I
i
i If
J J ;
IO. : _ i
- ti ii
s
I
s
,=
,,V
----I---- Adaptive Attenuation L_.
---O--- Passive Attenuation |/
1760 1780 1800 1820 1840 1860 1880 1900
Corrected Fan Speed - RPM
15
14
13
12
11
ml0"ID
' 9tO
o 8_J" 7o
6
5
2
NASA/LeRC ANCF 48" Fan
NGC/H_E Adaptive Segmented Line
Far Field 0-90 degree Power Attenuation
iIX
JJ
6
---O---Passive Attenuation
+Adaptive Attenuation
i
1740 17 60 1_780 1800 1820 1840 1860 1880
Corrected Fan Speed - RPM
Figure 4.45a, b
NASAJLeRC ANCF 48" Fan -Far-Field 0-60 Degree (a)
and 0-90 Degree Power Attenuation (b)119
1900
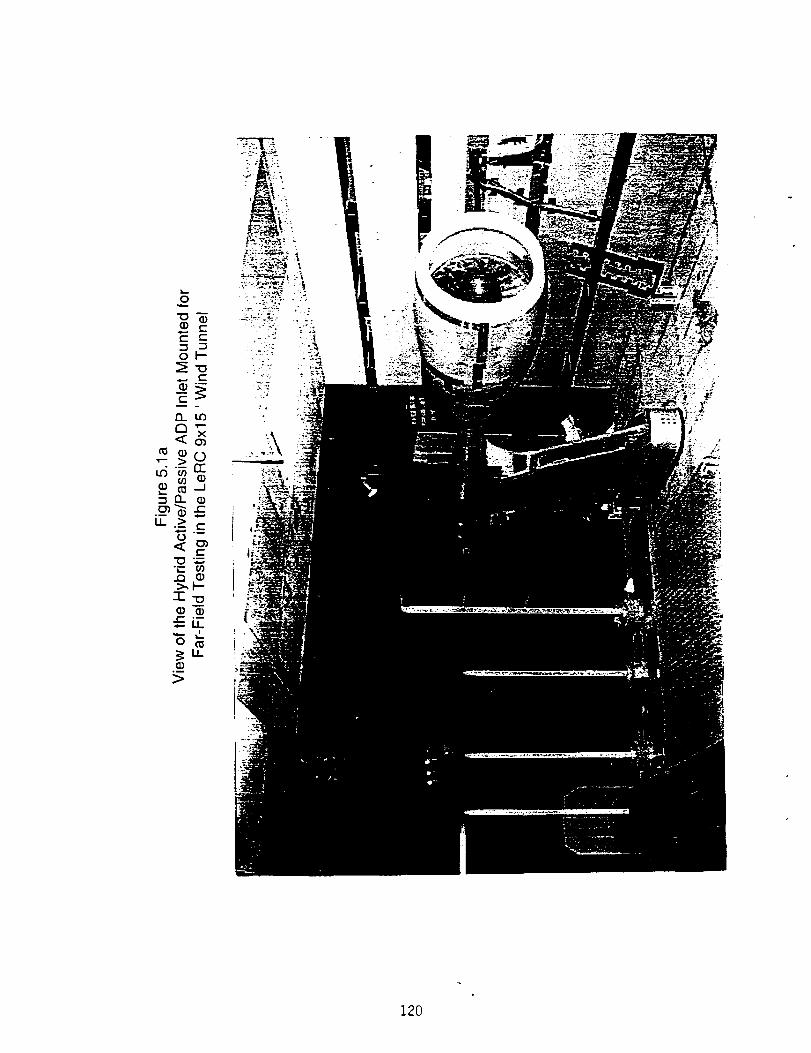
120
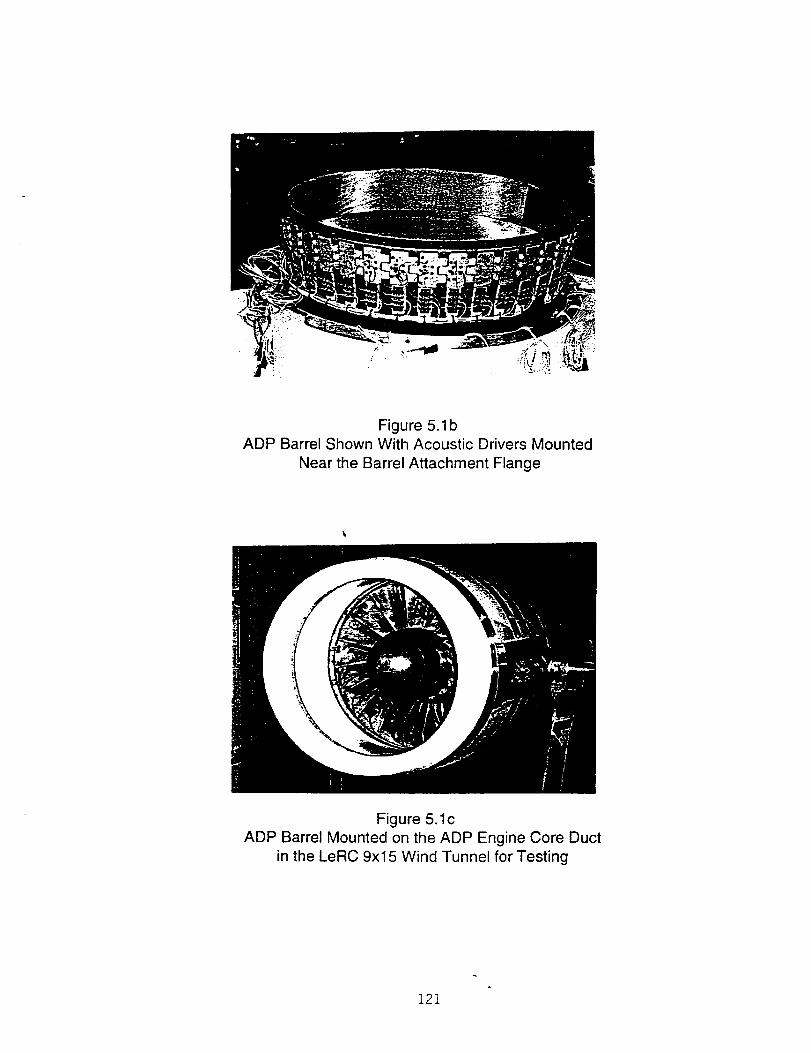
Figure 5.1 bADP Barrel Shown With Acoustic Drivers Mounted
Near the Barrel Attachment Flange
Figure 5.1c
ADP Barrel Mounted on the ADP Engine Core Duct
in the LeRC 9x15 Wind Tunnel for Testing
121
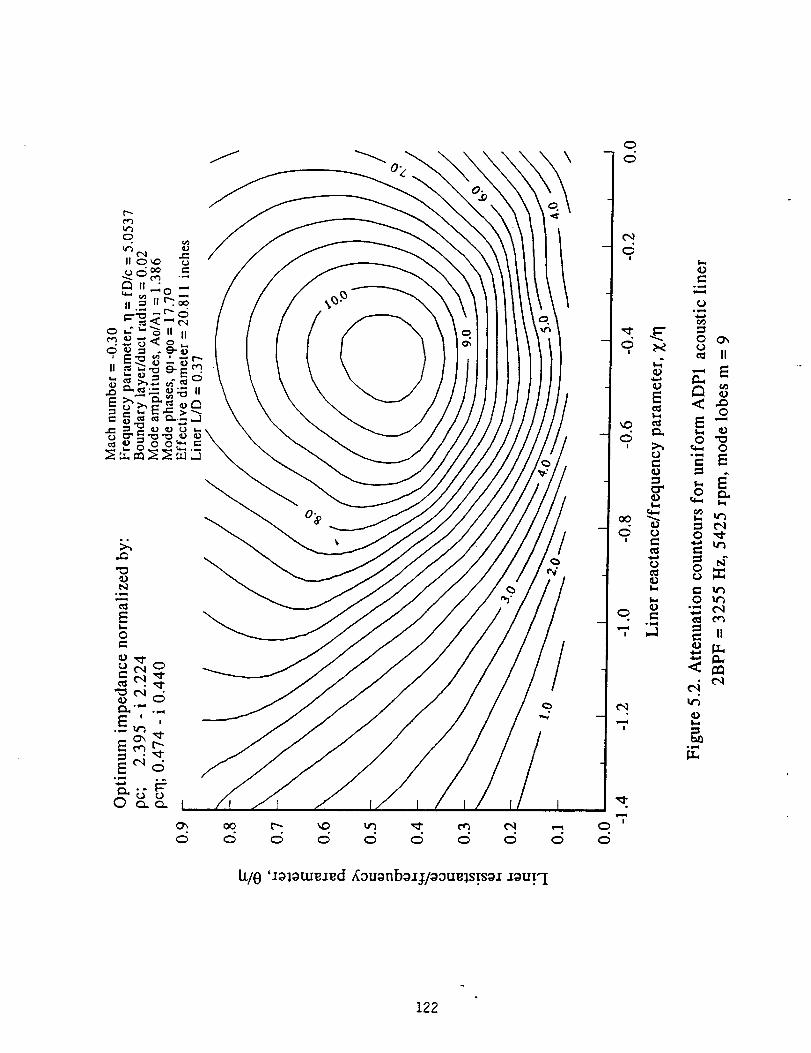
o o o o o ¢_
!
E
o
o
_r _o
e-
M
o
o
0E--
_ 0°,,,_= E
_ cq0 "_
0o
0 _
II
• _(N
I_/O '_olorug_gd _(3uonbo_/oougls._sox xouT'-I
122
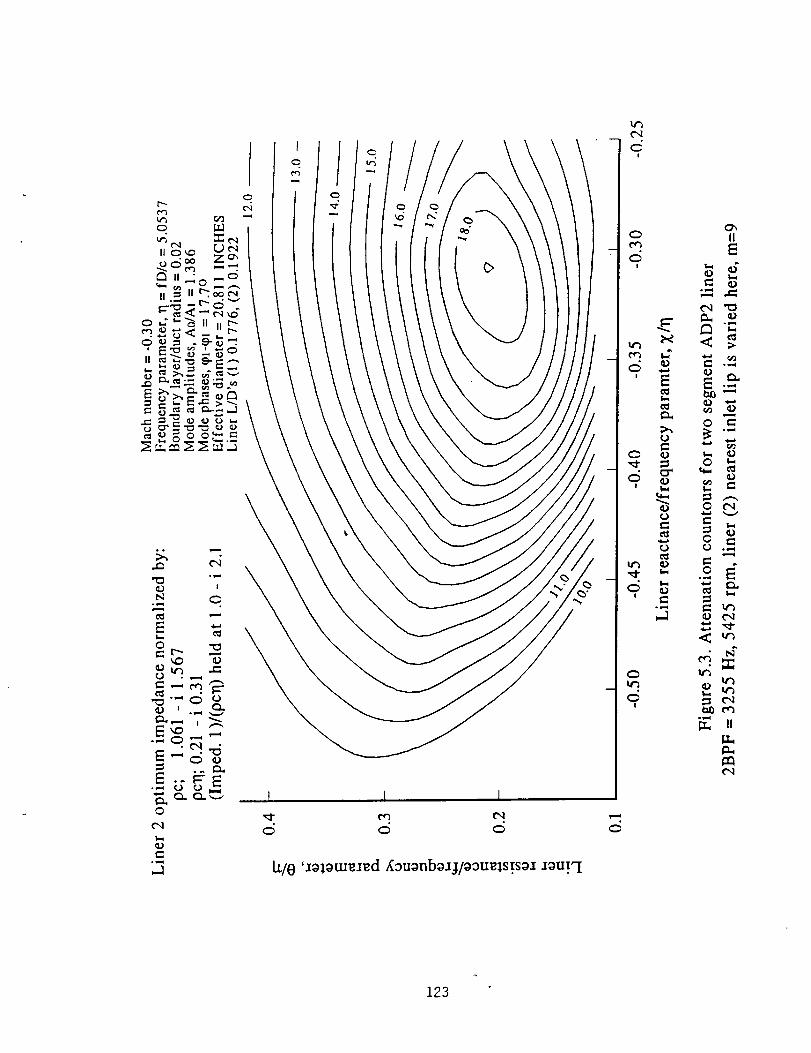
, /
/ :\\
(>
tt/O '_olotue_ed ,_zuonbo.u/oouels_.so:_ aou!"I
('4
!
0
0!
mc5 o
t'ct
0
0"m" m
o
o
M
!
II
c-
O 1=
o#°ml
d_
°,n=_[.l., II
t".l
123
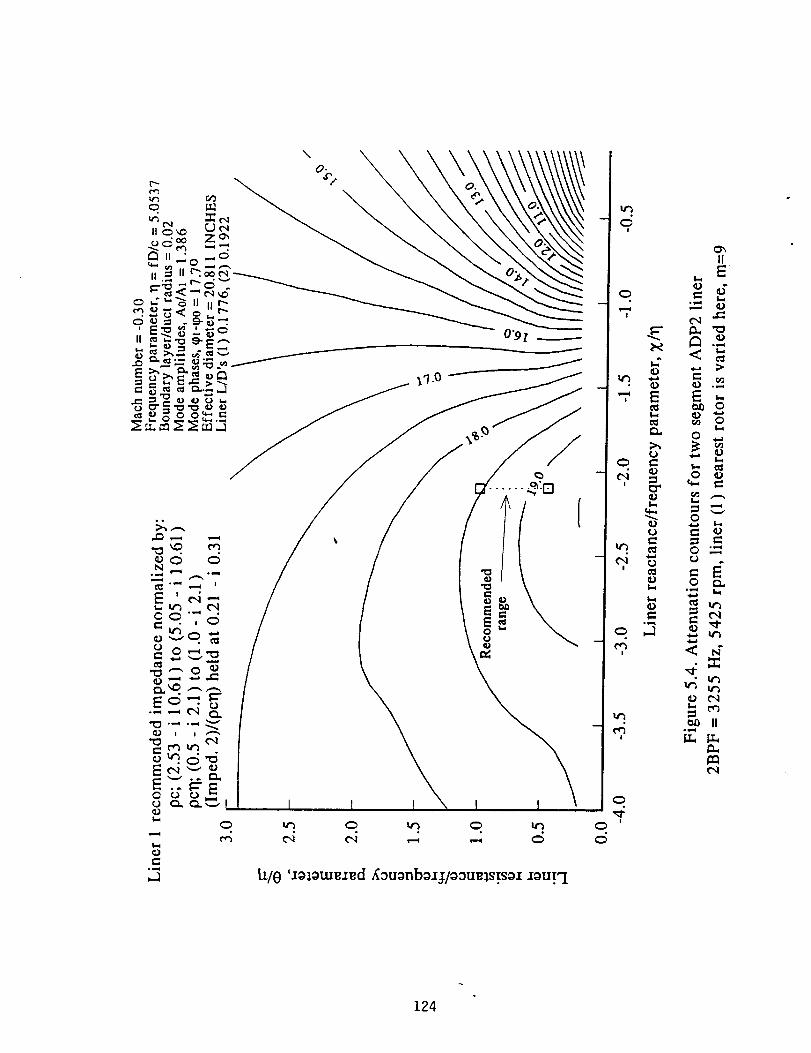
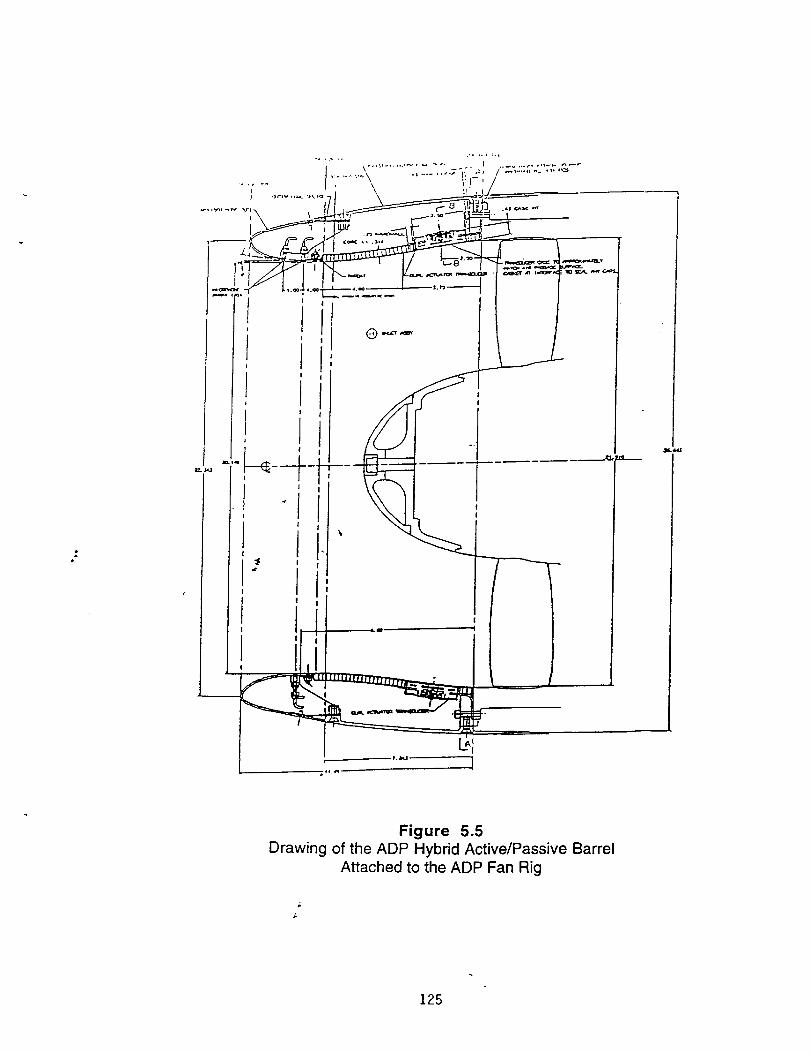
Figure 5.5
Drawing of the ADP Hybrid Active/Passive Barrel
Attached to the ADP Fan Rig
i.
125
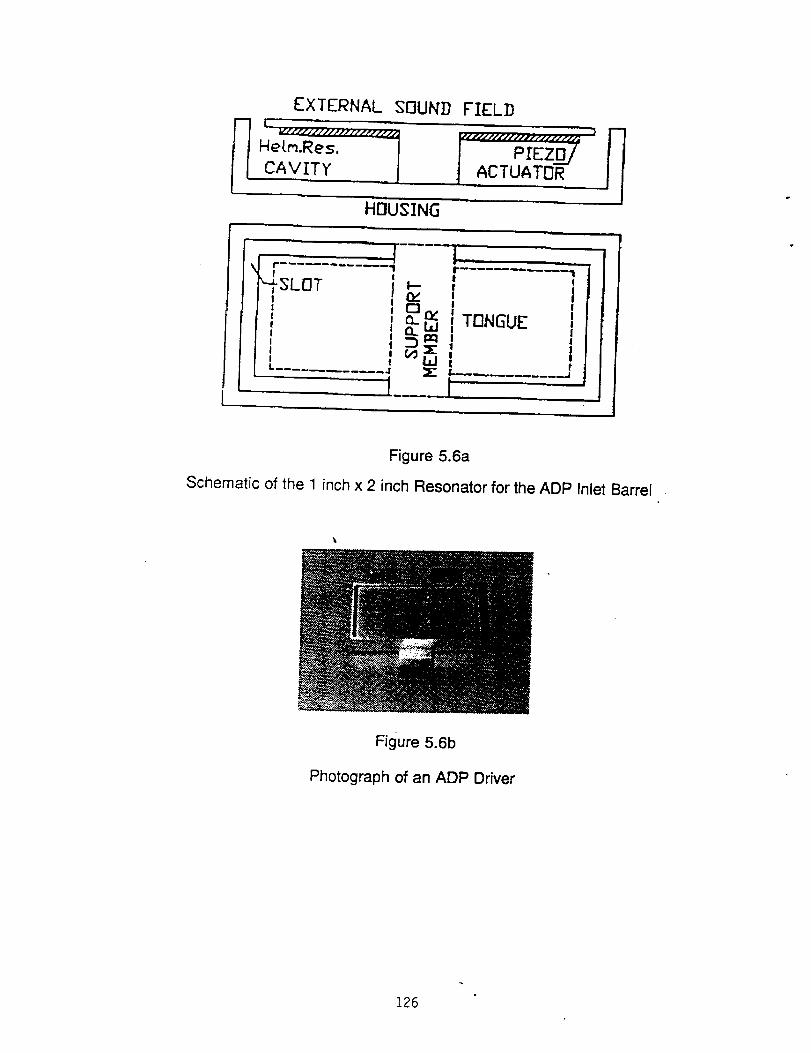
EXTERNAL SI3UND
L, vt f11 ljJl/] if£1111111_
Hetm.Res. /CAVITY J
FIELD
V111L f Lf Jf f11._111f l f f _
I PrEZ_ qt ACTUATOR
HI]USING
'--I-SLOT
I
k
I q
_ I TONGUE I
z_I J
tw ,
Figure 5.6a
Schematic of the 1 inch x 2 inch Resonator for the ADP Inlet Barrel
Figure 5.6b
Photograph of an ADP Driver
126
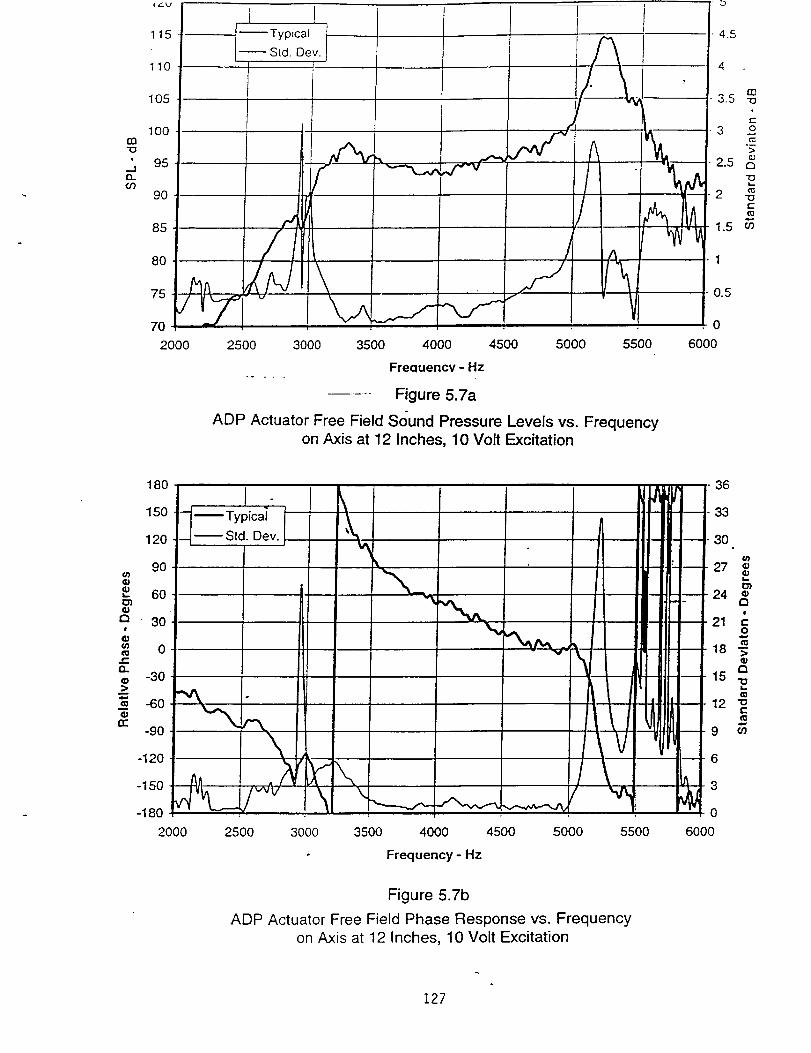
m"13
q
.Jt'_03
I-- Typical
SId. Dev. l
115
110
105
100
95
9O
85
80
70
2000 25OO 3000 3500 4000 4500 5000 5500
4.5
4
3.5
3
2.5
m 2
"V
. 0
6000
Freauencv - Hz
Figure 5.7a
ADP Actuator Free Field Sound Pressure Levels vs. Frequencyon Axis at 12 Inches, 10 Volt Excitation
0.5
m"t3
c"
O
C3
"I3t,_('_
"o(E
03
180 36
120 -- _ Std. Dev. 30
90 27
•_ 60 24 em
Vi! 1 =
= -30 15=_ -6o ''_ 12"8
-90 _ 9
6
-150
-180 _k_ "'"----.-,./,- J"",-,,,v-_ v-.v,A,.,-,,j_ _ 0
2000 2500 3000 3500 4000 4500 5000 5500 6000
Frequency- Hz
Figure 5.7b
ADP Actuator Free Field Phase Response vs. Frequency
on Axis at 12 Inches, 10 Volt Excitation
127
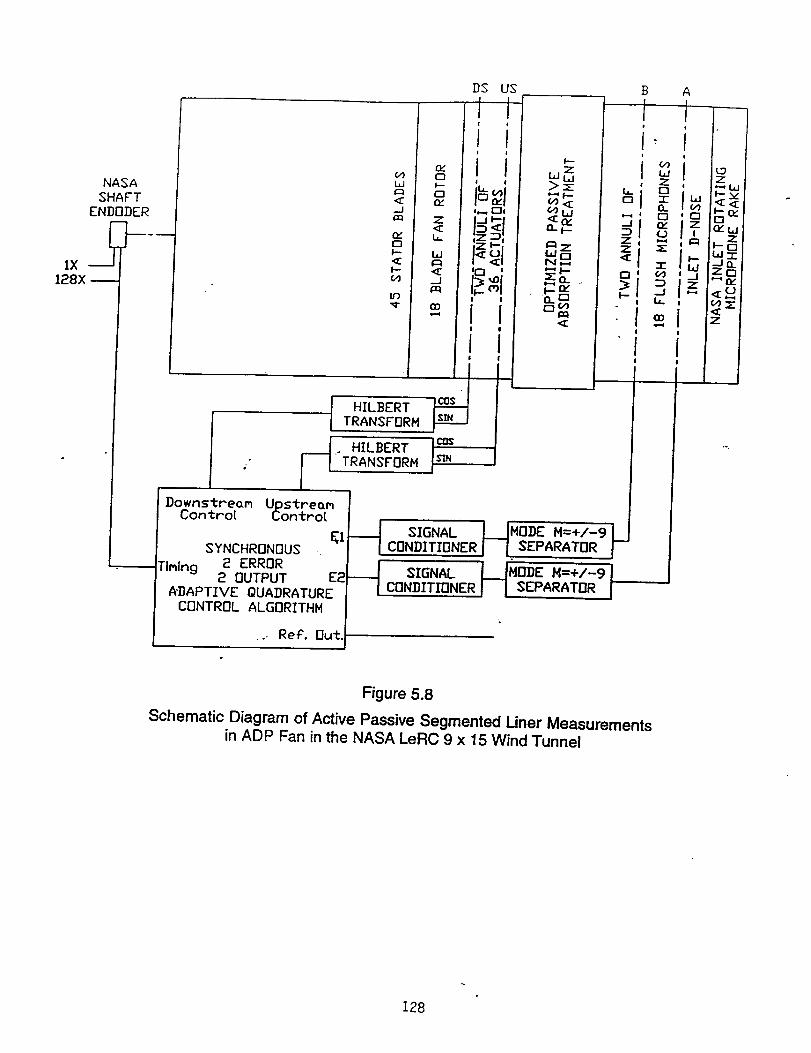
NASASHAFT
ENDODER
128X
(,9W
-JCI_
n-OF--
IS'),q-
I HILBERTTRANSFORM
. HILBERT/ "TRANSFORM
Downs±ream Ups±reoMCon±ro{ Con±roL
E1SYNCHRONOUS
Flmlng 2 ERROR2 OUTPUT E2
ADAPTIVE QUADRATURECONTROL ALGORITHM
I ..-Ree. 0u_.i
n-OI--Qn-
Z
h
W
.D
GO
d
DS US
I 1t I
I Ii i
I p,,,_ F'll
../f"
_7"
W
bln
<z:
__ SIGNAL _ ]MODE M=+/-9CONDITIONER .I SEPARATOR _
---_ SIGNAL I IFIODEM=+/-9 1CONDITIONER _ I SEPARATrIR
P,I--
°
B
I
b.
A
i
I---,v
c _o_
Figure 5.8
Schematic Diagram of Active Passive Segmented Liner Measurementsin ADP Fan in the NASA LeRC 9 x 15 Wind Tunnel
128
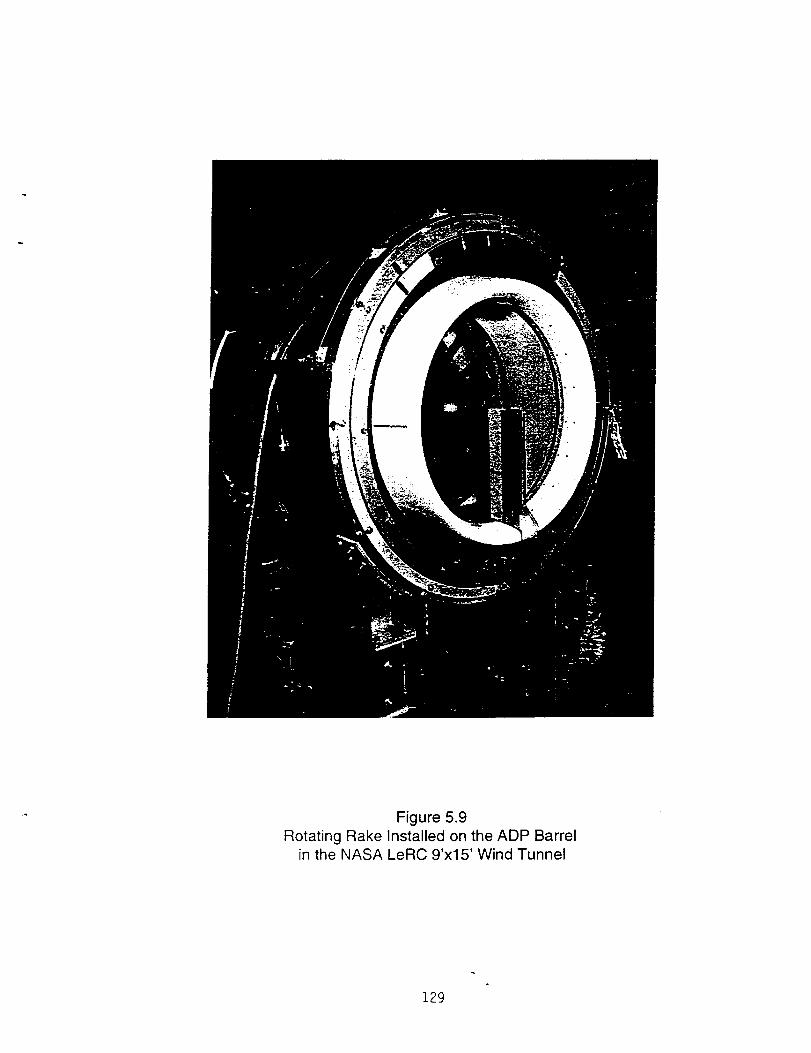
Figure 5.9
Rotating Rake Installed on the ADP Barrelin the NASA LeRC 9'x15' Wind Tunnel
129
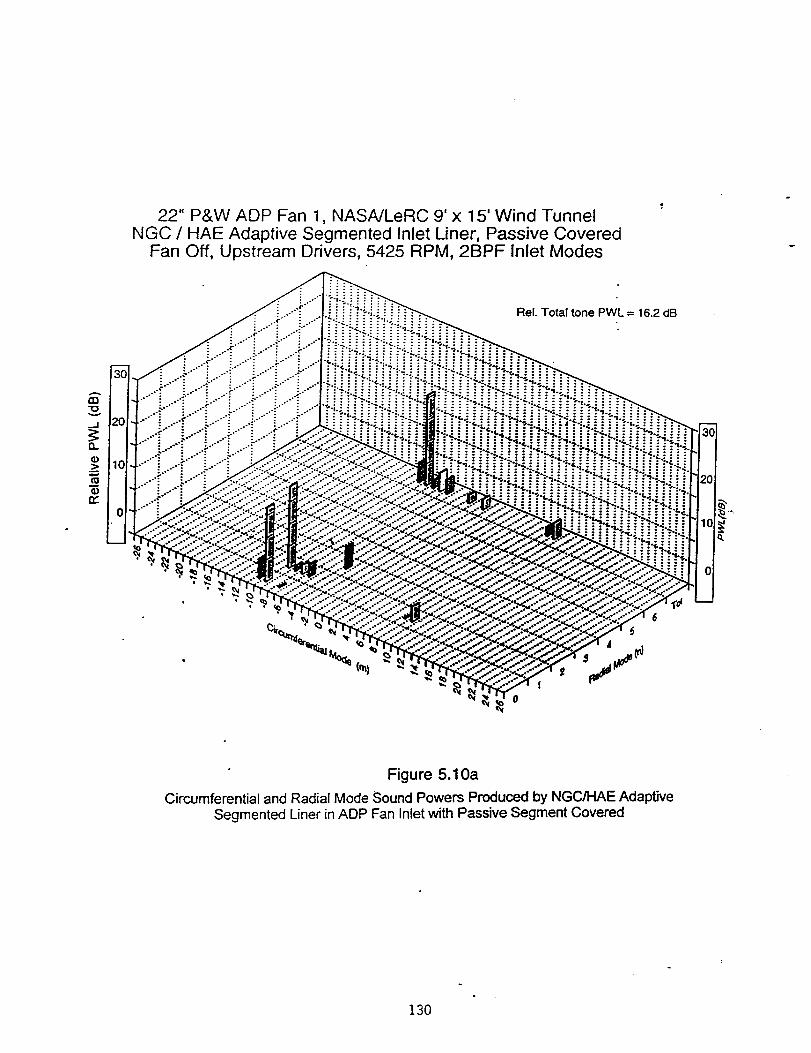
22" P&W ADP Fan 1, NASA/LeRC 9' x 15' Wind TunnelNGC / HAE Adaptive Segmented Inlet Liner, Passive Covered
Fan Off, Upstream Drivers, 5425 RPM, 2BPF Inlet Modes
n'lv
_J
.5
n,-
m
3Oi
201
101
01
.o°':
Rel. Total tone PWL = 16.2 dB
20
.°
Q.
0
Figure 5.10a
Circumferential and Radial Mode Sound Powers Produced by NGC/HAE AdaptiveSegmented Liner in ADP Fan Inlet with Passive Segment Covered
130
22" P&W ADP Fan 1, NASA/LeRC 9' x 15' Wind Tunnel
NGC / HAE Adaptive Segmented Inlet Liner, Passive CoveredFan Off, Upstream Drivers, 5425 RPM, 2BPF Inlet Modes
_i _ _ i iili iiiii_iiiiiiii_il iii iiiiiii_ii Ji_iii-iiiiiiii iiii i i i i i !" ! i i ; ; i ! i i i i i i i i i i ; i i _ i i ! i JTotal'tone'PWL=16_dBt ! i::::::::::::::::::::::::::::::::::::::::::: .::
-30-28-26-24-22-20-18-16-14-12-10 -8 -6 -4 -2 0 2 4 6 8 10 12 14 16 18 20 22 24 26 28 30CircumferentialModeOrder, m
Figure 5.10b ..... "
Sum of Radial Mode Relative Sound Powers in Circumferential ModesProduced by NGC/HAE Adaptive Segmented Liner in
ADP Fan Inlet with Passive Segment Covered
131
2BPF Inlet Modes, 22" P&W Fan _, NGC / HAEHardwall Inlet, 5425 RPM
G)t_
2(
1C
: .*"
.(" .: .,..- ,-...
.... .......i
I
I_ 0
2C
01
Figure 5.1 la
Circumferential and Radial Mode Relative Sound Powers inADP Fan Inlet with Hardwall Baseline
132
m
.,J
Q.
°_
n-
r3
2_
2(
15
10
22" P&W ADP Fan 1, NASA/LeRC 9'x 15' Wind TunnelHardwali Baseline
5425 RPM, 2BPF Inlet Modes, Mach 0.1
]iiiil;iiiiiiiiiiiiiiii!iiiiiiiiili!!iiilTot_Xto_PWL=24.0dBlili
5
0
.5_'-30-28-26-24-22-20-18-16-14-12-10-8 -6 -4 -2 0 2 4 6 8
Circumferential Mode Order, m
=============================================================
"i!i!!_!!i_i!!f!!if_i!fff!!ffff!f!!f!!f!!!!fii!i_!i_iii_
t!!!i!!ii!i!ii!i!iif!li!!!!!!iii!!iiii!ii!i!!!ii!!iiiiiii!ill
iiiiiiiiiiiiiiiiiiiiiliiiiiiiiiiii!iiiiiiiiiiiiiiiiiii.iiiiiiiiiiiiiifiiiiiiijiiiii iifiiiiii;N iiiiiiiiiiiiiiififiiiiiifiiiiiiiii!ii!i!iliiii"i i ll ll iiiiiiii!t!!fii!iiiiiiJiitiiiiiiii[iiI illli i tii iiiiii[ifiiiiiiii
1111t111"11111 IIIIilllllllllll|
10 12 14 16 18 20 _ 24 26 28 30
Figure 5.1 lbSum of Radial Mode Relative Sound Powers in Circumferential Modes in
ADP Fan Inlet with Hardwall Baseline
133
2BPF Inlet Modes, 22" P&W Fan 1, NGC / HAEActive/Passive Hybrid Inlet, 5425 RPM, Control Off
rn
._1
n 2(
._>
"6 1Cn-
O
n
2O
Q.
o_
.-J
Figure 5.12a
Circumferential and Radial Mode Relative Sound Powers inADP Fan Inlet with NGC/HAE Adaptive Segmented Uner, Control Off
134
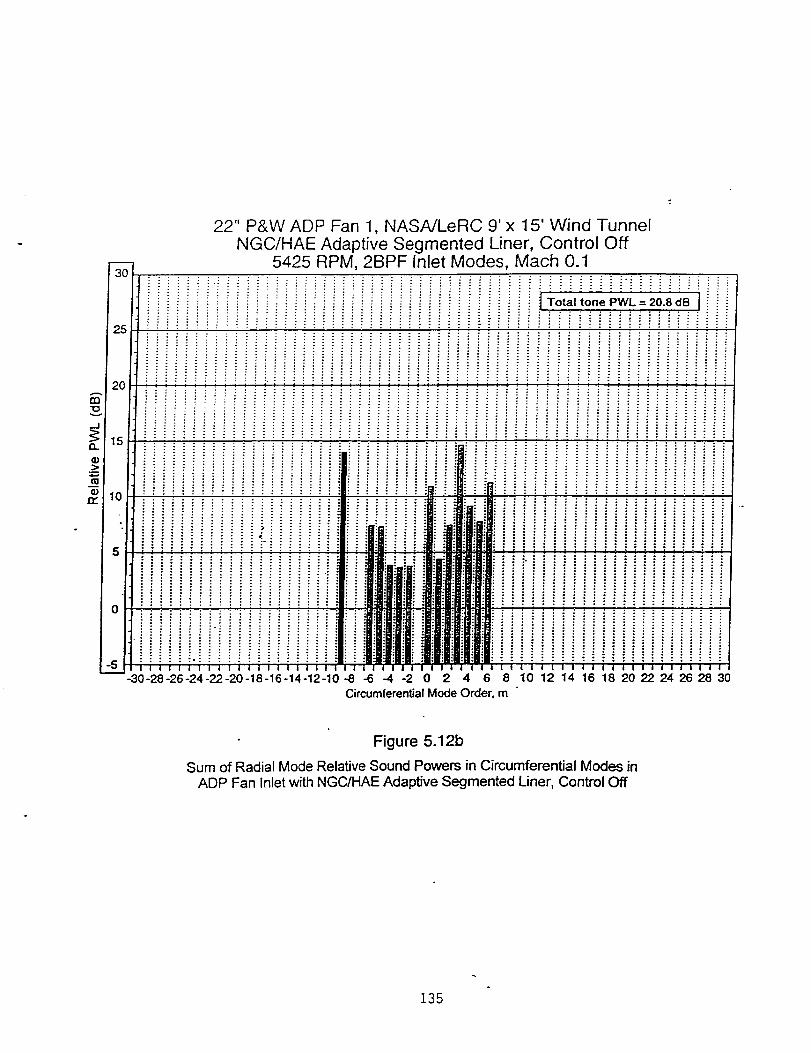
%
22" P&W ADP Fan 1, NASA/LeRC 9' x 15' Wind TunnelNGC/HAE Adaptive Segmented Liner, Control Off
5425 RPM, 2BPF Inlet Modes, Mach 0.1
2(03
v
_J
G}o_
a,-
: i i i j j i i i i i i Ji i i i i i i i i i i i i i i i i i i i i i i i ! i i i ]T=a"°nePWL=2£'8"=Iii2_
::::::::::::::::::::::::::::::::::::::::::::::::::::::::::::
_ !i!i!i iiiiiiii!iiiiii!iiiiiii!iigigiiiiigi!i!!igiiiiii!iii!i"giiiiiii!i!iiiiiiiiiiiiiiiii!!iiiiii!igiiiiiiiii!ii!iiigg_i!
_;i;;_i;i;i_i'_ii;_;i;i_;;i_;!!!! ::::_:::::.......... :::;:::::_ii".....................................................................
_iiiiiiiiiiiiiiiiiiiiiiiiii;iiiiiiiiii!iiii!iiiiiiii!iiiiiiii
15 ::::::::::::::::::::::::::::::::::::::::::::::::::::::::::::
iliiiiiiiiiiiiiiiiiiiliiiiiiiiiiiiiiiiii!!iii!iiiiiiiiiiiflil':iiiiiiiiiiiii]iiifiiijf,iiiiijiI jiffifiiiiifgiiiiiiiii]i'ifiifiiifflJ]fiiifiil]iltlijil|] g Iiiiiiiiiiiiiiiiiiiii!fl°ii[iiiiiiifiifiiiiiiliillfililitlil;lilitliiiiiiiiiiiii[iiiiiiiiii-- -30 -28 -26 -24 -_ -20 q 8 -16 -14 -12 -10 _ _ _ -2 0 2 4 6 8 10 12 14 16 18 20 _ 24 26 28 30
Circumfe_ntial Mode O_er, m
Figure 5.12b
Sum of Radial Mode Relative Sound Powers in Circumferential Modes in
ADP Fan Inlet with NGC/HAE Adaptive Segmented Liner, Control Off
135
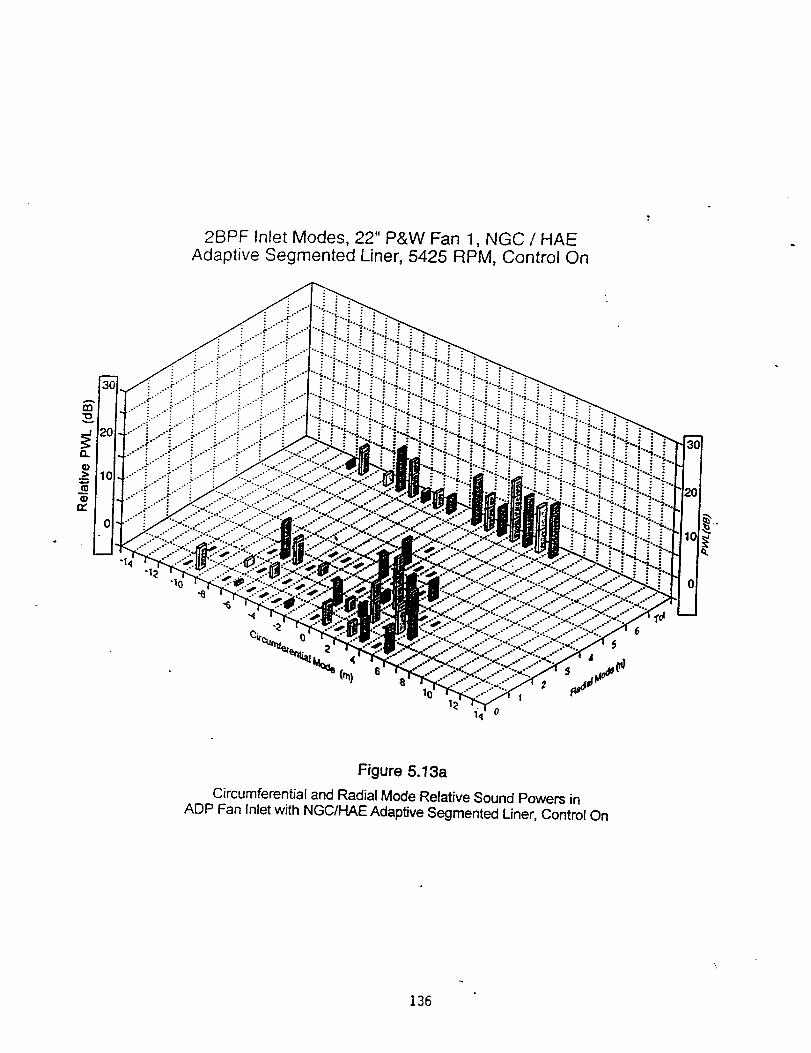
2BPF Inlet Modes, 22" P&W Fan 1, NGC / HAEAdaptive Segmented Liner, 5425 RPM, Control On
t_"o
20
10m
tYJ
oJ
2(
0
Figure 5.13a
Circumferential and Radial Mode Relative Sound Powers inADP Fan Inlet with NGC/I-{AE Adaptive Segmented Uner, Control On
136
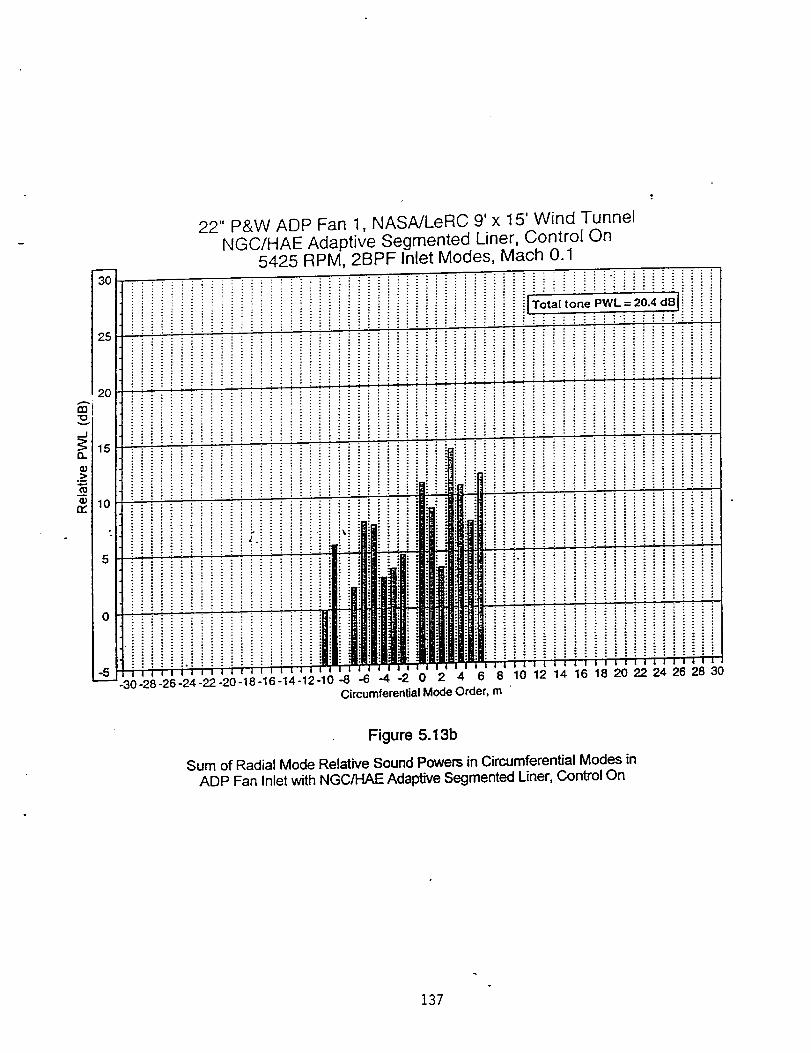
(o
3O
22" P&W ADP Fan 1, NASA/LeRC 9'x 15' Wind Tunnel
NGC/HAE Adaptive Segmented Liner, Control On5425 RPM, 2BPF Inlet Modes, Mach 0.1
: : ............. : :::::;::::::::::,: ::::::" 4d-, =BI !........................................ ;ITo_ _ ! _ ! _ _ _ _ _ ! s _ ! ! ! _ _ _ _ _ i _ _ _ _ _ _ i _ _ _ _ _ I _ ! _ _ _ taltonePWL=20.............................................................
25 ::::::::::::::::::::::::::::::::::::::::::::::::::::::::::::::
::::::::::::::::::::::::::::::::::::::::::::::::::::::::::::
::::::::::::::::::::::::::::::::::::::::::::::::::::::::::::
20 .................. :;::::::::::!5!_..._i!i!ii!!iiiiiiiiii!i_
15
................................ . ......................_ _; _ _ _ ; ; i _ _ _ ; ! _ _ _ ; i_] _ _::: " " " _ _ i _ ! ! ! _ _ i _ ! _! _
...................... ....... z_z"-_ii_!i_i_i!_!!_!!_!i!zl_
-: t0-28 -26 -24 -_ -20 -18 -16 -14 -12 -10 _ _ 4 _ 0 2 4 6 8 10 12 14 16 18 20 _ 24 26 28 30
CimumfemnSal M_e O_er, m
Figure 5.13b
Sum of Radial Mode Relative Sound Powers in Circumferential Modes inADP Fan Inlet with NGC/HAE Adaptive Segmented Liner, Control On
137
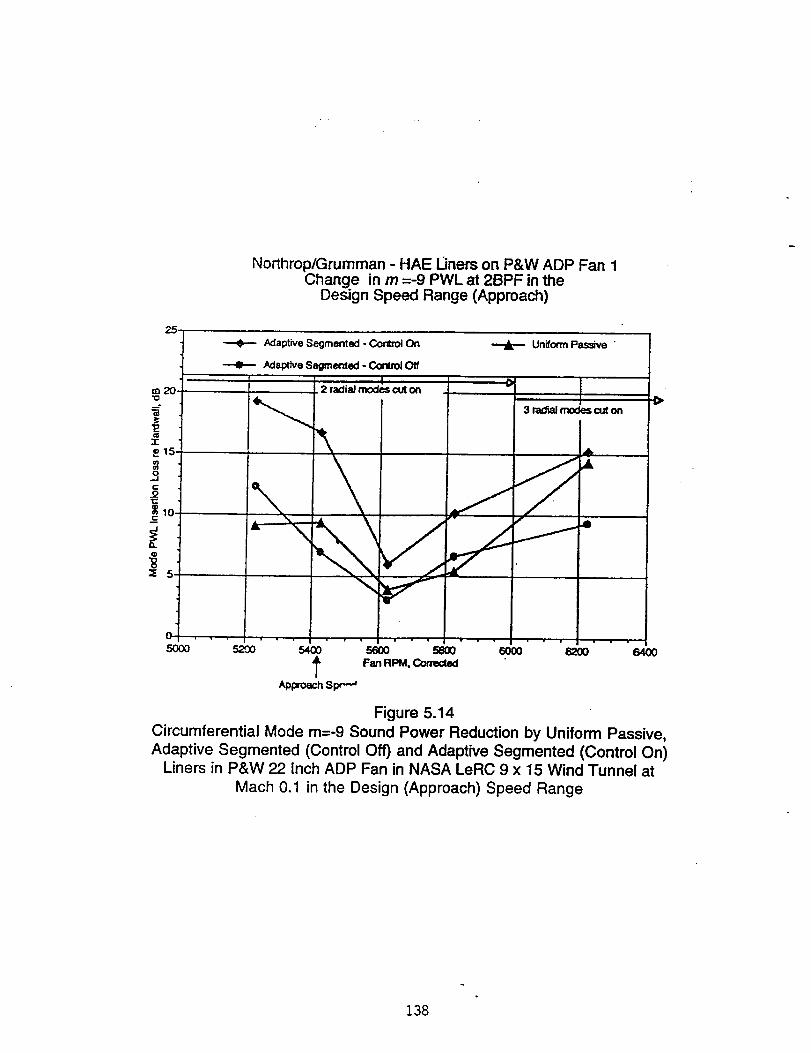
2,5,,
Northrop/Grumman - HAE liners on P&W ADP Fan 1Change in m =-9 PWL at 2BPF in the
Design Speed Range (Approach)
Adaptive Segmented - Corlrol On
AdRptlve Segmented - Control Off
I
Un_ormPassive "
m,1o
"2
2 radial rnod__es_out on
3 radial mocles cut on
(=-1-
_15,
0,,.I
C
1:: \
5-
5000 5200 5400 5600 5800 6000 6L_00
L Fan RPM, _
ApproachSp_"
64OO
Figure 5.14
Circumferential Mode m=-9 Sound Power Reduction by Uniform Passive,
Adaptive Segmented (Control Off) and Adaptive Segmented (Control On)Liners in P&W 22 Inch ADP Fan in NASA LeRC 9 x 15 Wind Tunnel at
Mach 0.1 in the Design (Approach) Speed Range
138
E0
o
o
E
o_ H:_aE
I_0
t_
0-"
_oo
0_.._
=<
_m
'-Z
,b-_ r.¢1e_---'Z
r..)_u4<
° _,,,I
0
sloq!aop ':Id_[E le uo!l_nuol_,_3 .to_od o.rlsnoo V
139
sloq.toop ':Id_tE le uo!lenuolle .tomod o._lsnoo V
140
P-
6
°N
_ .
O
_C',I
=<
N_
_ ,,.w
_ t _
u'_ "2. _
°_..I
I I I I I , ! _ I , I , I , I , o
sloq!ooP '::Id_lE le uo._l_nuo11_ _omod o!lsnoo V
141
t
sIoq_.oo p 'pu_[q"Id _ - auOl_cIS
142
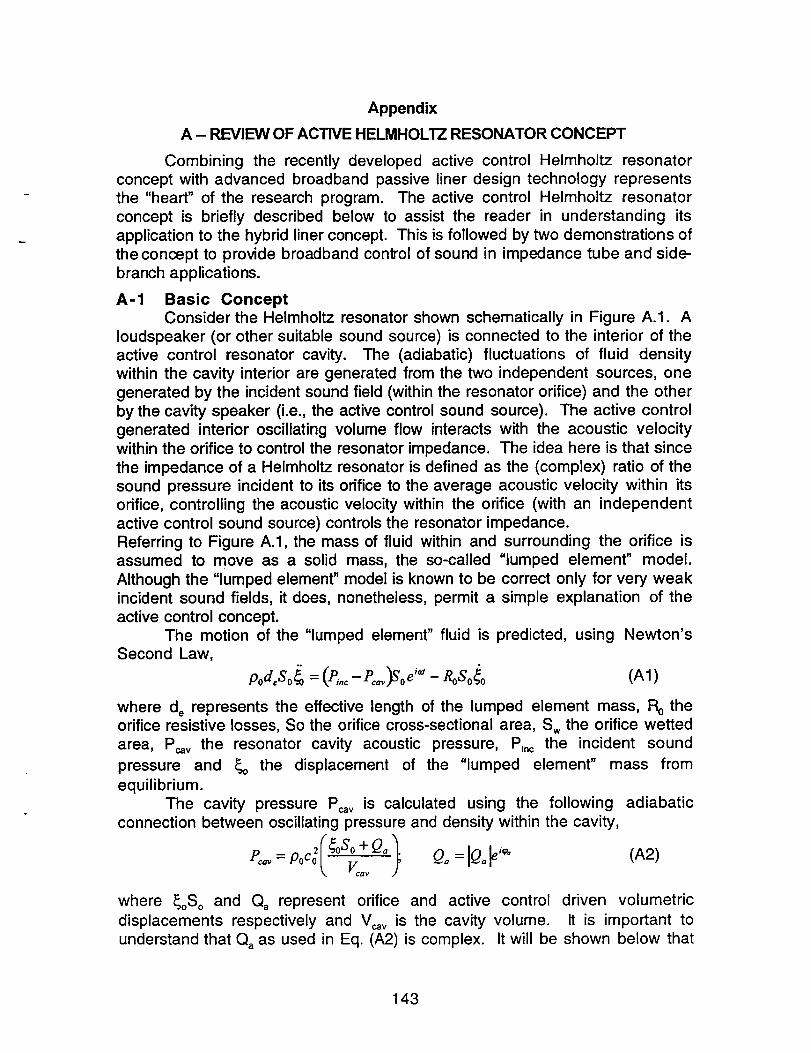
Appendix
A - REVIEW OF ACTIVE HELMHOLTZ RESONATOR CONCEPT
Combining the recently developed active control Helmholtz resonatorconcept with advanced broadband passive liner design technology representsthe "heart" of the research program. The active control Helmholtz resonatorconcept is briefly described below to assist the reader in understanding itsapplication to the hybrid liner concept. This is followed by two demonstrations of
the concept to provide broadband con_'ol of sound in impedance tube and side-branch applications.
A-1 Basic ConceptConsider the Helmholtz resonator shown schematically in Figure A.I. A
loudspeaker (or other suitable sound source) is connected to the interior of theactive control resonator cavity. The (adiabatic) fluctuations of fluid densitywithin the cavity interior are generated from the two independent sources, one
generated by the incident sound field (within the resonator orifice) and the otherby the cavity speaker (i.e., the active control sound source). The active controlgenerated interior oscillating volume flow interacts with the acoustic velocitywithin the orifice to control the resonator impedance. The idea here is that sincethe impedance of a Helmholtz resonator is defined as the (complex) ratio of thesound pressure incident to its orifice to the average acoustic velocity within itsorifice, controlling the acoustic velocity within the orifice (with an independentactive control sound source) controls the resonator impedance.Referring to Figure A.1, the mass of fluid within and surrounding the orifice isassumed to move as a solid mass, the so-called "lumped element" model.
Although the "lumped element" model is known to be correct only for very weakincident sound fields, it does, nonetheless, permit a simple explanation of theactive control concept.
The motion of the "lumped element" fluid is predicted, using Newton'sSecond Law,
pod, Solo =- p \_ e__[,P_,c- ,_o RoSo6o (At)
where d e represents the effective length of the lumped element mass, Ro theorifice resistive losses, So the orifice cross-sectional area, S. the orifice wettedarea, P_v the resonator cavity acoustic pressure, P_°c the incident sound
pressure and _o the displacement of the "lumped element" mass from
equilibrium.The cavity pressure Pcav is calculated using the following adiabatic
connection between oscillating pressure and density within the cavity,f %
where _oSo and Qa represent orifice and active control driven volumetric
displacements respectively and Vc, v is the cavity volume. It is important tounderstand that Qa as used in Eq. (A2) is complex. It will be shown below that
143
this plays an essential role in the control of resonator impedance and henceabsorption.
Substituting Eq.impedance Z yields,
(A2) into Eq. (A1) and solving for the resonator
,o =d.r. r=,,_'l (A3),,,o<_
I p_d. co_(_, pond siK_.
Equation (A3} isinterpretedas follows.Since Oa iscomplex, the active
control volume source provides two "free"parameters IO.land Ca (relative
phase between the =lumped element" and active control fluctuating volumeflows) which can be used to generate desired values of resistance and
reactance as a function of the incident sound pressure
A-2 Experimental Validation of the Active Resonator ConceptAn experimental program was undertaken to verify the scheme of
injecting acoustic energy into the cavity of Helmholtz resonators to control theirimpedance over wide frequency ranges above and below their natural or tuned
frequencies. Two experiments were conducted, one to provide anechoictermination in an impedance tube application and the other to provide a null orzero impedance in a side-branch application.
A-2.1Anechoic Termination Demonstration
Figure A2 is a schematic of the test set-up and data acquisition andreduction scheme used in an impedance tube test to demonstrate the activecontrol resonator concept. A Helmholtz resonator was attached to one end of
an impedance tube and a primary sound source at the opposite end. An activecontrol sound source was connected to the resonator cavity as shown. The
open-loop scheme shown schematically in Figure A2 was used to vary theimpedance of the Helmholtz resonator. The signals from the two microphonesused to calculate the incident and reflected sound waves were read by the dataacquisition system of a MassComp 5400 minicomputer, Fourier decomposed todetermine amplitude and phase and then processed algebraically to determinethe acoustic absorption coefficient.
If one-dimensional sound is generated within the impedance tube, then
the following theoretical estimate of the fraction of incident sound energy c_absorbed by the resonator can be derived,
C_-----1-- (A4)
144

y
The computer code then adjusts the amplitude and phase of the cavity
speaker until c_is maximized. It follows from Eq. (A4) that maximum absorption
(i.e., o_= 1) occurs when
R_=1;PoCo
X_=0 (A5a,b)PoCo
of the active controlReferring to Eq. (A3), the amplitude and phase
fluctuating volume sound source Qa provides the two "free" parameters to satisfyEq. (A5a,b). The required amplitude and phase generated from the activecontrol sound source can be determined from Eq. (A3) and Eq. (A5). In practicalapplications, however, this is accomplished experimentally as discussed below.
Figure A3 displays the measured normal incident absorption coefficientwith and without active control. Note that except near resonance (260 Hz), thenon-controlled absorption coefficient is very small. With near optimized controlapplied to the cavity source, the absorption coefficient exceeded 99% (i.e.,greater than 20 dB) over a wide frequency range. Although it is difficult to seefrom Figure A3, some of the measured absorption coefficient were larger than0.999 which corresponds to over 30 dB absorption. It is important tounderstand, however, that the amplitude and phase of the active control sound
energy introduced into the cavity must be very accurately controlled to achieve> 0.999.
Referring to Figure A3, observe that efficient absorption was achievedwith active control over a bandwidth extending from approximately 200 - 760 Hz,a ratio of 3.8. The important point to be made here in terms of the objectives ofthis study is that the above tests were not designed to maximize absorptionbandwidth in terms of maximum/minimum operational frequency ranges. Thelow frequency range was limited .by the low frequency performance of the
particular active control speaker used in the tests and the hig h frequency rangewas limited by restricting the sound field in the impedance tube to be plane-wave. Thus the bandwidth test results displayed in Figure A3 were not causedby limitations of the active control scheme - only imposed by operationalconstraints.
The following discussion explains how active controlled Helmholtz
resonators achieve efficient broadband sound absorption. A properly designedpassive Helmholtz resonator efficiently absorbs sound at its tuned or resonantfrequency because its reactance vanishes. At frequencies very much higher
than its tuned frequency, the impedance of a resonator is controlled by largepositive inertial reactance which caused the resonator to reflect much of the
incident sound and hence absorb poorly. Conversely, at very low frequencies,the resonator impedance is controlled by very large negative stiffnessreactance and hence also absorbs poorly. The active controlled resonatorintroduces a secondary sound field into its cavity having the proper amplitudeand phase to cancel or null the resonator reactance regardless of thefrequency of the incident sound field. Further, the active control system can
145
also adjust the resistance of the resonator to achieve efficient soundabsorption.
To summarize, the active control resonator achieved excellent sound
absorption over the entire frequency range tested - thus behaving as a highlyefficient broadband sound absorber! These results are both remarkable and
very important because they demonstrate the practicality of applying activecontrol to Helmholtz resonators.
A-2.2Side-Branch Demonstration
The second application assumes that a Helmholtz resonator is installed
on one side of a duct containing an ideal "pc" termination at one end and a
sound source at the opposite end as shown schematically in Figure A4. Theinteraction of incident sound (P_)with the resonator generates reflected (Pr) andtransmitted (Pt) sound pressure fields. Assuming one-dimensional sound withinthe duct, the following expression can be derived for the transmitted acoustic
energy coefficient (e_) in terms of the resonator impedance,
s t = [2Rms(l+2R,es) + 4X_e,]_ +4Xr2es
[o+ +,xP.]Equation (6) shows that when the side branch resonator impedance
vanishes, all of the incident sound energy is reflected back towards the sourceand none is transmitted past the side branch resonator. Thus, the desiredimpedance of the side-branch resonator is
R.E s = X.E s = 0 (A7a,b)
• Figure A4 is a schematic of the basic experimental setup of the activeresonator side-branch application. The setup is similar to the anechoictermination setup with the following exceptions:
• The signals from microphones 1 and 2 signals were processed by an on-line network to separate direct and reflected signal components.
• The active resonator was relocated to the side of the duct and ananechoic termination wedge made of Kevlar was installed at the end ofthe duct.
• An additional microphone was placed between the resonator and theanechoic wedge to measure the transmitted sound wave.
Figure A5 displays the sound energy transmission loss measured withand without active control applied to the resonator. Note that in the absence of
active control, the transmission loss is near zero for all frequencies except at itsnatural or tuned frequency of 820 Hz where a sound energy transmission lossof about 24 dB was measured. Using the active control system to optimize theamplitude and phase of the sound field injected into the resonator cavity, sound
energy transmission losses below 40 dB were achieved over the frequencyrange 100 - 650 Hz, a 6.5 ratio!
146
o_
0C0(DL..
o
C0_D
CK
N
0c-
E
I
0L.
C0(D
0
0
C0
o_
_D0
C
_D
3
E
0>
0
C0
0
<
CD
tJ_
147
o o
i dI
\
/_\A
I
°1t0
0
<n-
>_ >_
r-@E
°_
r_XW
e-0
°--
o--
o
0
co00
r_0
0o
o--
o<
0
E
°--
121o
.--
E
c-o
c,i<
.--
U_
148
c_
T--
o
o0
E
o cJZZ
0 0
0
f I I ! !
.- o o c5 c_
0 °) lua!oNaos) uop,dJosqv
ooco
oo
0o
0
o
oo
o0
0o
o0
o,_-c_
U-r"
!
>,{3t-
_r
L-
0
c-O
FF
oI.-
0
0
.--
0
e-"
"o
>
c-O
C
E
0
E
0C
E0
13._
r-
°_
0
(90
c)
0
C1.
oor)r7
ed
°_
U_
149
• d
fe
• e
w
.4-7:'"'1.:,,,,.: -|
(..)
E
(/')
0
<
I-.-c-O
o_
C::
,4,..0
<..C
C
m!
o_
5.,,,.
0
c-O0_I1)
r_¢)
o_
0
0
(..)o_
E
r-
<I11
o_
If
150
0
8P -ss0q u0!ss!wsueJj_
000
0c3
0oco
oo
00
N
-r-!
0
0
c-O
0
E0
0
2o<r-oE
rn
o_
>._
e--0
<
e-
EQ)>0
E
0
0_Jc-Oif)
o--
E
t--
t_
I--
u4<
151
REPORT DOCUMENTATION PAGE FormApprovedOMB No. 0704-0188
Public reporting burden for thLs collection of information is estimated to average 1 hour per response, including the time for reviewing instructions, searching existing data sources.
gathenng and maintaining the data needed, and completing and reviewing the collection of information. Send comments regarding this burden estimate or any other aspect of this
collection of information, including suggestions for reducing this burden, to Washington Headquarters Services, Directorate for Information Operations and Reports, 1215 Jefferson
Dav_s Highway, Suite 1204. Arlington. VA 22202-4302. and to the Office of Management and Budget, Paperwork Reduction Project (0704-0188}, Washington, DC 20503.
1. AGENCY USE ONLY (Leave blank) 2. REPORT DATE
February 19994. TITLE AND SUBTITLE
Hybrid Active/Passive Jet Engine Noises Suppression System
6. AUTHOR(S)
C.A. Parente, N. Arcas, B.E. Walker, A.S. Hersh, and E.J. Rice
7. PERFORMING ORGANIZATION NAME(S) AND ADDRESS{ES)
Northrop Grumman Corporation
Advanced Systems & Technology
S. Oyster Bay Road
Bethpage, New York 11714
9. SPONSORING/MONITORING AGENCY NAME(S) AND ADDRESS(ES)
National Aeronautics and Space Administration
Lewis Research Center
Cleveland, Ohio 44135-3191
3. REPORT TYPE AND DATES COVERED
Final Contractor Report5. FUNDING NUMBERS
WU-538-03-11--00
NCC3-379
8. PERFORMING ORGANIZATIONREPORT NUMBER
E-11570
10. SPONSORING/MONITORINGAGENCY REPORT NUMBER
NASA CR--1999-208875
NSL-RPT-98--O02
11. SUPPLEMENTARY NOTES
C.A. Parente and N. Areas, Northrop Grumman Corporation, Bethpage, New York; B.E. Walker and A.S. Hersh, Hersh
Acoustical Engineering, Inc., Westlake Village, California; E.J. Rice, E.J. Rice Consulting, Westlake, Ohio. Project
Manager, Dennis L. Huff, NASA Lewis Research Center, organization code 5940, (216) 433-3913.
12a. DISTRIBUTION/AVAILABIUTY STATEMENT
Unclassified - Unlimited
Subject Category: 71 Distribution: Nonstandard
This publication is available from the NASA Center for AeroSpace Information, (301) 621--0390.
12b. DISTRIBUTION CODE
13. ABSTRACT (Maximum 200 words)
A novel adaptive segmented liner concept has been developed that employs active control elements to modify the in-duct
sound field to enhance the tone-suppressing performance of passive liner elements. This could potentially allow engine
designs that inherently produce more tone noise but less broadband noise, or could allow passive liner designs to more
optimally address high frequency broadband noise. A proof-of-concept validation program was undertaken, consisting of
the development of an adaptive segmented liner that would maximize attenuation of two radial modes in a circular or
annular duct. The liner consisted of a leading active segment with dual annuli of axially spaced active Helmholtz resona-
tors, followed by an optimized passive liner and then an array of sensing microphones. Three successively complex
versions of the adaptive liner were constructed and their performances tested relative to the performance of optimized
uniform passive and segmented passive liners. The salient results of the tests were: The adaptive segmented linerper-
formed well in a high flow speed model fan inlet environment, was successfully scaled to a high sound frequency and
successfully attenuated three radial modes using sensor and active resonator arrays that were designed for a two mode,
lower frequency environment.
14. SUBJECT TERMS
Acoustics; Fan noise; Active noise control; Turbomachinery
17. SECURITY CLASSIFICATIONOF REPORT
Unclassified
NSN 7540-01-280-5500
18. SECURITY CLASSIFICATIONOF THIS PAGE
Unclassified
19. SECURITYCLASSIFICATIONOF ABSTRACT
Unclassified
15. NUMBER OF PAGES
16616. PRICE CODE
A0920. LIMITATION OF ABSTRACT
Standard Form 298 (Rev, 2-89)Prescribed by ANSI Std. Z39-18
298-102