how quality, value and satisfaction create passenger
TRANSCRIPT

The International Journal of Accounting and Business Society 95
Vol. 22, No. 2 December 2014Department of Accounting
Faculty of Economics & Business – University of Brawijaya
HOW QUALITY, VALUE AND SATISFACTION CREATE PASSENGER LOYALTY: AN EMPIRICAL STUDY ON INDONESIA
BUS RAPID TRANSIT PASSENGER
Ananda Sabil Hussein1)
Raditha Hapsari2)
1)University of Brawijaya2)Lincoln University Canterbury
AbstractThis study aims to investigate the dimensions of service quality especially in the area of public transport as well asthe role of service quality in enhancing passenger’s value, satisfaction and loyalty. Partial Least Squares (PLS) with survey data from 152 BRT passengerswas used by this study. This study found that outcome quality, physical quality and interaction quality are the the primary dimensions of service quality. In addition, this study explained that service quality has a significant effect on passenger perceived value, satisfaction and loyalty. Apart from perceived service quality, this study also found that passenger satisfaction and perceived value are the essential determinants of passenger loyalty.
Keywords: Bus Rapid Transit, Outcome quality, Interaction quality, Physical quality, service quality, satisfaction and loyalty.
IntroductionIn these days, tourism sector is one of major contributor for
Indonesian national budget. According to Indonesia Ministry of Tourism and Creative Economy, tourism contributed around Rp 80 billion intostate budget (Rohmat, 2012). While the growth of tourism industry increase significantly, some problems are still faced by this sector. Traffic congestion is one of big problemsfor tourism industry especially in the big city as Jakarta– the capital city of Indonesia. It becomes a chronic problem that is expected to be worsen if there is no effort to improve the existing transportation system. The economic loss caused by traffic congestion in the region around $ 68 million per year– and this estimate excludes the impacts of traffic congestion and pollution on human health (Dikun, 2003)

Vol. 22, No. 2 December 2014Department of AccountingFaculty of Economics & Business – University of Brawijaya
96 How Quality, Value And Satisfaction Create Passenger Loyalty: An ....
The use of public transportation has been recommend by government and scholars to reduce the congestion and support tourism industry.Some mass mode transportations have been introduced by Jakarta government such as bus and train. The latest mode provided by government is Bus Rapid Transit (BRT) which is called as TransJakarta. Considered as a new public transportation mode, there is a need for the provider to increase the quality service offered in order to persuade people to use this mode and to retain them..
In the domain of marketing study, service quality has been recognized widely as an important determinant of customer loyalty (Liao & Hsieh, 2011; Yee et al., 2010). Yunuset al.(2012) contend that the service quality is not only important for service companies but also for manufactures. Buttle(1996) suggest that service quality would create competitive differentiation which will differentiate a company with other.
In these days, service quality is also acknowledged as an essential construct in the area of public transport management (Chou et al., 2011; Lai & Chen, 2011; Saha, 2009). Chou et al. (2011) argue that passengers would remain to use public transport when they perceive a high quality of service. In accordance with Chouet al. (2011), Ibeas and Cecin(2011) explain that the quality of service offered by public transport plays an important role in changing people daily transport habits. For that reason, it is believed that improving service quality is important for public transport industry.
While service quality has been understood as an important factor in service industry including in public transport, there is still a debate among scholars about its dimensions(Brady & Cronin Jr, 2001). To date, five dimensions proposed by Parasuramanet al. (1988) are used extensively by scholars in analysing service quality. While these dimensions are used widely, there are some criticisms addressed to these dimensions (Cronin & Taylor, 1994; Shu, 2010).
Studies in public transportation area mainly emphasized on Parasuraman’s service quality dimension in measuring service quality (Eboli & Mazzulla, 2008; Lai & Chen, 2011; Pérez et al., 2007). Theoretically, the latest service quality literature proposed to use hierarchical model of service quality since it is more comprehensive than the traditional one. Studies such as Hu and Jen (2007) and Clemes and Gan (2013)have applied hierarchical service quality model in measuring service quality. However, to date, there is no study has applied hierarchical service quality in measuring the quality of service offered by BRT mode.
Apart from its effect on loyalty, scholars explain that service quality also plays an important role in satisfying passenger of public transport(Park et al., 2004; Satisfaction, 2007; Tyrinopoulos & Antoniou, 2008). The higher the quality of public transport offered, the higher the satisfaction of passenger. In the field of service marketing, satisfied customer is likely to be more loyal then unsatisfied customer. Therefore, it is important for public transport providers to provide a high quality of
The International Journal of Accounting and Business Society 97
Vol. 22, No. 2 December 2014Department of Accounting
Faculty of Economics & Business – University of Brawijaya
services which can satisfy the passenger that finally remain them to use the public transport.
Passenger perceived value is also considered as an important factor in transport management. Lai and Chen(2011)contend that the value perceived by passenger would influence their loyalty toward using public transport. To increase passenger perceived value, public transport providers should be able to provide a high quality of service since service quality positively affect perceived value (Jen & Hu, 2003). Although some have investigated the linkages among these constructs, there is no study has been conducted to measure these relationships in the perception of BRT’s passengers in Indonesia.
Based on the research issues stated, two research objectives of this study are:1. To identify the service quality dimensions as perceived by Bus Rapid
Transit passengers2. To test the relationships among several essential marketing constructs
namely service quality, perceived value,passenger satisfaction, and passenger loyalty.
This study offers some contributions once it meets these two research objectives. First and foremost, this study develops and tests a comprehensive hierarchical model providing a complete and integrated analysis of the dimensions underlying customers’ perceptions of service quality and its relationships with several important marketing constructs in service sector such as perceived value, satisfaction and loyalty. Second, this study provides empirical support for the use of a hierarchical model to conceptualize and measure customers’ perceptions of service quality in the public transport management. Third, the results of this study will benefit marketers and practitioners who are already operating in or preparing to enter, the public transport industry since the findings may assist these organizations in developing and implementing successful business strategies.
THEORETICAL BACKGROUND AND HYPOTHESESSince this study aims to identify the dimensions of service quality
and the relationships among service quality, perceived value, satisfaction and loyalty in the context of BRT;s passengers, some theories are discussed in this section. In addition, this section would propose the hypotheses are tested in this study.
Service QualityIn the area of service marketing study, Parasuraman et al. (1985)
stated that service quality is an elusive construct. Furthermore, Rust and Oliver (1994) contend that service quality is a subjective manner. Hence, Brady and Cronin Jr (2001) contend that the construct of service quality is difficult to grasp.

Vol. 22, No. 2 December 2014Department of AccountingFaculty of Economics & Business – University of Brawijaya
98 How Quality, Value And Satisfaction Create Passenger Loyalty: An ....
In these days, SERVQUAL scale is the instrument which is most widely used by scholars to measure service quality (Amin & Isa, 2008; Barroso et al., 2010; Huang, 2010; Yang et al., 2006). This scale was developed by Parasuraman et al. (1988) based on disconfirmation paradigm. Although SERVQUAL has been used extensively in measuring service quality, several critics are addressed toward this instrument(Babakus& Boller, 1992; Carman, 1990).
While there is no agreement about the conceptualization of service quality, scholars agree that service quality is a multidimensional (Brady & Cronin Jr, 2001; Dabholkar et al., 1995; Parasuraman et al., 1988). The study of Brady and Cronin Jr (2001) found that the overall perception of service quality is affected by three dimensions namely interaction quality, physical quality and outcome quality. This finding is similar with several studies which also found these dimensions as the dimensions of service quality(Clemes et al., 2011; Clemes et al., 2013; Dabholkar et al., 1995; Shu, 2010).
Therefore, these following hypotheses are proposed:H1a : Interaction quality is a dimension of service qualityH1b : Physical quality is a dimension of service qualityH1c : Outcome quality is a dimension of service quality
In the area of customer relationship marketing, service quality is acknowledged as a significant determinant of customer perceived value. Parasuraman et al. (1988) contend that the quality of service offered relies on the overall consumer judgment about the superiority of the product or service. Andreassen and Lindestad (1998)suggest that in the evaluation of the service value, transaction’s specific attributes as well as the quality of service and price would be considered by consumers. In this situation, it is most likely that quality-related factors is assumed to be the determinant of customer value. The higher quality provided by service provider, the higher value perceived by customers.Studies in the area of public transport found that the quality of service provided by public transport provider significantly influences passenger perceived value(Jen & Hu, 2003; Lai & Chen, 2011).
Apart its effect on customer perceived value, service quality is also found to have an essential effect on customer satisfaction.The general marketing literature agrees that service quality and satisfaction are two interrelated constructs (Baumann et al., 2007; Jamal & Anastasiadou, 2009). Customer would be satisfied toward the service provided when they perceive that the service has a high quality. Several studies indicate that service quality is a robust determinant of customer satisfaction (Clemes et al., 2013; Shu, 2010; Wu, 2009). In the area of transport studies, scholars also found the important role of service quality in influencing passenger satisfaction. Eboli and Mazulla (2007)in their study about bus transit service quality attributes found that passenger satisfaction is significantly influenced by the attributes of service quality.
The International Journal of Accounting and Business Society 99
Vol. 22, No. 2 December 2014Department of Accounting
Faculty of Economics & Business – University of Brawijaya
Similar to this study, service quality is also found to have an important role in influencing high speed rail passenger satisfaction in Korea and Taiwan (Chou & Kim, 2009).
Hence this study proposed:H2 : Service quality has a significant effect on passenger perceived
valueH3 : Service quality has a significant effect on passenger satisfaction
Perceived ValueConsumer value is an important concept in marketing field.
Theoretically,Gallarza and Gil Saura (2006) explain that the concept of value is based on the development of two essential consumer behavior dimensions namely economic and psychological. Furthermore, value is might explain different areas of consumer behavior such as product choice, buying intention and repeat purchasing. They also claim that consumer value is a determinant of other important marketing constructs such as satisfaction and loyalty.
According to Zeithaml (1988) perceived value is the overall assessment of the product’s utility based on perception about what is received and what is given. To purchase products or service, customer might cognitively incorporate their perceptions of benefits and sacrifices (Choi et al., 2004). Therefore, it can be said that customer perceived value is formed by customers’ perception and not by suppliers’ assumption (Bhattacharya & Singh, 2008).
Studies found that customer perceived value is an important construct in determining customer satisfaction. The studies on conventional retailers found that customer satisfaction is affected by customer perceived value in the most cases (Cronin Jr et al., 2000; Eggert & Ulaga, 2002). In accordance to the studies on the domain of retail study, the significant effect of customer perceived value on customer satisfaction is also found on the studies of public transport (Lai & Chen, 2011; Sumaedi et al., 2012). These studies contend that the higher value perceived by public transport passenger, the higher their satisfaction.As a determinant of customer satisfaction, perceived value also has a significant effect on customer loyalty.
In the context of hospitality industry, Oh (1999) proposed perceived value, might completely moderate the effects of service quality of customer satisfaction. Similar to Oh (1999), Wu (2009) proposed that there is a moderating effect of perceived value on the relationship between service quality on customer satisfaction. While these researches examined the moderating effect of perceived value, there is no study have investigated its effect in the area of of public transport management.
Based on the explanations, this study proposed:H4 : Passenger perceived value has a significant effect on passenger
satisfaction

Vol. 22, No. 2 December 2014Department of AccountingFaculty of Economics & Business – University of Brawijaya
100 How Quality, Value And Satisfaction Create Passenger Loyalty: An ....
H5: Passenger perceived value moderates the effect of service quality of passenger satisfaction
H6 : Passenger perceived value has a significant effect on passenger loyalty
H7 : There is an indirect significant effect of service quality on passenger loyalty through perceived value
Customer Satisfaction Wang et al. 2004argue that in marketing literature, the
conceptualization of customer satisfaction can be divided into two types they are transaction-specific perspective and accepted cumulative perspective. Fornell et al. (1996)explain that customer satisfaction is an important marketing construct. As an important marketing factor, the high level of customer satisfaction would result the high level of customer loyalty, a lower level of customer price sensitivity, a reduction in failed marketing cost and new customer creation and an improvement in the effectiveness of advertising and business reputation.
Several studies reported a link between customer satisfaction and service outcomes such as loyalty, positive word-of-mouth and purchase intentions. Previous studies on customer satisfaction-behavioral consequences explained that customer satisfaction directly influenced behavioral intention. In the domain of transport management studies, passenger satisfaction is found as a robust predictor of passenger loyalty(Chen, 2008; Huang, 2010; Jen & Hu, 2003).H8 : Passenger satisfaction has a significant effect on passenger loyaltyH9 : There is an indirect significant effect of service quality on passenger
loyalty through passenger satisfaction. Based on the Hypotheses proposed, figure 1 shows the research model for this study
The International Journal of Accounting and Business Society 101
Vol. 22, No. 2 December 2014Department of Accounting
Faculty of Economics & Business – University of Brawijaya
SampleThe respondents of this study are the passengers of Indonesia
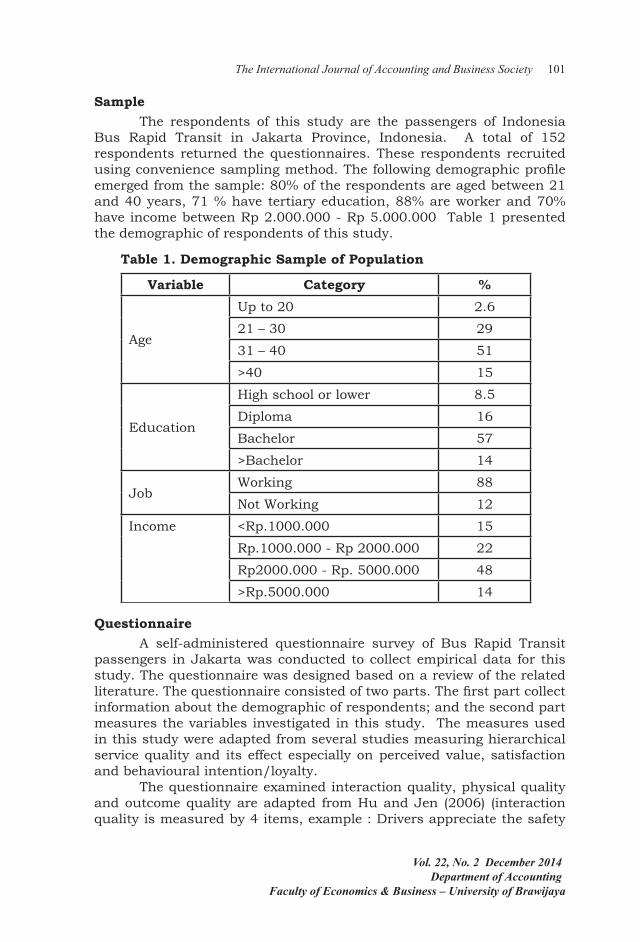
Bus Rapid Transit in Jakarta Province, Indonesia. A total of 152 respondents returned the questionnaires. These respondents recruited using convenience sampling method. The following demographic profile emerged from the sample: 80% of the respondents are aged between 21 and 40 years, 71 % have tertiary education, 88% are worker and 70% have income between Rp 2.000.000 - Rp 5.000.000 Table 1 presented the demographic of respondents of this study.
Table 1. Demographic Sample of Population
Variable Category %
Age
Up to 20 2.6
21 – 30 29
31 – 40 51
>40 15
Education
High school or lower 8.5
Diploma 16
Bachelor 57
>Bachelor 14
JobWorking 88
Not Working 12
Income <Rp.1000.000 15
Rp.1000.000 - Rp 2000.000 22
Rp2000.000 - Rp. 5000.000 48
>Rp.5000.000 14
QuestionnaireA self-administered questionnaire survey of Bus Rapid Transit
passengers in Jakarta was conducted to collect empirical data for this study. The questionnaire was designed based on a review of the related literature. The questionnaire consisted of two parts. The first part collect information about the demographic of respondents; and the second part measures the variables investigated in this study. The measures used in this study were adapted from several studies measuring hierarchical service quality and its effect especially on perceived value, satisfaction and behavioural intention/loyalty.
The questionnaire examined interaction quality, physical quality and outcome quality are adapted from Hu and Jen (2006) (interaction quality is measured by 4 items, example : Drivers appreciate the safety

Vol. 22, No. 2 December 2014Department of AccountingFaculty of Economics & Business – University of Brawijaya
102 How Quality, Value And Satisfaction Create Passenger Loyalty: An ....
of passengers when they get on/off the bus, physical quality is measured by 6 items, example item: “Air-conditioning is very comfortable” and outcome quality is measured by 4 items, example item:” Information about bus routes is marked clearly”), value, satisfaction and loyalty are adapted from Suhartanto (2011) (value is measured by 4 items, example item:”Compared to what I have given up (in terms of money, effort, and time), the overall services of TransJakartasatisfied my needs”, customer satisfaction is measured by 4 items, example item:”I did the right thing when I chose to travel with TransJakarta” and customer loyalty is measured by 3 items, example item:”I intend to continue traveling with TransJakarta in the future”).
Apart from the questions about respondent’s demographics, which were measured by categorical scales, the items of all the other constructs are measured using a seven-point Likert scale ranging from ‘strongly disagree (1)’ to ‘strongly agree (7)’.
Data AnalysisTo analyse the data and test hypotheses, Partial Least Squares
were employed by this study. Some reasons behind the selection of PLS for this study. First of all, Aibinu and Al-Lawati (2010) suggestthatmeasuring individuals’ perceptions using Likert scales will likely yield non-normally distributed responses. PLS is a type of Structural Equation Modelling (SEM) technique which is based on variance. Therefore, this technique is distribution-free which does not require or exclude any distributional form for the measured variables (Wold, 1982). For that reason, this technique is suitable for analyzing data from non-normal distributions(Falk & Miller, 1992). Another reason for using PLS is based on Abdi’s suggestion (2007)stating that the aim of PLS is to predict the effects of a set of independent variables on a set of dependent variables. He explains that PLS is a multivariate technique to compare multiple response variables and multiple explanatory variables. Though it is similar to Principal Components Analysis (PCA), PLS is believed to be a better option than multiple linear regression and PCA regression techniques since it presents more vigorous model parameters that do not change with new calibration samples from the population (Falk & Miller, 1992; Geladi & Kowalski, 1986).Results
The examination of outer and inner model are done to ensure that the model proposed is strong. Outer model is evaluated by using some tests namely convergent validity, discriminant validity, and reliability. The inner model is evaluated by using the score of coefficient determinant and goodness of fit. The next section would explain the results of outer and inner model evaluation.

The International Journal of Accounting and Business Society 103
Vol. 22, No. 2 December 2014Department of Accounting
Faculty of Economics & Business – University of Brawijaya
The Evaluation of Outer ModelThe first outer model evaluation is convergent validity. This study
uses two indicators – score of factor loadings and Average Variance Extracted (AVE) to evaluate the convergent validity of the model. The score of factor loadings vary between 0.06 and 0.981. Following Hair et al’s suggestion (2010), a construct should not have items which have score loading below 0.6. Therefore, both CL_1 and PQ_6 which have factor loading 0.06 and 0.558 respectively are deleted from the model. The estimation after deleting CL_1 and PQ_6 shows that all of constructs have factor loadings above the threshold value (0.6). Furthermore, the score of AVE which is ranged from 0.558 to 0.957 also indicates that all constructs do not have convergent validity problems (threshold of AVE is 0.5) which means each indicator has a high level of connection with its corresponding variable. Table 2 summarizes the result of convergent validity.
Table 2. Summary of Convergent Validity Test
Items Factor Loading AVECL_1 0,976
0,957CL_2 0,980CS_1 0,876
0,781CS_2 0,935CS_3 0,790CS_4 0,925IQ_1 0,730
0,602IQ_2 0,784IQ_3 0,772IQ_4 0,816OQ_1 0,709
0.558OQ_2 0,841OQ_3 0,646OQ_4 0,778PQ_1 0,821
0,634PQ_2 0,842PQ_3 0,604PQ_4 0,783PQ_5 0,900PV_1 0,916
0,739PV_2 0,715PV_3 0,865PV_4 0,924

Vol. 22, No. 2 December 2014Department of AccountingFaculty of Economics & Business – University of Brawijaya
104 How Quality, Value And Satisfaction Create Passenger Loyalty: An ....
The further outer model evaluation is unidimensionality. The composite reliability score for each construct ranged from 0.833 to 0.986, all of which are beyond the cut-off value (0.70) (Nunnally, 1978). Based on theseunidimensionality tests, all constructs used in this study have an acceptable degree of consistency and are thus considered reliable. Table 3 shows the composite reliability score for each constructs.
Table 3. Composite Reliability Score
Construts Composite ReliabilityInteraction Quality 0,858Passenger Loyalty 0,978Outcome Quality 0,833Physical Quality 0,895Passenger Satisfaction 0,934Service Quality 0,904Perceived Value 0,918
Discriminant validity was evaluated using an approach proposed by Chin (2010). This approach suggests that none of the items should load more highly on another construct than it does on the construct it intends to measure. In other words, the value of the factor loading should be higher than the cross loadings. In this study, the value of the factor loading for each construct is higher than the cross loading. Therefore, it can be said that there is no discriminant validity. Table 4 shows the cross loadings for each constructs
Table 4. Cross Loading
IntQual Loyalty OutQual PhyQual Satisfaction Value
CL1 0,582086 0,976826 0,432128 0,532458 0,761190 0,832012CL2 0,667939 0,980464 0,529187 0,628468 0,835905 0,903766CS1 0,621891 0,753209 0,530477 0,774307 0,876814 0,770801CS2 0,652698 0,791089 0,514477 0,689041 0,935995 0,841132CS3 0,465550 0,499865 0,687339 0,631990 0,790358 0,635321CS4 0,555109 0,804504 0,653776 0,542895 0,925631 0,848044IQ1 0,730284 0,334058 0,389337 0,134606 0,314708 0,342289IQ2 0,784548 0,547189 0,367128 0,468728 0,583849 0,607836IQ3 0,772150 0,544331 0,416192 0,566191 0,611505 0,666955IQ4 0,816265 0,517423 0,504066 0,526223 0,468241 0,516527OQ1 0,341232 0,195856 0,709627 0,203685 0,380676 0,198334OQ2 0,386008 0,436623 0,841068 0,450151 0,648906 0,462155OQ3 0,468760 0,418442 0,646009 0,343484 0,391071 0,402160

The International Journal of Accounting and Business Society 105
Vol. 22, No. 2 December 2014Department of Accounting
Faculty of Economics & Business – University of Brawijaya
IntQual Loyalty OutQual PhyQual Satisfaction Value
OQ4 0,424939 0,389573 0,778137 0,463327 0,527748 0,452597PQ1 0,448298 0,357738 0,452025 0,821093 0,609660 0,468812PQ2 0,475323 0,522787 0,360698 0,842788 0,666738 0,652706PQ3 0,382835 0,294334 0,243986 0,604269 0,258580 0,284907PQ4 0,554509 0,600071 0,495826 0,783565 0,649285 0,663452PQ5 0,436874 0,546507 0,412252 0,900686 0,689461 0,596348PV1 0,596268 0,822234 0,437797 0,546393 0,823726 0,916664PV2 0,658933 0,577264 0,488961 0,518455 0,562162 0,715422PV3 0,568056 0,801122 0,462603 0,636372 0,827138 0,865946PV4 0,624409 0,826307 0,419935 0,653788 0,788793 0,924220
The Evaluation of Inner ModelAfter ensuring the robustness of the measures, the next step is to
provide validation that supports the theoretical model as demonstrated by the structural model (Chin, 2010). Here, the structural model is evaluated through the score of coefficient of determination R2 and Goodness of Fit Index (GoF).Similar to OLS regression, the value of R2 in PLS represents the amount of variance explained by the model (Chin, 2010). Falk and Miller (1992)suggest that the variance explained for endogenous variables should exceed 0.10. For this study, the value of R2 ranged from 0.547 to 0.943.
The further technique to ensure the robustness of the inner model is a Goodness of Fit (GoF) index. Since PLS is a variancebased SEM, it does not have a formal GoF. Therefore, the calculation of GoF refers to Tenenhaus et al’s. 2004 suggestion. Derived from Tenenhaus et al. 2004, Daryanto et al. (2009)propose that the baselines for GoF are small = 0.1, medium = 0.25 and large = 0.36. The calculation of GoF yields a score of 0.665. Since GoF index for the model tested in this study exceeds 0.36, the model proposed in this study should be considered robust. See table 5 for the score of R2 and the calculation of GoF. The results of R2 and GoF index indicate that the model tested for this study is robust. Therefore, hypotheses testing can be proceeded.

Vol. 22, No. 2 December 2014Department of AccountingFaculty of Economics & Business – University of Brawijaya
106 How Quality, Value And Satisfaction Create Passenger Loyalty: An ....
Table 5. R2 and Calculation of GoF
Constructs R Square CommunalityInteractionQuality 0.689 0.602Loyalty 0.795 0.639Output Quality 0.616 0.558PhysicalQuality 0.813 0.563Satisfaction 0.834 0.781Service Quality 0.409Value 0.584 0.739Average 0.722 0.613
GoF =
Hypotheses TestingResearch objective one is about the dimensions of service quality.
The results of hypotheses testing show that interaction quality (λ = 0,830; t = 25,664; R2=0,688), outcome quality (λ = 0,785; t = 19,126; R2=0,616) and physical quality (λ = 0,902; t = 58,090; R2=0,813) have a significant effect on service quality. This significant findings mean these three dimensions are considered as the dimensions of service quality which mean hypotheses 1a, 1b and 1c are supported. Among these dimensions, the statistical estimations indicate that physical quality is the strongest dimension of service quality.
The further hypotheses testing are about answering research objective two – the relationships amon service quality, perceived value, passenger satisfaction and loyalty. The hypothesis 2 states that service quality has a significant effect on perceived value (λ = 0,764; t = 16,916). Hence hypothesis 2 is supported. Similar to its effect on value, the result of hypothesis testing shows that there is a positive significant effect of service quality on passenger satisfaction (λ = 0,372; t = 8,288), it means hypothesis 3 is supported. Hypothesis 4 proposes that there is a significant effect of passenger perceived value of satisfaction. The statistical estimation shows that t-statistic is 12,484 (λ = 0,645). This finding indicates that the higher the value perceived by the passengers, the more satisfied the passenger with the service offered by BRT’s provider. Apart its direct effect on satisfaction, this study also tests the moderating effect of passenger perceived value on the relationship between service quality and passenger satisfaction. The finding shows that there is no significant moderating effect of perceived value on its linkage (t = 1,572). Therefore, Hypothesis 5 is not supported. As an important construct in marketing study, this study also examines the relationship between passenger perceived value on loyalty. The result shows that there is a significant effect of perceived value on loyalty. It means Hypothesis 6 is supported, To provide a comprehensive insight about the role of
The International Journal of Accounting and Business Society 107
Vol. 22, No. 2 December 2014Department of Accounting
Faculty of Economics & Business – University of Brawijaya
passenger perceived value, this study tests the mediating role of this construct. This study states that passenger perceived value mediates the effect of service quality on passenger loyalty. To test this mediating effect, z-score sobell’s test was used by this study. The value of z-score (z-score = 11,124) shows that there is a signifcant indirect effect of service quality on passenger loyalty via perceived value. Thus, Hypothesis 7 is supported. Hypothesis 8 proposes that there is a significant effect of passenger satisfaction on loyalty. Based on hypothesis testing, there is a significant effect of passenger satisfaction on loyalty (λ = 0,155; t = 2,870), hence hypothesis is supported. Since, the the value of path coefficient indicates a positive slope, the more satisfied the passenger the more loyalt them to use BRT. The mediating role of passenger satisfaction on the relationship between service quality and loyalty was also tested by this study. The result mediating test analysis shows that there is a significant indirect effect of service quality on loyalty through passenger satisfaction (z-score = 2,718). Therefore hypothesis 9 is supported.
Conclusion As proposed by Hypothesis 1a,b and c, this study found that
interaction quality, physical quality and outcome quality have a significant effect on overall service quality perception. Therefore hypotheses proposed are accepted. Among these three dimensions, physical quality is found to be the most important dimensions in assesing the service quality. The most dominant effect of physical quality in determining the overall service quality is possibly because BRT’s passenger give more concern toward the physical aspects provided. In riding a public transport, passenger would evaluate the safety of the vehicle used. The vehicle must be able to provide safety and comfortable feel trip for the passengers.
As proposed by this study, it is found that service quality has a significant effect on passenger perceived value (Hypothesis 2 is supported). This finding supports previous studies which also found a significant effect of service quality on perceived value (Hu et al., 2009; Ryu et al., 2012). This finding means the value perceived by passenger about riding BRT is significantly influenced by their perception about the quality of service provided. The higher the quality of service perceived, the higher the value felt. Furthermore, as an essential construct, service quality also plays an important role in shaping customer satisfaction (Hypothesis 3 is supported). The significant effect of service quality on passenger satisfaction validates the finding of the previous studies (Jen et al., 2011; Lai et al., 2009). On the service gap model proposed by Parasuraman et al. (1985), people would be satisfied when their perception toward the service they received is higher than they expected. For that reason, by providing a high quality of service, a company might provide a service exceeding customer’s expectation.
Hypothesis 4 proposed that passenger perceived value has a positive significant effect on passenger satisfaction. The finding of this

Vol. 22, No. 2 December 2014Department of AccountingFaculty of Economics & Business – University of Brawijaya
108 How Quality, Value And Satisfaction Create Passenger Loyalty: An ....
study indicates that passenger perceived value plays an important role in creating satisfaction. Reflecting to the result of this study, passenger would be more satisfied about the BRT if they perceived higher value offered. The possible reason to explain this significant effect is about the higher value perceived by passenger means passenger would feel that what they get is higher than they paid. This situation lead into satisfaction.
Apart its direct effect on satisfaction, passenger perceived value was expected to moderate the effect of service quality on satisfaction as proposed by hypothesis 5. However, the statistical analysis shows that there is no significant moderation effect provided by perceived value on the relationship between service quality and satisfaction. This finding contradicts with the results of several studies (Caruana et al., 2000; Gallarza & Gil Saura, 2006; Oh, 1999).The insignificant moderating effect of perceived value on the relationship between service quality and satisfaction is probably because the price of BRT’s ticket is considered not expensive. Hence, in evaluating service quality, passengers would not be affected by the value perceived.
Similar to its effect on satisfaction, this study also found a significant effect of perceived value on loyalty. This finding supports previous studies which also found the significant effect of perceived value on loyalty (Clemes & Gan, 2013; Suhartanto et al., 2013). It means passenger would be more loyal to ride BRT if they perceived the higher value. For that reason, it is obvious that the provider of BRT should be able to provide more benefits of riding BRT.
Expected to provide a comprehensive insight about the linkages among several marketing constructs in the field of public transport management, this study also evaluates the indirect effect of service quality on passenger loyalty via perceived value as proposed by hypothesis 7. The indirect effect test used sobell’s test found that perceived value significantly mediates the effect of service quality on loyalty. Having this indirect effect means service quality affects loyalty in both two ways – directly and indirectly through perceived value.
This study found the significant effect of passenger satisfaction on loyalty as proposed by hypothesis 8. This finding is similar to several previous studies which also show this significant effect (Clemes et al., 2014; Kandampully & Suhartanto, 2000; Mohi, 2012; Suhartanto et al., 2013). This outcome indicates that the passenger would be more loyalt to ride BRT if they are satisfied with the service provided. The more satisfied the passengers, the more loyal they are. Apart its direct effect on loyalty, passenger satisfaction plays an important role in mediating the effect of service quality on loyalty as proposed by hypothesis 9.
The primary limitation of this study is that it does not measure the actual behavioural loyalty. This study only investigates behavioural intention to loyalty. For that reason, the next study is recommended to

The International Journal of Accounting and Business Society 109
Vol. 22, No. 2 December 2014Department of Accounting
Faculty of Economics & Business – University of Brawijaya
measure actual behaviour to capture the real phenomenon. This study identifies several important factors that impact on passenger’s perception of service quality. However, apart from the factors acknowledged in this study, there are other factors that should be included in the model such as brand image, attitude, and self-efficacy for instance. Hence, further research should include those variables in the research model.

Vol. 22, No. 2 December 2014Department of AccountingFaculty of Economics & Business – University of Brawijaya
110 How Quality, Value And Satisfaction Create Passenger Loyalty: An ....
ReferencesAbdi, H. 2007. Partial least squares regression. In N. Salkind (Ed.),
Encyclopedia of Measurement and Statistics. Thousand Oaks: Sage.
Aibinu, A. A., & Al-Lawati, A. M. 2010. Using PLS-SEM technique to model construction organizations’ willingness to participate in e-bidding. Automation in Construction, 19 (6), 714-724.
Amin, M., & Isa, Z. 2008. An examination of the relationship between service quality perception and customer satisfaction: a SEM approach towards Malaysian Islamic banking. International Journal of Islamic and Middle Eastern Finance and Management, 1(3), 191-209.
Andreassen, T. W., & Lindestad, B. 1998. Customer loyalty and complex services: the impact of corporate image on quality, customer satisfaction and loyalty for customers with varying degrees of service expertise. International Journal of Service Industry Management, 9(1), 7-23.
Babakus, E., & Boller, G. W. 1992. An empirical assessment of the SERVQUAL scale. Journal of Business research, 24(3), 253-268.
Barroso, C., Carrión, G. C., & Roldán, J. L. 2010. Applying maximum likelihood and PLS on different sample sizes: studies on SERVQUAL model and employee behavior model. In Handbook of partial least squares (pp. 427-447): Springer.
Baumann, C., Burton, S., Elliott, G., & Kehr, H. M. 2007. Prediction of attitude and behavioural intentions in retail banking. International Journal of Bank Marketing, 25(2), 102-116.
Bhattacharya, S., & Singh, D. 2008. The emergence of hierarchy in customer perceived value for services: A grounded analysis. Journal of American Academy of Business, Cambridge, 13 (1), 65-71.
Brady, M. K., & Cronin Jr, J. J. 2001. Some new thoughts on conceptualizing perceived service quality: a hierarchical approach. The Journal of Marketing, 34-49.
Buttle, F. 1996. SERVQUAL: review, critique, research agenda. European Journal of Marketing, 30(1), 8-32.
Carman, J. M. 1990. Consumer perceptions of service quality: An assessment of the SERVQUAL dimensions. Journal of retailing, 33-55.
Caruana, A., Money, A. H., & Berthon, P. R. 2000. Service quality and satisfaction–the moderating role of value. European Journal of marketing, 34(11/12), 1338-1353.
Chen, C.-F. 2008. Investigating structural relationships between service quality, perceived value, satisfaction, and behavioral intentions for

The International Journal of Accounting and Business Society 111
Vol. 22, No. 2 December 2014Department of Accounting
Faculty of Economics & Business – University of Brawijaya
air passengers: Evidence from Taiwan. Transportation Research Part A: Policy and Practice, 42(4), 709-717.
Chin, W. W. 2010. How to write up and report PLS analyses. In V. Esposito-Vinzi, W. W. chin, J. Henseler & H. Wang (Eds.), Handbook of partial least squares (pp. 655-690): Springer.
Choi, K.-S., Cho, W.-H., Lee, S., Lee, H., & Kim, C. 2004. The relationships among quality, value, satisfaction and behavioral intention in health care provider choice: a South Korean study. Journal of Business research, 57(8), 913-921.
Chou, C.-C., Liu, L.-J., Huang, S.-F., Yih, J.-M., & Han, T.-C. 2011. An evaluation of airline service quality using the fuzzy weighted SERVQUAL method. Applied Soft Computing, 11(2), 2117-2128.
Chou, J.-S., & Kim, C. 2009. A structural equation analysis of the QSL relationship with passenger riding experience on high speed rail: An empirical study of Taiwan and Korea. Expert Systems with Applications, 36(3), 6945-6955.
Clemes, M. D., Brush, G. J., & Collins, M. J. 2011. Analysing the professional sport experience: A hierarchical approach. Sport Management Review, 14(4), 370-388.
Clemes, M. D., Cohen, D. A., & Wang, Y. (2013). Understanding Chinese university students’ experiences: an empirical analysis. Asia Pacific Journal of Marketing and Logistics, 25(3), 391-427.
Clemes, M. D., & Gan, C. (2013). Mobile Communications: A Comprehensive Hierarchical Modelling Approach. Asia Pacific Journal of Marketing and Logistics, 26(1), 8-8.
Clemes, M. D., Shu, X., & Gan, C. (2014). Mobile communications: a comprehensive hierarchical modelling approach. Asia Pacific Journal of Marketing and Logistics, 26(1), 114-146.
Cronin, J. J. J., & Taylor, S. A. 1994. SERVPERF versus SERVQUAL: reconcolling performance-based and perception-minus-expectations measurement of service quality. Journal of Marketing, 58(1), 125.
Cronin Jr, J. J., Brady, M. K., & Hult, G. T. M. 2000. Assessing the effects of quality, value, and customer satisfaction on consumer behavioral intentions in service environments. Journal of retailing, 76(2), 193-218.
Dabholkar, P. A., Thorpe, D. I., & Rentz, J. O. 1995. A measure of service quality for retail stores: scale development and validation. Journal of the Academy of Marketing Science, 24(1), 3-16.
Daryanto, A., de Ruyter, K., & Wetzels, M. 2009. Getting a discount or sharing the cost: the influence of regulatory fit on consumer response to service pricing schemes. Journal of Service Research,

Vol. 22, No. 2 December 2014Department of AccountingFaculty of Economics & Business – University of Brawijaya
112 How Quality, Value And Satisfaction Create Passenger Loyalty: An ....
Dikun, S. 2003. Transportation In The New Globak Era: Linkin Asia Through Better Transportation. Journal of the Eastern Asia Society for Transportation Studies, 5
Eboli, L., & Mazulla, G. 2007. Service quality attributes affecting customer satisfaction for bus transit. Journal of Public Transportation, 10(3), 21-34.
Eboli, L., & Mazzulla, G. 2008. A stated preference experiment for measuring service quality in public transport. Transportation Planning and Technology, 31(5), 509-523.
Eggert, A., & Ulaga, W. 2002. Customer perceived value: a substitute for satisfaction in business markets? Journal of Business & industrial marketing, 17(2/3), 107-118.
Falk, R. F., & Miller, N. B. 1992. A primer for soft modeling: University of Akron Press.
Fornell, C., Johnson, M. D., Anderson, E. W., Cha, J., & Bryant, B. E. 1996. The American customer satisfaction index: nature, purpose, and findings. The Journal of Marketing, 7-18.
Gallarza, M. G., & Gil Saura, I. 2006. Value dimensions, perceived value, satisfaction and loyalty: an investigation of university students’ travel behaviour. Tourism management, 27(3), 437-452.
Geladi, P., & Kowalski, B. R. 1986. Partial least-squares regression: a tutorial. Analytica chimica acta, 185, 1-17.
Hair, J. F., Black, W. C., Babin, B. J., Anderso, R. E., & Tatham, R. L. 2010. Multivariate data analysis (7th ed.). New Jersey: Prenticen Hall.
Hu, H., Kandampully, J., & Devi, T. 2009. Relationships and impacts of service quality, perceived value, customer satisfaction and image: an empirical study. The Service Industries Journal, 29(2), 111-125.
Hu, K. C., & Jen, W. 2006. Passengers’ perceived service quality of city buses in Taipei: scale development and measurement. Transport Reviews, 26(5), 645-662.
Huang, Y.-K. 2010. The Effect of Airline Service Quality on Passengers’ Behavioural Intentions Using SERVQUAL Scores: A Taiwan Case Study. Journal of the Eastern Asia Society for Transportation Studies, 8, 2330-2343.
Ibeas, A., & Cecin, P. 2011. The quality of service desired by public transport users. Transport Policy, 18(1), 217-227.
Jamal, A., & Anastasiadou, K. 2009. Investigating the effects of service quality dimensions and expertise on loyalty. European Journal of Marketing, 43(3/4), 398-420.
Jen, W., & Hu, K.-C. 2003. Application of perceived value model to identify factors affecting passengers’ repurchase intentions on city bus: a case of the Taipei metropolitan area. Transportation, 30(3), 307-327.
The International Journal of Accounting and Business Society 113
Vol. 22, No. 2 December 2014Department of Accounting
Faculty of Economics & Business – University of Brawijaya
Jen, W., Tu, R., & Lu, T. 2011. Managing passenger behavioral intention: an integrated framework for service quality, satisfaction, perceived value, and switching barriers. Transportation, 38(2), 321-342.
Kandampully, J., & Suhartanto, D. 2000. Customer loyalty in the hotel industry: the role of customer satisfaction and image. International journal of contemporary hospitality management, 12(6), 346-351.
Lai, F., Griffin, M., & Babin, B. J. 2009. How quality, value, image and satisfaction create loyalty at a Chinese telecom. Journal of Business Research, 62 (10), 980-986
Lai, W.-T., & Chen, C.-F. 2011. Behavioral intentions of public transit passengers—The roles of service quality, perceived value, satisfaction and involvement. Transport Policy, 18(2), 318-325.
Liao, K.-H., & Hsieh, M.-F. 2011. Statistic exploring the casual relationships between service quality, brand image, customer satisfaction and customer loyalty on the leisure resort industry. Paper presented at the Proceedings of The 2nd International Research Symposium in Service Management (IRSSM-2).
Mohi, Z. (2012). An analysis of restaurant patrons’ experiences in Malaysia: a comprehensive hierarchical modelling approach. Lincoln University.
Nunnally, J. 1978. Pyschometric Theory. New York: McGraw-Hill.Oh, H. 1999. Service quality, customer satisfaction, and customer
value: A holistic perspective. International Journal of Hospitality Management, 18(1), 67-82.
Parasuraman, A., Zeithaml, V., & Berry, L. L. 1988. SERVQUAL: A Multiple-Item Scale for Measuring Consumer percepcions of Service Quality. Journal of Retailing, 64, 41-50.
Parasuraman, A., Zeithaml, V. A., & Berry, L. L. 1985. A conceptual model of service quality and its implications for future research. The Journal of Marketing, 41-50.
Park, J.-W., Robertson, R., & Wu, C.-L. 2004. The effect of airline service quality on passengers’ behavioural intentions: a Korean case study. Journal of Air Transport Management, 10(6), 435-439.
Pérez, M. S., Abad, J. C. G., Carrillo, G. M. M., & Fernández, R. S. 2007. Effects of service quality dimensions on behavioural purchase intentions: A study in public-sector transport. Managing service quality, 17(2), 134-151.
Rohmat. (2012). Pariwisata Sumbang Rp 80 Triliun ke APBN. Retrieved 21/06/2014, 2014, from http://economy.okezone.com/read/2012/01/16/320/558115/pariwisata-sumbang-rp80-triliun-ke-apbn
Rust, R. T., & Oliver, R. L. 1994. Service quality: New directions in theory and practice: Sage Publications California.

Vol. 22, No. 2 December 2014Department of AccountingFaculty of Economics & Business – University of Brawijaya
114 How Quality, Value And Satisfaction Create Passenger Loyalty: An ....
Ryu, K., Lee, H., & Kim, W. G. 2012. The influence of the quality of the physical environment, food, and service on restaurant image, customer perceived value, customer satisfaction and behavioural intentions. International Journal of Contemporary Hospital Management, 24 (200-223)
Saha, G. C. 2009. Service quality, satisfaction, and behavioural intentions: a study of low-cost airline carriers in Thailand. Managing Service Quality, 19(3), 350-372.
Satisfaction, A. C. 2007. Service quality attributes affecting customer satisfaction for bus transit. Center for Urban Transportation Research, 10(3)
Shu, X. 2010. A Hierarchical model of the Chinese mobile communications market: an empirical analysis.
Suhartanto, D. (2011). An examination of brand loyalty in the Indonesian hotel industry. Lincoln University Canterbury.
Suhartanto, D., Clemes, M., & Dean, D. (2013). Analyzing the Complex and Dynamic Nature of Brand Loyalty in the Hotel Industry. Tourism Review International, 17(1), 47-61.
Sumaedi, S., Bakti, I., & Yarmen, M. (2012). The Empirical Study of Public Transport Passengers’ Behavioral Intentions: The Roles of Service Quality, Perceived Sacrifice, Perceived Value, and Satisfaction (Case Study: Paratransit Passengers in Jakarta, Indonesia). International Journal for Traffic and Transport Engineering, 2(1), 83-97.
Tenenhaus, M., Amato, S., & Esposito Vinzi, V. 2004. A global goodness-of-fit index for PLS structural equation modelling. Paper presented at the Proceedings of the XLII SIS scientific meeting.
Tyrinopoulos, Y., & Antoniou, C. 2008. Public transit user satisfaction: Variability and policy implications. Transport Policy, 15(4), 260-272.
Wang, Y., Lo, H. P., Chi, R., & Yang, Y. 2004. An integrated framework for customer value and customer-relationship-management performance: a customer-based perspective from China. Managing service quality, 14(2/3), 169-182.
Wold, H. 1982. Soft modelling: the basic design and some extensions. Systems Under Indirect Observation, PartII, 36-37.
Wu, H.-C. 2009. An empirical study of behavioural intentions in the Taiwan hotel industry. Lincoln University Canterbury.
Yang, Z., Yan-ping, L., & Jie, T. 2006. Study on Quality Indicators in Higher Education: An Application of the SERVQUAL Instrument. Paper presented at the Service Systems and Service Management, 2006 International Conference on.
Yee, R. W., Yeung, A. C., & Edwin Cheng, T. 2010. An empirical study

The International Journal of Accounting and Business Society 115
Vol. 22, No. 2 December 2014Department of Accounting
Faculty of Economics & Business – University of Brawijaya
of employee loyalty, service quality and firm performance in the service industry. International Journal of Production Economics, 124(1), 109-120.
Yunus, N. A. M., Rahman, B. A., & Othman, A. K. (2012). The relationship between service quality and customer loyalty at a telecommunication company in Malaysia. Paper presented at the Innovation Management and Technology Research (ICIMTR), 2012 International Conference on.
Zeithaml, V. 1988. Consumer perceptions of price, quality and value: A means-end model and synthesis of evidence. Journal of Marketing, 52(3)