customer satisfaction measures - multivariate solutions · customer satisfaction performance...
TRANSCRIPT

Customer Satisfaction Measures
Multivariate Solutions

Customer Satisfaction
Performance Ratings
• Performance ratings create a variety of analysis possibilities:
– Derived Importance (created using a dependent variable)
– Correlations
– Regression Analysis
• For a survey that includes stated or derived importance:
– MATRIX Analysis
– Quadrant Analysis
– Stated vs. Derived Importance Analysis
• For Survey that includes competitor performance:
– Head-to-head competitor analysis
– Gap analysis

3
Example Survey Structure
• Company Customer Satisfaction (Performance)– Joe's Grub hamburgers are fresh, never frozen
– Joe’s Grub steaks are prepared exactly as ordered
– Staff is very attentive, in tune with your needs
– Servers regularly suggest new items throughout the meal (appetizers, entrees, desserts.
– Service is personalized, I feel like they know me
– Joe's Grub is the place for me
– Sandwiches and salads served by Joe's Grub are made to order
A survey might have this array of performance ratings, or ‘applies to’ check-offs.
4
Surveys Including Customer
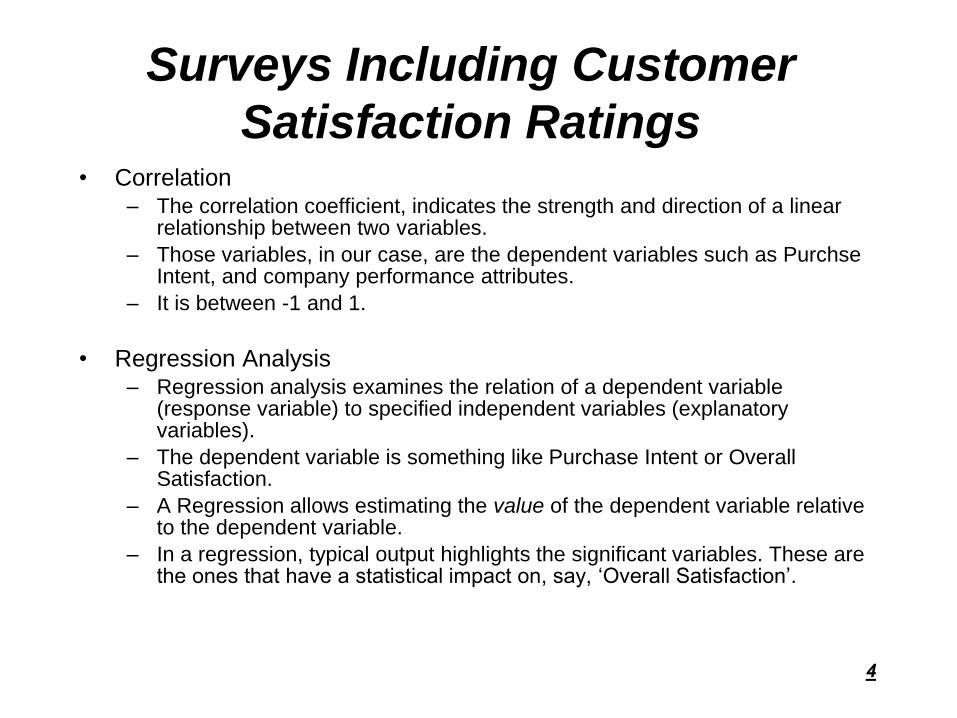
Satisfaction Ratings• Correlation
– The correlation coefficient, indicates the strength and direction of a linear relationship between two variables.
– Those variables, in our case, are the dependent variables such as Purchse Intent, and company performance attributes.
– It is between -1 and 1.
• Regression Analysis– Regression analysis examines the relation of a dependent variable
(response variable) to specified independent variables (explanatory variables).
– The dependent variable is something like Purchase Intent or Overall Satisfaction.
– A Regression allows estimating the value of the dependent variable relative to the dependent variable.
– In a regression, typical output highlights the significant variables. These are the ones that have a statistical impact on, say, ‘Overall Satisfaction’.

5
Surveys Including Customer
Satisfaction Ratings• Types of Dependent Variables
– Purchase Intent
– Likelihood to Recommend (or prescribe a medication)
– Likelihood to Return
– Number of Purchase Occasions
• More sophisticated approaches that shout be suggested by Multivariate
Solutions
• MATRIX Analysis (Derived Importance vs. Performance)
– Derived Importance is the association of performance attributes to a dependent variable derived by either
correlation or regression analysis
• Graphically displayed Regression Analysis
• Effective Uses
– To determine which brand attributes, communications messages, drug effects are
driving the dependent variables.

6
Surveys Including Surveys Including
Customer Satisfaction Ratings Ratings
Correlations
Barbecue Curls Mustard Pretzels
Purchase Intent Purchase Intent
Good for me, wholesome 0.60 0.66
It is a brand I trust 0.52 0.62
It is a treat for me/my family 0.48 0.66
It is for people like me 0.45 0.73
It is a brand for kids 0.41 0.58
Brand with vitamins 0.37 0.56
It is a modern, up-to-date, contemporary brand 0.35 0.63
It is a high quality brand 0.31 0.60
It is original, different 0.21 0.67
Are high quality products 0.20 0.71
Are for someone like you 0.20 0.71
Fun to eat 0.19 0.68
The above correlation is testing snack attributes against Purchase Intent. The new product,
‘Barbecue Curls’, have low correlations for quality, differentiation, and fun.
The established product, ‘Mustard Pretzels’, has stronger associations with purchase intent.
Snack Food Test

7
Surveys Including Customer
Satisfaction Ratings
The above regression tests personality performance drivers for Joe’s Grub. Positive
attributes are shaded in gray. They are ‘drivers’—or brand equity—for Joe’s Grub.
Negatively significant variables are important as well. They are shaded in peach. They are
negative Brand Equity. When interpreting a negatively significant variables, place a [NOT] in
front of it. For example, Joe’s Grub is NOT a place to go and be seen.
Regression Analyisis
Joe's GrubStandardized
Coefficients
Overall, how satisfied are you with your past dining
experience at Joe's Grub?Beta Significance
A blue jeans kind of place 0.34 0.01
A place for lunch with co-workers 0.23 0.07
Warm, inviting feels like home 0.15 0.25
Comfortable and casual like an old friend 0.12 0.33
No frills, no charm, just the essentials 0.05 0.68
For people like me 0.04 0.75
Romantic, intimate, has some charm -0.01 0.94
Rowdy, noisy, feels like a party -0.07 0.53
A dressy kind of place -0.17 0.13
[NOT] Go there to see and be seen -0.23 0.06
Dependent Variable: Overall, how satisfied are you with your
past dining experience at Joe's Grub?

8
High ChocolateOverall Acceptability
Multigrain flavor
Appearance
Overall flavor
Nuts/Peanuts
Texture
Graphic Display Regression AnalysisDD’s Healthy Bars - High Chocolate
Sweetness
Chocolate flavor
Caramel flavor
Regression can also be shown in graphic form.
The blue dotted lines indicate statistical significance.

9
MATRIX AnalysisIm
pact
on
Sat
isfa
ctio
n/P
urc
has
e In
ten
t
Stronger
Weaker
Strengths
Secondary Opportunities
Target Issues
Average Performance ScoresStronger
Performance
WeakerPerformance
These are "target issues" to improve brand equity. The Brand is performing below average and these attributes are important.
These are the "primary strengths" of the Brand.
These attributes are not crucial. Immediate focus should be on brand attributes
Consumer concerns are being met, though these attributes are not important for brand equity. Potential for resource misallocation.
Potential advantages

MATRIX Analysis
The MATRIX above compares Derived Importance (using correlation) with top box customer
satisfaction ratings for Joe’s Grub.
TARGET: The restaurant needs to target personalized service.
SECONDARY: Joe’s Grub is not known for its steak.
Macon, Ga
Likelihood to Recommend Joe's Grub Correlation Perf Impact Class Perf Class Loyalty Class IMP Rank
e 5 Service is personalized, I feel like they know me 0.188 43% High Worse Target 1
a 1 Joe's Grub hamburgers are fresh, never frozen 0.170 79% High Better Strength 2
f 6 Joe's Grub is the place for me 0.167 79% High Better Strength 3
c 3 Staff is very attentive, in tune with your needs 0.155 66% High Better Strength 4
g 7Sandwiches and salads served by Joe's Grub are
made to order0.131 25% High Worse Target 5
b 2 Joe's Grub steaks are prepared exactly as ordered 0.051 35% Low Worse Secondary 6
d 4Servers regularly suggest new items throughout the
meal (appetizers, entrees, desserts.0.031 28% Low Worse Secondary 7
Mean 0.128 0.508

11
Customer Satisfaction Ratings
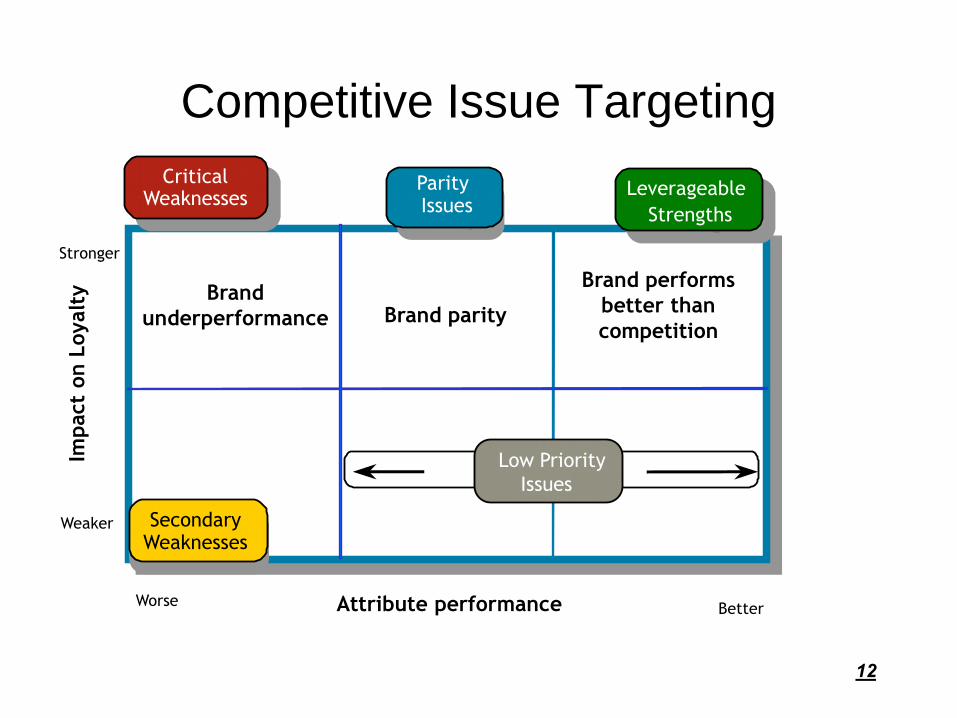
• Survey Includes Competitor Performance
• Competitive Issue Targeting
• Gap analysis
• Correspondence maps
12
CriticalWeakness
CriticalWeaknesses
SecondaryWeakness
SecondaryWeaknesses
LeverageableStrength
Leverageable
StrengthsParity
ParityIssues
Impact
on L
oyalt
y
Stronger
Weaker
Brand parityBrand
underperformance
Attribute performance BetterWorse
Low Priority
Issues
Brand performs
better than
competition
Competitive Issue Targeting

13
Competitive Issue Targeting
Competitive Analysis
CLIENT vs. Competitor
California Correlation CLIENT Competitor % Def Diff STAT Diff?Impact
ClassCIP Class IMP Rank
d 4 Have excellent customer service 0.228 59% 56% 3% 0.77 High Parity 1
l 12 Have accessible Sales people 0.215 51% 67% -16% 0.08 High Weakness 2
g 7 Have a great reputation 0.169 62% 69% -7% 0.42 High Parity 3
b 2 Be easy to work with 0.165 68% 56% 12% 0.17 High Parity 4
e 5 Be advanced technologically 0.157 58% 63% -6% 0.54 High Parity 5
h 8 Have product available when I need it 0.147 67% 61% 6% 0.46 High Parity 6
c 3 Do what is promised 0.127 66% 62% 5% 0.57 LowLow Priority-
Left8
a 1 Provides great value for the money 0.124 49% 37% 12% 0.18 LowLow Priority-
Left9
i 9 Have a simple order process 0.096 76% 68% 7% 0.36 LowLow Priority-
Left10
j 10Have past experience with our
company0.072 78% 74% 4% 0.60 Low
Low Priority-
Left11
k 11 Be trusted 0.035 70% 69% 0% 0.96 LowLow Priority-
Left12
f 6 Be better for the environment 0.001 43% 39% 5% 0.64 LowLow Priority-
Left13
Mean 0.128 62%
The Competitor Analysis adds an extra dimension to the MATRIX (direct comparison with a competitor).
A point made in the above example shows that ‘Have accessible Sales people’ is, for CLIENT, highly
correlated with Purchase Intent, but that COMPETITOR beats him at it.

14
-0.5
-0.5
-0.2
-0.1
0.0
0.0
0.0
0.1
0.4
0.4
0.9
1.2
Gap AnalysisCLIENT vs. Competitor
You do not have to shake the vial or cartridge
No mixing is necessary before using
The medication is taken once per day
You can choose your own time to take your shot
There is little or no pain when injecting the medication
You do not experience side effects from the medication
The medication is easy to use
You do not need to refrigerate-once you open them
You do not have nighttime hypoglycemia / low blood sugar
You do not feel tired when you are on the medication
You do not have daytime hypoglycemia / low blood sugar
The medication is covered by insurance
Here, a simple gap shows that CLIENT has an advantage when it comes to mixing the medication, but
COMPETITOR is covered by insurance.

15
Importance and Customer Satisfaction
Ratings
• Survey Includes Both Importance and Performance Scores
• Stated vs. Derived Importance
– Derived Importance is the association of performance attributes to a dependent variable
derived by either correlation or regression analysis
• Traditional Quadrant Analysis

16
Stated versus Derived Importance Analysis
Value Added Benefits
Essential Support PointsLow Priority
Key Selling Points
(Primary opportunity areas)
(Secondary opportunity areas)
(Primary areas to maintain)
(Potential Differentiators)
(Potential Overinvestments)
Low
High
Low High
D
E
R
I
V
E
D
I
M
P
O
R
T
A
N
C
E
STATED IMPORTANCE

17
Stated vs. Derived Importance
This is Stated vs. Derived Importance in Excel. Key Selling Points are Highlighted.
Stated vs. Derived Importance
Total Sample
Derived
Importance
(Correlation)
Stated
Importance
Top 2 Box (6 7)
Percentage
Derived
Importance
Class
Importance
ClassIT Class IMP Rank
j 10 Consistency in product 0.391 80% High High Key Selling Point 1
b 2 The Product is just right 0.350 67% High Low Value Added Benefit 2
f 6 Receiving the specified strength of syrup 0.295 96% High High Key Selling Point 3
e 5 Reasonable time spent adjusting syrup 0.292 52% High Low Value Added Benefit 4
a 1 The correct mix design 0.283 92% High High Key Selling Point 5
c 3 The syrup arrives on site to specification 0.280 95% High High Key Selling Point 6
h 8 No overtime spent finishing syrup 0.229 67% Low Low Low Priority 7
n 14 A smooth pour 0.191 82% Low High Essential Support Point 8
l 12 No shrinkage cracks 0.185 79% Low High Essential Support Point 9
g 7 The workability of syrup 0.175 85% Low High Essential Support Point 10
d 4 Reasonable time spent testing 0.154 36% Low Low Low Priority 11
k 11 Temperature of syrup 0.151 60% Low Low Low Priority 12
Mean 0.248 74%
Min 0.15093503 36%
Max 0.39055717 96%
Note: Importance is Derived From Syrup Performance correlated with Syrup 'Arriving as Ordered'

0.0
1.0
2.0
3.0
4.0
5.0
3.0 3.5 4.0 4.5
Derived versus Stated ImportanceJOHNSTONE JOHNSTONE
Key Selling PointsValue Added Benefits
Essential Support PointsLow PriorityHas knowledgeable customer service
D
E
R
I
V
E
D
I
M
P
O
R
T
A
N
C
E
STATED IMPORTANCE
Has customer service that is
accessible while I am in the midst
of finalizing major purchase
Has friendly customer service
Has responsive customer service
Has customer service that will resolve any issues I have
Has customer assistance to help me during and after
my acquisition
Graphical display of Stated vs. Derived Importance.

19
Quadrant Analysis
Key Vulnerabilities
Potential AdvantagesPotential Vulnerabilities
Strategic Advantages
(Primary opportunity areas)
(Secondary opportunity areas)
(Primary areas to maintain)
Potential Differentiators
Potential Overinvestments
(To Different Market Segments)
(If Properly Marketed)Low
High
Low High
Performance
I
M
P
O
R
T
A
N
C
E

20
Client Company Quadrant Analysis
Key Vulnerabilities(Primary opportunity areas)
Potential Advantages(Potential Differentiators if properly marketed
otherwise over-investments)
Potential Vulnerabilities(Secondary opportunity areas)
Strategic Advantages
(Primary areas to maintain)
Quality Of Contract Sales Force Speed Of Putting A Sales Force Together
Meeting Agreed Upon Objectives For
Physician Call Activity
Flexibility In Meeting Your Needs
Breadth Of ServicesLow
High
Low HighPERFORMANCE
Strategic Marketing Expertise
Therapeutic Expertise
Meeting Agreed Upon Sales Or Market
Share Objectives
I
M
P
O
R
T
A
N
C
E

BUYER Segments
• BUYER Segments are a quick add-in when conducting consumer testing for products such as:
– Consumer Goods
– Food & Beverage
– Electronics & Computers
• Multivariate Solutions could suggest these four questions as an addition to any survey involving these categories.

22
BUYER Overview
Rational
Emotional
Low HighUncertainty Tolerance
Product
Analysts
Impulse
Buyers
High-Stakes
Gamblers
Comfort/
Consistency
Seekers
Typical
Information
Seekers
Decis
ion D
om
inance
23
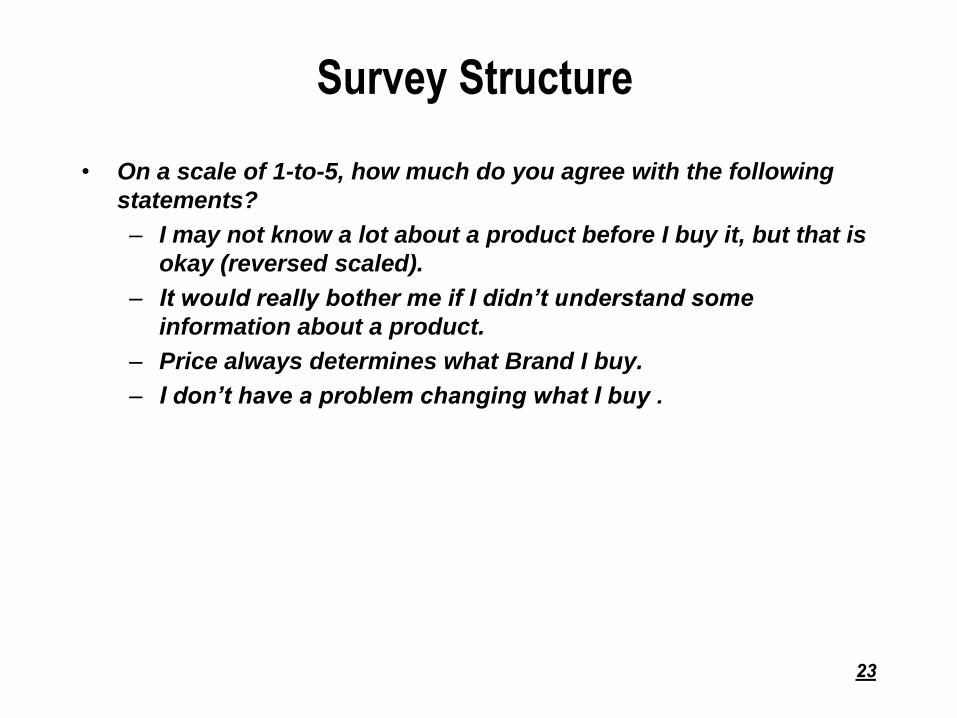
• On a scale of 1-to-5, how much do you agree with the following
statements?
– I may not know a lot about a product before I buy it, but that is
okay (reversed scaled).
– It would really bother me if I didn’t understand some
information about a product.
– Price always determines what Brand I buy.
– I don’t have a problem changing what I buy .
Survey Structure

24
BUYER Results
•The BUYER Matrix shows the proportion of the consumer base falling
into respective areas.
Typical
Information
Seekers
40%
Product
Analysts
Impulse
Buyers
High-Stakes
Gamblers
Comfort/
Consistency
Seekers
16%
7% 12%
25%
Typical
Information
Seekers
40%
Product
Analysts
Impulse
Buyers
High-Stakes
Gamblers
Comfort/
Consistency
Seekers
16%
7% 12%
25%
Rational
Emotional
Low HighUncertainty Tolerance
Decis
ion
Do
min
an
ce