brm project- customer satisfaction for passenger car
TRANSCRIPT

Consumer Satisfaction of Passenger Car
Submitted to: Submitted by:
Prof. Ashwini Sovani Richa, 08BS0002658
Richa Misra, 08BS0002463
Richa Suneja, 08BS0002675
Section B

A
Report on
“Consumer Satisfaction
Of
Passenger Car”
Maruti Wagon-R
Distribution List:
1. Prof. Ashwini Sovani, Faculty Member, IBS Pune

Acknowledgement
Success of a project is never a result of one man’s effort, it springs out of multiple
or combined efforts, assistance and guidance. Now when we have acquired
substantial knowledge about the subject and we would like to thank, Prof. Ashvini
Sovani for her cooperation, willingness to share her knowledge and making us
work on such a crucial and informative project. We would also like to thank IBS
Pune for providing me such an exposure to enhance my knowledge, skills and gain
experience. We appreciate their faith, support and expect the same in future course
of our project.
Acknowledgement ........................................................................................................................................ 3
Executive Summary ....................................................................................................................................... 6
OBJECTIVES ............................................................................................................................................... 6
METHODOLOGY ........................................................................................................................................ 6
DATA ANALYSIS: ........................................................................................................................................ 8
CONCLUSION ............................................................................................................................................. 8
SCOPE OF THIS PROJECT ........................................................................................................................... 9
Introduction ................................................................................................................................................ 10
BRIEF BACKGROUND ABOUT MARUTI WAGON-R .................................................................... 10
WHY MARUTI WAGON-R? ................................................................................................................ 11
COMPANY SPECIFIED FEATURES ............................................................................................................. 12
Safety Specifications ............................................................................................................................... 14
OBJECTIVES ................................................................................................................................................. 16
METHODOLOGY .......................................................................................................................................... 17
BASIS FOR THE METHODOLOGY ................................................................................................................. 19
CLASSIFICATION OF DATA ....................................................................................................................... 19
QUESTIONNAIRE METHOD.................................................................................................................. 19
SURVEY RESEARCH .................................................................................................................................. 20
SAMPLING METHOD ............................................................................................................................... 21
Questionnaire design .............................................................................................................................. 21
DATA ANALYSIS ........................................................................................................................................... 23
Age Factor ............................................................................................................................................... 23
Time of purchase .................................................................................................................................... 24
Travel/Day ............................................................................................................................................... 25
Monthly fuel Expenditure ....................................................................................................................... 25
Average (Mileage) ................................................................................................................................... 26
Satisfaction Level for Various Features ................................................................................................... 27
Technical Aspects .................................................................................................................................... 31
FIELD FINDINGS ........................................................................................................................................... 33
Area Visited ............................................................................................................................................. 33
TESTING OF HYPOTHESIS ............................................................................................................................ 34
FINDINGS AND INFERENCES ........................................................................................................................ 37
AGE GROUP ............................................................................................................................................. 37
DAILY TRAVEL .......................................................................................................................................... 37
FUEL CONSUMPTION .............................................................................................................................. 37
HIGH FUEL EFFICIENCY ............................................................................................................................ 38
RECOMMENDATIONS ................................................................................................................................. 39
Bibliography ................................................................................................................................................ 40

Executive Summary
This project aims at finding the consumer satisfaction level for passenger cars. The researchers
have taken the car brand Maruti Wagon R for the survey. And through this project the
researchers aim to find out the level of satisfaction of consumers about this car. And they also
intend to find out what are the parameters on which the satisfaction level of consumers depends
and which of those parameters matter more in judging the satisfaction level.
OBJECTIVES
• To understand customer response toward various passenger cars
• To gain better understanding of the factors which influence the consumer satisfaction
level and their impacts while buying/using a passenger car
• To determine the customer’s perspective and their responses towards passenger cars and
particularly Wagon-R
• Providing better understanding of consumer satisfaction of passenger cars.
• Identifying there expenditure patterns based on average consumption of fuel.
METHODOLOGY
1. Deciding on the factors which affect the satisfaction level of a consumer while using a car
The factors which we will consider for judging the satisfaction level:
• Time of purchase
• Monthly travel
• Purpose (Office or Luxury)
• Monthly fuel expenditure
• Frequency of maintenance
• After Sales service by company
• Average
• Extra accessories provided by the company

Various Criteria for judging satisfaction level:
• Delivery time
• Schemes offered by dealers (Installments, Easy Finance)
• Ease of availability of color at the time of purchase
• Leg space
• Engine noise
• Driving Comfort
• Cooling
• Jerks
• Vibrations
• Seat comfort
• Mileage
• Luggage space
• Height of the car
• Average
• Technical Aspects of Wagon-R
• Quality of accessories provided by the company
• Overall satisfaction level
2. Preparing a questionnaire with all the above factors in consideration
3. Field survey to gain some facts and figures for the purpose of data analysis
4. Getting around 100-120 samples filled on field.
5. The samples included people from almost every age group and every profession.
6. Applying the appropriate multivariate analysis technique for the purpose of data analysis.
7. Analyzing the findings from the analysis.
8. Reaching to a conclusion based on the findings.
9. Providing our recommendations.

DATA ANALYSIS:
• 45% of the respondents had bought their car 1 - 2 years back
• 41% of the owners of Wagon-R car lies in the age group of 20 – 30 years of age.
• Majority of the owners travel less than 50 kms per day
• Majority of the respondents had monthly fuel expenditure between Rs1000 to Rs2000.
• 51% of the sample population has mileage of the car between 14-17 kms per liter
• Overall satisfaction level of 80% of the respondents is average or high.
CONCLUSION
The researchers have come to the conclusion that the inference of the satisfaction level which
they have reached according to their hypothesis is almost in accordance with the satisfaction
level that the consumers have rated.
And level of satisfaction depends on many factors like average consumption of Fuel, Mileage,
etc.

SCOPE OF THIS PROJECT
• This project is basically to find out the consumer satisfaction of passenger cars. But the
researchers have basically concentrated on only one car brand in order to avoid the
complexities. Due to this study has limitation of limited sample
• Nearly 75% of the surveys (25% telephonic) are limited to Pune city only which is students
and office people hub which makes it more biased toward young people.
• This project tries to ascertain various factors which affect level of satisfaction in consumer’s
mind.
Introduction
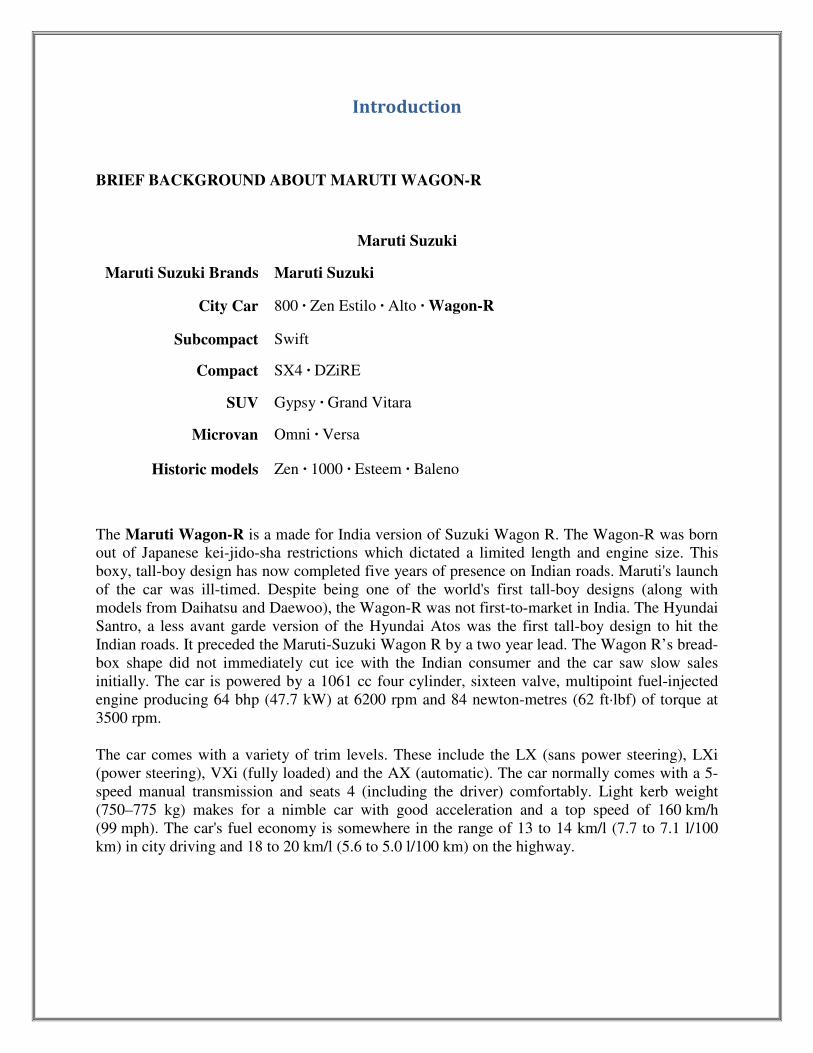
BRIEF BACKGROUND ABOUT MARUTI WAGON-R
Maruti Suzuki
Maruti Suzuki Brands Maruti Suzuki
City Car 800 · Zen Estilo · Alto · Wagon-R
Subcompact Swift
Compact SX4 · DZiRE
SUV Gypsy · Grand Vitara
Microvan Omni · Versa
Historic models Zen · 1000 · Esteem · Baleno
The Maruti Wagon-R is a made for India version of Suzuki Wagon R. The Wagon-R was born
out of Japanese kei-jido-sha restrictions which dictated a limited length and engine size. This
boxy, tall-boy design has now completed five years of presence on Indian roads. Maruti's launch
of the car was ill-timed. Despite being one of the world's first tall-boy designs (along with
models from Daihatsu and Daewoo), the Wagon-R was not first-to-market in India. The Hyundai
Santro, a less avant garde version of the Hyundai Atos was the first tall-boy design to hit the
Indian roads. It preceded the Maruti-Suzuki Wagon R by a two year lead. The Wagon R’s bread-
box shape did not immediately cut ice with the Indian consumer and the car saw slow sales
initially. The car is powered by a 1061 cc four cylinder, sixteen valve, multipoint fuel-injected
engine producing 64 bhp (47.7 kW) at 6200 rpm and 84 newton-metres (62 ft·lbf) of torque at
3500 rpm.
The car comes with a variety of trim levels. These include the LX (sans power steering), LXi
(power steering), VXi (fully loaded) and the AX (automatic). The car normally comes with a 5-
speed manual transmission and seats 4 (including the driver) comfortably. Light kerb weight
(750–775 kg) makes for a nimble car with good acceleration and a top speed of 160 km/h
(99 mph). The car's fuel economy is somewhere in the range of 13 to 14 km/l (7.7 to 7.1 l/100
km) in city driving and 18 to 20 km/l (5.6 to 5.0 l/100 km) on the highway.

In Pune (Maharashtra), prices for various variants are as follows:
Variant Non
Metallic Metallic
MARUTI WAGON R AX BS III (WITH IMMOBILISER) 432044.65 435219.32
MARUTI WAGON R LX DUO BS III (WITH IMMOBILISER) 330565.30 333739.85
MARUTI WAGON R LX BS III (WITH IMMOBILISER) 313670.77 316845.32
MARUTI WAGON R VXI BS III (WITH IMMOBILISER) 362144.70 365319.37
MARUTI WAGON R VXI BS III (WITH ABS and
IMMOBILISER) 390970.70 394145.37
MARUTI WAGON R LXI BS III (WITH IMMOBILISER) 339655.12 342829.79
MARUTI WAGON R LXI DUO BS III (WITH IMMOBILISER) 359343.31 362517.98
WHY MARUTI WAGON-R?
1. MIDDLE SEGMENT CAR
In today’s environment when roads are flooded with cars, traffic is a Major problem. So
car with smaller size are in great demand
2. CAR FOR EVERYONE
Big Range of Price (313670 – 435219), we can see in chart above. This makes sure car
for each income group.

COMPANY SPECIFIED FEATURES
1. 16 VALVES HYPERTECH ENGINE
2. ELECTRONIC POWER STEERING
3. 32 BIT ONBOARD PROCESSOR
Powered by 16 valves, 4 cylinder hypertech
engine WagonR is geared to deliver high power
of 64 bhp. The 4 valves per cylinder ensure
breathing of the engine and deliver high fuel
efficiency.
Electronic Power Steering makes sure that
you get smooth driving.
Onboard processor makes sure intelligent,
fast engine response and better pick-up.
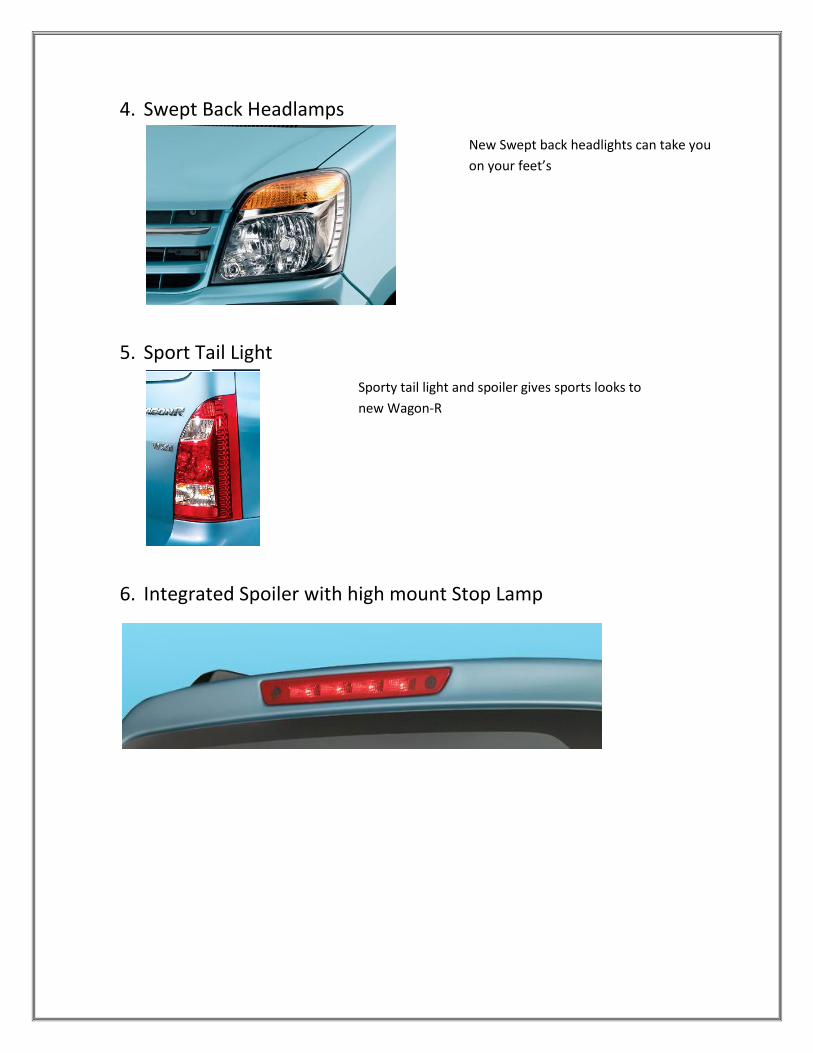
4. Swept Back Headlamps
5. Sport Tail Light
6. Integrated Spoiler with high mount Stop Lamp
New Swept back headlights can take you
on your feet’s
Sporty tail light and spoiler gives sports looks to
new Wagon-R

Safety Specifications
1. Crumple Zone
These Zones absorb the force of impact in the event of collision. On impact, the energy
flow through the body structure ensures complete passenger safety
2. iCATS
iCATS or Intelligent Computerized Anti-Theft System, is a smart pre-fitted vehicle
security device that allows car to start only when original key is inserted. And you pay
lower insurance premium with iCATS.
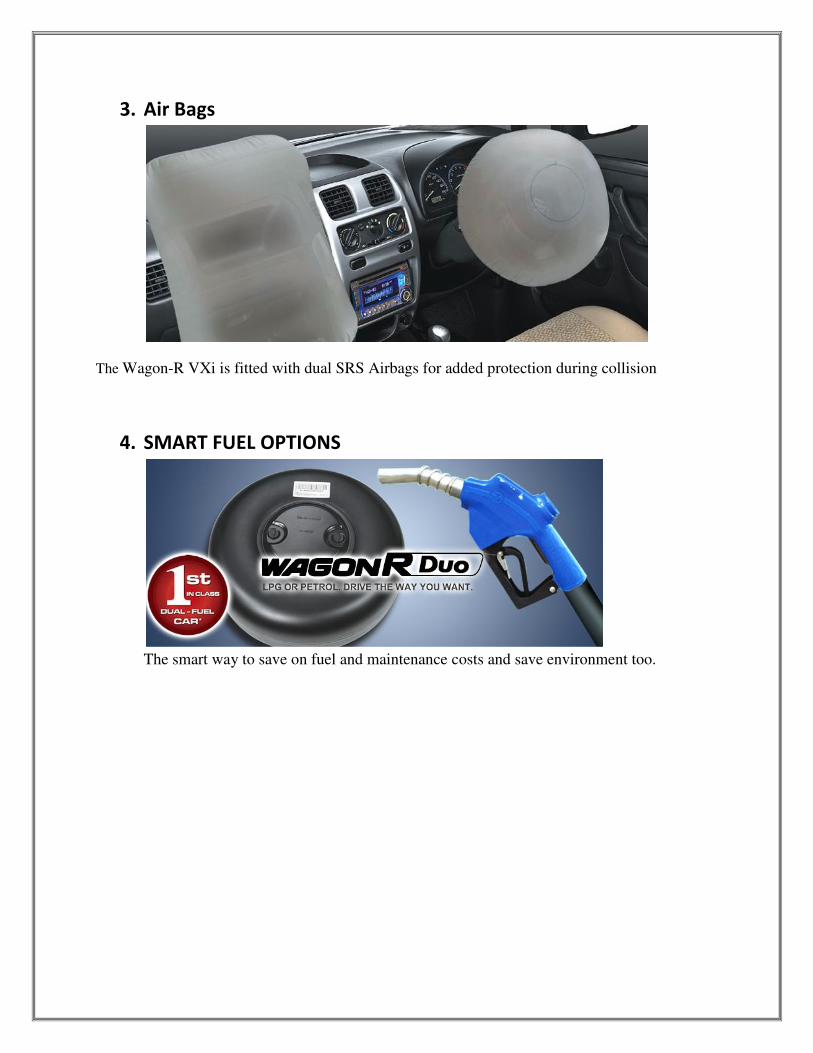
3. Air Bags
The Wagon-R VXi is fitted with dual SRS Airbags for added protection during collision
4. SMART FUEL OPTIONS
The smart way to save on fuel and maintenance costs and save environment too.

OBJECTIVES
• To understand customer response toward various passenger cars (Wagon-R)
• To gain better understanding of the factors which influence the consumer satisfaction
level and their impacts while buying/using a passenger car
• To determine the customer’s perspective and their responses towards passenger cars and
particularly Wagon-R
• Providing better understanding of consumer satisfaction of passenger cars.
• Identifying there expenditure patterns based on average consumption of fuel.

METHODOLOGY
1. Decided the factors which affect the satisfaction level of a consumer while using a car
The factors which we will consider for judging the satisfaction level:
• Time of purchase
• Monthly travel
• Purpose (Office or Luxury)
• Monthly fuel expenditure
• Frequency of maintenance
• After Sales service by company
• Average
• Extra accessories provided by the company
Various Criteria for judging satisfaction level:
• Delivery time
• Schemes offered by dealers (Installments, Easy Finance)
• Ease of availability of color at the time of purchase
• Leg space
• Engine noise
• Driving Comfort
• Cooling
• Jerks
• Vibrations
• Seat comfort
• Mileage
• Luggage space
• Height of the car
• Average
• Technical Aspects of Wagon-R
• Quality of accessories provided by the company
• Overall satisfaction level

2. Prepared a questionnaire with all the above factors in consideration
3. Field survey to gain some facts and figures for the purpose of data analysis
4. Getting around 100-120 samples filled on field.
5. The samples included people from almost every age group and every profession.
6. Applied the appropriate multivariate analysis technique for the purpose of data analysis.
7. Analyzed the findings from the analysis.
8. Reached to a conclusion based on the findings.
9. Provided our recommendations.

BASIS FOR THE METHODOLOGY
CLASSIFICATION OF DATA
Business research can be classified into 2 categories i.e. Primary research and secondary
research.
Primary research includes collecting primary data. Primary data is collected directly from
respondents using data collection methods like survey interviews, questionnaires, measurements,
direct observation etc. Here the researcher is directly involved in the collection of information
required to answer the research questions. Secondary data is the data that already exists which
has been collected by some other person or organization for their use. Sources of secondary data
include websites, journals, books etc.
Source of primary data for the present study is collected through questionnaire and answered by
the small investors. The secondary data is collected through Internet search.
QUESTIONNAIRE METHOD
As it is seen that survey research is carried out by having the questionnaire filled up. A
questionnaire is a set of questions to be asked from respondents in an interview, with appropriate
instructions indicating which questions are to be asked, and in what order. A questionnaire serves
four functions viz. enables data collection from respondents, lends a structure to interviews and
provides a standard means for writing down answers and help in collecting data.
Under this method, list of questions pertaining to the survey were prepared for all those who own
Wagon-R car. Structured objective type questions were prepared for the respondents with fixed
response categories. All of the questions were of multiple-choice type. The questions have more
than one alternative.
As it is known now that primary data was collected through survey methods. Loop holes in
secondary data can be filled by primary data i.e. by survey methods. They provided valuable
information on peoples’ opinions and perceptions about various issues with a bearing on the
research problem.

SURVEY RESEARCH
Classification of survey research methods
Degree of Structure &
Disguise in Questionnaire
Design
Mode of
Communication
Temporal Basis
Structured
Unstructured
Disguised
Undisguised
Personal
Interviews
Self-administered
Interviews
Telephonic
Interview
Mail Survey
Door-to-Door
Interviewing
Executive
Interview
Malls intercept
Interviewing
Central - location
Telephonic interview
Computer – assisted
Telephonic Interviewing
Completely Automated
Telephone Surveys

SAMPLING METHOD
• The Basis Of Sampling: -
In the case of survey of Wagon-R cars, people those who own Wagon-R car were chosen
randomly regardless of their age, occupation, etc. Therefore, Random Sampling was taken
Sample Size - 150
(110- Local i.e. Aundh, Baner, KP, etc.)
(40- telephonic i.e. across India)
Questionnaire design
Steps undergone while preparing questionnaire
1) Preliminary Decisions:
Many decisions were taken before framing the actual questionnaire. These decisions
related to information required, the target respondents and the choice of interviewing
techniques. The decisions as follows,
a) Required information:- Information required was regarding the satisfaction of
passenger cars and the research was carried out to estimate the satisfaction level of
Maruti Wagon-R
b) Target respondents:- Target respondents here in this research survey were the people
who owned Wagon-R across India
c) Interviewing technique:- Personal Interview, Mall Intercepts, Telephonic Interview,
Mail Survey were techniques used for interview.
2) Question content:
a) The usefulness of data: - Each question contributed to the survey.
b) Effectiveness in producing data :- Which have some contribution in conclusion
c) The participant’s ability to understand:- Easy language and easily understandable
d) The respondent’s willingness to answer

3) Response format:
The format usually deals with issues relating to the degree of freedom that should be
given to respondents while answering the questions.
a) Open ended questions:-
These type of questions require the respondents to respond in their own words
without being restricted.
b) Close ended questions:-
Questions which restrict the respondent’s answers to pre defined response actions, are
called close ended questions. In this research, the researcher has used close ended
question in order to get the required response in required direction.
Ex. Multiple choice, binary, etc.
In our survey, most of the question were closed ended.
4) Question wording:
It tests the abilities of the person framing questions, his effectiveness in cross
communication. The effective translation of the desired question content into appropriate
words does the trick in gathering responses. The questions in this research were put into
simple words by the researchers to gather as much accurate information as possible.
5) Questionnaire sequence:
It relates to the proper sequencing for better and effective response. The questions should
be in a proper flow and the questions should not come out abruptly. The questionnaire
prepared for this research had proper flow of questions with one question related to
another. For ex. Lead in questions, qualifying questions, warm up questions etc
Using structured and formal methods of data collections as seen in survey research is not
effective all the time and has many disadvantages. A major drawback in using quantitative
methods is the problem of deliberate falsification where the respondents knowingly fabricate the
answer to private and sensitive questions. It becomes difficult to probe into subconscious mind
of respondents to collect factual data. For that we have to use quantitative analysis.

DATA ANALYSIS
Age Factor
Age is an important factor to estimate the satisfaction level as different people may give
importance to different attributes than the factors which young people prefer.
Ranges of age taken by the researcher to make the analysis simpler and make its
understanding simple are:
� 20 - 30
� 30 - 40
� 40 - 50
� 50 – 60
� 60 - 70
The above pie chart shows the %age of people who lie in different ranges. Majority that
is 41% of people who own Wagon-R car lies in the age of 20 to 30 yrs. This implies that
the Wagon-R car basically targets the youth and people in this age group are working
professionals and have to travel through traffic. As in the present scenario, ease of driving
has got much more affinity than other features of the car due to traffic congestions.
Unavailability of parking space, fuel consumption and maintenance influences the young
people’s choice of buying this small, easy to drive vehicle. And people in this age group
are busy working professionals and usually have issues relating to time.
41
32
14
12
1
Age group
20-30
30-40
40-50
50-60
60-70

Time of purchase
The above graph shows that that majority of buyers fall in the range of 1-2 years, so we
can infer that sale of Wagon-R right now is not as good as 2 years back. This may be
because of strong competition from foreign Auto-Players.
0
5
10
15
20
25
30
35
40
45
50
last Year 1-2 years >3 Years
%
o
f
p
e
r
s
o
n time period
Time of Purchase

Travel/Day
A most of the respondents were students and office going people, and most of the office
going respondent live near their office itself so they don’t have to travel a lot.
Monthly fuel Expenditure
According to the above bar graph, majority people spend monthly on fuel between
Rs1000 to Rs2500. The expenditure on fuel varies from person to person on the basis of:
• Total monthly usage of the car and Mileage of the car
This inference has been drawn from the data of frequency of maintenance services used
by the customers and average of the car.
0 10 20 30 40 50
less than 20
20 - 50
50 - 100
more than 100
% of respondent
travel per day (kms)
19
51
30
Monthly expenditure
<1000
1000-2000
>2000

Average (Mileage)
We can infer from the above graph that most of the people fall in range of 13-17kms per liter in
city conditions which shows high fuel efficiency for Wagon-R users. Fuel Efficiency depends on
Travel per day and usage. So, all factors are inter-related.
0 10 20 30 40 50 60
10 to 13
14 - 17
>17
% of respondent
Average (Mileage)

Satisfaction Level for Various Features
In the following parts we will see, what consumer thinks about various characteristics of Wagon-
R on the following index:
1. Very Low
2. Low
3. Average
4. High
5. Very High
0% 3%
37%
47%
13%
Delivery Time
1
2
3
4
5
3%
9%
69%
19%
0%
schemes offered
1
2
3
4
5

0%
23%
32%
35%
10%
engine noise
0%
22%
25%37%
16%
jerks
1
2
3
4
5
3% 6%
18%
49%
24%
Ease of driving
1
2
3
4
5
0% 6%
34%
38%
22%
Color
1
2
3
4
5
1
2
3
4
5

0%
15%
30%55%
0%
Vibrations
0%
6%
40%
39%
15%
Mileage
30%
1
2
3
4
5
0%
12%
13%
44%
31%
Seat Comfort
40%
1
2
3
4
5
0% 10%
32%
48%
10%
luggage space
Seat Comfort
1
2
3
4
5
1
2
3
4
5
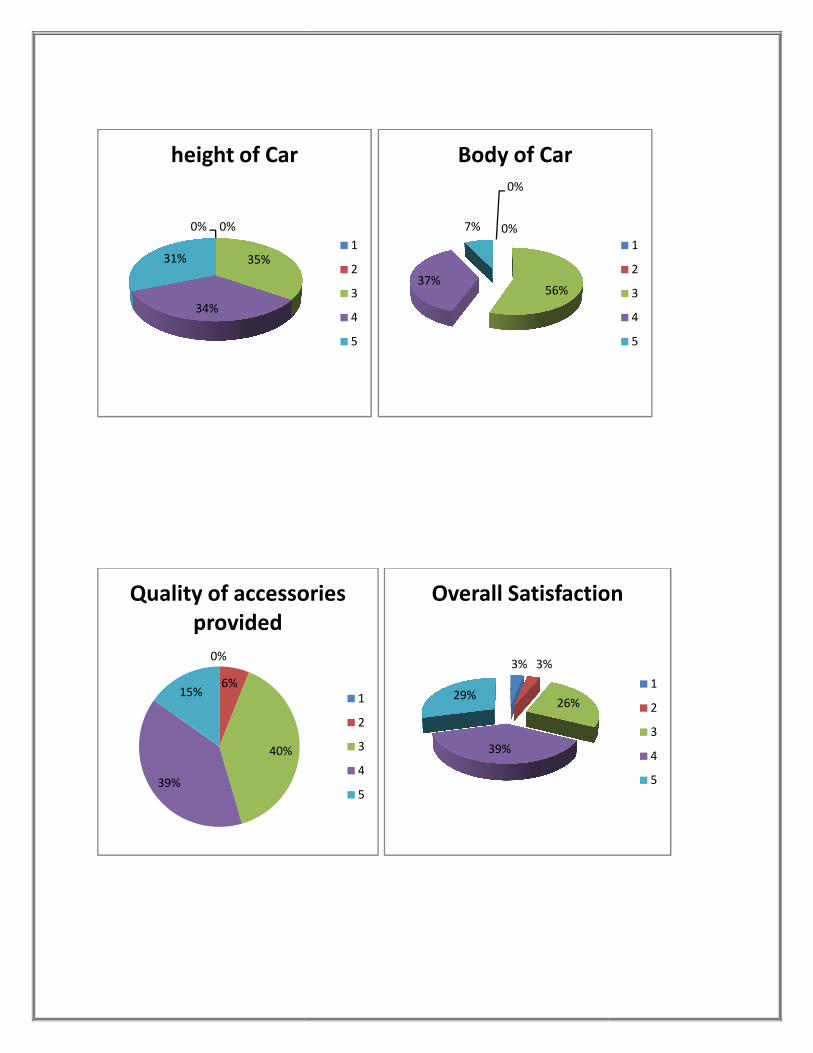
0% 0%
35%
34%
31%
height of Car
0%
6%
40%
39%
15%
Quality of accessories
provided
1
2
3
4
5
0%
0%
56%37%
7%
Body of Car
Quality of accessories
1
2
3
4
5
3% 3%
26%
39%
29%
Overall Satisfaction
1
2
3
4
5
Overall Satisfaction
1
2
3
4
5

In the following graphs we will see level of satisfaction that is provided to customer from various
technical point of view like:
Engine, cooling, Gear, etc.
INDEX:
1-Completely Disappointed
2- Didn’t Meet Expectation
0%
14%
57%
29%
engine
Technical Aspects
In the following graphs we will see level of satisfaction that is provided to customer from various
Completely Disappointed 3 – Met Expectation
Didn’t Meet Expectation 4- Above Expectation
1
2
3
4
0%
28%
43%
29%
cooling
In the following graphs we will see level of satisfaction that is provided to customer from various
1
2
3
4
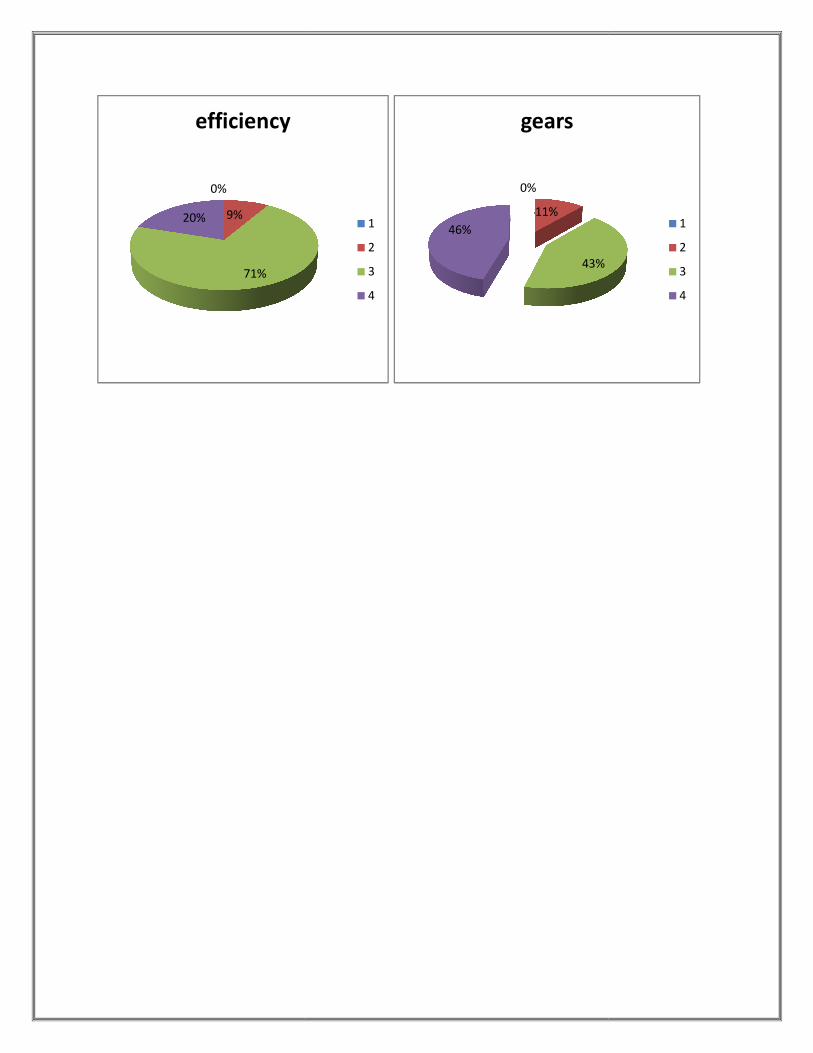
0%
9%
71%
20%
efficiency
1
2
3
4
0%
11%
43%
46%
gears
1
2
3
4

FIELD FINDINGS
Before moving on to the field findings, the researchers need to discuss the barriers which they
faced while filling the questionnaires:
1. Language barrier
There were many people who could not make out the language followed by the
researchers i.e. English. They had to be communicated in the local language
2. Difficulties in interpreting the questionnaire
There were many people who were confused in many of the questions. So researcher had
to provide explanation for many questions
3. Time constraint
As most of the target sample consists of office going people, time constraint was always
there.
4. Biased behavior toward brand
Some people feel too much attached to Maruti, so they tend to get biased.
Area Visited
1. Food Joints
2. Parking lots
3. Malls like Ozone, Central, etc.
4. Busy Roads

TESTING OF HYPOTHESIS
One objective of sampling is hypothesis testing. In this survey, the hypothesis testing began by
making some assumptions about the population parameter.Then the sample was gathered and
sample statistic was determined. To test the validity of the hypothesis the difference between the
hypothesized value and the actual value of the sample statistic was determined.If the difference
between the hypothesized population parameter and the actual value would be large then the
hypothesis will be rejected. If it would be small then it will be accepted.
There are two hypotheses :
1) Null hypothesis(H₀):This asserts that there is no difference between the statistic and the
population parameter and whatever observed difference is there is merely due to chance.
2) Alternative hypothesis (H₁): Any hypothesis which contradicts null hypothesis is
called an alternative hypothesis.
After taking sample data mean and standard deviation will be calculated .In this survey we
have taken totally 9 variables on which Y is dependent.
Each variable can take any value among 1,2,3,4 and 5.
1-----very low
2-----low
3-----average
4-----high
5-----very high
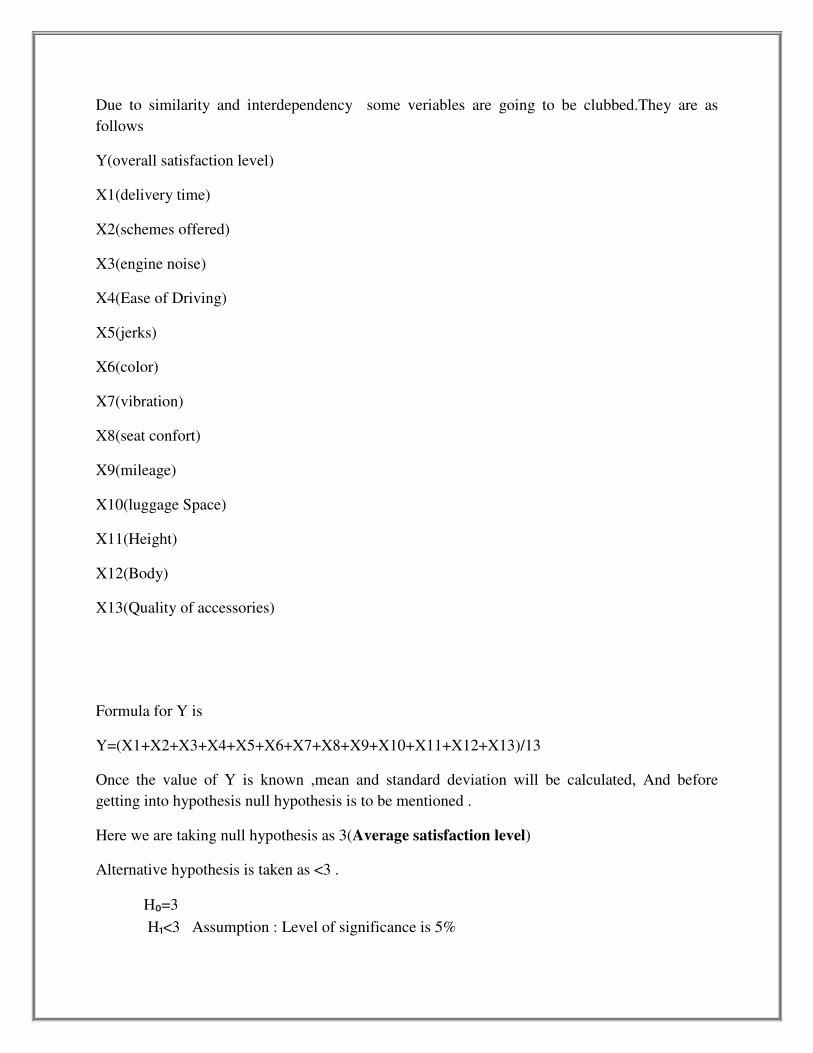
Due to similarity and interdependency some veriables are going to be clubbed.They are as
follows
Y(overall satisfaction level)
X1(delivery time)
X2(schemes offered)
X3(engine noise)
X4(Ease of Driving)
X5(jerks)
X6(color)
X7(vibration)
X8(seat confort)
X9(mileage)
X10(luggage Space)
X11(Height)
X12(Body)
X13(Quality of accessories)
Formula for Y is
Y=(X1+X2+X3+X4+X5+X6+X7+X8+X9+X10+X11+X12+X13)/13
Once the value of Y is known ,mean and standard deviation will be calculated, And before
getting into hypothesis null hypothesis is to be mentioned .
Here we are taking null hypothesis as 3(Average satisfaction level)
Alternative hypothesis is taken as <3 .
H₀=3
H₁<3 Assumption : Level of significance is 5%
observed standardized value=( x ̄-µ)/ σ=13.98
H₀=3
H₁<3
The observed value lies in accepted region, we can accept null hypothesis.
Thus the level of satisfaction for Wagon-R is Average according to the researchers’
hypothesis.

FINDINGS AND INFERENCES
The major chunk of India’s population lies in the age group of 20-30 i.e. the youth comprises the
major part of India’s population. According to the statistics, the largest segment of car users is
also the same group.
AGE GROUP
Maruti Wagon-R being one of the most trusted Brand and stylish also is able to attract youth of
India:
• 41% of Wagon-R owners are in 20-30 age group
• 32% of Wagon-R users are in 30-40 age group
• 14% in 40-50 age group
• 12% in 50-60 age group
• Mere 1% in 60-70 age group
So we can say that Wagon-R attracts youth and Middle age office going people due to its
compact size and High mileage.
DAILY TRAVEL
As majority of the respondent are office going and students, they generally doesn’t live far from
their place of working. So nearly 80% of the respondent fall under 50 kms per day.
• 37% of Wagon-R owners, travel less than 20 kms every day
• 43% of Wagon-R owners, travel 20-50 kms every day
• 18% travel 50-100 kms
• 2% travel more than 100 kms
FUEL CONSUMPTION
Majority of owner have their monthly expenditure in between 1000-2000 i.e. 51%. As most of
the people travel less than 50 kms per day, fuel consumptions is in between Rs.1000-2000.
• For 19% of the owners, monthly expenditure is less than Rs.1000
• For 51% of the owners, it lie between Rs.1000-2000
• For 30% of the owners, it is above Rs.2000

HIGH FUEL EFFICIENCY
Wagon-R was able to give high mileage even in city conditions as against its competitor Santro,
which has low fuel efficiency as compared to Wagon-R.
• For 26% of owners, mileage is in between 10-13km per liter
• For 51% of owners, mileage is between 13-17 kms per liter
• For 23% of owners, mileage is above 17 kms per liter

RECOMMENDATIONS
• Researchers recommend that Wagon-R is an appropriate car in the B segment with above
average level of satisfaction for the middle income group people because as per their
findings, this car has above average level of satisfaction among majority of the owners of
Wagon-R.
• Another recommendation is that the researchers have taken a sample of just 150 Wagon
users which represent the rest of Wagon-R users’ population also. This is a very small
sample considering the large population in mind. Thus whatever inferences the
researchers found out, they cannot be applied to all the Wagon-R.
• Based on study, we can say Wagon-R must focus more on youth and try to make it more
stylish so that it can keep youth attached to its brand.
Bibliography
• Business Research Methods (ICMR Publications)
• Business Research Methods(Donald and Cooper)
• www.marutiwagonr.com