how firm capabilities affect who benefits from foreign...
TRANSCRIPT
How Firm Capabilities Affect Who Benefits fromForeign Technology∗
Garrick Blalock † Paul J. Gertler ‡
February 22, 2005
Abstract
We explore how firm capabilities affect the diffusion of technology broughtwith foreign direct investment (FDI). Using a panel dataset of Indonesian man-ufacturers from 1988 to 1996, we measure how the productivity of differing localfirms responds to the entry of multinational competitors. We find that firmswith greater absorptive capacity, as measured by prior investment in researchand development, and firms with highly educated employees are able to adoptmore technology from foreign entrants than others. In contrast, firms that havea narrow technology gap, meaning that they are close to the international best-practice frontier, benefit less than firms with weak prior technical competency.This finding suggests that the marginal return to new knowledge is greater forfirms that have more room to “catch up” than it is for already competitivefirms.
Keywords: technology transfer, foreign direct investment, firm capabilitiesJEL classification: O32, O24, F14, L60
∗We are indebted to Indra Surbakti, Fitria Fitrani, Iwan Hermanto, Rifa Rufiadi, Kai Kaiser, andJack Molyneaux for their assistance in obtaining and understanding the data. We received helpfuladvice from David I. Levine, David C. Mowery, and Pranab Bardhan. We thank the Institute ofBusiness and Economic Research (IBER) and Management of Technology (MOT) program, both atthe University of California, Berkeley, for their generous financial support.
†Cornell University, Department of Applied Economics and Management, 346 Warren Hall,Ithaca, NY 14853-7801. Tel. (607) 255-0307. [email protected]
‡University of California, Haas School of Business, and NBER, [email protected]
1
1. Introduction
Policy makers have long believed that foreign direct investment (FDI) can be an
important source of technology for developing economies (World Bank 1993). They
argue that the technology employed by firms in emerging markets is inferior to that of
their multinational counterparts based in developed economies. When multinationals
enter an emerging market, they bring more advanced technology, defined here as the
managerial practices, production methods, and other tacit and codified knowhow by
which a firm transforms inputs into a product. This technology may then diffuse
throughout the host economy. For example, local incumbents may imitate the new
technology or workers trained by the multinational may leave to create or join do-
mestic firms. To the extent that the technology can be observed and adopted in this
manner, it is a public good with a positive externality for local firms. This proposition
has spawned a large literature seeking to identify “technology spillover” from FDI.1
This paper builds on this discussion by asking which host economy firms are
most likely to adopt whatever technology is brought with FDI. Understanding the
determinants of technology adoption has important policy implications. Policy mak-
ers evaluating the cost of programs to attract FDI must consider whether there are
benefits to FDI overall and, if so, which firms are the likely recipients. Indeed, the
empirical evidence on the first question is mixed.2 One reason for the conflicting
results may be firm heterogeneity—if only certain firms can benefit from FDI, then
the overall benefit may vary with the composition of firm types in the economy.
In addition to informing policy towards FDI, understanding how firm capabilities
affect innovation may shed light on other policy questions. It is likely that the at-
1See Moran (2001), Saggi (2002), and Keller (2004) for excellent surveys of the literature ontechnology transfer from FDI.
2See Caves 1974, Globerman 1979, Blomstrom and Wolff 1994, Haddad and Harrison 1993, Kokko1994, Aitken and Harrison 1999, and Haskel, Pereira, and Slaughter 2002.
2

tributes influencing adoption of technology from FDI would affect adoption of other
technologies as well. To the extent that this is true, our results illustrate which firms
are likely to take advantage of other sources of knowledge, such as universities or
national research laboratories, in which policy makers may consider investment.
We propose three firm capabilities that may influence technology adoption. First,
a firm’s investment in absorptive capacity, the “ability to recognize the value of new
information, assimilate it, and apply it to commercial ends” would likely influence
its ability to exploit external knowledge (Cohen and Levinthal 1990). Cohen and
Levinthal argue that a firm can build absorptive capacity by engaging in activities
requiring prior related knowledge, such as basic related skills, a common language,
or familiarity with scientific and technical developments in the field. As a proxy for
absorptive capacity, we will use a firm’s investment in research and development.
Second, a firm’s human capital may influence its adoption of technology for similar
reasons. Even if a firm can observe external technology, its ability to adopt or imitate
may be contingent upon having skilled personnel with sufficient training and educa-
tional background to learn quickly. We measure human capital as the percentage of
a firm’s workers with college or higher degrees.
Third, a firm’s technology gap, the distance between the level of a firm’s technology
and that of the international best practice frontier, could affect technology adoption.
The direction of such an effect is unclear. On one hand, firms with a wide gap could
innovate quickly since they could initially adopt “low hanging fruit,” or technology
with low marginal costs and high marginal returns. On the other hand, less technically
competent firms could be too far behind best practice and lack the skills needed to
catch up.
We test the three hypotheses described above using a panel dataset for Indonesian
manufacturing facilities from 1988 to 1996, a period of foreign investment liberaliza-
3
tion. This setting provides three advantages for our research. First, trade regime
changes, such as that which occurred in Indonesia, introduce dramatic changes in
foreign investment by industry, region, and year, and we can exploit this variation
to identify technology diffusion. Second, unlike basic research and development, the
technology brought with FDI is already commercialized by the multinational firms.
In particular, multinationals tend to transfer more mature and stable technologies
to their overseas operations (Mansfield and Romeo 1980).3 This eliminates the long
lag between basic research and commercialization that often complicates the identi-
fication of knowledge flows. Third, because the data capture FDI at the level of the
multinational firm, we can precisely identify local firms in the same sector and region
that potentially benefit from intra-sector technology spillover.
Our data are a rich panel of Indonesian manufacturing establishments with in-
formation on ownership, inputs, outputs, and a number of managerial attributes.
The data provide three advantages for identification. First, panel data allow the use
of within-establishment estimation, which enables better identification of technol-
ogy adoption than cross-sectional data. Second, the analysis can exploit large inter-
temporal variation in FDI stemming from investment policy liberalization. Third, the
dataset provides exceptionably rich descriptions of establishment attributes which al-
low identification of firm capabilities.4
3Although the technology adopted by host economy firms is not necessarily new to the multi-national, it is sufficient for our study if it is simply new to the host economy firms. Nelson (1992)points out that, “innovation,” includes the implementation and mastery of new designs and pro-cesses, “whether or not they are new to the universe, or even to the nation.”
4Quantifying technology transfer and identifying to which firms it occurs is challenging becauseof methodological and data limitations (Griliches 1994). Researchers typically employ one of threeapproaches to overcome the inherent difficulty in observing intangible knowledge flows: survey re-sults (e.g., Mansfield 1991), patent counts (e.g., Jaffe 1989), and production function estimation(e.g., Griliches 1962), the method used here. Griliches and Mairesse 1995 reviews the literature onmeasuring technology transfers. Studies identifying how firm attributes affect technology adoption,e.g. Cockburn and Henderson 1998 and Arora and Gambardella 1994, are few because of the richerfirm-level data required, a constraint that our data allow us to overcome.
4
The results suggest firm capabilities do affect technology adoption from FDI. In
particular, firms with greater absorptive capacity, as measured by prior investment
in research and development, and firms with well educated employees benefit more
than others. In contrast, firms that have a narrow “technology gap,” meaning that
they are close to the international best-practice frontier, benefit less than firms with
weak prior technical competency. This finding suggests that the marginal return of
new knowledge is greater for firms that have more room to “catch up” than it is for
already competitive firms.
The paper proceeds as follows. Section 2 provides some background on foreign
direct investment in Indonesia. Sections 3 and 4 detail the data and our identification
strategy, respectively. Section 5 discusses the results and Section 6 concludes.
2. Indonesian Manufacturing and Foreign Investment Policy
We examine the above issues in a period just following the liberalization of foreign
investment in Indonesia. Like many other emerging markets seeking inward technol-
ogy transfer, Indonesia enacted a number of policies to encourage FDI in the late
1980’s and early 1990’s. The spillover of knowledge from FDI to local firms was part
justification for the cost of these programs. We treat the knowledge accumulated
from FDI as a public good and ask which firms benefited from it.
Indonesia’s manufacturing sector is an attractive setting for research on FDI and
technology adoption for several reasons. First, with the fourth largest population in
the world and thousands of islands stretching over three time zones, the country has
abundant labor and natural resources to support a large sample of manufacturing
facilities in a wide variety of industries. Further, the country’s size and resources
support a full supply chain, from raw materials to intermediate and final goods, and
5
both export and domestic markets. Second, rapid and localized industrialization
provides variance in manufacturing activity in both time and geography. Third, the
country’s widespread island archipelago geography and generally poor transportation
infrastructure create a number of local markets, which support our use of geographical
variation in the analysis. Fourth, a number of institutional reforms of investment law
have dramatically increased the amount of FDI in recent years. In particular, the
nature and timing of these reforms provide exogenous variation in FDI by region,
industry, and time that will be exploited in the econometric identification. Last,
Indonesian government agencies employ a number of well trained statisticians who
have collected exceptionally rich manufacturing data for a developing country. The
remainder of this section provides some background on Indonesian manufacturing and
foreign investment policy with the intent of highlighting institutional changes that
contribute to the longitudinal variation we exploit in the econometric identification.
2.1. Growth in Manufacturing
The Indonesian economy and the manufacturing sector grew dramatically from the
late 1970’s until the recent financial crisis.5 Indonesia enjoyed an average annual GDP
growth rate of 6-7 percent and much of this growth was driven by manufacturing,
which expanded from 11 percent of GDP in 1980 to 25 percent in 1996 (Nasution
1995). Government initiatives to reduce dependency on oil and gas revenue in the
mid-1980’s, principally liberalization of financial markets and foreign exchange, a shift
from an import-substitution regime to export promotion, currency devaluation, and
relaxation of foreign investment laws, facilitated the large increase in manufacturing
output (Goeltom 1995).
5Hill (1988) and Pangestu and Sato (1997) provide detailed histories of Indonesian manufacturingfrom the colonial period to the present.
6
2.2. Foreign Investment Policy
Over the past 40 years, government regulation has shifted dramatically from a policy
antagonistic to FDI to a policy actively encouraging it (Wie 1994; Hill 1988; Pangestu
1996). Following independence from the Netherlands in 1945, the Sukarno government
nationalized many of the former Dutch manufacturing enterprises. Weak property
rights and socialist rhetoric kept foreign investment at a trickle throughout the 1950’s
and 1960’s.
Gradual reforms began in 1967 as part of the “New Order” economic regime of
Suharto, who had purged the government of left-wing elements during his rise to
power. The reforms allowed investment in most sectors, but still required substan-
tial minimum levels of initial and long-term Indonesian ownership in new ventures.
Following the collapse of oil prices in the mid-1980’s, the government began to seek
outside investment more actively. From 1986 to 1994, it introduced a number of
exemptions to the restrictions on foreign investment. The exemptions were targeted
to multinationals investing in particular locations, notably a bonded zone on the is-
land of Batam (only 20 kilometers from Singapore), government sponsored industrial
parks, and undeveloped provinces of east Indonesia. The new policy also granted ex-
emptions to investment in capital-intensive, technology-intensive, and export-oriented
sectors. Moreover, the reforms reduced or eliminated import tariffs for certain capital
goods and for materials that would be assembled and exported.
Finally, in 1994 the government lifted nearly all equity restrictions on foreign
investment. Multinationals in most sectors were allowed to establish and maintain
in perpetuity operations with 100 percent equity. In a handful of sectors deemed
strategically important, a nominal 5 percent Indonesian holding was required with no
further requirement to divest.
7
2.3. Changes in Investment Following Initiation of Reforms
The reforms have been accompanied by large increases in both the absolute and the
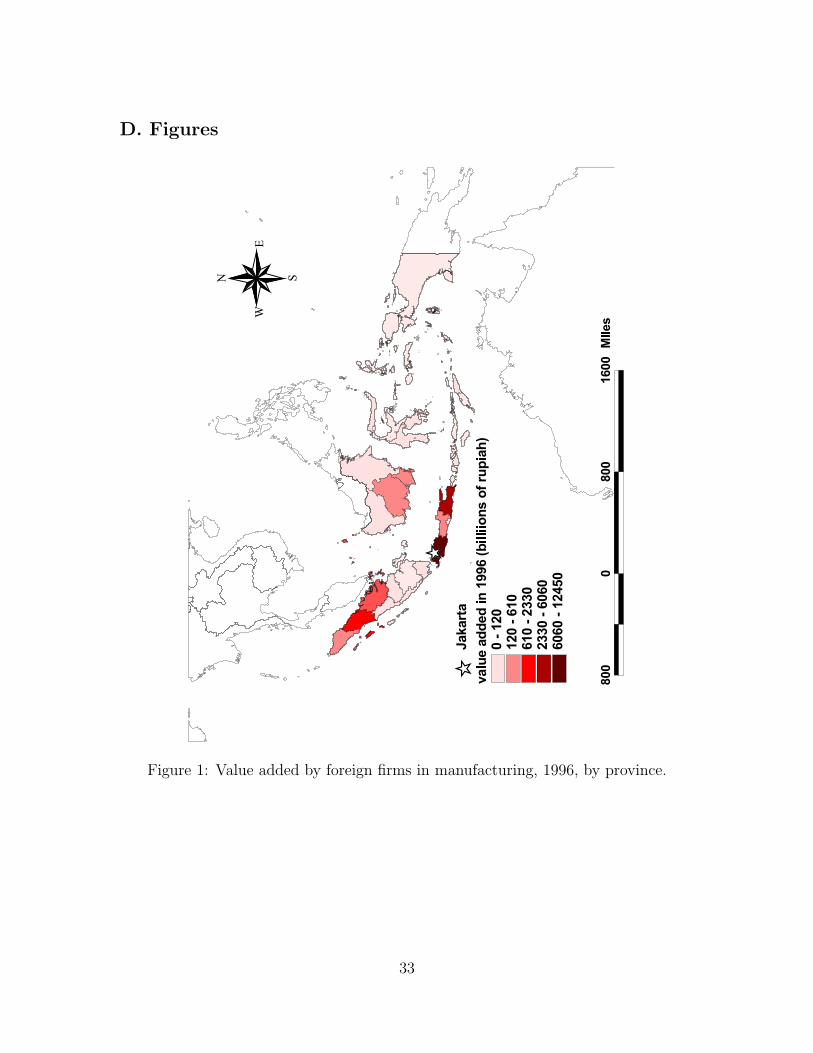
relative value of foreign production in Indonesian manufacturing. Figure 1 shows the
real value added by foreign firms in 1996 by province. The map indicates significant
regional variation and shows the absolute level of foreign output to be very large. For
example, the value added by multinational manufacturing in the province of Riau (the
closest province to Singapore and home to the Batam bonded zone) is 2,335 billion
rupiah, or about 10 percent of the province GDP. Large foreign investment from 1988
to 1996 in chemicals, plastics, electronics assembly, textiles, garments, and footwear
dramatically increased the foreign output in many areas. Figure 2 shows the foreign
share of manufacturing value added in 1988 and 1996, respectively, by province. In
many regions the foreign share of value added increased dramatically from 1988 to
1996 and accounted for more than half of the total in 1996.
3. Data
The analysis is based on data from the Republic of Indonesia’s Budan Pusat Statis-
tik (BPS), the Central Bureau of Statistics.6 The primary data are taken from an
unpublished annual survey of manufacturing establishments with more than 20 em-
ployees conducted by Biro Statistik Industri, the Industrial Statistics Division of BPS.
Additional data include the input-output table and several input and output price
deflators. The remainder of this section describes the data.
The principal dataset is the Survei Tahunan Perusahaan Industri Pengolahan (SI),
the Annual Manufacturing Survey conducted by the Industrial Statistics Division of
6We identify names in Bahasa Indonesia, the language of most government publications, withitalics. Subsequently, we use the English equivalent or the acronym.
8
BPS. The SI dataset is designed to be a complete annual enumeration of all manu-
facturing establishments with 20 or more employees from 1975 onward. Depending
on the year, the SI includes up to 160 variables covering industrial classification (5-
digit ISIC), ownership (public, private, foreign), status of incorporation, assets, asset
changes, electricity, fuels, income, output, expenses, investment, labor (head count,
education, wages), raw material use, machinery, and other specialized questions.
BPS submits a questionnaire annually to all registered manufacturing establish-
ments, and field agents attempt to visit each non-respondent to either encourage com-
pliance or confirm that the establishment has ceased operation.7 Because field office
budgets are partly determined by the number of reporting establishments, agents
have some incentive to identify and register new plants. In recent years, over 20,000
factories have been surveyed annually. Government laws guarantee that the collected
information will only be used for statistical purposes. However, several BPS officials
commented that some establishments intentionally misreport financial information
out of concern that tax authorities or competitors may gain access to the data. Be-
cause the fixed-effect analysis admits only within-factory variation on a logarithmic
scale, errors of under- or over-reporting will not bias the results provided that each
factory consistently misreports over time. Further, even if the degree of misreporting
for a factory varies over time, the results are unbiased provided the misreporting is
not correlated with other factory attributes in the right-hand-side of the regression.
Not surprisingly, particularly in a developing country environment, there is a
high level of non-reporting and obvious erroneous responses to many of the survey
questions, particularly questions that require some accounting expertise, such as the
7Some firms may have more than one factory. BPS also submits a different questionnaire to thehead office of every firm with more than one factory. Although these data were not available for thisstudy, analysis by BPS suggests that less than 5 percent of factories belong to multi-factory firms.We therefore generalize the results to firms.
9
replacement and book value of fixed assets. We have cleaned key variables to minimize
noise due to non-reporting, misreporting, and obvious mistakes in data keypunching
as described in Appendix B.
The analysis here starts from 1988, the first year for which data on fixed assets are
available. To avoid measurement error in price and other uncertainties introduced by
the 1997-1998 Asian financial crisis, the last year of analysis is 1996. The key variables
are described in Appendix A and summarized for 1988 and 1996 in Table 1.8 The
table indicates a large increase in the number of foreign factories, which increases from
276 in 1988 to 904 in 1996. On average, foreign factories are bigger (as measured by
value added, employees, and capital), more capital intensive (as measured by capital
per employee), more productive (as measured by value added per employee), and
more export-oriented (as measured by percentage of production exported).
We deflated output, materials, and capital to express values in real terms. The
deflators are based on Indeks Harga Perdangangan Besar (IHPB), wholesale price
indexes (WPI) published by BPS. Appendix B describes the deflator calculation in
detail.
4. Identification and Measurement
Our objective is to identify and estimate the effect of FDI on firm productivity.
We do so by estimating an establishment-level transcendental logarithmic (translog)
production function. The translog production function is a second-order logarithmic
approximation of production that places no functional form restrictions on the nature
of input substitution or returns to scale. The production function controls for input
levels and scale effects. In effect, we ask whether the residual in the production
8The descriptive statistic tables describe the data actually used in the analysis. Observationsremoved in the data cleaning are not included.
10
function is correlated with FDI. Further, we will interact firm attributes with changes
in FDI to identify which firms benefit more from foreign firm presence.
Because our firm-level data are a panel, we can examine how changes in FDI over
time affect changes in firm productivity. The advantage of this approach is that it
allows us to control for static unobservable attributes. Further, as we explain below,
our measure of FDI varies by time, industry, and region. We can thus exploit changes
in FDI over time not only between industries, but also within the same industry across
different regions. That is, while controlling for firm-specific effects, our “treatment”
group consists of firms in a particular industry in a region with changing FDI, versus
a “control group” of firms in the same industry but in a region without changing FDI.
Our estimating equation is
ln Yit =β0FDIjrt + β1CAPABILITYiFDIjrt+
β2 ln Kit + β3 ln Lit + β4 ln Mit + β5 ln2 Kit + β6 ln2 Lit + β7 ln2 Mit+
β8 ln Kit ln Lit + β9 ln KitMit + β10 ln LitMit+
αi + γt + εit
(1)
where Yit, Kit, Lit, and Mit are the amounts of production output, capital, labor,
and raw materials for establishment i at time t, αi is a fixed effect for factory i, and
γt is a dummy variable for year t. FDIjrt is foreign direct investment, which we
derive below, in industry j and region r and CAPABILITYi is a placeholder for the
three firm capability variables, also discussed below. A positive coefficient on FDIjrt
indicates that FDI is associated with higher productivity overall. A positive coefficient
on CAPABILITYiFDIjrt indicates that the interaction of that capability with FDI
is positive. In other words, firms with that attribute have a greater productivity
response to FDI than other firms. Output, capital, and materials are nominal rupiah
11
values deflated to 1983 rupiah. Labor is the total number of production and non-
production workers. We assume the error term, εit, to be i.i.d.9
We calculate FDI by industry and provincial region. A regional measure captures
the geographical localization of knowledge spillovers suggested by Jaffe, Trajtenberg,
and Henderson (1993), who found that the rate of knowledge diffusion, measured by
patent citations, declined with distance. Indonesia’s vast island archipelago geogra-
phy and poor transportation and communications infrastructure further support the
notion that firms are less likely to adopt knowledge if it is distant. We calculate FDI
as shown in Equation 2.
FDIjrt =
∑i∈jrt Foreign OUTPUTit∑
i∈jrt OUTPUTit
(2)
i ∈ jrt indicates a factory in a given sector, region, and time, OUTPUTit is the
output of factory i, and Foreign OUTPUTit is the output of factory i if the factory
is foreign, and zero otherwise. We classify industrial sectors with four-digit ISIC
codes.
We next discuss our measurement of the three firm capabilities described above.
Research and development expenditures, the proxy for absorptive capacity, are avail-
able in the 1995 and 1996 surveys. Experience with the SI data indicates that financial
reporting is often noisy. Hence, and because the ratio of R&D expenditures to total
costs is typically low, we do not distinguish between levels of expenditures. Instead,
we use a discrete measure of one if the firm spent any amount on R&D in either 1995
9We assume the error term, εit, to be uncorrelated with the other right-hand-side variables. Ourresults would be biased if inputs, FDI, or capabilities were simultaneously determined by unobservedidiosyncratic shocks in εit (see Olley and Pakes 1996 and Levinsohn and Petrin 2003 for a fulldiscussion). We have performed our analysis with the simultaneity corrections proposed by Olleyand Pakes and Levinsohn and Petrin using investment and electricity as a proxies for idiosyncraticshocks. The results (not reported here but available from the authors) are virtually unchanged.
12
or 1996, and zero otherwise.10
Human capital is measured as the percentage of workers with college or higher
degrees. Data on employee educational attainment are available for 1995 and 1996. If
firms reported educational attainment in both years, we used the highest percentage.
We dropped firms that did not report educational attainment from the sample.
We calculate the “technology gap,” the distance from a firm’s production compe-
tency to international best practice, using the fixed effect, αi, obtained from estimat-
ing a translog production function. A technology gap measure for each local firm is
obtained by subtracting its fixed effect from the mean fixed effect of foreign firms in
the same 3-digit ISIC code. Recall that our estimation is all in logs and thus coeffi-
cients represent elasticities. The technology gap derived from fixed effect subtraction
therefore has an intuitive interpretation as a percentage from the frontier. For exam-
ple, a gap of 0.2 indicates that that firm was about 20 percent less productive than
the average of foreign firms in the same industry.
To avoid the obvious endogeneity of the technology gap measure—that the tech-
nology gap and firm performance are jointly determined—we have divided each firm’s
duration in the panel into two periods. We calculate the technology gap using only
the first three years of observations for each firm. We then estimate the effect of FDI
interacted with the technology gap using only observations after the first three years
a firm was in the panel.
Table 2 reports the correlation between all three capabilities. Overall, there is little
correlation between the three measures, although firms with greater human capital
and absorptive capacity have slightly narrower technology gaps. Table 3 displays
descriptive statistics for the three capabilities by foreign and domestic firms. Although
10Estimation using continuous measures of R&D expenditures shows an effect only at the discon-tinuity from zero to a positive value.
13
we include only domestic firms in our analysis, the difference between foreign and
domestic firms is revealing. Only about 10 percent of local firms have absorptive
capacity (positive R&D expenditures), compared with 28 percent for foreign firms.
Likewise, only about 1 percent of local firm employees are college educated, compared
with 4 percent for foreign firms. The average technology gap is .28 for domestic
firms, suggesting that they are about 28 percent less productive than their foreign
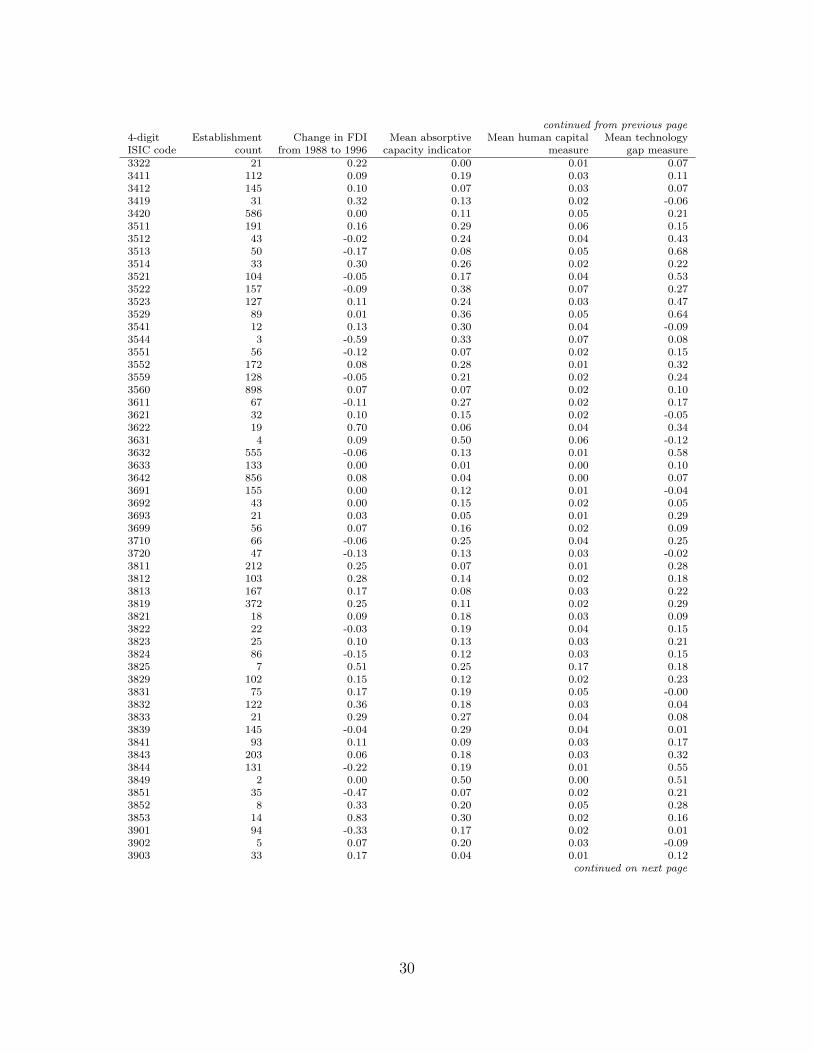
counterparts.11 Table 4 shows the breakdown of sample size, change in FDI, and
capabilities by 4-digit ISIC code.12 The table reveals significant variation across
industries and, in some cases, large differences between nearby codes representing
similar products. Hence, at least some of the comparison between our treatment and
control groups is across seemingly otherwise similar industries.
We stress that the our analysis is not intended to demonstrate a causal relationship
between capabilities and technology adoption. Our choice of capabilities are intended
to serve as proxies for a variety of unobserved firm attributes. For example, firms
with and without R&D expenditures likely vary in a number of ways. The estimated
coefficients on our capabilities should thus not be interpreted as average treatment
effects. Instead, non-zero coefficients would indicate a correlation between the rate
of technology adoption and a variety of unobservables captured by our proxies.
5. Results
Table 5 shows the results of estimating equation 1. The first two columns present
the baseline case of overall technology adoption from FDI. Column (1) shows the
11Since the average productivity of foreign firms, by definition, is the “frontier” benchmark forthe technology gap, the gap for foreign firms is not meaningful and is omitted from the table.
12 In our regressions, we use changes in FDI by province. Because it is impractical to includea table for every province, the table reports only country-wide changes in FDI. The table thusunderstates the true variation in localized FDI.
14
estimation with both domestic and foreign firms, with the percentage of foreign eq-
uity added as a control. As one would expect, productivity increases with foreign
ownership. Column (2) displays the results for just domestic firms, the population
of interest here. The positive coefficient on FDI suggests that, overall, local firm
productivity does increase with foreign entry.
Column (3) displays the results of estimating Equation 1 on a sample of local firms
with an indicator of absorptive capacity, expenditures on research and development,
interacted with FDI. Because the R&D indicator is time-invariant for each firm, its
main effect is dropped from the fixed-effect estimation. The 0.091 coefficient on the
interaction term suggests that firms with greater absorptive capacity acquire more
technology from FDI. If FDI in an industry-region were to grow from zero to one (i.e.,
move from no foreign firms to all foreign firms), then domestic firms with absorptive
capacity would realize a nine percent productivity gain on top of the effect on other
firms. Although such a large change in FDI does not occur in practice, increases in
excess of 20 percent are not uncommon in industry-regions cells occupied by hundreds
of firms. Thus, the realized productivity effect of FDI differs by a non-trivial difference
across the firms with and without absorptive capacity.
Column (4) displays the results of estimating Equation 1 on a sample of local
firms with a measure of human capital, the percentage of employees with college or
higher degrees, interacted with FDI. As with the R&D indicator, because human
capital variable is time-invariant for each firm, its main effect is dropped from the
fixed-effect estimation. The positive coefficient on the interaction term suggests that
firms with greater human capital acquire more technology from FDI. Although the
coefficient of 0.843 seems high, it must be multiplied by changes in FDI and generally
small changes in the share of employees with college degrees to calculate the realized
productivity difference. For most firms, the realized effect of the human capital
15

indicator is an increase in productivity of one or two percent.
Column (5) displays the results of estimating Equation 1 on a sample of local firms
with a measure of technical competency, the gap between the firm’s productivity and
international best practice, interacted with FDI. A wide technology gap indicates that
the firm is far behind the average productivity of foreign competitors. The coefficient
on the interaction term is positive, which suggests that firms with a wide gap benefit
more. Such firms can innovate quickly whereas firms with narrow gaps may have less
to learn and have a lower return to the new knowledge.
It is interesting to note that the technology gap coefficient is opposite in sign and
significant if one does not correct for the endogeneity of the gap calculation. Recall
that the technology gap is calculated using the first three years an establishment is
in the panel. Only observations for later years are then included in the estimation
sample. If the two periods are pooled, thereby introducing simultaneity between
firm performance and the technology gap measure, then the results are reversed.
This outcome is intuitive—without correcting for the endogeneity, poorly performing
establishments will have wide technology gaps by definition.
Column (6) shows all three capabilities tested jointly. The direction of the effects
remains unchanged, but human capital is no longer significant, perhaps because this
variable has the least variance of the data on the three capabilities. The joint test
suggests that among the firms with a wide technology gap, it is those with absorptive
capacity that are able to realize the high marginal returns of technology from FDI.
We should note that the data do not indicate changes in absorptive capacity or
human capital over time. Rather, we have indications only from the end of the panel.
Thus, there is some concern that the decision for a firm to invest in absorptive capacity
or human capital is endogenous to its prior performance. Although the endogeneity
is not as obvious as that of the technology gap measure (for which prior performance
16
actually determines the gap), it is also non-remediable in our econometrics. We
believe it reasonable to assume that firms with high absorptive capacity or human
capital retain those attributes over time. However, we cannot rule out the possibility
that investments in both measures are driven by productivity gains in the early years
of the panel. Such a scenario could explain the weak effect of the human capital
variable in the joint estimation with the other capabilities.
6. Summary and Implications
This paper examines how firms innovate by analyzing host-economy adoption of tech-
nology brought with foreign direct investment (FDI). Our major result is to find
that firm capabilities affect technology adoption in three ways. Firms with greater
absorptive capacity, higher levels of human capital, but with lower prior technical
competency, are the prime beneficiaries of technology from FDI.
The finding for prior technical competency is perhaps the most surprising. Whereas
one might initially think that more competent firms could benefit the most from FDI,
the evidence suggests that firms far from the best-practice frontier gain more. We
believe the “low hanging fruit” idea explains this result: firms with poor initial tech-
nology are more likely to encounter new processes that yield high returns at low cost.
This explanation is partly conditional on the idea that technology brought with FDI
is relatively mature and can be adopted without extensive further development. In
the case of less commercialized technology, such as that coming from universities or
research laboratories, the impact of prior technical competency may differ signifi-
cantly.
Our results add to a conflicting collection of results about technology adoption
from FDI—whereas some studies find positive spillovers, others have found net nega-
17
tive effects from FDI. We argue that the conflicting evidence may, in part, be due to
heterogeneity in the capabilities of host-economy firms. Understanding which firms
benefit from FDI may be more informative than the mean benefit across a heteroge-
nous pool of host-economy firms.
Finally, to the extent that evidence from Indonesia can be generalized, these results
have a key implication for trade policy in developing countries. Actions that promote
FDI are more likely to benefit firms with investments in research and development
and with highly educated employees. At the same time, firms that have further room
to improve against international best practice stand to enjoy the greatest marginal
return from exposure to the new knowledge. Further, to the degree that technology
from FDI resembles technology from other sources, such as universities and research
laboratories, the same implications can be applied to national innovation policy in
general.
18
References
Aitken, Brian J., and Ann E. Harrison (1999): “Do Domestic Firms Benefit
from Direct Foreign Investment? Evidence from Venezuela,” American Economic
Review, 89(3), 605–618. 2
Arora, Ashish, and Alfonso Gambardella (1994): “Evaluating Technological
Information and Utilizing It: Scientific Knowledge, Technological Capability, and
External Linkages in Biotechnology,” Journal of Economic Behavior & Organiza-
tion, 24(1), 91–114. 4
Blomstrom, Magnus, and Edward N. Wolff (1994): “Multinational Corpo-
rations and Productivity Convergence in Mexico,” in Convergence of Productivity:
Cross-National Studies and Historical Evidence, ed. by W. J. Baumol, R. R. Nelson,
and E. N. Wolff. Oxford University Press, New York. 2
Caves, Richard E. (1974): “Multinational Firms, Competition and Productivity
in Host-Country Markets,” Economica, 41(162), 176–193. 2
Cockburn, Iain M., and Rebecca M. Henderson (1998): “Absorptive Capac-
ity, Coauthoring Behavior, and the Organization of Research in Drug Discovery,”
Journal of Industrial Economics, 46(2), 157–183. 4
Cohen, Wesley M., and Daniel A. Levinthal (1990): “Absorptive Capacity:
A New Perspective on Learning and Innovation,” Administrative Science Quarterly,
35(1), 128–152. 3
Globerman, Steven (1979): “Foreign Direct Investment and Spillover Efficiency
Benefits in Canadian Manufacturing Industries,” Canadian Journal of Economics,
12(1), 42–56. 2
19
Goeltom, Miranda S. (1995): Indonesia’s Financial Liberalization: An Empirical
Analysis of 1981-88 Panel Data, Iseas Current Economic Affairs Series. ASEAN
Economic Research Unit, Institute of Southeast Asian Studies, Singapore. 6
Griliches, Zvi (1962): “Handbook of Econometrics,” American Economic Review,
54(6), 961–974. 4
(1994): “Productivity, R&D, and the Data Constraint,” American Economic
Review, 84(1), 1–23. 4
Griliches, Zvi, and Jacques Mairesse (1995): “Production Functions: The
Search for Identification,” Discussion Paper 5067, National Bureau of Economic
Research, Cambridge, MA, March. 4
Haddad, Mona, and Ann Harrison (1993): “Are There Positive Spillovers from
Direct Foreign Investment? Evidence from Panel Data for Morocco,” Journal of
Development Economics, 42(1), 51–74. 2
Haskel, Jonathan E., Sonia C. Pereira, and Matthew J. Slaughter
(2002): “Does Inward Foreign Direct Investment Boost the Productivity of Do-
mestic Firms?,” Discussion Paper 8433, National Bureau of Economic Research,
Cambridge, MA, August. 2
Hill, Hal (1988): Foreign Investment and Industrialization in Indonesia, East Asian
Social Science Monographs. Oxford University Press, Singapore and New York. 6,
7
Jaffe, Adam B. (1989): “Real Effects of Academic Research,” American Economic
Review, 79(5), 957–970. 4
20
Jaffe, Adam B., Manuel Trajtenberg, and Rebecca Henderson (1993):
“Geographic Localization of Knowledge Spillovers as Evidenced by Patent Cita-
tions,” Quarterly Journal of Economics, 108(3), 577–598. 12
Keller, Wolfgang (2004): “International Technology Diffusion,” Journal of Eco-
nomic Literature, 42, 752–782. 2
Kokko, Ari (1994): “Technology, Market Characteristics, and Spillovers,” Journal
of Development Economics, 43(2), 279–293. 2
Levinsohn, James, and Amil Petrin (2003): “Estimating Production Functions
Using Inputs to Control for Unobservables,” Review of Economic Studies, 70(2).
12
Mansfield, Edwin (1991): “Social Returns from R&D: Findings, Methods and
Limitations,” Research-Technology Management, 34(6), 24–27. 4
Mansfield, Edwin, and Anthony Romeo (1980): “Technology Transfer to Over-
seas Subsidiaries by U.S.-Based Firms,” Quarterly Journal of Economics, 95(4),
737–750. 4
Moran, Theodore H. (2001): Parental Supervision: The New Paradigm for For-
eign Direct Investment and Development. Institute for International Economics,
Washington, DC. 2
Nasution, Anwar (1995): “The Opening-up of the Indonesian Economy,” in
Indonesian Economy in the Changing World, ed. by D. Kuntjoro-Jakti, and
K. Omura, vol. 32. Institute of Developing Economies, Tokyo. 6
Nelson, Richard R. (1992): “National Innovation Systems: A Retrospective on a
Study,” Industrial and Corporate Change, 1(2), 347–374. 4
21
Olley, G. Steven, and Ariel Pakes (1996): “The Dynamics of Productivity
in the Telecommunications Equipment Industry,” Econometrica, 64(6), 1263–1297.
12
Pangestu, Mari (1996): Economic Reform, Deregulation, and Privatization: The
Indonesian Experience. Centre for Strategic and International Studies, Jakarta. 7
Pangestu, Mari, and Yuri Sato (1997): Waves of Change in Indonesia’s Man-
ufacturing Industry. Institute of Developing Economies, Tokyo. 6
Saggi, Kamal (2002): “Trade, Foreign Direct Investment, and International Tech-
nology Transfer: A Survey,” World Bank Research Observer. 2
Wie, Thee Kian (1994): “Intra-Regional Investment and Technology Transfer in
Indonesia,” in Symposium on Intra-Regional Investment and Technology Transfer,
ed. by K. Yanagi, pp. 137–166, Kuala Lumpur. Asian Productivity Organization.
7
World Bank (1993): “Foreign Direct Investment—Benefits Beyond Insurance,”
Development Brief 14, Development Economics Vice-Presidency, Washington, DC,
April. 2
22
A. Data Appendix
A.1. Product Class, Location, and Age
The main product class of each establishment is identified by 5-digit International
Standard of Industrial Classification (ISIC) revision 2 codes published by the United
Nations Industrial Development Organization (UNIDO). The ISIC standard divides
manufacturing activity into 329 codes at the 5-digit level. The data include plant
location in one of 27 provinces.13
A.2. Ownership
Two survey questions relate to establishment ownership. First, establishments re-
port whether they operate under a domestic or a foreign investment license. All new
enterprises in Indonesia must obtain an operating license from Badan Koordinasi
Penanaman Modal (BKPM), the Investment Coordinating Board. Establishments
funded with any foreign investment operate under Penanaman Modal Asing (PMA),
foreign capital investment licenses. Establishments with only domestic investment
obtain Penanaman Modal Dalam Negeri (PMDN), wholly domestic capital invest-
ment licenses. Second, each establishment reports the percentage of foreign equity.
Establishments with more than 20 percent foreign equity were defined as foreign.
This definition yielded a sample of foreign factories very similar to those operating
with PMA licenses.
A.3. Capital
The survey asks for the book value and current replacement value of fixed assets. Re-
spondents report assets in five categories: land, buildings, machinery and equipment,
13Following the independence of East Timor, there are now 26 provinces.
23

vehicles, and other assets. When reported, we used the total replacement value of all
five categories for our capital measure. However, if an establishment reported book
values but not replacement values, we used the book values for our capital measure.
A.4. Labor
The numbers of production and non-production workers are reported in all years.
Workers are categorized as either paid or unpaid (e.g., family members) and our
measures include both types. In 1995-1997, the highest level of education obtained
by all workers is available. In 1996, the highest degree and field of specialization for
research and development workers are recorded.
A.5. Materials and Energy
The value of all consumed materials is reported every year.
A.6. Output
The nominal rupiah value of production output is available every year.
B. Data Processing
This section provides more detail on the construction and cleaning of the dataset.
B.1. Construction of Price Deflators
Output, materials, and capital are deflated to express values in real terms. The defla-
tors are based on Indeks Harga Perdangangan Besar (IHPB), wholesale price indexes
(WPI), published monthly in BPS’s Buletin Statistik Bulanan Indikator Ekonomi,
the Monthly Statistical Bulletin of Economic Indicators. To calculate WPI, BPS
24
field officers interview representative firms in all provinces to collect prices for five
categories of commodities: agriculture, manufacturing, mining and quarrying, im-
ports, and exports. In total, prices are available for 327 commodities, 192 of which
are manufactured commodities.
B.1.1. Output, and Materials Deflators
Nominal rupiah output and materials values are deflated using the WPI for the near-
est corresponding manufactured commodity. BPS officials provided an unpublished
concordance table mapping the 192 WPI commodity codes to the 329 5-digit ISIC
product codes.
B.1.2. Capital Deflators
Fixed assets are deflated using the WPI for manufactured construction materials and
imported machinery. Specifically, the capital deflator combines the WPI for con-
struction materials, imported electrical and non-electrical machinery, and imported
transportation equipment. We weighted these price indexes by the average reported
value shares of building and land, machinery, and vehicle fixed assets in the SI survey
to obtain an annual capital deflator.
B.2. Correction for Outliers and Missing Values in Industrial Surveys
We have cleaned key variables to minimize noise due to non-reporting, misreporting,
and obvious mistakes in data keypunching. A three-stage cleaning process was used
for capital, labor, and materials. First, the earliest and latest years in which a plant
reported were identified, and interpolation was used to fill-in gaps of up to two missing
years within the reporting window. If more than two continuous years of data were
missing, the factory was dropped from the sample. The first stage of cleaning removed
25

about 15 percent of the total sample. Second, sudden spikes in key data values likely
attributable to keypunch error (often due to an erroneously added or omitted zero)
were corrected with interpolation. Third, plants with remaining unreasonably large
jumps or drops in key variables not accompanied by corresponding movements in other
variables (for example, large increases in labor not accompanied by any increase in
output) were dropped. This third stage removed about 10 percent of the sample.
We used the replacement value of fixed assets as the measure of capital stock for
most factories. For the few factories that reported only the book value of fixed assets,
we used those figures instead.
26
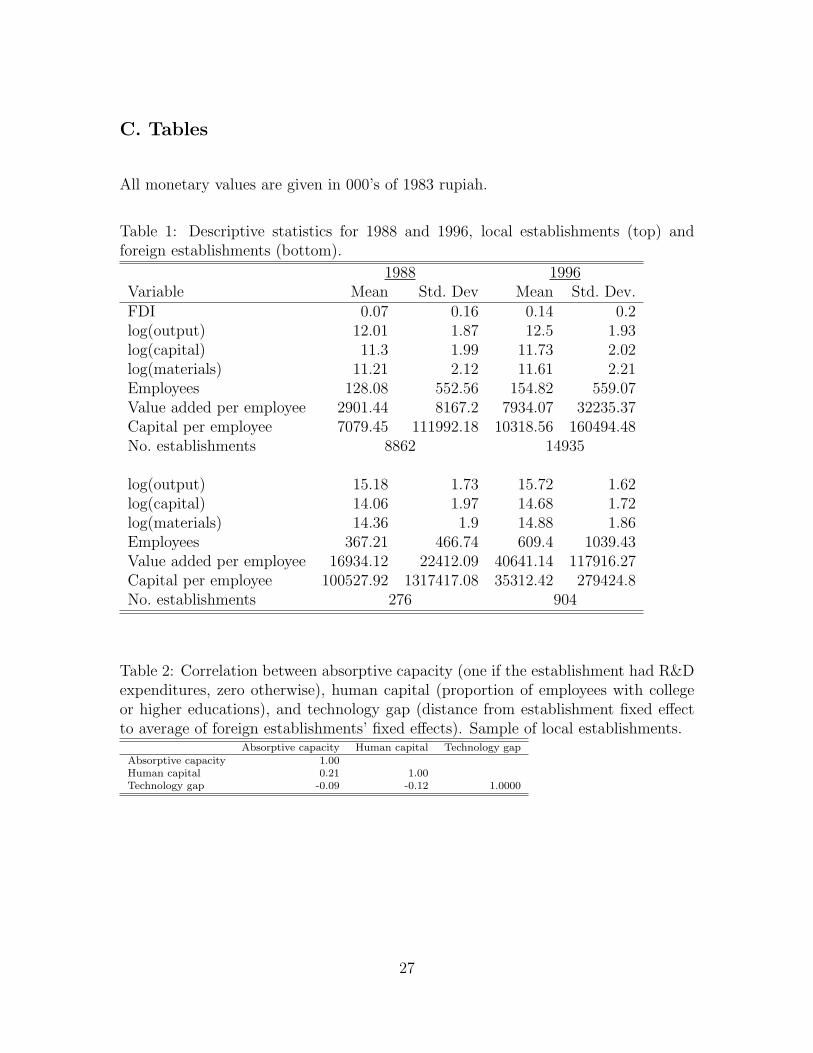
C. Tables
All monetary values are given in 000’s of 1983 rupiah.
Table 1: Descriptive statistics for 1988 and 1996, local establishments (top) andforeign establishments (bottom).
1988 1996Variable Mean Std. Dev Mean Std. Dev.FDI 0.07 0.16 0.14 0.2log(output) 12.01 1.87 12.5 1.93log(capital) 11.3 1.99 11.73 2.02log(materials) 11.21 2.12 11.61 2.21Employees 128.08 552.56 154.82 559.07Value added per employee 2901.44 8167.2 7934.07 32235.37Capital per employee 7079.45 111992.18 10318.56 160494.48No. establishments 8862 14935
log(output) 15.18 1.73 15.72 1.62log(capital) 14.06 1.97 14.68 1.72log(materials) 14.36 1.9 14.88 1.86Employees 367.21 466.74 609.4 1039.43Value added per employee 16934.12 22412.09 40641.14 117916.27Capital per employee 100527.92 1317417.08 35312.42 279424.8No. establishments 276 904
Table 2: Correlation between absorptive capacity (one if the establishment had R&Dexpenditures, zero otherwise), human capital (proportion of employees with collegeor higher educations), and technology gap (distance from establishment fixed effectto average of foreign establishments’ fixed effects). Sample of local establishments.
Absorptive capacity Human capital Technology gapAbsorptive capacity 1.00Human capital 0.21 1.00Technology gap -0.09 -0.12 1.0000
27
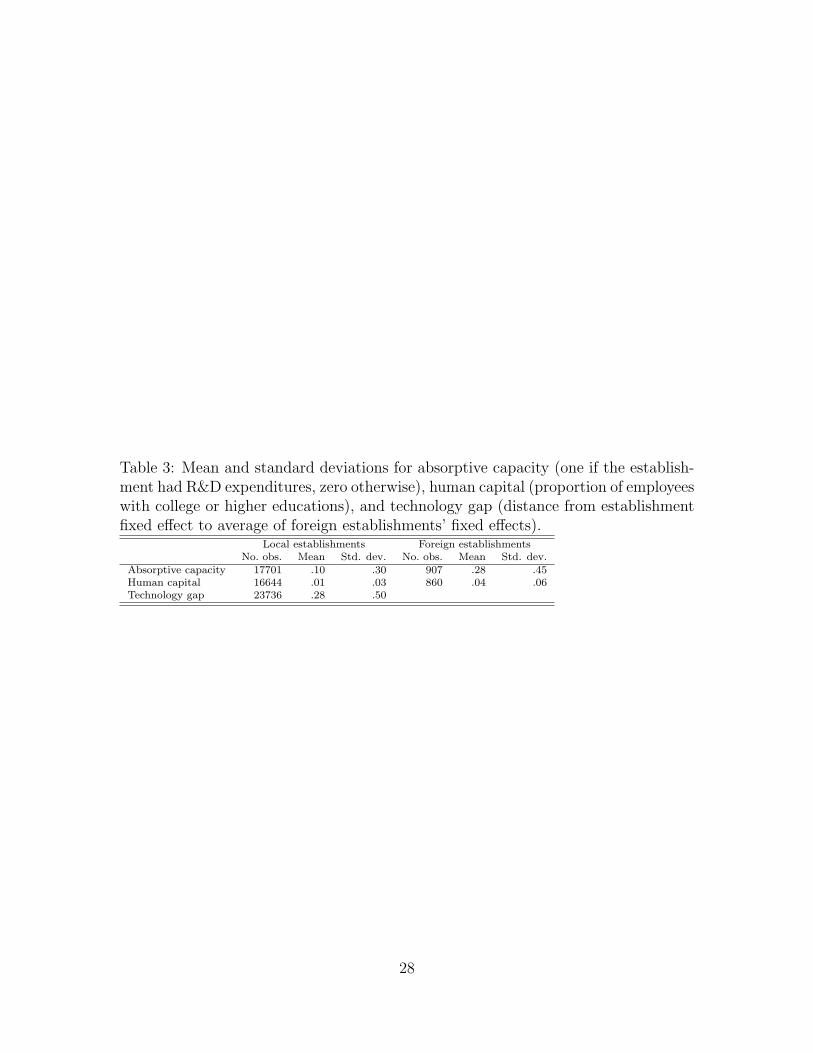
Table 3: Mean and standard deviations for absorptive capacity (one if the establish-ment had R&D expenditures, zero otherwise), human capital (proportion of employeeswith college or higher educations), and technology gap (distance from establishmentfixed effect to average of foreign establishments’ fixed effects).
Local establishments Foreign establishmentsNo. obs. Mean Std. dev. No. obs. Mean Std. dev.
Absorptive capacity 17701 .10 .30 907 .28 .45Human capital 16644 .01 .03 860 .04 .06Technology gap 23736 .28 .50
28
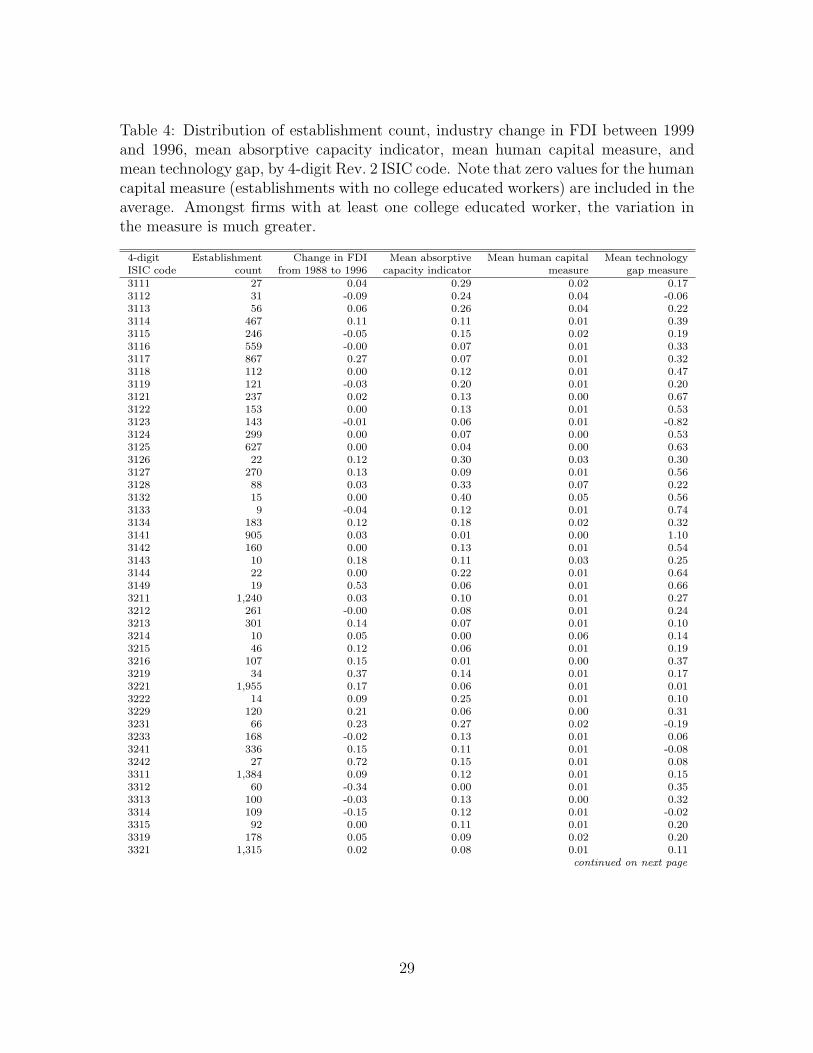
Table 4: Distribution of establishment count, industry change in FDI between 1999and 1996, mean absorptive capacity indicator, mean human capital measure, andmean technology gap, by 4-digit Rev. 2 ISIC code. Note that zero values for the humancapital measure (establishments with no college educated workers) are included in theaverage. Amongst firms with at least one college educated worker, the variation inthe measure is much greater.
4-digit Establishment Change in FDI Mean absorptive Mean human capital Mean technologyISIC code count from 1988 to 1996 capacity indicator measure gap measure3111 27 0.04 0.29 0.02 0.173112 31 -0.09 0.24 0.04 -0.063113 56 0.06 0.26 0.04 0.223114 467 0.11 0.11 0.01 0.393115 246 -0.05 0.15 0.02 0.193116 559 -0.00 0.07 0.01 0.333117 867 0.27 0.07 0.01 0.323118 112 0.00 0.12 0.01 0.473119 121 -0.03 0.20 0.01 0.203121 237 0.02 0.13 0.00 0.673122 153 0.00 0.13 0.01 0.533123 143 -0.01 0.06 0.01 -0.823124 299 0.00 0.07 0.00 0.533125 627 0.00 0.04 0.00 0.633126 22 0.12 0.30 0.03 0.303127 270 0.13 0.09 0.01 0.563128 88 0.03 0.33 0.07 0.223132 15 0.00 0.40 0.05 0.563133 9 -0.04 0.12 0.01 0.743134 183 0.12 0.18 0.02 0.323141 905 0.03 0.01 0.00 1.103142 160 0.00 0.13 0.01 0.543143 10 0.18 0.11 0.03 0.253144 22 0.00 0.22 0.01 0.643149 19 0.53 0.06 0.01 0.663211 1,240 0.03 0.10 0.01 0.273212 261 -0.00 0.08 0.01 0.243213 301 0.14 0.07 0.01 0.103214 10 0.05 0.00 0.06 0.143215 46 0.12 0.06 0.01 0.193216 107 0.15 0.01 0.00 0.373219 34 0.37 0.14 0.01 0.173221 1,955 0.17 0.06 0.01 0.013222 14 0.09 0.25 0.01 0.103229 120 0.21 0.06 0.00 0.313231 66 0.23 0.27 0.02 -0.193233 168 -0.02 0.13 0.01 0.063241 336 0.15 0.11 0.01 -0.083242 27 0.72 0.15 0.01 0.083311 1,384 0.09 0.12 0.01 0.153312 60 -0.34 0.00 0.01 0.353313 100 -0.03 0.13 0.00 0.323314 109 -0.15 0.12 0.01 -0.023315 92 0.00 0.11 0.01 0.203319 178 0.05 0.09 0.02 0.203321 1,315 0.02 0.08 0.01 0.11
continued on next page
29
continued from previous page4-digit Establishment Change in FDI Mean absorptive Mean human capital Mean technologyISIC code count from 1988 to 1996 capacity indicator measure gap measure3322 21 0.22 0.00 0.01 0.073411 112 0.09 0.19 0.03 0.113412 145 0.10 0.07 0.03 0.073419 31 0.32 0.13 0.02 -0.063420 586 0.00 0.11 0.05 0.213511 191 0.16 0.29 0.06 0.153512 43 -0.02 0.24 0.04 0.433513 50 -0.17 0.08 0.05 0.683514 33 0.30 0.26 0.02 0.223521 104 -0.05 0.17 0.04 0.533522 157 -0.09 0.38 0.07 0.273523 127 0.11 0.24 0.03 0.473529 89 0.01 0.36 0.05 0.643541 12 0.13 0.30 0.04 -0.093544 3 -0.59 0.33 0.07 0.083551 56 -0.12 0.07 0.02 0.153552 172 0.08 0.28 0.01 0.323559 128 -0.05 0.21 0.02 0.243560 898 0.07 0.07 0.02 0.103611 67 -0.11 0.27 0.02 0.173621 32 0.10 0.15 0.02 -0.053622 19 0.70 0.06 0.04 0.343631 4 0.09 0.50 0.06 -0.123632 555 -0.06 0.13 0.01 0.583633 133 0.00 0.01 0.00 0.103642 856 0.08 0.04 0.00 0.073691 155 0.00 0.12 0.01 -0.043692 43 0.00 0.15 0.02 0.053693 21 0.03 0.05 0.01 0.293699 56 0.07 0.16 0.02 0.093710 66 -0.06 0.25 0.04 0.253720 47 -0.13 0.13 0.03 -0.023811 212 0.25 0.07 0.01 0.283812 103 0.28 0.14 0.02 0.183813 167 0.17 0.08 0.03 0.223819 372 0.25 0.11 0.02 0.293821 18 0.09 0.18 0.03 0.093822 22 -0.03 0.19 0.04 0.153823 25 0.10 0.13 0.03 0.213824 86 -0.15 0.12 0.03 0.153825 7 0.51 0.25 0.17 0.183829 102 0.15 0.12 0.02 0.233831 75 0.17 0.19 0.05 -0.003832 122 0.36 0.18 0.03 0.043833 21 0.29 0.27 0.04 0.083839 145 -0.04 0.29 0.04 0.013841 93 0.11 0.09 0.03 0.173843 203 0.06 0.18 0.03 0.323844 131 -0.22 0.19 0.01 0.553849 2 0.00 0.50 0.00 0.513851 35 -0.47 0.07 0.02 0.213852 8 0.33 0.20 0.05 0.283853 14 0.83 0.30 0.02 0.163901 94 -0.33 0.17 0.02 0.013902 5 0.07 0.20 0.03 -0.093903 33 0.17 0.04 0.01 0.12
continued on next page
30

continued from previous page4-digit Establishment Change in FDI Mean absorptive Mean human capital Mean technologyISIC code count from 1988 to 1996 capacity indicator measure gap measure3904 85 0.13 0.17 0.01 0.103905 39 0.19 0.16 0.02 -0.083906 40 0.18 0.09 0.01 0.133909 105 0.36 0.06 0.02 0.14
31
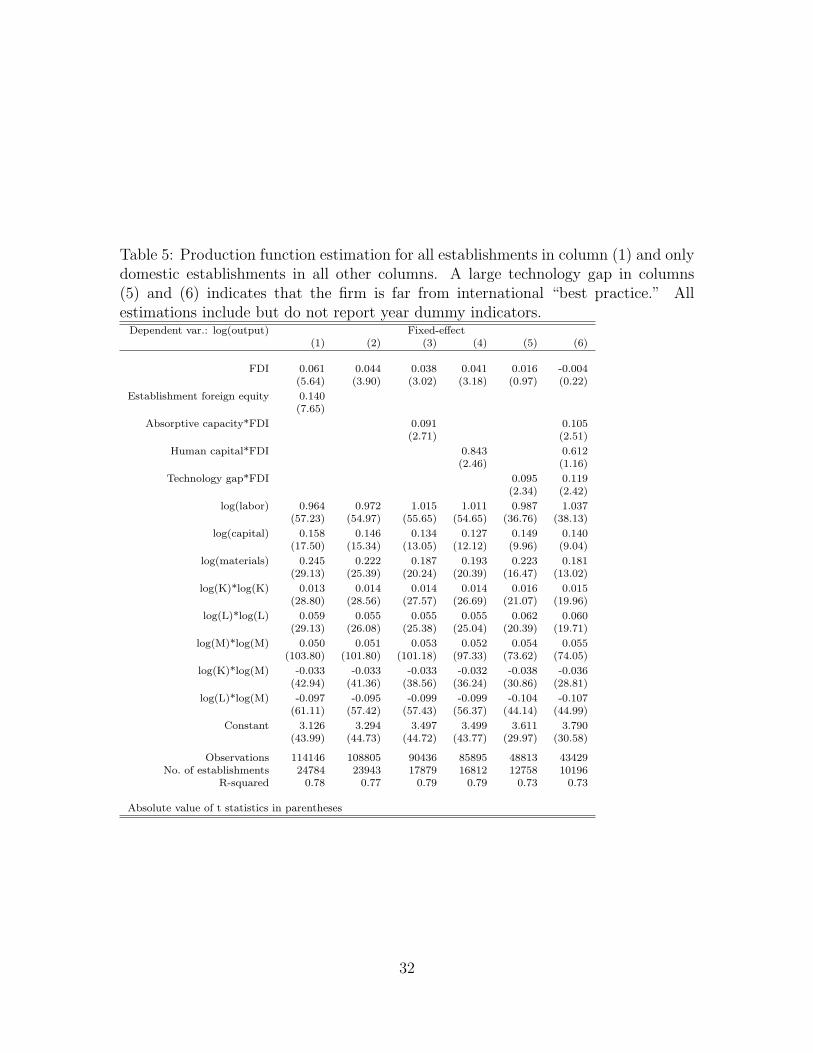
Table 5: Production function estimation for all establishments in column (1) and onlydomestic establishments in all other columns. A large technology gap in columns(5) and (6) indicates that the firm is far from international “best practice.” Allestimations include but do not report year dummy indicators.
Dependent var.: log(output) Fixed-effect(1) (2) (3) (4) (5) (6)
FDI 0.061 0.044 0.038 0.041 0.016 -0.004(5.64) (3.90) (3.02) (3.18) (0.97) (0.22)
Establishment foreign equity 0.140(7.65)
Absorptive capacity*FDI 0.091 0.105(2.71) (2.51)
Human capital*FDI 0.843 0.612(2.46) (1.16)
Technology gap*FDI 0.095 0.119(2.34) (2.42)
log(labor) 0.964 0.972 1.015 1.011 0.987 1.037(57.23) (54.97) (55.65) (54.65) (36.76) (38.13)
log(capital) 0.158 0.146 0.134 0.127 0.149 0.140(17.50) (15.34) (13.05) (12.12) (9.96) (9.04)
log(materials) 0.245 0.222 0.187 0.193 0.223 0.181(29.13) (25.39) (20.24) (20.39) (16.47) (13.02)
log(K)*log(K) 0.013 0.014 0.014 0.014 0.016 0.015(28.80) (28.56) (27.57) (26.69) (21.07) (19.96)
log(L)*log(L) 0.059 0.055 0.055 0.055 0.062 0.060(29.13) (26.08) (25.38) (25.04) (20.39) (19.71)
log(M)*log(M) 0.050 0.051 0.053 0.052 0.054 0.055(103.80) (101.80) (101.18) (97.33) (73.62) (74.05)
log(K)*log(M) -0.033 -0.033 -0.033 -0.032 -0.038 -0.036(42.94) (41.36) (38.56) (36.24) (30.86) (28.81)
log(L)*log(M) -0.097 -0.095 -0.099 -0.099 -0.104 -0.107(61.11) (57.42) (57.43) (56.37) (44.14) (44.99)
Constant 3.126 3.294 3.497 3.499 3.611 3.790(43.99) (44.73) (44.72) (43.77) (29.97) (30.58)
Observations 114146 108805 90436 85895 48813 43429No. of establishments 24784 23943 17879 16812 12758 10196
R-squared 0.78 0.77 0.79 0.79 0.73 0.73
Absolute value of t statistics in parentheses
32
D. Figures
���
�
�
���������
�
Figure 1: Value added by foreign firms in manufacturing, 1996, by province.
33
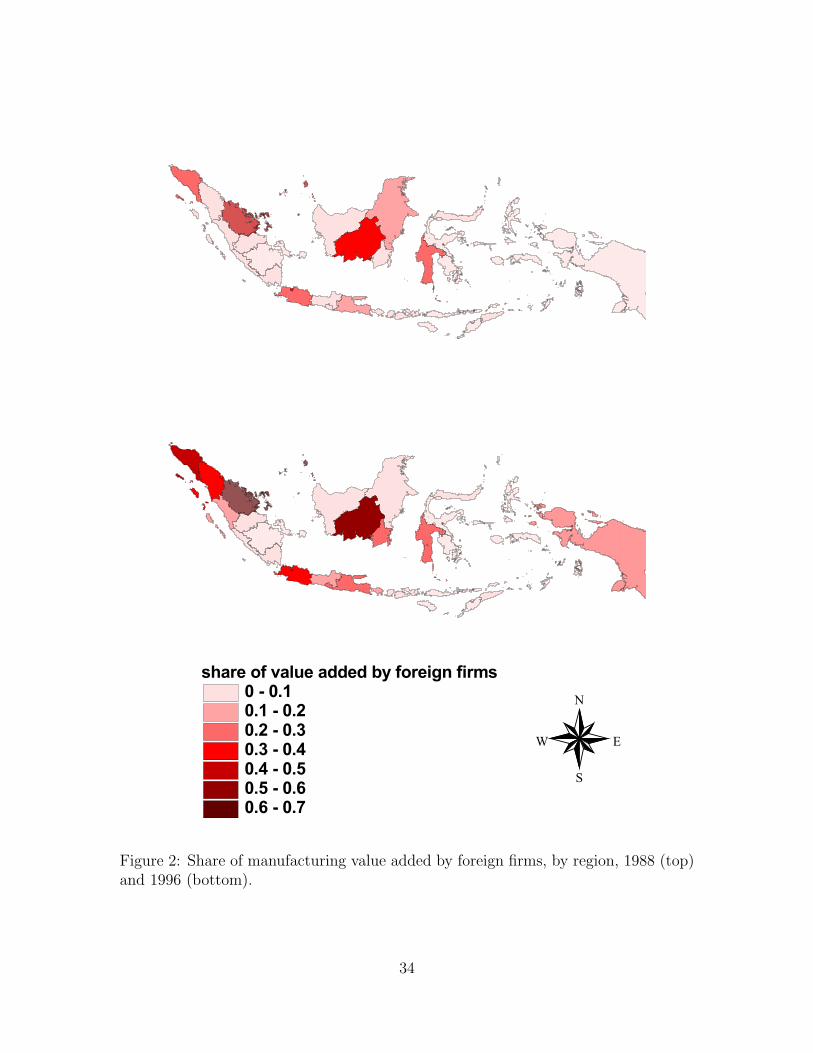
Figure 2: Share of manufacturing value added by foreign firms, by region, 1988 (top)and 1996 (bottom).
34