service quality improvement capabilities impacting …sure.sunderland.ac.uk/5887/1/firm...
TRANSCRIPT
1
Service quality improvement capabilities impacting Firms’ competitiveness
in the Nigerian Financial Industry – from customers’ perspective
Oghenetega Origho PhD Researcher, Sunderland Business School, Faculty of Business and Law, University of Sunderland, Reg Vardy Centre,
St Peter’s Way, Tyne and Wear, Sunderland, SR6 0DD, UK. Tel: +44(0)1915152300, Mob: +44(0)7411762367,
Fax: +44(0)1915152308, Email: [email protected]
Dr. Augustus E. Osseo-Asare Senior Lecturer, Sunderland Business School, Faculty of Business and Law, University of Sunderland, Reg Vardy Centre,
St Peter’s Way, Tyne and Wear, Sunderland, SR6 0DD, UK. Tel: +44(0)1915152347, Fax: +44(0)1915152308,
Email: [email protected]
Dr. Seema Bhate Senior Lecturer, Sunderland Business School, Faculty of Business and Law, University of Sunderland, Reg Vardy Centre,
St Peter’s Way, Tyne and Wear, Sunderland, SR6 0DD, UK. Tel: +44(0)1915153138, Fax: +44(0)1915152308,
Email: [email protected]
Michael E. Ifeanyi PhD Researcher, Sunderland Business School, Faculty of Business and Law, University of Sunderland, Reg Vardy Centre,
St Peter’s Way, Tyne and Wear, Sunderland, SR6 0DD, UK. Tel: +44(0)1915152300, Mob: +44(0)7554434360, Fax: +44(0)1915152308, Email: [email protected]
Abstract
Despite the fact that Nigeria in recent years is considered to be one of the fastest growing
economies in Africa, the country still faces major challenges as a direct result of the activities
of firms in the financial services industry. Prior studies on financial service quality
improvement reveal a significant gap in the way financial service quality is perceived by
customers in Nigeria, coupled with the lack of understanding of the centrality of service
quality in the development of a firm’s dynamic capabilities. This paper investigates the
impact of socio-cultural factors on Nigerian customers’ perceptions of financial service
quality using a Questionnaire Survey of 774 respondents. Factor analysis and Structural
equation modelling (SEM) led to the development of a holistic framework comprising of six
components for improving the Nigerian financial service quality: digital technology, internal
processes, low-cost leadership, streamlining financial service portfolio, communication
frequency and staff inter-personal communication skills in the Nigerian context. The major
limitation of this study relates to the fact that it focuses only on customers’ perspectives; as
such, further studies would use a mix of Questionnaires and In-depth Interviews on a wider
range of stakeholders in Nigeria.
Keywords: Firm competitiveness; financial service quality improvement capabilities;
Nigeria.
2
Introduction
The pursuit of profit growth by multinational corporations (MNCs) has always been an
intellectually stimulating area of study within the field of International business (IB) research
– although some continue to question the practical applicability of IB research in today’s fast
changing and dynamic 21st Century global business environment. This paper contributes to
the debate on the practical relevance of IB research by using examples from MNCs operating
in the financial services industry in Nigeria. Since the onset of the 21st Century MNCs
continue to face challenges emanating mainly from the recent global financial crisis coupled
with the fast changing socio-cultural, economic and technological environment prevailing in
both developed and developing economies (Porter & Heppelmann, 2014). These challenges
pose serious threats to the ability of MNCs to formulate and implement policies and strategies
for survival and growth in both their home and host countries. This paper focuses on the
impact of socio-cultural environment on firms’ competitiveness from customers’ perceptions
of service quality using examples of MNCs operating in the Nigerian financial services
industry.
The main theoretical framework for our study is underpinned by both traditional and
contemporary views on how to achieve and sustain competitive advantage. The general view
is that competitive advantage is sustainable if a firm is able to renew its dynamic capabilities
over time by harnessing its resources through innovation (Wernerfelt, 1984; Barney &
Hesterly, 2012). Prior studies reveal a significant gap in the way financial service quality is
perceived by customers, coupled with the lack of deeper understanding of the centrality of
service quality in the development of a firm’s dynamic capabilities for achieving and
sustaining competitiveness within a fast changing 21st Century global financial services
industry. This paper therefore focuses on dynamic capabilities based on service quality
improvement as a key driver for sustaining competitive advantage. In this context this paper
3
uses examples form High Street Banks operating in the financial services sector of the
Nigerian economy.
The remaining part of the paper is divided into five sections. The first section provides a
critical review of existing literature on firms’ competitiveness, followed by a critique of the
market-based and resource-based approaches to achieving and sustaining competitive
advantage. The second section provides justification for choice of research design and
methods for achieving the research objectives and to answer the key research question i.e. do
service-quality-driven dynamic capabilities enhance firm competitiveness in the Nigerian
Financial Industry? The third section deals with data presentation and analysis. The fourth
section discusses the results and findings in light of contemporary understanding of the
impact of financial service quality on firm competitiveness. The final section concludes and
offers recommendations, followed by a discussion of the major limitations of the study and
an outline of key areas for further research.
Literature review
Since the onset of the 21st Century, global financial institutions in particular those in the
commercial banking sector, continue to face challenges as a direct result of the recent
financial crisis, coupled with the rapid advances in information and communications
technologies. In this context, the need to internationalize firms’ operations in pursuit of
profitability in a fast changing and dynamic global business environment has become a
topical area of IB research. This raises attendant issues of lack of trust, confidentiality,
internet fraud, misuse of customer data, customer safety, social responsibility, and the high
bonuses been paid to top executives of high street banks. These issues in part also accounts
for the high levels of dissatisfaction amongst customers in both developed and developing
economies, and seek to undermine the sustainability of the competitive advantages of MNCs,
4
with serious implications for financial service quality improvement activities. In the
following sections we critically review existing literature on the nature of firm
competitiveness within the financial services industry, focusing on existing models for
improving financial service quality.
The nature of firms’ competitive advantages focusing on the financial services industry
Competitive advantage is a condition that makes a firm more competitive than others, and by
so doing helps sustain its profitability (Porter, 2008). It therefore requires firms to develop the
ability to meet the needs and exceed customers’ expectations through value innovation in
relation to service quality performance (West, Ford & Ibrahim, 2010). This notion of
competitive advantage suggests there is a positive correlation between innovative value
creation and higher customer satisfaction. The fact that in practice this association is difficult
to achieve and sustain underpins the rationale for this study. This raises fundamental
questions in IB research relating to the nature of firms and why they exist, which has
undoubtedly led to various theories of how to increase the chances of customers choosing a
particular service offer over those of rivals. Some researchers argue that firms do not exist
because of the market failures, but because of their ability to develop internal resources such
as knowledge, culture and human capital that the market can neither copy, access nor destroy
(Barney, 1991; Grant, 1991). From a historical perspective, during the periods where one
company supplied a particular service or good the need for competitive advantage was
minimal because there was little or no competition and therefore customers had no
'bargaining power' or choice but had to pay the price imposed by the firm for the service.
Today, the situation is so different, because to provide a service, a firm needs to recruit staff,
train them, source for the cheapest way of getting resources (capital, material and human),
ensure these resources are delivered on-time, create as much of the high quality services or
goods ready to be sold to customers each time, ensure standardisation of the service in order
5
that the service received by the customer last month will be the same level if that customer
chooses to re-purchase the service today, and all this against the limited capital and scarce
resources.
Four key theories can be used to explain the concept of competitive advantage: market-based
view (MBV), resource-based view (RBV) theory, dynamic capability theories, and non-
competition or blue-ocean theory. Each theory seeks to explain how customer value can be
created e.g. the blue-ocean theory is based on non-competitive factors, whilst MBV, RBV
and dynamic capability theories have their foundations in economics. For example, MBV has
its roots in the Chamberlin economic theory; RBV is based on the Ricardian economic theory
while the dynamic capability view is from the Schumpeterian economic theory.
MBV exploits monopoly rents as levers for sustaining competitive advantage in a particular
market (Treacy & Wiersema, 1995). It is therefore based on the argument that positioning a
firm within a particular market ensures competitive advantage because of the returns to
market power. In contrast, the proponents of Ricardian theory argued that competitive
advantage is both achievable and sustainable if a firm fully harnesses the firm-specific
resources it controls (Wernerfelt, 1984; Barney & Hesterly, 2012). There are those who do
not prescribe to either MBV or RBV and have adopted a dynamic capability which advocates
that competitive advantage is only sustained by a firm’s dynamic capability to renew
advantages over time (Winter, 2000; Teece, Pisano & Shuen, 1997). For example,
Schumpeter (1950) presents competition beyond merely setting prices and quantities as a
means of gaining competitive advantage, by postulating a process of novelty generation or
innovation as basis for sustaining competitive advantage. It is important to note that unlike
MBV and RBV, the dynamic capability view places more emphasis on the real avenues for
exploiting competition - this means, a firm is able to compete more effectively if it is able to
6
innovate by introducing new practices and/or copying best practices of rivals to help generate
new routines. Therefore, it is the firms with superior business processes that profit while
those with inferior business processes lose out.
A key proponents of the dynamic capabilities view including Prahalad and Hamel (1994)
posit that the source of true competitive advantage lies in management’s ability to create
competences e.g. knowledge, capability and attitude application of technology. These
competences would enable the corporation adapt quickly to emerging opportunities through
creation of innovative products difficult to imitate, with irresistible functionality that
customers need but have not yet imagined (De Wit & Meyer, 2014).
In brief, while Ricardian, Chamberlin and Schumpeterian ideologies see competition as ‘cut-
throat’ where firms actively attempt to ‘crush’ their rivals, the Schumpeterian theories
advocate achieving this by concentrating on firms’ identity and using new technologies both
from in-house and from rivals; and forming strategic alliances to improve business processes
– of which service quality improvement processes are an important part. Doing these builds
firm’s competences focused on creating customer value through innovation rather than
competing for them as a source of competitive advantage – this is particularly important in
today’s global financial services industry with its fast changing customer needs and
expectations. By contrast, proponents of non-competition advocate firms just producing
goods to the best of their ability but not driven to crush rivals (Kim & Mauborgne, 2014).
They opine that customers will generally patronise goods that satisfy their needs and since
many companies currently produce similar goods, there is no need for cut-throat competition.
The different arguments for and against competition raise fundamental issues about the
applicability of both the competition-based and non-competition-based theories of
competitive advantage in developed and developing countries. In response to these issues, we
7
recognise the fact that unlike in developing countries, both these arguments may be valid in
developed countries because the levels of service are relatively standardized. Based on the
inherent doubt about the general applicability of these theories in developing economies
particularly, those in Sub-Sahara Africa e.g. Nigeria and Ghana, we therefore hypothesise
that:
H0: theories of competition as used in developed countries do not help sustain the
competitive advantages of firms in the Nigerian financial service industry
This hypothesis is further developed in the next section which explores the applicability of
Western theories of competition in different cultural settings. In particular, we look at how the
notion of service quality drives the capabilities of organisations.
The applicability of Western models of Service quality in the Nigerian Financial Services
Industry
Service quality is the extent to which the value created by a firm meets or exceeds customers
expectation i.e. the ratio of customers expectation to their perception of the actual service
received (Parasuraman, Zeithel & Berry, 1988). The fact that a firm is able to achieve and
sustain competitive advantage by developing its dynamic capabilities through continuous
service quality improvement has necessitated the need to improve business processes for
improving service quality, which requires an understanding of what customers need and
expect from a service. As such, regular survey of customer satisfaction is fundamental to
meeting their needs and exceeding their expectations. It is generally accepted in both
developed and developing countries that customers are better aware of service standards
within a particular industry and thus will naturally seek MNCs that can provide those
standards (Frei, 2008). There is however doubt as to MNCs ability to replicate the high
service standards in their home-base across borders. This is possibly due to the differences in
socio-cultural elements in both host and home countries which determine perceptions of
8
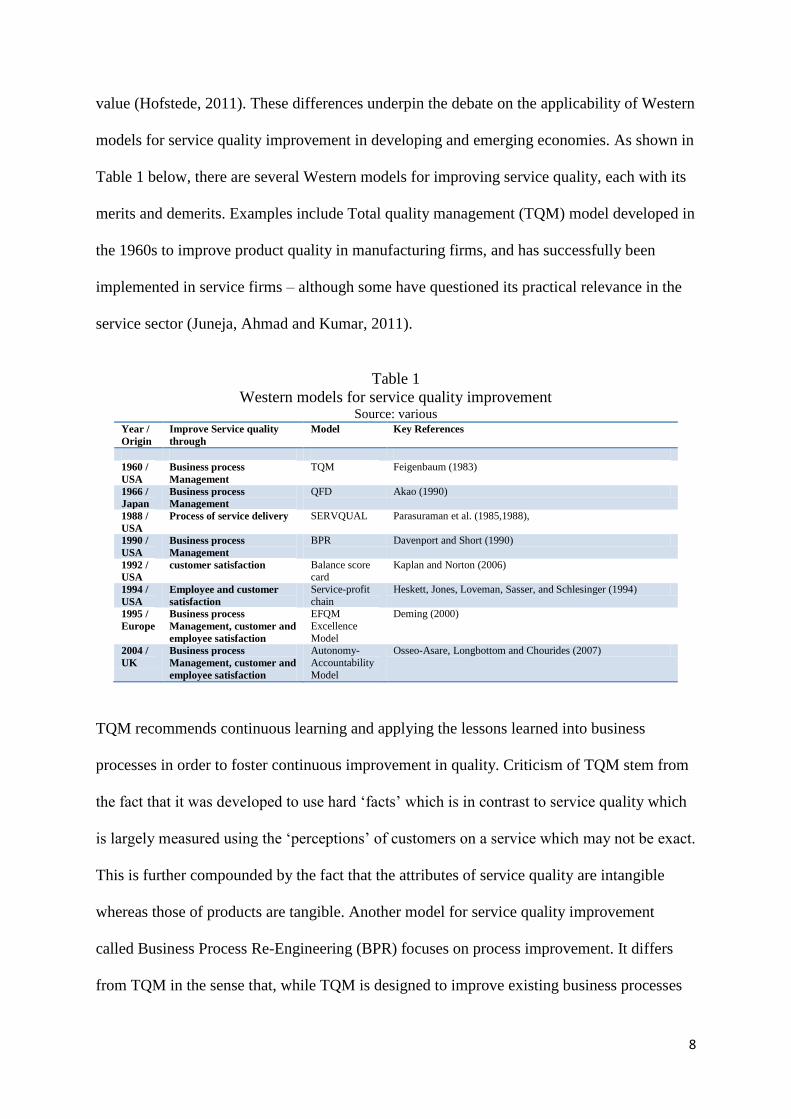
value (Hofstede, 2011). These differences underpin the debate on the applicability of Western
models for service quality improvement in developing and emerging economies. As shown in
Table 1 below, there are several Western models for improving service quality, each with its
merits and demerits. Examples include Total quality management (TQM) model developed in
the 1960s to improve product quality in manufacturing firms, and has successfully been
implemented in service firms – although some have questioned its practical relevance in the
service sector (Juneja, Ahmad and Kumar, 2011).
Table 1
Western models for service quality improvement Source: various
Year /
Origin
Improve Service quality
through
Model
Key References
1960 /
USA
Business process
Management
TQM Feigenbaum (1983)
1966 /
Japan
Business process
Management
QFD Akao (1990)
1988 /
USA
Process of service delivery SERVQUAL Parasuraman et al. (1985,1988),
1990 /
USA
Business process
Management
BPR Davenport and Short (1990)
1992 /
USA
customer satisfaction Balance score card
Kaplan and Norton (2006)
1994 /
USA
Employee and customer
satisfaction
Service-profit
chain
Heskett, Jones, Loveman, Sasser, and Schlesinger (1994)
1995 /
Europe
Business process
Management, customer and
employee satisfaction
EFQM
Excellence
Model
Deming (2000)
2004 /
UK
Business process
Management, customer and
employee satisfaction
Autonomy-
Accountability
Model
Osseo-Asare, Longbottom and Chourides (2007)
TQM recommends continuous learning and applying the lessons learned into business
processes in order to foster continuous improvement in quality. Criticism of TQM stem from
the fact that it was developed to use hard ‘facts’ which is in contrast to service quality which
is largely measured using the ‘perceptions’ of customers on a service which may not be exact.
This is further compounded by the fact that the attributes of service quality are intangible
whereas those of products are tangible. Another model for service quality improvement
called Business Process Re-Engineering (BPR) focuses on process improvement. It differs
from TQM in the sense that, while TQM is designed to improve existing business processes

9
incrementally, BPR on the other hand is geared at transforming business processes
(Davenport & Short, 1990). Also there is the ‘service-profit-chain’ model by Haskett et al.
(1994), which is based on the assumption that ‘profitability’ and ‘customer loyalty’ are
positively correlated. It asserts that customer loyalty is a product of customer satisfaction
which in turn is determined by value of the service provided. This view has come under
rigorous criticism by researchers who question the validity of the simple linear co-
relationships cited between the variables in the service-profit chain model (Anderson &
Mittal, 2000; Silvestro & Cross 2000; Vilares & Coehlo, 2003). In addition there is the
Quality function Deployment (QFD) model developed in 1966 based on TQM concepts for
measuring service quality (Juneja, Ahmad and Kumar, 2011; Akao, 1990). It is a systematic
approach to service quality management which requires acute awareness of customers’ needs
and expectations, and entails the translation of customer wants into design characteristics for
each stage of the product development thereby ensuring quality and customer satisfaction is
the end product. Furthermore, the SERVQUAL model by Parasuraman et al. (1988) in the
USA, identifies gaps in customers’ expectation and customers’ perception of the service
being offered, for a set of five critical success factors, namely, reliability, assurance,
tangibility, empathy and responsiveness. They therefore conclude that closing these gaps – at
least as far as Western societies are concerned - will improve service quality. This conclusion
however raises questions about the ability of MNCs to successfully replicate these Western
models in different socio-cultural settings (Hofstede, 2011), which form the basis for our
earlier hypothesis (H0). As a result we argue that there are 6 key sources of firm’s
competitive advantage which can be linked to H0; we therefore make the following
propositions:
H0.1: improved customer communication capabilities do not improve customer service quality
levels.

10
H0.2: improved internal processes for enhancing customer trust do not improve customer
service quality levels.
H0.3: increased investments in new financial services do not improve customer service quality
levels.
H0.4: enhanced staff inter-personal skills do not improve customer service quality levels.
H0.5: lowering the costs of operational activities do not improve customer service quality
levels.
H0.6: increased alliances in exploiting digital technology do not improve customer service
quality levels.
To operationalize the seven hypotheses, we use the conceptual framework in Figure 1; which
shows the linkage between dynamic capabilities in service quality improvement and firm
competitiveness. For example, developing dynamic capabilities in six key service quality
improvement areas: customer communications (H0.1), strategic decision making processes
(H0.2), investment in new financial services (H0.3), inter-personal skills (H0.4), low-cost
strategies (H0.5), and building alliances (H0.6) may or may not improve customer service
quality and firm competitiveness in the Nigerian financial services industry context.
Figure 1
The link between Service Quality, dynamic capabilities and Firm competitiveness Source: Kendall (2010), Teece (2011)
(H0.1), Customer relationship and
Communication strategies
(H0.6), Alliances in Digital
Technologies and Customer Security
(H0.5), Low-cost strategies and Timely
response to customers
(H0.2), Strategic decision-making and
Customer Loyalty
(H0.3), Investment in new financial
services and Customer choice
(H0.4), Inter-personal skills and
Customers’ Intrinsic Values
Service
quality driven
Dynamic
capabilities
Critical Success
Factors (CSFs):
Communications;
Retention;
Innovation; People;
Processes;
Digitalization
Improved Customer Service
Quality & Firm Competitiveness
Key Performance Results:
Corporate Profitability;
Corporate Social
Responsibility
11
This paper investigates the nature of the relationship between the variables in the above
hypotheses as basis for developing a holistic framework that is more applicable for
developing capabilities in service quality improvement in the Nigerian financial services
industry. The next section provides justification for the choice of research design and
methods.
Research methodology:
The study uses a Questionnaire design to survey the perceptions of 774 Nigerian Commercial
Bank customers of defined demographic characteristics, namely, gender, age, marital status,
level of education, and employment. For the purpose of ethical considerations the identities
of the Commercial Banks have been anonymised (Vavra, 1997; Hernon & Nitecki, 2001).
The next section explains the process of recruiting and sampling participants, followed by the
design and administration of the questionnaire used for the study.
Recruitment and sampling of participants
Out of the total of 20 Nigerian Commercial Banks contacted informally via email and
telephone, 10 banks formally agreed to participate in the study. The participating banks are
located in five commercial cities, namely, Lagos, in Lagos State, Warri, in Delta State, Port
Harcourt, in River State, Benin, in Edo State and Abuja, which is the Federal Capital of
Nigeria. With the assistance of our main contacts within the five commercial cities, a total of
1,300 questionnaires were administered by hand to customers in the banking hall between
April and September 2014. Out of the total of 1,300 questionnaires administered, 822
questionnaires were returned; of which, 774 were successfully completed i.e. a response rate
of about 63% (Hernon & Nitecki, 2001). For ethical reasons only willing customers were
asked to complete the questionnaires in the banking premises – although some customers
choose to complete the questionnaire at home and later returned it to the bank.
12
Descriptive statistics on participants’ demographic characteristics
The descriptive statistics relating to ‘gender’, ‘age’, ‘education’, ‘employment’ and ‘marital
status’ reveal the following results:
Gender: 53.4% representing 413 respondents were female and 45.7% representing
354 respondents were male. The remaining 0.9% respondents did not wish to disclose
their gender.
Age: 66.4% representing 514 respondents were aged between 20 to 40 years, 17.3%
representing 134 respondents were aged between 40-65 years, 8.5% respondents
were below 20 years of age, and 7.8% respondents were above 65 years old.
Education: 82.6% representing 639 respondents were college or university leavers,
6.6% respondents were primary school leavers, 10.9% respondents were secondary
school leavers, and.
Employment: 35.9% representing 278 respondents were unemployed or students,
34.9% representing 270 respondents were employed, 22.1% respondents were self-
employed, and 7.1% did not wish to disclose their employment status.
Marital status: 47% representing 364 respondents were single, 47% representing
364 respondents were married, and 5.9% respondents did not wish to disclose.
For each of the demographic characteristics, the reliability tests using Cronbach alpha give a
value within the acceptable range of 0.750 to 0.751.
Questionnaire design
A two part questionnaire was used in the study, Part A, captures the demographic
characteristics of customers e.g. age, gender, marital status, employment status and
educational level. It uses a 5-point Likert-scale, where, ‘1’ indicates ‘strongly disagree’, ‘2’
for ‘disagree’, ‘3’ for ‘neither agree nor disagree’, ‘4’ for ‘agree’ and ‘5’ for ‘strongly’ agree.
Part B is based on the pre-selected themes relating to the above hypotheses; and is designed
to capture data on how customers’ socio-cultural values impact on their perceptions of
financial services offered by the Nigerian Commercial banks which participated in the study.
13
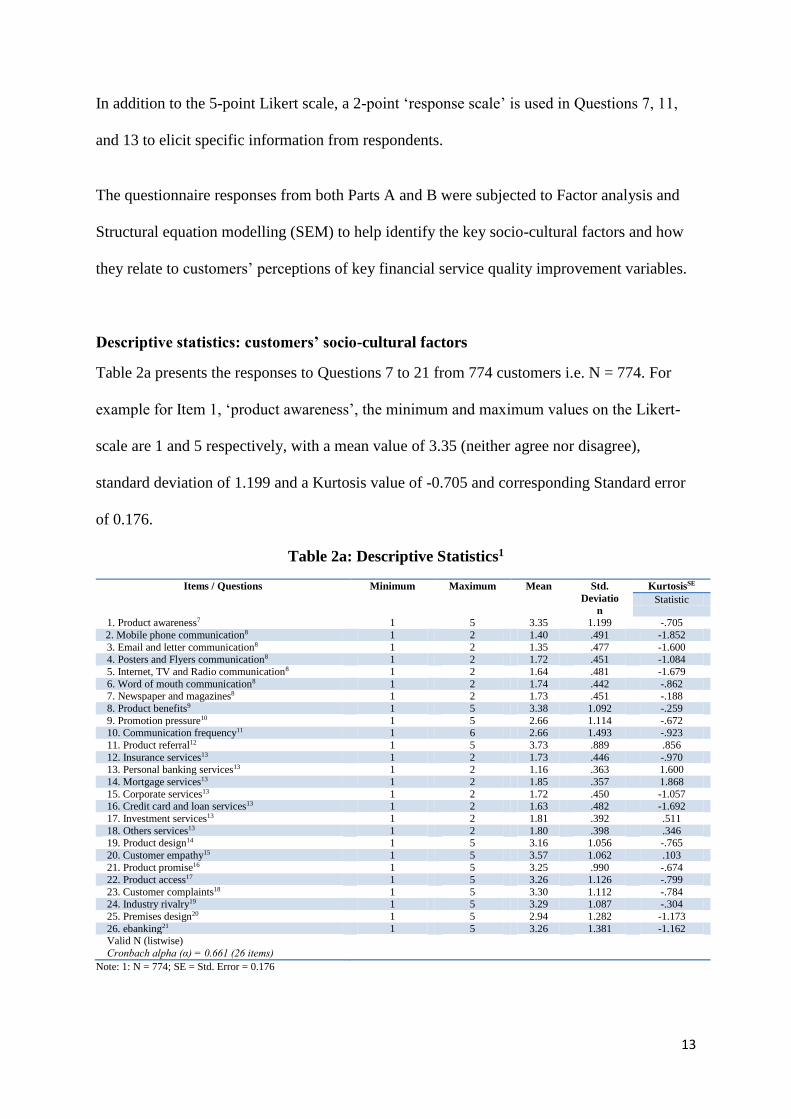
In addition to the 5-point Likert scale, a 2-point ‘response scale’ is used in Questions 7, 11,
and 13 to elicit specific information from respondents.
The questionnaire responses from both Parts A and B were subjected to Factor analysis and
Structural equation modelling (SEM) to help identify the key socio-cultural factors and how
they relate to customers’ perceptions of key financial service quality improvement variables.
Descriptive statistics: customers’ socio-cultural factors
Table 2a presents the responses to Questions 7 to 21 from 774 customers i.e. N = 774. For
example for Item 1, ‘product awareness’, the minimum and maximum values on the Likert-
scale are 1 and 5 respectively, with a mean value of 3.35 (neither agree nor disagree),
standard deviation of 1.199 and a Kurtosis value of -0.705 and corresponding Standard error
of 0.176.
Table 2a: Descriptive Statistics1
Note: 1: N = 774; SE = Std. Error = 0.176
Items / Questions Minimum Maximum Mean Std.
Deviatio
n
KurtosisSE
Statistic
1. Product awareness7 1 5 3.35 1.199 -.705
2. Mobile phone communication8 1 2 1.40 .491 -1.852
3. Email and letter communication8 1 2 1.35 .477 -1.600 4. Posters and Flyers communication8 1 2 1.72 .451 -1.084
5. Internet, TV and Radio communication8 1 2 1.64 .481 -1.679
6. Word of mouth communication8 1 2 1.74 .442 -.862 7. Newspaper and magazines8 1 2 1.73 .451 -.188
8. Product benefits9 1 5 3.38 1.092 -.259
9. Promotion pressure10 1 5 2.66 1.114 -.672 10. Communication frequency11 1 6 2.66 1.493 -.923
11. Product referral12 1 5 3.73 .889 .856
12. Insurance services13 1 2 1.73 .446 -.970 13. Personal banking services13 1 2 1.16 .363 1.600
14. Mortgage services13 1 2 1.85 .357 1.868
15. Corporate services13 1 2 1.72 .450 -1.057 16. Credit card and loan services13 1 2 1.63 .482 -1.692
17. Investment services13 1 2 1.81 .392 .511
18. Others services13 1 2 1.80 .398 .346 19. Product design14 1 5 3.16 1.056 -.765
20. Customer empathy15 1 5 3.57 1.062 .103
21. Product promise16 1 5 3.25 .990 -.674
22. Product access17 1 5 3.26 1.126 -.799
23. Customer complaints18 1 5 3.30 1.112 -.784 24. Industry rivalry19 1 5 3.29 1.087 -.304
25. Premises design20 1 5 2.94 1.282 -1.173
26. ebanking21 1 5 3.26 1.381 -1.162 Valid N (listwise)
Cronbach alpha (α) = 0.661 (26 items)
14
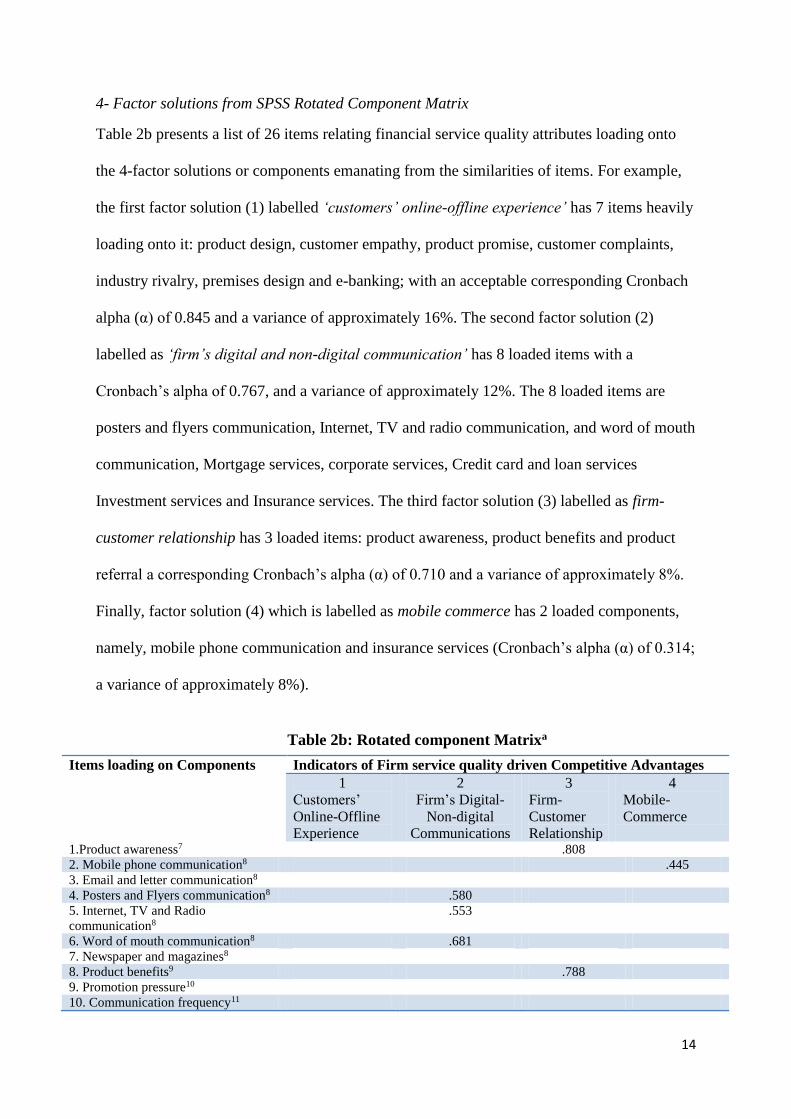
4- Factor solutions from SPSS Rotated Component Matrix
Table 2b presents a list of 26 items relating financial service quality attributes loading onto
the 4-factor solutions or components emanating from the similarities of items. For example,
the first factor solution (1) labelled ‘customers’ online-offline experience’ has 7 items heavily
loading onto it: product design, customer empathy, product promise, customer complaints,
industry rivalry, premises design and e-banking; with an acceptable corresponding Cronbach
alpha (α) of 0.845 and a variance of approximately 16%. The second factor solution (2)
labelled as ‘firm’s digital and non-digital communication’ has 8 loaded items with a
Cronbach’s alpha of 0.767, and a variance of approximately 12%. The 8 loaded items are
posters and flyers communication, Internet, TV and radio communication, and word of mouth
communication, Mortgage services, corporate services, Credit card and loan services
Investment services and Insurance services. The third factor solution (3) labelled as firm-
customer relationship has 3 loaded items: product awareness, product benefits and product
referral a corresponding Cronbach’s alpha (α) of 0.710 and a variance of approximately 8%.
Finally, factor solution (4) which is labelled as mobile commerce has 2 loaded components,
namely, mobile phone communication and insurance services (Cronbach’s alpha (α) of 0.314;
a variance of approximately 8%).
Table 2b: Rotated component Matrixa
Items loading on Components Indicators of Firm service quality driven Competitive Advantages
1
Customers’
Online-Offline
Experience
2
Firm’s Digital-
Non-digital
Communications
3
Firm-
Customer
Relationship
4
Mobile-
Commerce
1.Product awareness7 .808
2. Mobile phone communication8 .445
3. Email and letter communication8
4. Posters and Flyers communication8 .580
5. Internet, TV and Radio
communication8
.553
6. Word of mouth communication8 .681
7. Newspaper and magazines8
8. Product benefits9 .788
9. Promotion pressure10
10. Communication frequency11
15
Extraction Method: Principal Component Analysis.
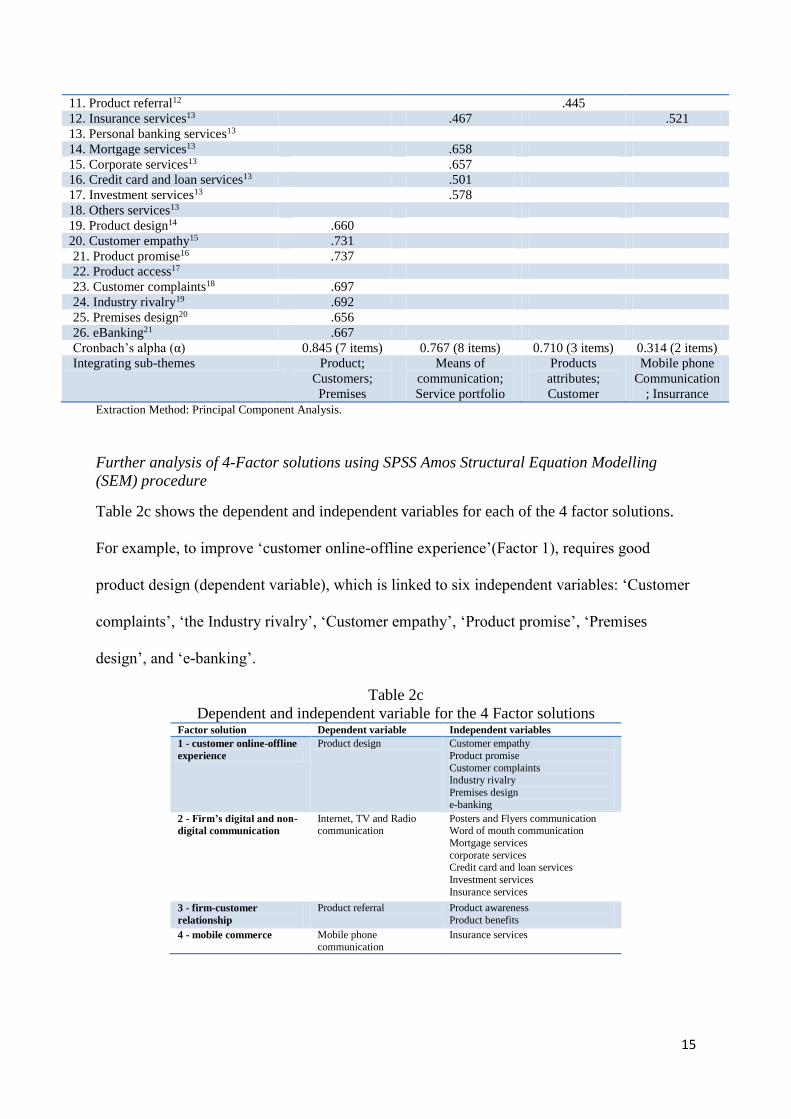
Further analysis of 4-Factor solutions using SPSS Amos Structural Equation Modelling
(SEM) procedure
Table 2c shows the dependent and independent variables for each of the 4 factor solutions.
For example, to improve ‘customer online-offline experience’(Factor 1), requires good
product design (dependent variable), which is linked to six independent variables: ‘Customer
complaints’, ‘the Industry rivalry’, ‘Customer empathy’, ‘Product promise’, ‘Premises
design’, and ‘e-banking’.
Table 2c
Dependent and independent variable for the 4 Factor solutions Factor solution Dependent variable Independent variables
1 - customer online-offline
experience
Product design Customer empathy
Product promise
Customer complaints Industry rivalry
Premises design
e-banking
2 - Firm’s digital and non-
digital communication
Internet, TV and Radio communication
Posters and Flyers communication Word of mouth communication
Mortgage services
corporate services Credit card and loan services
Investment services
Insurance services
3 - firm-customer
relationship
Product referral Product awareness
Product benefits
4 - mobile commerce Mobile phone communication
Insurance services
11. Product referral12 .445
12. Insurance services13 .467 .521
13. Personal banking services13
14. Mortgage services13 .658
15. Corporate services13 .657
16. Credit card and loan services13 .501
17. Investment services13 .578
18. Others services13
19. Product design14 .660
20. Customer empathy15 .731
21. Product promise16 .737
22. Product access17
23. Customer complaints18 .697
24. Industry rivalry19 .692
25. Premises design20 .656
26. eBanking21 .667
Cronbach’s alpha (α) 0.845 (7 items) 0.767 (8 items) 0.710 (3 items) 0.314 (2 items)
Integrating sub-themes Product;
Customers;
Premises
Means of
communication;
Service portfolio
Products
attributes;
Customer
Mobile phone
Communication
; Insurrance
16
Similarly, improving a ‘Firm’s digital and non-digital communication’(Factor 2), requires
good use of internet, TV and radio (dependent variable) to reach customers, which is linked
to seven independent variables: ‘poster and flyers communication’, ‘word of mouth
communication, ‘mortgage service, ‘corporate services, ‘credit card and loan’, ‘investment
services and ‘insurance services’. In addition, in order to improve ‘firm-customer relationship
(Factor 3), a good product referral (dependent variable) is require – this is linked to two
independent variables: ‘product awareness’ and ‘product benefits. Finally, ‘mobile
commerce’ (Factor 4) has mobile phone communication (dependent variable) which is linked
to a single independent variable that is ‘insurance services’.
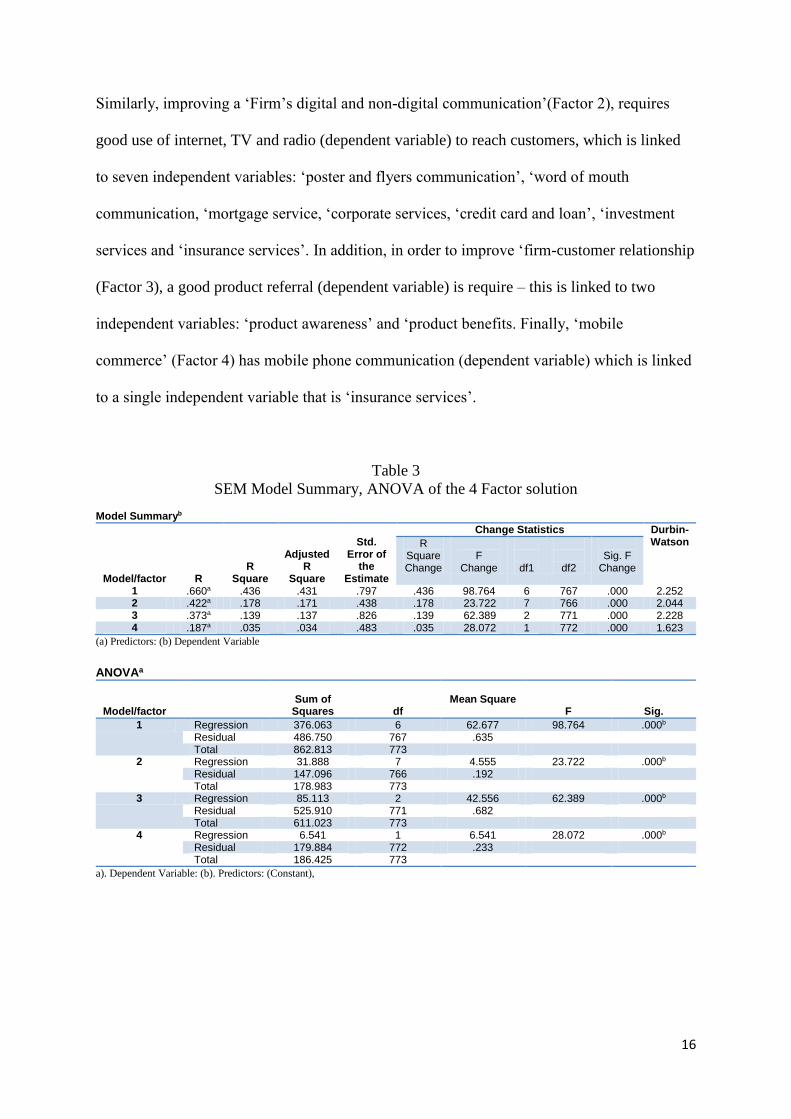
Table 3
SEM Model Summary, ANOVA of the 4 Factor solution
Model Summaryb
Model/factor
R
R Square
Adjusted R
Square
Std.
Error of the
Estimate
Change Statistics Durbin-Watson R
Square Change
F
Change
df1
df2
Sig. F
Change
1 .660a .436 .431 .797 .436 98.764 6 767 .000 2.252 2 .422a .178 .171 .438 .178 23.722 7 766 .000 2.044 3 .373a .139 .137 .826 .139 62.389 2 771 .000 2.228 4 .187a .035 .034 .483 .035 28.072 1 772 .000 1.623
(a) Predictors: (b) Dependent Variable
ANOVAa
Model/factor
Sum of
Squares
df
Mean Square
F
Sig.
1 Regression 376.063 6 62.677 98.764 .000b Residual 486.750 767 .635 Total 862.813 773
2 Regression 31.888 7 4.555 23.722 .000b Residual 147.096 766 .192 Total 178.983 773
3 Regression 85.113 2 42.556 62.389 .000b Residual 525.910 771 .682 Total 611.023 773
4 Regression 6.541 1 6.541 28.072 .000b Residual 179.884 772 .233 Total 186.425 773
a). Dependent Variable: (b). Predictors: (Constant),
17
Coefficientsa
Model/factor
Unstandardized
Coefficients
Standardized Coefficients
t
Sig. B Std. Error Beta 1 Customers’ Online-Offline Experience
(Constant) .392 .121 3.229 .001 cust_empathy .093 .035 .093 2.647 .008 cust_complaints .170 .034 .178 4.917 .000 ind_rivalry .145 .033 .149 4.330 .000 prem_design -.072 .029 -.087 -2.501 .013 e_banking .121 .025 .158 4.762 .000 prod_promise .376 .036 .352 10.469 .000
2 Firm’s digital and non-digital communication
(Constant) .450 .104 4.323 .000 Posters_Flyers_8 .077 .039 .072 1.993 .047 investment_13 .104 .046 .085 2.247 .025 wordofmouth_8 .170 .041 .156 4.153 .000 insurance_13 -.032 .041 -.029 -.768 .443 mortgage_13 .083 .056 .061 1.471 .142 corporate_13 .099 .043 .093 2.309 .021 creditcard_loan_13 .186 .038 .186 4.894 .000
3 Firm-customer relationship
(Constant) 2.733 .101 27.033 .000 prod_benefits .058 .036 .071 1.590 .112 prod_aware .239 .033 .322 7.223 .000
4 Mobile commerce
(Constant) 1.049 .069 15.118 .000 insurance_13 .206 .039 .187 5.298 .000
(a) Dependent Variable;
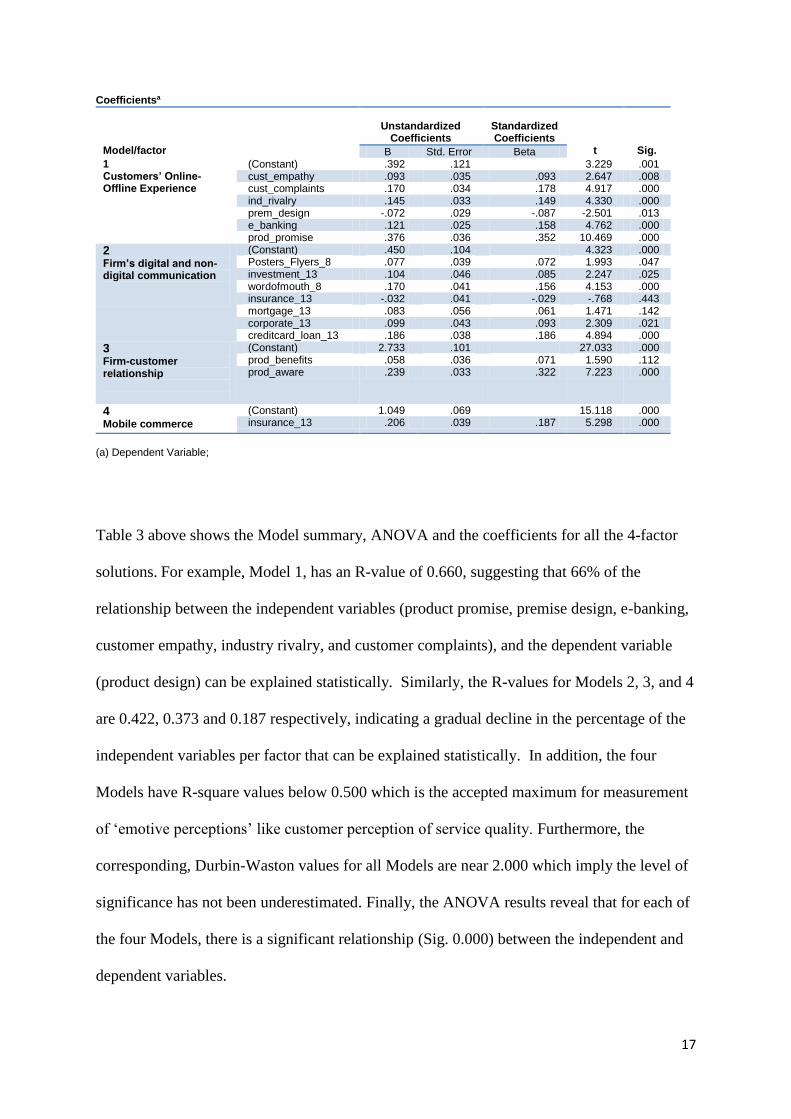
Table 3 above shows the Model summary, ANOVA and the coefficients for all the 4-factor
solutions. For example, Model 1, has an R-value of 0.660, suggesting that 66% of the
relationship between the independent variables (product promise, premise design, e-banking,
customer empathy, industry rivalry, and customer complaints), and the dependent variable
(product design) can be explained statistically. Similarly, the R-values for Models 2, 3, and 4
are 0.422, 0.373 and 0.187 respectively, indicating a gradual decline in the percentage of the
independent variables per factor that can be explained statistically. In addition, the four
Models have R-square values below 0.500 which is the accepted maximum for measurement
of ‘emotive perceptions’ like customer perception of service quality. Furthermore, the
corresponding, Durbin-Waston values for all Models are near 2.000 which imply the level of
significance has not been underestimated. Finally, the ANOVA results reveal that for each of
the four Models, there is a significant relationship (Sig. 0.000) between the independent and
dependent variables.
18
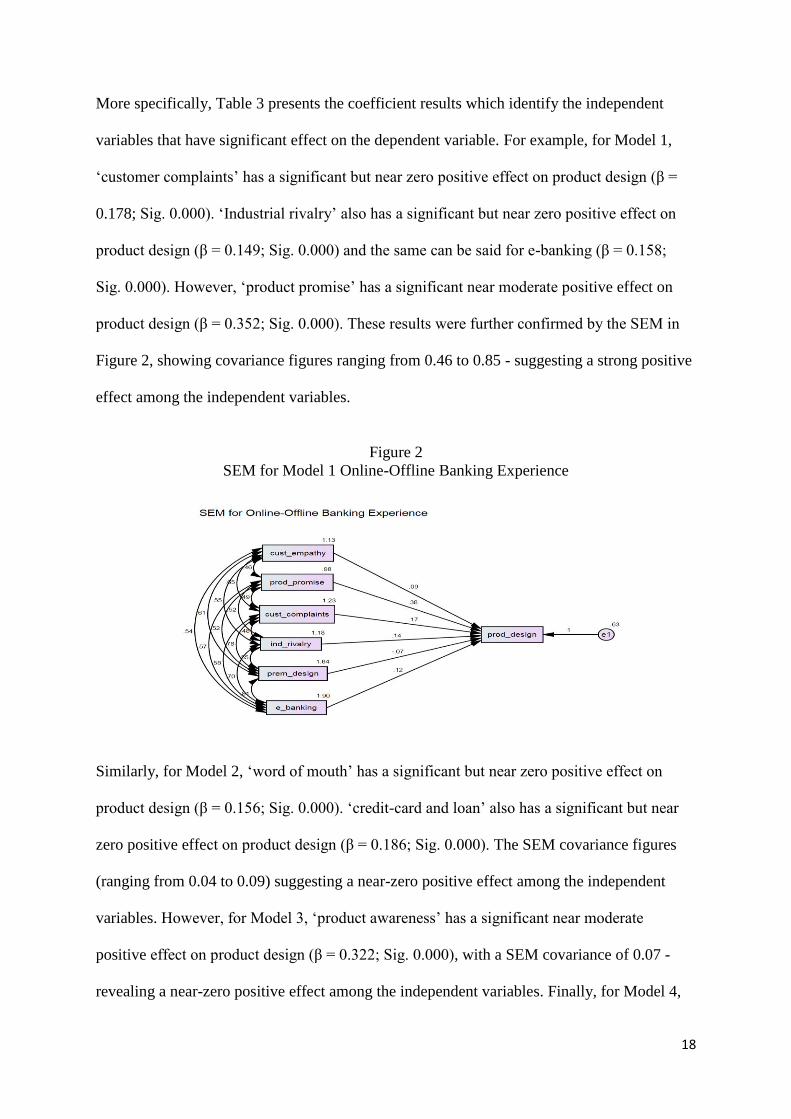
More specifically, Table 3 presents the coefficient results which identify the independent
variables that have significant effect on the dependent variable. For example, for Model 1,
‘customer complaints’ has a significant but near zero positive effect on product design (β =
0.178; Sig. 0.000). ‘Industrial rivalry’ also has a significant but near zero positive effect on
product design (β = 0.149; Sig. 0.000) and the same can be said for e-banking (β = 0.158;
Sig. 0.000). However, ‘product promise’ has a significant near moderate positive effect on
product design (β = 0.352; Sig. 0.000). These results were further confirmed by the SEM in
Figure 2, showing covariance figures ranging from 0.46 to 0.85 - suggesting a strong positive
effect among the independent variables.
Figure 2
SEM for Model 1 Online-Offline Banking Experience
Similarly, for Model 2, ‘word of mouth’ has a significant but near zero positive effect on
product design (β = 0.156; Sig. 0.000). ‘credit-card and loan’ also has a significant but near
zero positive effect on product design (β = 0.186; Sig. 0.000). The SEM covariance figures
(ranging from 0.04 to 0.09) suggesting a near-zero positive effect among the independent
variables. However, for Model 3, ‘product awareness’ has a significant near moderate
positive effect on product design (β = 0.322; Sig. 0.000), with a SEM covariance of 0.07 -
revealing a near-zero positive effect among the independent variables. Finally, for Model 4,

19
‘insurance’ has a significant but near zero positive effect on product design (β = 0.187; Sig.
0.000); with a corresponding SEM covariance value of 0.04.
Hypotheses Testing - using ANOVA Regression Analysis
The results reveal that, Model 1, has an R-value of 0.187, suggesting that 18.7% of the
relationship between the independent variables (e-banking, mobile communication,
newspaper and magazine communication, word-of-mouth communication, promotion
pressure, email and letter communication, product referral, product access, Posters and
Flyers, internet, tv and radio, industry rivalry, product benefits, product design, product
awareness), and the dependent variable (communication frequency) can be explained
statistically. Similarly, the R-values for hypotheses 2, 3, 4, 5 and 6 are 0.675, 0.644, 0.609,
0.643 and 0.592 respectively, indicating the percentage of the independent variables per
factor that can be explained statistically. In addition, the six hypotheses have R-square values
below 0.500 which is the accepted maximum for measurement of ‘emotive perceptions’ like
customer perception of service quality. Furthermore, the corresponding, Durbin-Waston
values for all Models are near 2.000 which imply the level of significance has not been
underestimated. Finally, the ANOVA results reveal that for each of the six hypotheses, there
is a significant relationship (Sig. 0.000) between the independent and dependent variables.
More specifically, the coefficient results identify the independent variables that have
significant effect on the dependent variable per hypothesis. For hypothesis 1 for example, the
coefficient results identify 6 independent variables to have significant effect on the dependent
variable. These are ‘emails and letters communication’ (β = -0.157; Sig. 0.000), ‘industrial
rivalry’ (β = -0.187; Sig. 0.000), ‘Word of mouth communication’ (β = -0.140; Sig. 0.000),
newspaper and magazines (β = -0.169; Sig. 0.000), ‘promotion pressure’ (β = 0.171; Sig.
0.000) and product access all have a significant effect (0.224; sig. 0.000) on communication
20
frequency. These results were further confirmed by SEM covariance analysis. The validity of
the hypothesis was determined by finding the cumulative average of the Beta figures of the
variables that have significant effect on the dependent variable. Similar format was followed
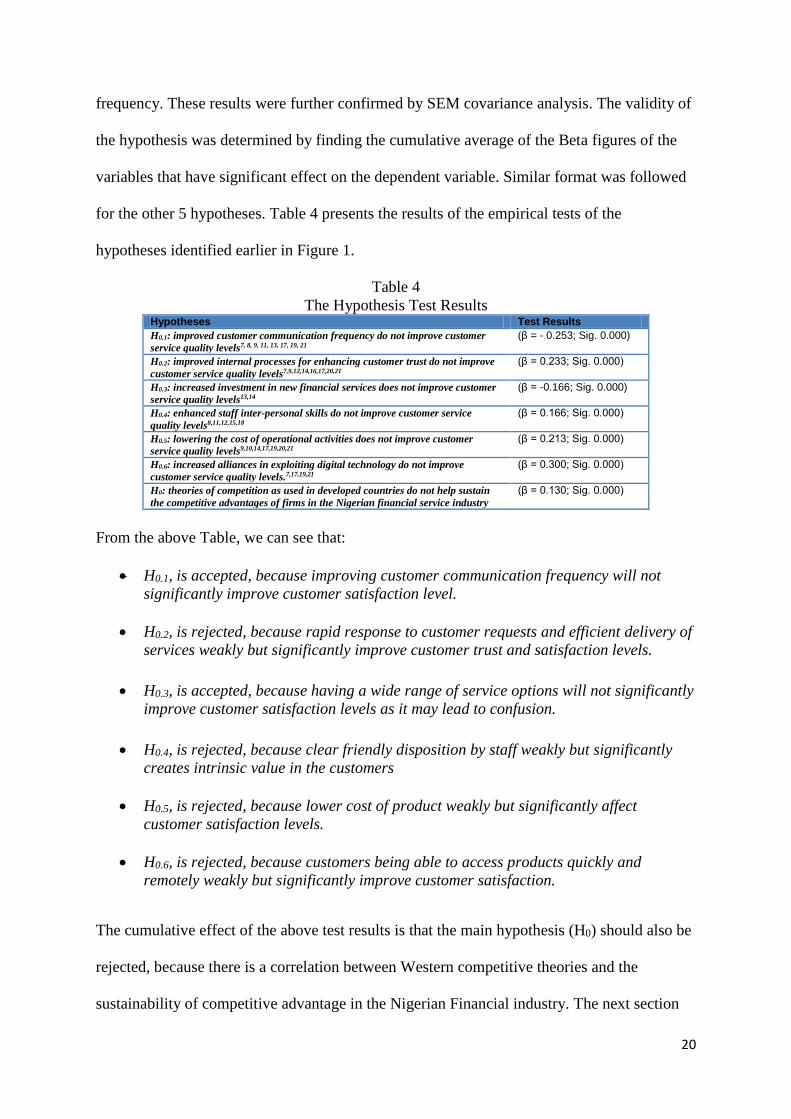
for the other 5 hypotheses. Table 4 presents the results of the empirical tests of the
hypotheses identified earlier in Figure 1.
Table 4
The Hypothesis Test Results Hypotheses Test Results
H0.1: improved customer communication frequency do not improve customer
service quality levels7, 8, 9, 11, 13, 17, 19, 21
(β = - 0.253; Sig. 0.000)
H0.2: improved internal processes for enhancing customer trust do not improve
customer service quality levels7,9,12,14,16,17,20,21
(β = 0.233; Sig. 0.000)
H0.3: increased investment in new financial services does not improve customer
service quality levels13,14
(β = -0.166; Sig. 0.000)
H0.4: enhanced staff inter-personal skills do not improve customer service
quality levels8,11,12,15,18
(β = 0.166; Sig. 0.000)
H0.5: lowering the cost of operational activities does not improve customer
service quality levels9,10,14,17,19,20,21
(β = 0.213; Sig. 0.000)
H0.6: increased alliances in exploiting digital technology do not improve
customer service quality levels.7,17,19,21
(β = 0.300; Sig. 0.000)
H0: theories of competition as used in developed countries do not help sustain
the competitive advantages of firms in the Nigerian financial service industry
(β = 0.130; Sig. 0.000)
From the above Table, we can see that:
H0.1, is accepted, because improving customer communication frequency will not
significantly improve customer satisfaction level.
H0.2, is rejected, because rapid response to customer requests and efficient delivery of
services weakly but significantly improve customer trust and satisfaction levels.
H0.3, is accepted, because having a wide range of service options will not significantly
improve customer satisfaction levels as it may lead to confusion.
H0.4, is rejected, because clear friendly disposition by staff weakly but significantly
creates intrinsic value in the customers
H0.5, is rejected, because lower cost of product weakly but significantly affect
customer satisfaction levels.
H0.6, is rejected, because customers being able to access products quickly and
remotely weakly but significantly improve customer satisfaction.
The cumulative effect of the above test results is that the main hypothesis (H0) should also be
rejected, because there is a correlation between Western competitive theories and the
sustainability of competitive advantage in the Nigerian Financial industry. The next section
21
discusses the implications of the above results and findings in light of the key findings in the
literature and in the context of contemporary development is the financial services sector.
Discussion and interpretation of findings:
Western-based models of service quality management are generally thought to require inputs,
processes and outputs like every other system; as such we have categorised the results and
findings of our study into two-folds; namely, the findings from the hypotheses testing i.e.
‘inputs’ representing the ways in which service quality improvement capabilities can be
achieved; and the 4-factor solutions i.e. representing ‘outputs’ from the transformation
processes. In the subsequent sub-sections we discuss the six key aspects of financial service
quality, identified in the hypotheses tests, namely, the use of digital technology to improve
customer awareness (H0.1); speed of responsiveness to customer needs and expectation
regarding service delivery (H0.2); effective management of service portfolio (H0.3); enhancing
the inter-personal communication skills of front-line staff (H0.4); pursuing a low-cost
leadership strategy (H0.5); and facilitating easy access to services through digital technology
(H0.6) – in the context of findings from prior studies as basis for a framework for improving
service quality through dynamic capability.
Communication frequency and Customer awareness (H0.1)
Our empirical results reveal that in the context of Nigeria, when Commercial banks increase
customer communication frequency, it may not necessary lead to an improvement in
customer service quality levels, because customers feel unduly pressured to access financial
products. These results are similar to that of Edmunds and Morris (2000) which report a
negative or no relationship between the two variables. Our results however contrast that of
Ankrah (2012) which revealed a significant positive strong relationship between the use of
‘communication frequency and ‘improving customer satisfaction. Debates on the impact of
22
over-communication on customer satisfaction have been on the increase recently more so
with the advancement of technology which provides various means for firms to communicate
with their clients. For example, Whittaker and Sidner (1997) state that over-communication
results in stress and dissatisfaction to customer. The implication of our findings is that
increase in the frequency of communicating information on product access through emails,
letters, word of mouth, newspapers, and magazines, has a significant, but negative near-zero
impact on customer satisfaction.
Internal processes, customer trust to Customer satisfaction (H0.2)
Prior studies including Revella (2015) and Pine and Gilmore (1999) indicate the important
role internal processes play on building customer trust and ultimately customer satisfaction
and experience. The findings from our study corroborate these studies by showing a
significant but weak positive correlation between internal processes and customer
satisfaction. For example, our results reveal that when Nigerian Commercial banks improve
their internal processes it leads to increase in customer satisfaction levels albeit weakly. The
implication of these findings demonstrates the criticality of the design of internal processes is
predicated on bank’s clear understanding of their customer expectations and perceptions in
order to allow the process by which their customer’s needs and requests are processed to
meet these expectations.
Financial Service Portfolio Management (H0.3)
Prior studies on ‘financial service portfolio’ reveal mixed results; for example some
researchers (Berger, Draganska & Itamar, 2007; Borle et al., 2005; Purohit & Srivastava,
2001) suggest there is a significant positive strong relationship between the use of ‘increase
in new financial services and ‘improving customer satisfaction’. These studies suggest that
23
the larger the amount of service on offer by a firm, the better the customer satisfaction and
confidence in that firm. However, other researchers report a negative or no relationship
between the two variables and mostly advocate concentrating on increasing the value of a few
service products and building those few so as not to be ‘a jack of all trade and a master of
none’ (Schwartz, 2004). The results in this study is in line with the later since it shows that
the increase in new financial services has a significant, but negative effect or impact on
customer satisfaction. It can also be argued that the increase in service range may lead to
increased confusion on which product a customer should take and that anxiety may ultimately
cause negative impact on customer experience and satisfaction. This increase confusion is
what Walsh and Mitchell (2010) refer to as customer confusion proneness which they show
to adversely affect perception on service quality and customer satisfaction. Therefore it is
best to strategically choose the few services to provide and work towards improving the
inherent values within the selected services for better customer satisfaction and better service
quality perception.
Enhancing the inter-personal communication skills of front-line staff (H0.4)
Prior studies on the impact of ‘interpersonal skills and communication on ‘customer service
quality and satisfaction’ suggest there is a significant positive strong relationship between the
use of ‘the levels of inter-personal communication skills and ‘improved customer perception
on service quality’. A study by Garavan (1997) reveals a number of factors that contribute to
building inter-personal communication skills of staff as perceived by customers, these factors
include, personal characteristics, perception of people, social competence, motivations,
situational factors, reasons for the interaction, location of interaction, and occasion of
interaction. These factors are echoed in other studies like Guenzi and Pelloni (2004),
Maxham and Netemeyer (2002) and others. The results from our study do not only confirm

24
the significance of inter-personal communication skills on customer satisfaction and
perceptions of service quality but it also reveal that how customer complaints are dealt with is
the most significant variable (with beta 0.505) in determining customer perception on inter-
personal skills of bank staff.
Pursuing a low-cost leadership strategy (H0.5)
The empirical results in this study show that the use of low-cost leadership strategy has a
significant, but weak effect or impact on customer satisfaction. The results also corroborate
the works by Powell (1996) and Porter (2008) on the role individual rivalry plays in the
design and development of low-cost services. In addition the findings support that – all things
being equal - there is a positive correlation between low-cost strategy and high quality
services which results in customer satisfaction and better service quality perception.
Facilitating easy access to services through digital technology and alliances (H0.6)
Prior studies on the impact of ‘digital technology’ on ‘customer awareness’ reveal mixed
results; for example some researchers including Ankrah (2012) suggest there is a significant
positive strong relationship between the use of ‘digital technology’ and ‘improving customer
awareness’. Other researchers report a negative or no relationship between the two variables.
Technology and innovation has completely revolutionized banking processes and banking
service delivery and has made the days of going physically to bank to transact or
communicate with the bank obsolete (Ankrah, 2012). In today’s banking world, virtually all
banking transactions can be done remotely and complaints, feedback, requests and enquiries
can be done electronically. The advent of mobile telephone systems and the increasing
availability of internet services in Nigeria thus provide the banking industry a source of
leverage for communicating with customers and delivering banking services to customers
25
through non-traditional means as previously obtained. The result in this study shows that the
use of digital technology has a significant, but moderate effect or impact on customer
awareness. The fact that Ankrah’s (2012) findings focus on Ghana, which share socio-
cultural value with Nigeria because of their share colonial history, may partially account for
similarity in the finding.
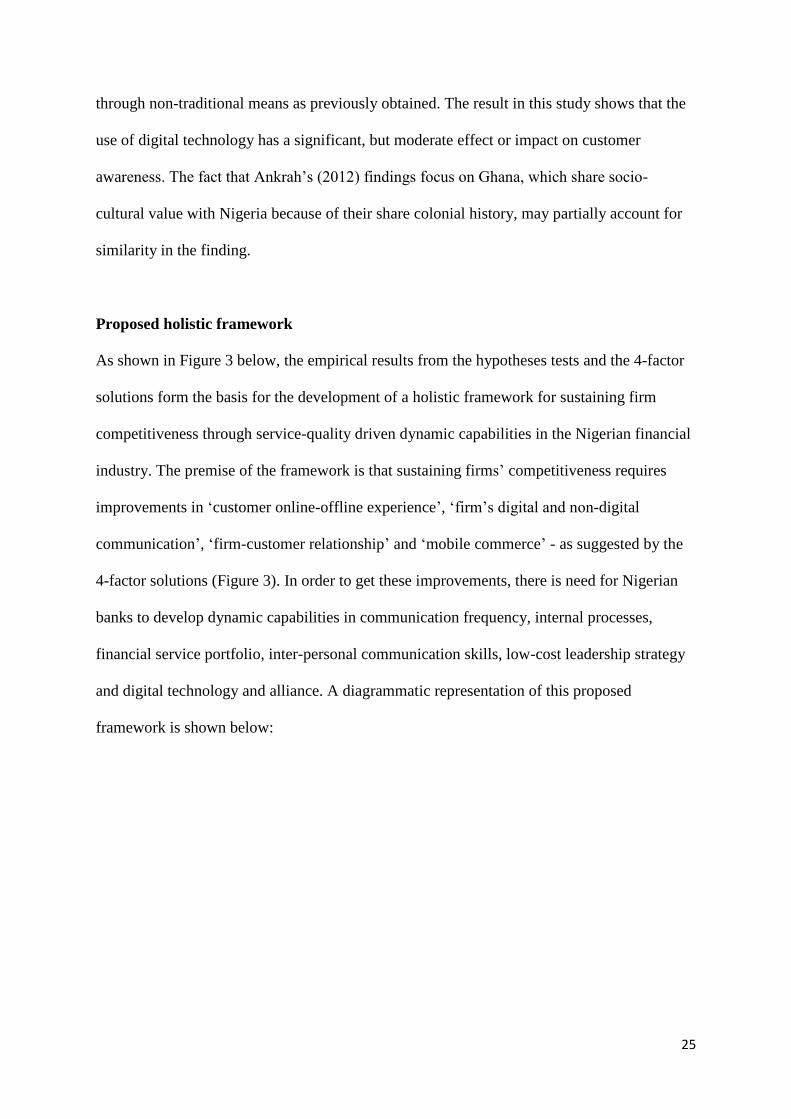
Proposed holistic framework
As shown in Figure 3 below, the empirical results from the hypotheses tests and the 4-factor
solutions form the basis for the development of a holistic framework for sustaining firm
competitiveness through service-quality driven dynamic capabilities in the Nigerian financial
industry. The premise of the framework is that sustaining firms’ competitiveness requires
improvements in ‘customer online-offline experience’, ‘firm’s digital and non-digital
communication’, ‘firm-customer relationship’ and ‘mobile commerce’ - as suggested by the
4-factor solutions (Figure 3). In order to get these improvements, there is need for Nigerian
banks to develop dynamic capabilities in communication frequency, internal processes,
financial service portfolio, inter-personal communication skills, low-cost leadership strategy
and digital technology and alliance. A diagrammatic representation of this proposed
framework is shown below:

26
Figure 3: Proposed framework for firm competitiveness through service-quality driven dynamic capabilities Source: Authors
UNIQUE SYNERGIES
Sources of Competitive Advantage - Dynamic
capabilities (H0)
Staff inter-personal communication
skills (H0.4)
Strategic management of communication frequency (H0.1)
Digital technology and
alliance formation (H0.6)
Low-cost leadership
strategy (H0.5)
Streamlined financial service portfolio (H0.3)
Strategic optimisation of
internal processes (H0.2)
Improved
Customers’ Online-
Offline Experience
Improved Firm’s
Digital-Non-digital
Communications
Improved
Firm-
Customer
Relationship
INN
OV
ATIO
N
INN
OV
ATIO
N
Improved Mobile-
commerce
Sustained Competitive Advantage
(4-factor solutions)

27
Theoretical and practical implications of findings
The findings in this paper have both theoretical and practical strategic implications relating to
the fact that communicating with customers is important in sustaining competitive advantage
as advocated by Mithas, Krishnan and Fornell (2005) and Adalikwu (2012). For example, we
found that too much communication has a negative impact on customer satisfaction (H0.1).
The implications are that there is a communication threshold beyond which point customers
may perceive further communication as ‘pestering’ or ‘bothersome’ thus having an adverse
effect on their satisfaction with the service. The imperative is for strategist to develop
strategic communication plans that though comprehensive, its frequency is closely managed
so that the communication threshold point is not exceeded. Linked closely to this finding is
the need to continually develop inter-personal communication skills which perhaps provides
a means for managing the communication frequency - which further highlights the need for
communication training in the Nigerian context (H0.4) (Barney, 1991; Grant, 1991; Wernefelt,
1984). In practice therefore there is a need for the continuous training and development of
staff to reflect the current realities of our ever-changing communication-driven world.
Another key implication from this study is the importance of financial service portfolio
management. Our findings validate Porter’s (2008) focus strategy as relevant in the Nigerian
context by revealing the need for managers and strategists to streamline the number of
services offered and rather than focus on the quantity of services on offer, quality and value
created are more important to customer satisfaction (H0.3). These findings a further reinforced
by the need for a shift towards co-operation as opposed to the current traditional ‘cut-throat’
competition that currently exists in Nigeria (H0.6).
28
Conclusions and recommendations:
The key findings in this paper overall recognizes both the impact of socio-cultural differences
on customer perceptions about the applicability of western models of service quality and the
benefits of adopting tried and tested western service quality in developing countries,
particularly those in the Asia-Pacific region. From our discussion relating to the key
components of the holistic framework in Figure 3, we draw six key conclusions relating to
each source of competitive advantage in the following section.
Firstly, the use of digital technology to improve customer awareness is fundamental for
sustaining firm competitiveness (competitive advantage) in the highly competitive Nigerian
Financial industry. Our findings portend important implications to practitioners, researchers
and policy makers as it shows that there is a point or a threshold where further increase in
communication frequency will result in negative impact on customer satisfaction. This is
perhaps the point when customers begin to feel they are being pressured or ‘disturbed’ and so
there must be a fine balance between ensuring customer awareness through frequent
communication and ‘too-much communication’. It is therefore imperative for firms to
develop service-quality driven dynamic capabilities for efficient and effective management of
their communication frequency.
Secondly, in today’s business world, the speed of responsiveness to customer needs and
expectation regarding service delivery is important for sustaining competitiveness in the
Nigerian financial industry. Our findings reveal that since customer expectations are not
always static but may change to reflect their current needs or societal forces, the internal
process of bank service should also be dynamic to capture and reflect these changes in
expectation. It is therefore imperative for firms to develop service-quality driven dynamic
29
capabilities for efficient and effective Internal processes management of customers’ needs
and complaints.
Thirdly, on the effective management of service portfolio, our findings are in line with Teece
(2011) suggesting that the development of business models that enhance product value is of
greater significance than a model that encourages the mass production of several goods with
little value. In the quest to satisfy customers, firms must not be driven by the desire to create
a wide array of product that could further contribute to customer confusion proneness,
decision conflicts and ultimately dissatisfaction (Dhar,1997; Greenleaf and Lehmann, 1995;
Tversky and Shafir, 1992). Our findings portend important implications to practitioners,
researchers and policy makers as it shows that by continually managing a few service
portfolios in order to get better value off them, a firm can sustain competitive advantage. It is
therefore imperative for firms to develop service-quality driven dynamic capabilities for
efficient and effective management of their financial service portfolio.
Fourthly, the enhancement of inter-personal communication skills of front-line staff is
fundamental for sustaining firm competitiveness (competitive advantage) in the highly
competitive Nigerian Financial industry. Our study highlights the importance of continuous
inter-personal skills training for bank staff in firm’s bid to sustain competitive advantage.
Firms must devise innovative means through which staff are trained and taught the
importance of empathy to customers’ perceptions of service quality. This study finding shows
that by continually training and developing staff to get better communication skills, a firm
can sustain competitive advantage through service-quality driven dynamic capabilities.

30
Fifthly, the pursuit of a low-cost leadership strategy is important for sustaining
competitiveness in the Nigerian financial industry. Our findings shows the importance for
firms to efficiently and effectively manage their value chain in order to provide low cost but
high value financial services to customers in their bid to sustain competitive advantage. This
is in-line with findings by Ketchen et al. (2008) on the importance of efficient supply chain
management. It is therefore imperative for firms to develop service-quality driven dynamic
capabilities for efficient and effective pursuit of low cost strategy.
Finally, the facilitation of easy access to services through digital technology and alliance is
fundamental for sustaining firm competitiveness in the highly competitive Nigerian Financial
industry. Our findings show the importance technological innovation plays in making access
to financial services easier for customers. We also advocate building strategic alliances or
“co-operation” rather than a focus on only traditional competition in in firms’ strategic desire
of sustaining competitive advantage. It is therefore imperative for firms to develop service-
quality driven dynamic capabilities for efficient and effective management of technological
innovation and strategic alliances.
Overall, the findings in this paper give a general indication that both firm-competitiveness
and service quality are multi-dimensional constructs and show that while the Western
theories on these constructs are significant and valid in Nigerian financial industry, the extent
and impact of the Western-identified service quality factors and drivers are weak. The
findings of the study also show that service quality driven dynamic capability has 4 factor
solutions or visible indicators in the Nigerian financial service context which are the
improvement in customer online-offline experience, improvement in firm digital and non-
digital communication management, improvement in relationship management and

31
improvement in mobile-commerce. The implication of these findings suggests an urgent need
to continuously renew the advantages a firm has through innovative management of
communication frequency, internal processes, inter-personal staff training, financial service
portfolio management, the establishment of technological capabilities and alliances, in pursuit
of low-cost strategy and ultimately increase in corporate profitability.
On the basis of the above empirical results and findings we therefore reject the argument that
theories of competition as used in developed countries do not help sustain the competitive
advantages of firms in the Nigerian financial service industry, because there is indeed a
significant but weak positive correlation coefficient between western theories of competition
and sustaining competitive advantage in the financial service industry in Nigeria.
The key limitation of this study relates to the fact that it is mainly quantitative and relies only
on customer perceptions of service quality. This limitation is evident from the low ‘R’
regression variance figures which show that on average only 50% of the relationships
examined can be explained statistically. Although some studies have shown that low R
squared values of less than 50% are expected in statistical analysis of emotive or human
psychological behaviour studies which perceived service quality and customer satisfaction
falls under (Cameron and Windmeijer, 1996), there is the need to corroborate these findings
through further research using qualitative methodology. Despite these limitations and given
the sample size of 774 respondents cutting across different age brackets, marital status,
education and occupational status and gender, it is likely that the results obtained from this
study can be generalized and represent the ‘best case’ scenario.
32
References
Adalikwu, C. (2012) "Customer relationship management and customer satisfaction."
African Journal of Business Management 6, no. 22 (2012): 6682-6686.
Akao, Y. (1990) Quality Function Deployment, Productivity ,Press, Cambridge MA
Anderson, E.W. and Mittal, V. (2000) ‘Strengthening the Satisfaction-Profit Chain’, Journal
of Service Research, Vol. 3, No. 2, pp 107-120
Ankrah, E. (2012). Technology and Service Quality in the Banking Industry in Ghana.
Information and Knowledge Management, 2(8), 52-60.
Arokiasamy, A.R. and Abdullah, A.G. (2013) ‘Customer Satisfaction and Online Service
Quality in the Banking Sector in Malaysia,’ International Journal of Contemporary Business
Studies, Vol. 4, No: 6, JUNE, 2013 ISSN 2156-7506
Barney, J. B. (1991) ‘Firm Resources and sustained Competitive Advantage’, Journal of
Management Review, 17(1) pp.99-120
Barney, J.B. and Hesterly, W.S (2012) Strategic Management and Competitive Advantage:
Concepts, 4th Edition, New York: Pearson.
Berger J., Draganska M. and Simonson I. (2007) ‘The Influence of Product Variety on: Brand
Perception and Choice’, Journal of Marketing Science, Vol. 26, No. 4, July–August 2007, pp.
460–472
Borle, S., Boatwright, P., Nunes,J., Kadane,J. and Shmueli, G. (2005) “Effect of Product
Assortment Changes on Consumer Retention, ” Marketing Science, Vol 24, No. 4 (Fall), pp.
616–622.
Cameron, A.C. and Windmeijer, F.A.G (1996) “R-Squared Measures for Count Data
Regression Models with Applications to Health Care Utilization” Journal of Business &
Economic Statistics,Vol. 14, No. 2 (Apr., 1996), pp. 209-220
Davenport, T.H. and Short, J.E. (1990) ‘The New Industrial Engineering: Information
Technology And Business Process Redesign’, Sloan Management Review, summer, pp.11-27
Deming, W. E. (2000). The New Economics for Industry, Government, Education (2nd ed.).
MIT Press. ISBN 0-262-54116-5. OCLC 44162616.
De Wit, B. and Meyer, R. (2014) Strategy, 5th Edition. London: Cengage.
Dhar, R. (1997). Consumer preference for a no-choice option. J. Consumer Res.
24(September) 215–231.
Edmunds, A. and Morris, A. (2000) ‘The problem of information overload in business
organisations: a review of the literature’, International Journal of Information Management,
20, 17, p. 28
Feigenbaum, A.V.(1983) Total quality control New York : McGraw-Hill
Frei, F. X. (2008) ‘The Four Things a Service Business Must Get Right’, Harvard Business
Review, April 2008
33
Garavan, T. N. (1997) "Training, development, education and learning: different or the
same?" Journal of European Industrial Training 21, (2) 39-50
Grant, R. M. (1991) ‘The Resource-Based Theory of Competitive Advantage: Implications
for Strategy Formulation’, California Management Review, 33, pp 114-133.
Greenleaf, E. A. and Lehmann , D. R.. 1995. Reasons for substantial delay in consumer
decision making. J. Consumer Res. 22(September) 186–199.
Guenzi, P. and Pelloni O. (2004), The impact of interpersonal relationships on customer
satisfaction and loyalty to the service provider, International Journal of Service Industry
Management Vol.15, No.4
Hamel, G., and Prahalad, C. K. (1994). Competing for the future. Harvard Business Review,
72(4), 122.
Hernon, P. and Nitecki, D. A. (2001). Service quality: A concept not fully explored. Library
Trends, 49, 687–708.
Heskett, J.L., Jones, T.O., Loveman, G.W., Sasser, W.E., and Schlesinger,L.A. (1994)
‘Putting the service-profit chain to work’, Harvard Business Review, 72(2), pp164-174
Hofstedes, G. (2011) ‘Dimensionalizing Cultures: The Hofstede Model in Context’,
International Association of Cross Cultural Psychology, Article 8
Juneja, D., Ahmad, S. and Kumar, S. (2011) ‘Adaptability of Total Quality Management To
Service Sector’, International Journal of Computer Science & Management Studies, Vol. 11,
Issue 02, August 2011, pp 2231 –5268
Kaplan, R. S. and Norton, D.P. (2006). Alignment: Using the Balanced Scorecard to Create
Corporate Synergies, Boston: HBS Press.
Keller, K. L (2011), “Global Branding,” in Wiley International Encyclopedia of Marketing
edited by Jagdeth Sheth and Naresh Malhotra, in Volume 1 International Marketing, edited
by Daniel Bello and David Griffith, John Wiley & Sons Limited, forthcoming.
Keller, K.L. (1993) ‘Conceptualizing Measuring and Managing Customer-Based Brand
Equity’, Journal of Marketing, 57 (1), pp. 1-22.
Keller, K.L. (2013) ‘Strategic Brand Management: Building, measuring and Managing
Brand Equity’ (4th Ed.), England: Pearson Education Limited
Kendall, H. (2010) Quality Service, Competitive Business: setting the standard in customer
service. Publisher: BSI British Standards Institution
Ketchen, D.J., William, R., Hult, G.T. and David, M. (2008) ‘Best value supply chains: A
key competitive weapon for the 21st century’, Business Horizon, 55, pp. 235-243
Kim, W.C. and Mauborge, R (2014) "Blue Ocean Leadership." Harvard Business Review,
May,
Maxham, J.G. and Netemeyer, R.G. (2002) ‘Modeling customer perceptions of complaint
handling over time: the effects of perceived justice on satisfaction and intent’, Journal of
Retailing, Volume 78, Issue 4, 2002, Pages 239–252
34
Mithas,S., Krishnan M.S. and Fornell, C. (2005) Why Do Customer Relationship
Management Applications Affect Customer Satisfaction?. Journal of Marketing: October
2005, Vol. 69, No. 4, pp. 201-209.
Osseo-Asare, A.E., Longbottom, D., and Chourides, P. (2007) ‘Managerial Leadership for
Total Quality Improvement in UK higher Education’ The TQM Magazine, Vol 19 Iss:6. Pp
541-560
Parasuraman, A., Zeithaml, V., and Berry, L.L. (1988) ‘SERVQUAL: A multiple-item scale
for Measuring Consumer Perception of Service Quality’, Journal of Retailing,64, pp. 12-40
Parasuraman, A., Zeithaml, V., and Berry, L.L. (1994) ‘Reassessment of expectations as a
comparison standard in measuring service quality- implications for further research’, Journal
of Marketing, pp. 1-124
Parasuraman, A., Zeithaml, V.A. and Berry, L.L. (1985) ‘A conceptual model of service
quality and its implications for future research’, Journal of Marketing, Vol. 49, No. 3, pp. 41-
50.
Porter, M. E. and Heppelmann, J.E. (2014) "How Smart, Connected Products are
Transforming Competition", Harvard Business Review, November 2014, pp 65–88
Porter, M. E. (2001) "Strategy and the Internet", Harvard Business Review, March 2001, pp.
62–78.
Porter, M.E. (2008) "The Five Competitive Forces That Shape Strategy", Harvard Business
Review, January 2008, pp. 79–93.
Powell, T. (1996) ‘How Much Does Industry Matter? An Alternative Empirical Test’,
Strategic Management Journal’, 17(4), pp 323-334
Prahalad, C.K., and Hamel, G. (1994) ‘Competing For the Future’, Harvard Business Review,
72 (4), pp. 122-128.
Purohit, D. and Srivastava, J. (2001), “Effect of Manufacturer Reputation, Retailer
Reputation, and Product Warranty on Consumer Judgments of Product Quality: A Cue
Diagnosticity Framework,” Journal of Consumer Psychology, 10 (3), 123-34.
Revella, A. (2015) Buyer Personas: How to Gain Insight into Your Customer's Expectations,
Align Your Marketing Strategies, and Win More Business. New Jersey: John Wiley and sons
Inc.
Schumpeter, J. A. (1950) "The March into Socialism". The American Economic Review,
Papers and Proceedings of the Sixty-second Annual Meeting of the American Economic
Association (American Economic Association via JSTOR) 40 (2): 446–456. JSTOR 1818062
Schwartz, B. (2004). The Paradox of Choice: Why More is Less. Harper Collins, New York.
Silvestro, R. And Cross, S. (2000) ‘Applying the Service Profit Chain In A Retail
Environment: Challenging The Satisfaction Mirror’, International Journal of service industry
Management, Vol. 11,No.3, pp. 2
Teece, D. J. (2011) Dynamic Capabilities and Strategic Management: Organizing for
Innovation and Growth, OUP Oxford; Reprint edition
35
Teece, D., Pisano, G., and Shuen, A. (1997) ‘Dynamic Capabilities and Strategic
Management’, Strategic Management Journal, 18, 7, pp. 509-533.
Treacy, M. and Wiersema, F. (1995) ‘How market leaders keep their edge’, Fortune, 131(2),
pp. 52-57.
Tversky, A., and Shafir E. (1992) Choice under conflict: The dynamics of deferred decision.
Psych. Sci. 3 358–361.
Vavra, T.G. (1997) Improving Your Measurement of Customer Satisfaction, Milwaukee,
Wisconsin: ASQ Quality Press
Vilares, M.J. and Coehlo, P.S. (2003) ‘ The Employee-Customer Satisfaction Chain In The
ESCI Model’, European Journal of Marketing, Vol. 37, No. 11/12, pp. 1703-1722
Walsh, G. and Mitchell, V (2010) ‘The effect of consumer confusion proneness on word of
mouth, trust, and customer satisfaction’ European Journal of Marketing Vol. 44 No. 6, 2010
pp. 838-859
Wernerfelt, B. (1984) ‘A Resource-Based View of the Firm’, Strategic Management Journal,
5, pp 171-180.
West D., Ford, D., and Ibrahim, E. (2010) Strategic Marketing: Creating Competitive
Advantage. England: Oxford University Press
Whittaker, S. and Sidner, C. (1997). E-mail overload: Exploring personal information
management of e-mail. In S. Kiesler, Culture of the internet (pp. 277}295). New Jersey:
Lawrence Erlbaum.
Winter, S.G. (2000) ‘The Satisfying Principle in Capability Learning’, Strategic Management
Journal, 21, pp 981-996