how control of nutrient pollution results could be measured in a program that has a national...
TRANSCRIPT

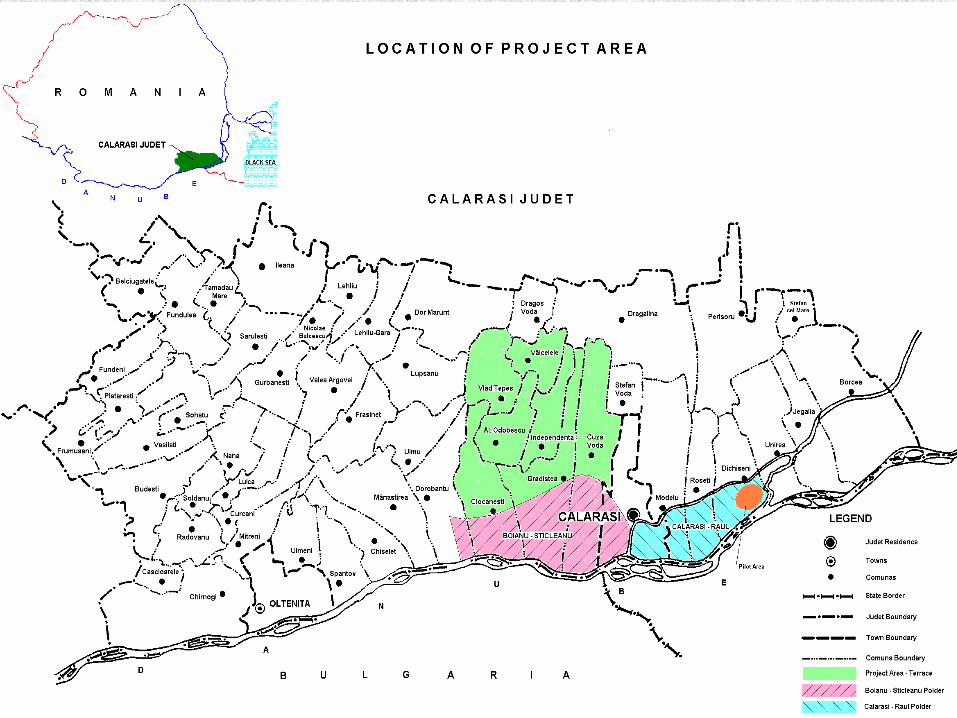
ROMANIAAGRICULTURAL POLLUTION
CONTROL PROJECT
Project Management Unit
Moldova, Chisinau, October 3, 2006

Use of PROXI methods for measuring results of Agricultural Pollution Control Project, implemented
in Calarasi, Romania

Project Financing Sources
Total value: USD 10.8 mil. out of which:
• USD 5.15 mil. World Bank from GEF funds;
• USD 1.86 mil. Government of Romania;
• USD 0.29 mil. Calarasi County Council;
• USD 1.00 mil. from the governmental “Agricultural Support Services” Project;
• USD 2.50 mil. (in kind) by direct beneficiaries.

Project Interventions• Investments
– Manure Management– Windbreak/Shelter belts– Riparian Buffers– Nutrient Management Plans – Wellhead Protection – Grazing Management – Conservation Tillage
• Training and Technical Assistance• Public Awareness

Identified sources of pollution with nutrients:
At household level:
Inappropriate manure storage
Lack off or bad conditions of the concrete slab protecting the water well against direct infiltrations
Aggravating factors:

Identified sources of pollution with nutrients:
At commune level:
Inappropriate manure disposal

Identified sources of pollution with nutrients:
At commune level:
Inappropriate manure disposal
Grazing of animals on soil erosion prone areas
Large areas of slopped land draining into watercourses
Temporary housing near watercourses

Project Interventions
At household levelIndividual Platforms
Plastic Bins for waste segregation
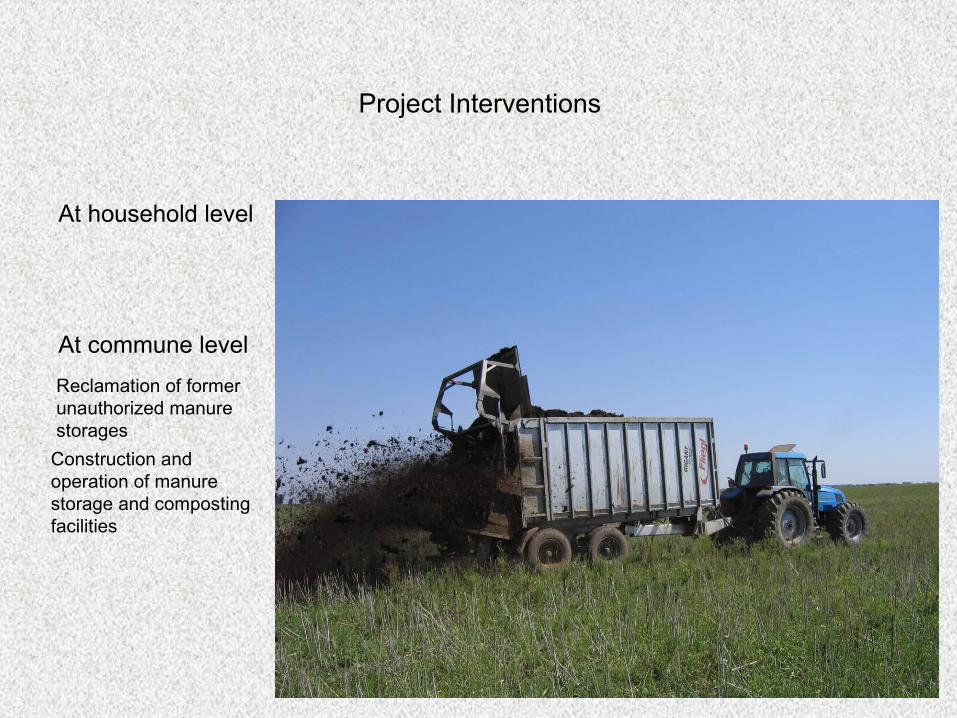
Project Interventions
At household level
At commune level
Reclamation of former unauthorized manure storages
Construction and operation of manure storage and composting facilities

Project Interventions
At commune level
Demonstrations of well head rehabilitation

Project Interventions
At commune level
Riparian Buffers with forest vegetation
Windbreaks, Shelterbelts

Project Interventions
At commune level
Riparian Buffers with forest vegetation
Windbreaks, Shelterbelts
Grazing Management


Nitrate concentration in Piezometers
Piezometer P5
0.000
5.000
10.000
15.000
20.000
25.000
01.0
9.03
01.1
1.03
01.0
1.04
01.0
3.04
01.0
5.04
01.0
7.04
01.0
9.04
01.1
1.04
01.0
1.05
01.0
3.05
01.0
5.05
01.0
7.05
01.0
9.05
01.1
1.05
01.0
1.06
01.0
3.06
01.0
5.06
01.0
7.06
Testing Date
NO
3 -
mg
/l
NO3
Piezometer P8
0
20
40
60
80
100
120
01.0
9.03
01.1
1.03
01.0
1.04
01.0
3.04
01.0
5.04
01.0
7.04
01.0
9.04
01.1
1.04
01.0
1.05
01.0
3.05
01.0
5.05
01.0
7.05
01.0
9.05
01.1
1.05
01.0
1.06
01.0
3.06
01.0
5.06
01.0
7.06
Testing Date
NO
3 -
mg
/l
NO3

Drinking water quality
Water Well C18
0.000
20.000
40.000
60.000
80.000
100.000
120.000
24.1
1.03
24.0
1.04
24.0
3.04
24.0
5.04
24.0
7.04
24.0
9.04
24.1
1.04
24.0
1.05
24.0
3.05
24.0
5.05
24.0
7.05
24.0
9.05
24.1
1.05
24.0
1.06
24.0
3.06
Testing Date
NO
3 -
mg
/l
NO3

Measuring results of nutrient pollution control interventions
• Monitoring the nutrients concentration into the surface and ground water at representative sampling stations and review of eutrophic state of the surface waters at regular intervals.
• Use of PROXI methods.

Measuring nutrients concentration into the ground and surface waters
Strong points:– It shows the actual quality of the ground and surface waters at
designated measuring stations.
Weak points:– The existing sampling stations could be not representative for project
interventions.– The frequency of measurements could not catch stochastic events as
storm rains, snow melting or variable factors as fertilizers or manure applications.
– The trend of nutrient concentration does not reflect only the project interventions.
– It is expensive.

Why use the PROXI methods?
• Are based on extensive scientific research.
• Allow assessment of total results of a variety of diverse interventions.
• Are cheap and offer good accuracy.
• Allow for quantitative estimate in terms of nutrient pollution reduction using the survey results.
• Allow for forecasting of results of new projects implementing the same nutrient pollution control interventions.

Reduction of nutrients loss into the ground and surface waters due to appropriate manure management
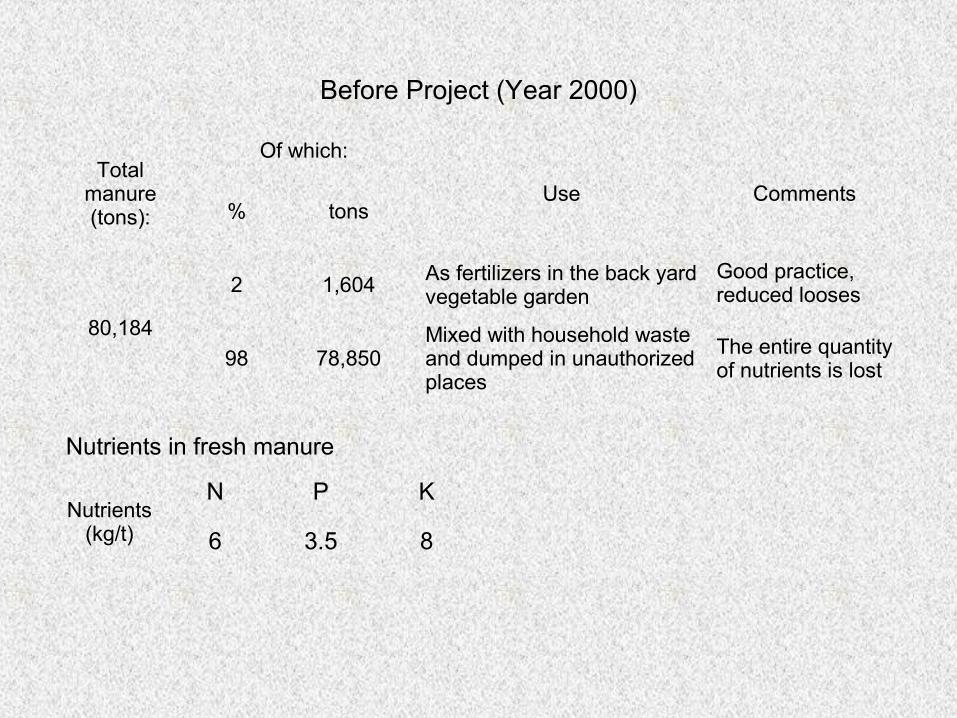
Before Project (Year 2000)
Total manure (tons):
Of which:
Use Comments% tons
80,184
2 1,604 As fertilizers in the back yard vegetable garden
Good practice, reduced looses
98 78,850Mixed with household waste and dumped in unauthorized places
The entire quantity of nutrients is lost
Nutrients (kg/t)
N P K
6 3.5 8
Nutrients in fresh manure
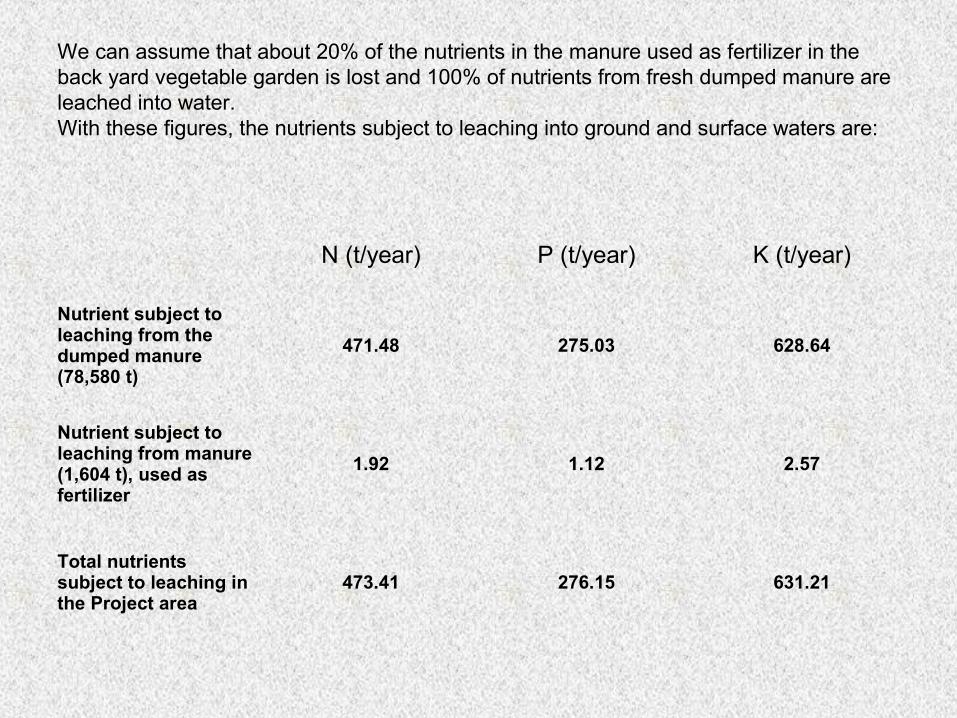
We can assume that about 20% of the nutrients in the manure used as fertilizer in the back yard vegetable garden is lost and 100% of nutrients from fresh dumped manure are leached into water.With these figures, the nutrients subject to leaching into ground and surface waters are:
N (t/year) P (t/year) K (t/year)
Nutrient subject to leaching from the dumped manure (78,580 t)
471.48 275.03 628.64
Nutrient subject to leaching from manure (1,604 t), used as fertilizer
1.92 1.12 2.57
Total nutrients subject to leaching in the Project area
473.41 276.15 631.21

CommuneManure collected from farmers
(tons)Manure applied on agricultural fields
(tons)
Al. Odobescu 3,200 2,900
Ciocanesti 4,100 3,800
Cuza Voda 2,800 2,400
Gradistea 9,400 8,900
Independenta 3,500 2,000
Valcelele 3,500 2,000
Vlad Tepes 2,200 950
Total 28,700 22,950
During the year 2005, the communes reported the collection, composting and use as fertilizer of the following manure quantities:

Year 2005 (Project year 4)
Total manure (tons):
Of which:
Use Comments% tons
80,184
5 4,009 As fertilizers in the back yard vegetable garden
Good practice, reduced looses
29 22,950 Manure spreaded as fertilizer on agricultural lands
Good practice. Only the nutrients that are not available to plants are lost
66 53,225
Unmanaged manure, source of pollution, due to the inappropriate behavior of some farmers
The entire quantity of nutrients is lost
Assuming that the quantity of manure produced each year is almost the same as at the Project preparation (the same structure and number of animals), during the year 2005, the use of the manure was as follows:

In a normal rotation of maize-sunflower-wheat-wheat, the nutrients from one tone of composted manure is used as follows
N P K
Nutrients available to plants (kg/t) 3.15 3.25 5.5
Nutrients subject to leaching (kg/t) 2.85 0.25 2.5

With these figures, the potential discharge of nutrients from produced manure was as follows:
N (t/year) P (t/year) K (t/year)
Nutrient subject to leaching from manure (4,009 t), used as fertilizer
4.81 2.81 6.41
Nutrients subject to leaching from the manure (22,950 t) applied on fields as fertilizer
65.41 5.74 57.38
Nutrients subject to leaching from the dumped manure (53,225 t)
319.35 186.29 425.80
Total nutrients subject to leaching in the Project area
389.57 194.83 489.59
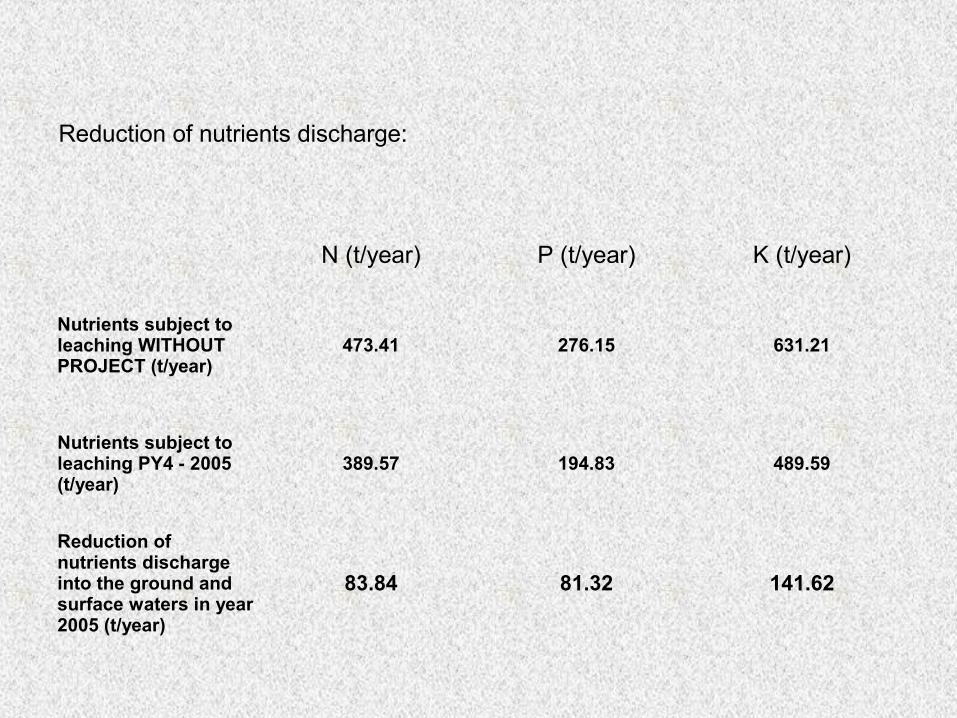
Reduction of nutrients discharge:
N (t/year) P (t/year) K (t/year)
Nutrients subject to leaching WITHOUT PROJECT (t/year)
473.41 276.15 631.21
Nutrients subject to leaching PY4 - 2005 (t/year)
389.57 194.83 489.59
Reduction of nutrients discharge into the ground and surface waters in year 2005 (t/year)
83.84 81.32 141.62

The quantity of nutrients supplied with the manure (22,950 tons), applied as fertilizer are:
Nutrients supplied with the applied manure (tons)
N P K
72.29 74.59 126.23
Therefore, for the same targeted yields, the quantity of the mineral fertilizers usually applied can be reduced with the amount supplied with the applied manure.
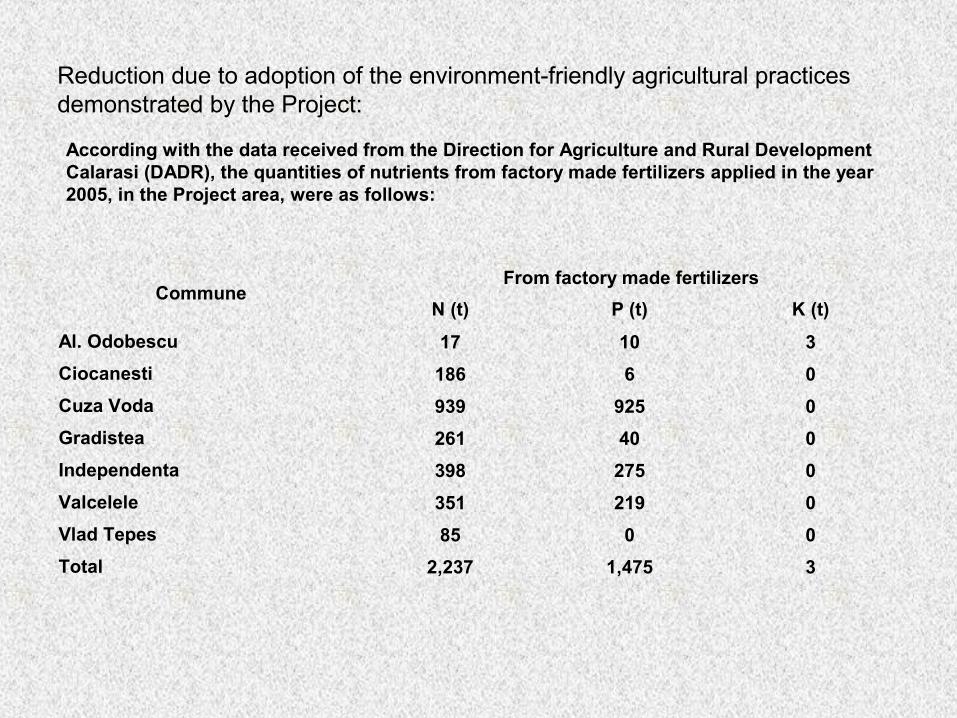
Reduction due to adoption of the environment-friendly agricultural practices demonstrated by the Project:
According with the data received from the Direction for Agriculture and Rural Development Calarasi (DADR), the quantities of nutrients from factory made fertilizers applied in the year 2005, in the Project area, were as follows:
CommuneFrom factory made fertilizers
N (t) P (t) K (t)
Al. Odobescu 17 10 3
Ciocanesti 186 6 0
Cuza Voda 939 925 0
Gradistea 261 40 0
Independenta 398 275 0
Valcelele 351 219 0
Vlad Tepes 85 0 0
Total 2,237 1,475 3

Assuming that in the case of the conventional agriculture, 20% of the applied nutrients are lost by leaching, the quantities discharged into waters are:
Nutrients subject to leaching WITHOUT PROJECT (t/year)
From factory made fertilizers
N (t) P (t) K (t)
447 295 0.6
Assuming the reduction of nutrients discharge with 10% as result of the adoption of environment-friendly agricultural practices demonstrated by the Project and the adoption of the Code of Good Agricultural Practices:
Reduction of nutrients discharge into the ground and
surface waters in year 2005 (t/year)
From factory made fertilizers
N (t) P (t) K (t)
44.7 29.5 0.06
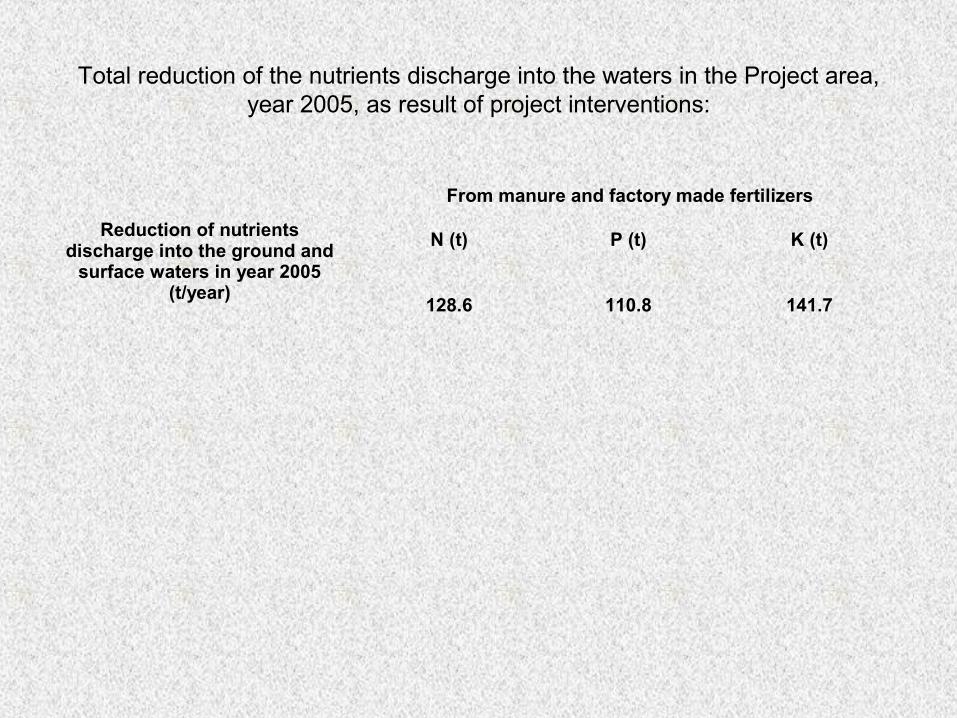
Total reduction of the nutrients discharge into the waters in the Project area, year 2005, as result of project interventions:
Reduction of nutrients discharge into the ground and
surface waters in year 2005 (t/year)
From manure and factory made fertilizers
N (t) P (t) K (t)
128.6 110.8 141.7

Thank you for your attentionThank you for your attention
Project Management Unit “Agricultural Pollution Control”
Tel: 0242.331.614; 0741.242.001; 021.317.04.03;Fax: 0242.331.619; E-mail: [email protected]; www.apcp.ro