household, gender, and travel gender, and travel s. sarmiento 3 ... while husbands spend only 1 hour...
TRANSCRIPT

35
Household, Gender, and TravelS. Sarmiento
3
Household, Gender,Household, Gender,and Traveland Travel
Sharon Sarmiento
Unison Consulting Group

37
Household, Gender, and TravelS. Sarmiento
HOUSEHOLD, GENDERHOUSEHOLD, GENDER, AND TR, AND TRAAVELVEL
INTRODUCTION
With air pollution and traffic congestion becoming a serious concern nationwide, policy makers haveexperimented with various programs and policies aimed at reducing travel, shifting travel away fromrush-hour peaks, and promoting carpooling and transit use. However, the travel demand managementprograms that have so far been implemented (e.g. ridesharing programs and staggered work hours)proved costly and ineffective in changing travel behavior. In most cases, the programs have targetedthe general working population, overlooking differences in the household circumstances and travelconstraints of different demographic subgroups — particularly, working women.
Transportation measures do not affect the population uniformly because each individual faces adifferent set of constraints. Some constraints are a function of income and other economic factors,and these have received considerable attention in the literature. Other constraints are a function ofhousehold composition, the male/female division of labor in the household, and the individual’s rolesin the household. These have received relatively little attention until recently.
Travel is part of a larger structure of household activities (Giuliano, 1992). We take trips to gogrocery shopping, to go to the bank, to take clothes to the dry cleaner, and to do many other errands.In bigger households, the constraints are even more complex. The circumstances of other householdmembers affect one’s travel choices. Children have to be shuttled to and from the school or day care.A sick family member has to be taken to the doctor. Some household activities need to be performedtogether with other household members. These impose additional constraints in scheduling individualactivities including travel. Gender is an issue to the extent that the division of labor in the householddiffers between men and women.
Section 2 examines the trends in the division of labor in the household between men and women.The household is a crucial aspect in understanding the environment of women’s travel. Understandingwomen’s roles in the household helps us put women’s travel behavior into context. Section 3 reviewsempirical findings on gender differences in travel patterns. Section 4 presents some results of anempirical test of the effect of household responsibility on travel behavior using Southern Californiacommuting data.
THE DIVISION OF HOUSEHOLD TASKS
Until recent decades, men and women adopted distinct economic roles. (Blau and Ferber, 1986,pp.14-66, and Becker, 1991, pp. 30-53, present interesting expositions on how these roles evolved.)Men worked outside the home, and were solely responsible for earning an income for the household.Women stayed home, and were solely responsible for managing household affairs. They kept theirhomes clean, cooked food, bore children and raised them.
Women’s Travel IssuesProceedings from the Second National Conference
38
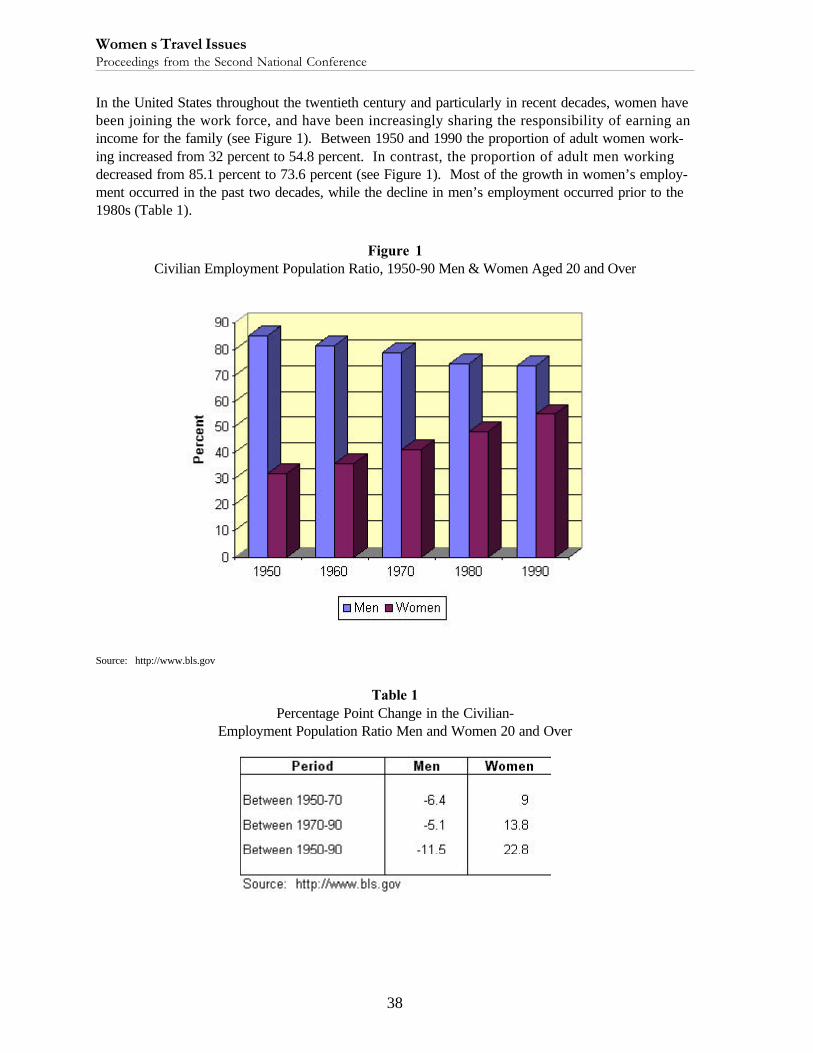
In the United States throughout the twentieth century and particularly in recent decades, women havebeen joining the work force, and have been increasingly sharing the responsibility of earning anincome for the family (see Figure 1). Between 1950 and 1990 the proportion of adult women work-ing increased from 32 percent to 54.8 percent. In contrast, the proportion of adult men workingdecreased from 85.1 percent to 73.6 percent (see Figure 1). Most of the growth in women’s employ-ment occurred in the past two decades, while the decline in men’s employment occurred prior to the1980s (Table 1).
Source: http://www.bls.gov
Table 1Percentage Point Change in the Civilian-
Employment Population Ratio Men and Women 20 and Over
Figure 1Civilian Employment Population Ratio, 1950-90 Men & Women Aged 20 and Over
39
Household, Gender, and TravelS. Sarmiento
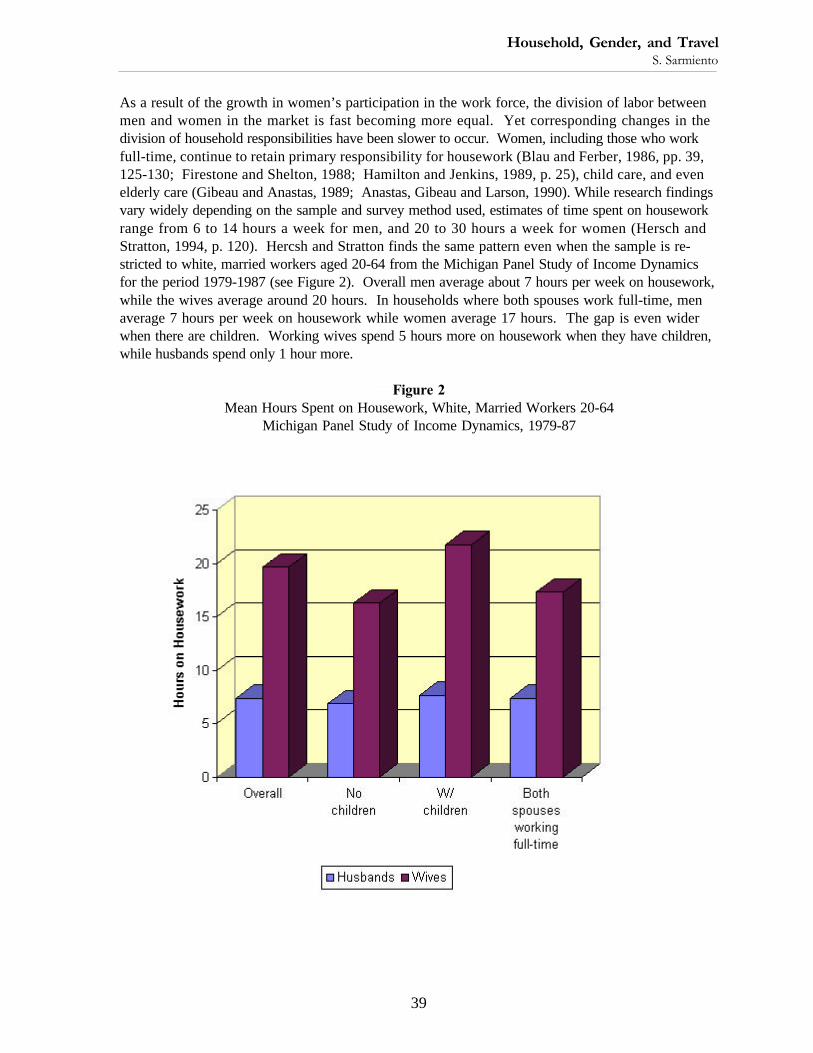
As a result of the growth in women’s participation in the work force, the division of labor betweenmen and women in the market is fast becoming more equal. Yet corresponding changes in thedivision of household responsibilities have been slower to occur. Women, including those who workfull-time, continue to retain primary responsibility for housework (Blau and Ferber, 1986, pp. 39,125-130; Firestone and Shelton, 1988; Hamilton and Jenkins, 1989, p. 25), child care, and evenelderly care (Gibeau and Anastas, 1989; Anastas, Gibeau and Larson, 1990). While research findingsvary widely depending on the sample and survey method used, estimates of time spent on houseworkrange from 6 to 14 hours a week for men, and 20 to 30 hours a week for women (Hersch andStratton, 1994, p. 120). Hercsh and Stratton finds the same pattern even when the sample is re-stricted to white, married workers aged 20-64 from the Michigan Panel Study of Income Dynamicsfor the period 1979-1987 (see Figure 2). Overall men average about 7 hours per week on housework,while the wives average around 20 hours. In households where both spouses work full-time, menaverage 7 hours per week on housework while women average 17 hours. The gap is even widerwhen there are children. Working wives spend 5 hours more on housework when they have children,while husbands spend only 1 hour more.
Figure 2Mean Hours Spent on Housework, White, Married Workers 20-64
Michigan Panel Study of Income Dynamics, 1979-87

Women’s Travel IssuesProceedings from the Second National Conference
40
Table 2Hours Spent on Housework per Week
The time men spend on housework tends to increase with the level of the wife’s education, employ-ment and earnings (Bumpass, 1990; Blair and Lichter, 1991). The time fathers spend on child carealso increases with the mother’s hours of work. Husbands and wives agree that the division ofhousehold tasks is unfair to working wives; it is most unfair when the wife works part-time(Bumpass, 1990; Dutchin-Eglash, 1988).
Evidence shows that women generally spent more time working at home compared to men. Howeverthe gap is narrowing down over time. Men are doing more housework than they used to, and womenare doing less. Robinson (1988) compiled the results of three comprehensive surveys of Americans’use of time. The Survey Research Center of the University of Michigan conducted two, one in 1965 andanother in 1975. The Survey Research Center of the University of Maryland conducted one in 1985.
Figure 3Overall Trends in Men and Women’s Housework 1965, 1975, and 1985

41
Household, Gender, and TravelS. Sarmiento
Overall men aged 18 to 65 spent 5.2 hours more on housework in 1985 than they did in 1965. On theother hand, women in the same age group spent 7.5 fewer hours on housework in 1985 compared to1965, as more of them took paying jobs and had fewer children. Hence, their share of the houseworkhas gone down from 85 percent in 1965 to 67 percent in 1985 (see Figure 3). What made the differ-ence? One, more women are working; and working women worked less at home than nonworkingwomen. Two, fewer households contain married couples. This has cut housework time overallbecause married women do much more housework than unmarried women (surprisingly even cohab-iting unmarried women (Shelton and John, 1993). But married women also worked fewer hours thanthey did in 1965 while their husbands worked more hours at home. Three, households now havefewer children (see Table 2).
DIFFERENCES IN MEN AND WOMEN’S TRAVEL PATTERNS
Research in the past two decades found significant differences in the travel patterns of men andwomen (Rosenbloom and Burns, 1989, p. 83), particularly among those who are married with children.The travel choices of women seem to reflect the need to juggle work and household responsibilities(Wachs, 1988; Hanson and Johnston, 1985).
Total trips
Analyzing 1990 National Personal Transportation Survey (NPTS) data, Rosenbloom (1994) finds thatwomen aged 16-64 years, in both urban and rural areas, made 6-9 percent more person trips per daythan men. Using the same data, Al-Kazily, Barnes and Coontz (1994) examine the effect of house-hold structure on men and women’s travel, and found that nonworking women over 35 years oldmade 70 percent more person trips than comparable men. Married women with dependents madeover 20 percent more person trips than their male counterparts. On the other hand, single womenwithout dependents made over 20 percent fewer person trips than single men.
Commute distance
Women make shorter work-trips (Hanson and Johnston, 1985; Wachs, 1988; Gordon, Kumarand Richardson, 1989; Rosenbloom and Burns, 1993; Rosenbloom, 1994; Al-Kazily, Barnes andCoontz, 1994). They generally earn lower incomes and work shorter hours, so it does not pay tocommute long distances (Madden, 1981). But most of all, they work closer to home because theyneed to balance work and household responsibilities, and promptly respond to family emergencies(Ericksen, 1977; Madden, 1981; Wachs, 1988; Johnston-Anumonwo, 1992; Rosenbloom,1994). Data from the 1967 Longitudinal Survey of Work Experience show that married women haveshorter commutes than unmarried women, and women’s commute distance tends to decrease with thepresence of children especially at younger ages (Ericksen, 1977).
Other researchers, however, do not find household concerns a cause of observed gender differencesin commuting distance. Using 1977 Baltimore Travel Demand Data, Hanson and Johnston (1985) findthat part-time or full-time work status, occupational group, and household responsibility do not explainobserved gender differences in commuting distance. Instead women’s lower incomes, their concen-tration in female-dominated occupations, and their greater reliance on the bus and auto-passen-ger modes explain women’s shorter work trip distances. In the extreme case, Gordon, Kumar and
Women’s Travel IssuesProceedings from the Second National Conference
42
Richardson (1989) find that women tend to have shorter worktrips regardless of marital status,household structure, income, occupation, travel mode, and location using 1977 and 1983 NPTS data.But married workers, especially those coming from two-worker households, generally have longerwork trips than unmarried workers. Kim (1993) provides a more thorough review of studies ongender differences in commuting distance.
Non-work trips
With the increased participation of women in the work force, market goods and services have becomeavailable to substitute for time spent on housework and child care. However, most of these goods andservices are geographically dispersed, so that part of the savings in housework time is offset by timespent on non-work travel (Pickup, 1989). One consistent finding in the literature is that women makemore non-work trips than men (Hanson and Hanson, 1980; Rosenbloom, 1988; Gordon, Kumar andRichardson, 1989; Prevedouros and Schofer, 1991). Employed married women in Sweden made moreshopping and domestic trips than their spouses, but fewer social and recreational trips (Hanson andHanson, 1980). Employed women in four Chicago suburbs made twice as many trips as comparablemen for errands, groceries, shopping, and chauffeuring children (Prevedouros and Schofer, 1991).
Trip chains
Linking different trips is called trip chaining. A chain can be simple or complex. Complex chains arechains between different anchors (e.g. home and work) consisting of more than one trip, or chainsbetween two like anchors (e.g. home and home) consisting of more than two trips (Al-Kazily, Barnesand Coontz, 1994). Single-person households are the most likely to form complex trip chains. Complexwork chains decrease and simple non-work chains increase with the number of persons in the house-hold. Single adults with young children have the highest propensity to form complex trip chains on theway to and from work. They are followed by single adults with school-age children, dual income coupleswithout children, and dual income couples with preschoolers (Strathman and Dueker, 1994; Al-Kazily,Barnes and Coontz, 1994).
Compared to men, women are more likely to trip chain on the way to and from work (Rosenbloom,1988; Rosenbloom, 1989; Strathman and Dueker, 1994; Al-Kazily, Barnes and Coontz, 1994). Basedon 1990 NPTS data, women make stops on their way to and from work 42 percent of the time, whilemen make stops 30 percent of the time. Even on non-work trips, women link trips 30 percent of thetime, while men do only 26 percent of the time (Strathman and Dueker, 1994).
Working mothers are more likely to link trips than working fathers. And they are more likely to linktrips when the children are younger. Based on 1982 and 1985 data from France, Netherlands and theUnited States, 65 percent of working women with children under six years old linked trips to work,while only 42 percent of comparable men did. Men’s trip chaining does not seem to be affected bychildren’s age (Rosenbloom, 1989).
Day-to-day Travel Variability
Based on a 1973 seven-day travel diary data from Reading, England, Pas and Koppelman (1987) findthat employed married women have substantially more variability in their day-to-day trip frequencies thanemployed married men. There is little difference in trip variability between employed single men andwomen.

43
Household, Gender, and TravelS. Sarmiento
Travel Mode
In choosing a travel mode, individuals often trade off money for time and flexibility. For example, womengenerally have lower incomes than men so that they may find cheaper modes like carpooling moreattractive. However, women with families and children traditionally have more domestic responsibilitiesand face more demands on their schedule. Therefore one would expect them to favor solo driving. Theevidence on women’s mode choices is mixed. The 1977 Baltimore Travel Demand Data used by Hansonand Johnston (1985) show more women relying on bus and auto-passenger modes. The 1990 SouthernCalifornia commuting data show that women carpool more than men (Brownstone and Golob, 1992).However, women carpooled mostly with household members rather than with other people (Teal, 1987).
The 1983 NPTS data show a higher proportion of women commuting by car, either as drivers orpassengers (Gordon, Kumar and Richardson, 1989). The 1990 and 1991 commuting data fromPhoenix and Tucson, Arizona show that women are more likely to drive alone than men because oftime pressures (Rosenbloom and Burns, 1992 and 1994). Working women with children are even moreauto dependent because their multiple obligations require them to combine work trips with nonworktrips. When asked about the effectiveness of policies designed to increase the use of alternativemodes, women were more responsive to those addressing domestic responsibilities, e.g. arrangementsfor child care and guaranteed rides home. Hence the findings on women’s mode choices are variedand location-specific. The mode choices depend a lot on the transportation options available in each location.
Trip scheduling
Southern California data show that women’s work trips are more clustered around the peak, comparedto men (Sarmiento, 1995). And this is particularly true for working women with children. Unmarriedmothers have the least flexibility in scheduling work trips (Gordon, Kumar and Richardson, 1989). Athird or more of all their daily work trips occur only within two hours, i.e., 7:00-8:00 a.m. and 4:00-5:00 p.m.
TESTING THE EFFECT OF THE HOUSEHOLD AND GENDER ON TRAVEL: SOMEEVIDENCE FROM SOUTHERN CALIFORNIA
The literature abounds with evidence of differences in the travel patterns of men and women, particu-larly among those who have families and children. Using data from the a survey of Southern Califor-nia Commuters, this study further examines differences in commuting patterns between men andwomen as a function of differences in household composition and household division of labor. Iestimate discrete choice models of side tripmaking, mode choice, and home-to-work departure times totest whether gender differences are statistically significant, and to determine precisely the contributionof household constraints in explaining gender differences in travel behavior.
The data come from the Panel Study of Southern California Commuters which was conducted by theInstitute of Transportation Studies (ITS) at the University of California, Irvine. The mail survey ranfrom 1990 to 1994 completing ten waves. The sample was employer-based. Half of the respondentsworked at the Irvine Business Complex, a diversified employment center near Orange CountyAirport, and the remaining half worked elsewhere throughout the Greater Los Angeles Area.I use data from the first wave of survey which was conducted in February 1990. The first waverespondents were over 2,200, about equally divided between men and women. Men and women who

Women’s Travel IssuesProceedings from the Second National Conference
44
live only with other adults constitute more than half of the sample; and those who live with childrenconstitute about a third. Most of the respondents drove alone on their most recent trip, and less thanone-fifth carpooled to work. Most of the respondents live or work in Orange County where publictransit is not a popular mode, and so bus riders constituted an insignificant proportion. Hence I focusonly on the choice between solo driving and carpooling, and among different carpool alternatives inexamining mode choice.
SIDE TRIPS
Table 3 shows the results of a reduced-form binomial logit model of side trips. Positive coefficientsincrease the probability of making a side trip. Gender differences in the probability of making a sidetrip arise mainly from the differential effects of household composition between men and women.For example, the presence of children increases the probability of making a sidetrip for women, buthas no effect for men. The presence of another adult in the household generally decreases theprobability of making a side trip for men, but not for women. Given the same number of adults, thepresence of other workers in the household increases the probability of making a side trip, but not forwomen. In other words, a man with a nonworking adult household member, say, a wife, can get hiswife to make most of his side trips; but a woman with a nonworking adult member in her householddoes not get a similar advantage. These results confirm that gender differences in side trip makingarise mainly from gender differences in household division of labor.
Age, education, and household income are unimportant in explaining the incidence of side trips.Race seems to matter — nonwhites show a lower probability of making a side trip. The other factorsthat explain side trip making are work schedule and commute characteristics. Commuters who go towork in the morning and those whose work schedules change everyday are more likely to make a sidetrip. Those who commute longer distances are less likely to make a side trip.
Mode Choice
Table 4 shows the results of a reduced-form multinomial logit model of mode choice. I consider thefollowing alternatives: drive alone, drive with a household member, ride with a household member,driver with a non-household member, and ride with a non-household member. Table 4 showsestimates for the different carpooling alternatives with the drive alone alternative as reference.Positive coefficients increase the probability of an individual choosing a specific carpooling alterna-tive compared to driving alone. On the other hand, negative coefficients decrease the probability ofcarpooling, and hence, increase the probability of driving alone.
In general, gender differences are significant only when choosing between solo driving and riding withfamily; and they are explained fully by interaction with the presence of other adults in the house-hold. Having children makes both men and women drive with family, and the presence of otherworkers makes them drive with family and ride with others.
Commuters are less likely to carpool with family members or ride with others when there are manycars available. In general, they are less likely to carpool when they have a fixed work schedule andtheir schedule changes everyday. They are more likely to carpool when they commute long distancesand, in some cases, when carpooling incentives are available.

45
Household, Gender, and TravelS. Sarmiento
HOME-TO-WORK DEPARTURE TIME
Table 5 shows the results of a reduced-form multinomial logit model of home-to-work departure times.I consider the following morning departure times: before 6:00, 6:00 to 6:59, 7:00 to 7:59, 8:00 to 8:59,9:00 and after. The reference departure time is 7:00 to 7:59, which corresponds to the peak period inthe sample. Positive coefficients increase the probability of an individual choosing the correspondingdeparture time compared to the sample peak period. Negative coefficients favor commuting duringthe peak period.
Table 4Conditional Logit Model of Mode Choice (The Reference is Driving Alone)

Women’s Travel IssuesProceedings from the Second National Conference
46
In general, gender and household composition are unimportant in explaining home-to-work departuretimes. Departure times are explained mainly by occupation, work characteristics, commute characteristics,and demographic characteristics such as age, income and education. Those in management/adminis-tration, secretarial/clerical, and professional/technical occupations are more likely to commute duringthe peak period over any other times. Those who work full time and have fixed schedules are morelikely to leave between 7:00 and 7:59 a.m. than later. Those who work in large worksites, carpool, usefreeways, and commute long distances are more likely to leave before 6:00 a.m.
Table 5Conditional Logit Model of Morning Home to Work Departure Time

47
Household, Gender, and TravelS. Sarmiento
SUMMARY AND CONCLUSION
Different demographic subgroups face different circumstances and constraints that could affect their travelbehavior. Working women, in particular, often face income and social constraints arising from the multiplic-ity of roles in the market and in the household. Although the division of labor between men and women isfast becoming more equal, corresponding changes in the division of household responsibilities have beenslower to occur. Women continue to retain primary responsibility for housework. However, the gap isnarrowing down over time. Men are doing more housework than they used to, and women are doing less.
Research in the past two decades found significant differences in the travel patterns of men and women,particularly among those who are married with children. The findings on women’s travel choices seem toreflect women’s need to juggle work and household responsibilities. Women made more trips than men.They make shorter commute trips, and more nonwork trips. Women are more likely to trip chain on theway to and from work, especially when they have younger children. Employed married women showmore variability in their day-to-day trip frequencies than employed married men. The findings on women’smode choices are mixed and location-specific; they must depend largely on the transportation optionsavailable in each location. Women’s work trip schedules tend to be more clustered around the peak; andthis particularly true for women with children.
The discrete choice models using Southern California data help explain the different determinants of travelbehavior, and clarify observed differences in travel behavior between men and women with differenthousehold composition. The results show significant gender differences in the probability of making a sidetrip. And these gender differences arise mainly from the differential effects of household composition onmen and women. In particular, having children increases the probability of making a side trip for women,but not for men. Men are less likely to make a side trip when there is another adult in the household,especially when the other adult does not work. Women do not seem to have a similar advantage.
In general, gender differences are significant only when choosing between solo driving and riding withfamily; and they are explained fully by interaction with the presence of other adults in the household.Having children makes both men and women drive with family, and the presence of other workers makesthem drive with family and ride with others. Mode choice is largely determined by the number of carsavailable in the household, work characteristics, commuting distance, the presence of carpooling incentives,and individual characteristics such as age, income, eduction and race.
In general, gender and household composition are unimportant in explaining home-to-work departure times.Departure times are explained mainly by occupation, work characteristics, commute characteristics, anddemographic characteristics such as age, income and education. The results are useful in assessing thedistributional impact of policy. They are also useful to policymakers in designing programs and policies thatare more responsive to individual circumstances.

Women’s Travel IssuesProceedings from the Second National Conference
48
REFERENCESAl-Kazily, Joan, Carol Barnes and Norman Coontz (1994). “Household Structure and
Travel Behavior.” NPTS Demographic Special Reports. Washington, D.C.:Federal Highway Administration.
Anastas, Jeane W., Janice L. Gibeau, and Pamela Larson (September 1990). “WorkingFamilies and Eldercare: A National Perspective in Aging America.” Social Work,Vol. 35, No. 5, pp. 405-411.
Apogee Research, Inc. (January 1994). Costs and Effectiveness of Transportation ControlMeasures (TCMs): A Review and Analysis of the Literature. Report prepared for:
The Clean Air Project, National Association of Regional Councils. Bethesda,Maryland.
Becker, Gary S. (September 1965). “A Theory of the Allocation of Time.” TheEconomic Journal. Vol. 75, No. 299, pp. 493-517.
Becker, Gary S. (1991). A Treatise of the Family. Cambridge, Massachusetts: HarvardUniversity Press.
Blair, S.L. and D.T. Lichter (1991). “Measuring the Division of Household Labor.”Journal of Family Issues. Vol. 12, No. 1, pp. 91-113.
Blau, Francine D. and Marianne A. Ferber (1986). The Economics of Women, Men, andWork. Englewood Cliffs, New Jersey: Prentice-Hall.
Brownstone, David and Thomas F. Golob (1992). “The Effectiveness of RidesharingIncentives: Discrete-Choice Models of Commuting in Southern California.”Regional Science and Urban Economics, Vol. 22, pp. 5-24.
Bruzelius, N. (1979). The Value of Travel Time. London: Croom Helm.
Bumpass, Larry L. (November 1990). “What’s Happening to the Family? Interactionsbetween Demographic and Institutional Change.” Demography, Vol. 27, No. 4,pp. 483-498.
Cameron, Michael (March 1991). Transportation Efficiency: Tackling SouthernCalifornia’s Air Pollution and Congestion. Report prepared for the NationalEnvironmental and Defense Fund and the Regional Institute of SouthernCalifornia.
Dutchin-Eglash, S. (1988). Housework and the Division of Household Labor: 1987-1988. Unpublished Masteral thesis, University of Wisconsin-Madison, Dept. ofSociology.
Ernst and Young (August 1992). Regulation XV Cost Survey. Report prepared for theSouth Coast Air Quality Management District.
49
Household, Gender, and TravelS. Sarmiento
Ericksen, Julia A. (1977). “An Analysis of the Journey to Work for Women.” SocialProblems. Vol. 24, pp. 428-435.
Firestone, J. and B. A. Shelton (1988). “An Estimation of the Effects of Women’s Workon Available Leisure Time.” Journal of Family Issues. Vol. 9, No. 4, pp. 478-395.
Gershuny, Jonathan and John P. Robinson (November 1988). “Historical Changes in theHousehold Division of Labor.” Demography. Vol. 25, No. 4, pp. 537-552.
Gibeau, Janice L. and Jeane W. Anastas (1989). “Breadwinners and Caregivers:Interviews with Working Women.” Journal of Gerontological Social Work, Vol.14, No., 1/2, pp. 19-40.
Giuliano, Genevieve (Summer 1992). “Transportation Demand Management: Promise orPanacea?” Journal of American Planning Association, Vol. 58, No. 3, pp. 327-435.
Giuliano, Genevieve and Thomas F. Golob (1990). “Staggered Work Hours for TrafficManagement: A Case Study.” Transportation Research Record 1280, pp. 46-58.
Giuliano, Genevieve and Martin Wachs (1992). An Employer Panel for Evaluating theEffectiveness of Trip Reduction Incentives. Paper prepared for the First U.S.Conference on Panels for Transportation Planning, Lake Arrowhead, California.
Gordon, Peter, Ajay Kumar and Harry Richardson (1989). “Gender Differences inMetropolitan Travel Behavior.” Regional Studies, Vol. 23, No. 6, pp. 499-510.
Gramm, Wendy Lee (March 1975). “Household Utility Maximization and the WorkingWife.” American Economic Review. Vol. 65, No. 1, pp. 90-100.
Gronau, Reuben (1986). “Home Production - A Survey.” In Handbook of LaborEconomics, Vol. 1, edited by Orley Ashenfelter and Richard Layard. New York:North Holland.
Hamilton, Kerry and Linda Jenkins (1989). “Why Women and Travel.” In Gender,Transport and Employment, edited by Margaret Grieco, Laurie Pickup, andRichard Whipp. Vermont: Gower Publishing Company.
Hanson, Susan and Perry Hanson (1980). “The Impact of Women’s Employment onHousehold Travel Patterns: A Swedish Example.” In Women’s Travel Issues,edited by Sandra Rosenbloom. Washington, D.C.: U.S. Government PrintingOffice.
Hanson, Susan and Ibipo Johnston (1985). “Gender Differences in Work Trip Lengths:Implications and Explanations.” Urban Geography, Vol. 6, No. 3, pp. 193-219.
Hersch, Joni and Leslie S. Stratton (1994). “Housework, Wages, and the Division of HouseworkTime for Employed Spouses.” American Economic Review, Vol. 84, No.2, pp. 120-125.
Women’s Travel IssuesProceedings from the Second National Conference
50
Hogg, Robert V. and Elliot A. Tanis (1983). Probability and Statistical Inference. NewYork: Macmillan Publishing Co., Inc.
Juster, F. Thomas (1985). “A Note on Recent Changes in Time Use,” in Time, Goods,and Well-Being, edited by F. Thomas Juster and Frank P. Stafford. Ann Arbor:Institute for Social Research, The University of Michigan.
Kim, Seyoung (1993). “Gender Differences in Commuting: An Empirical Study of theLos Angeles Metropolitan Area.” In Commuting Behavior of Two-WorkerHouseholds in the Los Angeles Metropolitan Area. Unpublished Ph.D.dissertation, University of California, Irvine, Department of Economics.
Madden, Janice F. (1981). “Why Women Work Closer to Home.” Urban Studies, Vol. 18,pp. 181-194.
MVA Consultancy, Institute of Transport Studies of the University of Leeds, andTransport Studies Unit of the University of Oxford (1987). The Value of TravelTime Savings: A Report of Research Undertaken for the Department ofTransport. Newburry, England: Policy Journals.
Norusis, Marija J./SPSS Inc. (1992). SPSS for Windows Base System User’s Guide,Release 5.0. Chicago: SPSS Inc.
Orski, C. Kenneth (1990). “Can Management of Transportation Demand Help Solve ourGrowing Traffic Congestion and Air Pollution Problems?,” TransportationQuarterly, Vol. 44, pp. 483-498.
Papoulis, Athanasios (1990). Probability and Statistics. Englewood Cliffs, New Jersey:Prentice Hall.
Pas, Eric I. and Frank S. Koppelman (1987). “An Examination of the Determinants ofDay-to-Day Variability in Individuals’ Urban Travel Behavior.” Transportation.Vol. 14, pp. 3-20.
Pickup, Laurie (1989). “Women’s Travel Requirements: Employment, with DomesticConstraints.” In Gender, Transport and Employment, edited by Margaret Grieco,Laurie Pickup, and Richard Whipp. Vermont: Gower Publishing Company.
Pisarski, Alan (July 1992). Nationwide Personal Transportation Survey Travel BehaviorIssues in the 90’s. Paper prepared for the Office of Highway InformationManagement, Federal Highway Administration, US Department of Transportation.Falls Church, Virginia.
Prevedorous, Panos D. and Joseph L. Schofer (1991). “Trip Characteristics and TravelPatterns of Suburban Residents.” Transportation Research Record 1328.Transportation Research Board, National Research Council, Washington, D.C.

51
Household, Gender, and TravelS. Sarmiento
Quarmby, D. A. (1967). “Choice of Travel Mode for the Journey to Work,” Journal ofTransport Economics and Policy, 1, 273-314.
Robinson, John P. (1988). “Who’s doing the Housework?” American Demographics, Vol. 10, No.12, pp. 24-28.
Rosenbloom, Sandra (1988). “The Impact of Growing Children on their Parents’ TravelBehavior: A Comparative Analysis.” Transportation Research Record 1135.Transportation Research Board, National Research Council, Washington, D.C.,pp. 17-25.
Rosenbloom, Sandra (1989). “Trip-Chain Behaviour: A Comparative and Cross-CulturalAnalysis of the Travel Patterns of Working Mothers.” In Gender, Transport and
Employment, edited by Margaret Grieco, Laurie Pickup, and Richard Whipp.Vermont: Gower Publishing Company.
Rosenbloom, Sandra (1994). “Travel by Women.” NPTS Demographic Special Reports.Washington, D.C.: Federal Highway Administration.
Rosenbloom, Sandra and Elizabeth Burns (1992). “Gender Differences in CommuterTravel in Tucson: Implications for Travel Demand Management Programs.”Transportation Research Record 1404. Transportation Research Board, NationalResearch Council, Washington, D.C., pp. 82-90.
Rosenbloom, Sandra and Elizabeth Burns (1994). Why Working Women Drive Alone:The Implications for Travel Reduction Programs. Paper prepared for the 1994Annual Meeting of the Transportation Research Board.
Sarmiento, Sharon (1995). Studies in Transportation and Residential Mobility. Ph.D.Dissertation, University of California, Irvine, Department of Economics.
Shelton, Beth Anne and Daphne John (1993). “Does Marital Status Make a Difference? HouseworkAmong Married and Cohabiting Men and Women.” Journal of Family Issues, Vol. 14, No. 3,pp. 401-420.
Small, Kenneth and Camilla Kazimi (1994). “On the Costs of Air Pollution from Motor Vehicles.”Journal of Transport Economics and Policy (forthcoming in 1995).
South Coast Air Quality Management District (March 1989). Air Quality ManagementPlan. El Monte, California.
Strathman, James and Kenneth Dueker (1994). “Understanding Trip Chaining.” NPTSDemographic Special Reports. Washington, D.C.: Federal HighwayAdministration.
Talvitie, A. (1972). “Comparison of Probabilistic Modal Choice Models: EstimationMethods and System Inputs,” Highway Research Record Number 392,Washington, D. C., Highway Research Board.
Women’s Travel IssuesProceedings from the Second National Conference
52
Teal, Roger F. (1987). “Carpooling: Who, How and Why.” Transportation Research21A, pp. 203-214.
Train, K. (1986). Qualitative Choice Analysis. Cambridge, Mass.: MIT Press.
Urban Mass Transportation Administration, US Department of Transportation (February1990). Evaluation of Travel Demand Management Measures to Relieve Congestion. Report No. FHWA-SA-90-005, Washington, D.C.
Wachs, Martin (1987). “Men, Women, and Wheels: The Historical Basis of SexDifferences in Travel Patterns.” Transportation Research Record 1135,Transportation Research Board, National Research Council, Washington, D.C, pp.10-16.
Wachs, Martin (1990). “Transportation Demand Management: Policy Implications ofRecent Behavioral Research.” Journal of Planning Literature, Vol. 5, No. 4, pp.333-341.
Wachs, Martin and Genevieve Giuliano (November 1991). “Regulation XV - Beginning toShow Results.” ITS Review, Vol. 15, No. 1, pp. 3-6.