gender, health and trade-offs in older adults' housework patterns
TRANSCRIPT

1
Somebody has to DUST! Gender, Health, and Housework in Older Couples
Claudia Geist
Jennifer Tabler
Kelli Rasmussen
University of Utah
Early draft version
DO NOT CITE
Corresponding author:
Claudia Geist, Department of Sociology, University of Utah, 380 S 1530 E Salt Lake City, UT
84112, [email protected]
2
Somebody has to DUST! Gender, Health, and Housework in Older Couples
Abstract:
This study seeks to examine the link between physical health and housework performance
among older adult couples. Following retirement or withdrawal from the paid labor force, many
of the standard arguments about relative resources and time availability no longer hold. This
study examines whether older couples “do gender” even as we take into account the health of
both spouses. This allows us to explore to what extent health limits men’s and women’s
housework time and the division of labor across key household tasks.
Running Head:
Gender, Health, and Housework
Keywords:
Older adults Couples Housework Health
Acknowledgement: The collection of data used in this study was partly supported by the
National Institutes of Health under grant number R01 HD069609 and the National Science
Foundation under award number 1157698.
3
Somebody has to DUST! Gender, health, and housework in older adults
Introduction
Housework is part of most individuals’ daily lives. A large body of research has
examined what shapes individuals’ housework patterns and how couples divide the division of
labor. For young and middle aged men and women, (relative) financial resources, time
availability, and gender are key predictors. Less is knows about predictors of housework once
older adults are no longer in the labor force and labor earnings and time in paid work are no
longer useful concepts. As health problems increase in older adults, we explore the extent to
which health is a useful predictor of housework time and heterosexual couples’ division of labor
in the home. Understanding how health shapes couples’ household patterns and to what extent
husbands’ and wives’ health has a different impact is interesting from a theoretical perspective
but also from a practical standpoint as practitioners who encounter older adults can learn how
spouses’ health shapes especially the level of responsibilities at home.
Gender and Housework
There is extensive research on the topic of the domestic division of labor, especially for
adults in prime working age (Bianchi & Spain, 1999), young adults transitioning from
cohabitation to marriage (Baxter, Haynes, & Hewitt, 2010; Furstenberg Jr, 2010), or couples
transitioning to parenthood (Goldberg & Perry-Jenkins, 2004; MacDermid, Huston, & McHale,
1990). Although it depends on the sociopolitical context (Geist and Cohen 2011) and the gender
gap is narrowing, women do more housework than men (Bianchi et al. 2000; Bianchi et al.
2012).

4
We know less about the housework patterns of older adults, mainly because the key
mechanisms that shape the division of labor within couples are closely linked to (relative)
financial resources in the form of earnings from paid labor, time availability as determined by the
time spent on paid work, and adherence to or conforming to ideas of masculinity or femininity,
in the form of “doing gender” through performance of household chores (West and Zimmerman
1987). Less is known about “doing gender” in older adults. Leopold and Skopek (2015) discuss
two competing arguments that predict how the contribution from both men and women (in
heterosexual couples) changes as one or both transition into retirement. One argument, the
convergence hypothesis” suggests that as time availability and relative resources become more
equal, contributions to the domestic labor also becomes more equal. Dorfman and Heckert
(1988) find that the segregation of housework tasks was reduced post retirement (see also
Szinovacz and Harpster 1994).
A competing argument, the “continuity hypothesis”, suggests that there is a high level of
stability to established patterns “(Leopold and Skopek 2015). The notion is that housework
patterns are largely independent of economic and time constraints and a site of “doing gender”
regardless of age (West and Zimmerman 1987). Solomon et al. (2004) find that retirement did
not substantively change the way couples divide their housework chores.
Overall, there is relatively little examination of housework patterns among older couples
post their labor market exit. Even in “decade reviews” of aging and family life (i.e. Streib and
Beck 1980; Silverstein and Giarrusso 2010), the topic of housework is only noted in the context

5
of men increasing the housework participation in response to becoming widowers (Utz et al.
2004), or in the form of housework support by kin.
Health and Housework
Prior research has linked inequity in housework to depressive symptoms (Glass and
Fujimoto 1994). Women are performing housework past the point of psychological benefit; men
are not (Bird 1994; Ross, Mirowsky, and Huber 1983). Although inequality in housework seems
to have negative effects, housework may have positive effects on physical health (Everard et al.
2000). The positive health effects seems to hold for those who perform up to 60 percent of the
housework, which is a relatively equal division of labor (Ross and Bird 1994). Although most
research studies have primarily focused on those who are in the paid labor force, there is also
limited evidence that suggests housework has positive effects for retirees (Szinovacz 1992).
Research on health limitations and housework has often focused on the role caregivers
play to support in the form of doing housework chores for the person who is too sick to perform
them.
The present study
In this study, we focus on individuals who are healthy enough to live idndependly and
seek to link their health and the health of their partners to their performance of housework and
the division of labor between spouses. Specifically, we examine the domestic labor patterns of
older, heterosexual couples who are not in the labor force. We test to what extent health limits
housework in gendered ways, whether the health of both husbands and wives affects housework
patterns This is particularly import since relative financial resources and time available

6
explanations, a key component to understanding the division of labor in couples, are not
necessarily pertinent to this population. To the extent that housework patterns are largely
explained by gender, that is gender roles and housework as an reaffirmation of gender identities
rather than “objective” factors we would expect health to have a very modest effect.
Health as limitation for housework:
H1a: Poorer health is associated with less housework to a similar extent for both men and
women
Health as gendered limitation for housework:
H1b: Men’s health problems will reduce their housework performance more strongly than
women’s health problems.
Doing gender hypothesis
H2: Women do more housework than men, regardless of their level of health.
Data and Analytic strategy
We use data from the 2009 and 2013 Disability and Use of Time supplement to the Panel
Study if income dynamics (Freedman and Cornman 2014). For the present study, we restrict our
sample to heterosexual couples where both partners are not working for pay, and both partners
are age 60 or older. Respondents and couples have two diary data points within the same week,
but health and the division of labor (see below) was ascertained only once. Our final sample
contains 885 couple data points for time diary data. For division of labor items only one data
point per couple was available (depending on task up to 450).

7
Dependent variables
The first dependent variable is the amount of time spent on housework tasks. This
measure is designed to be in accordance with the American Time Use Survey and is broad, in
that is includes all activities categorized as “household chores/helping others”.
The second set of dependent variables focuses more narrowly on housework and
combines husbands’ and wives’ reports of their performance of six housework tasks (doing
laundry, preparing dinner, cleaning house, grocery shopping or running errands, paying bills or
handling banking, handling minor repairs or home improvement). Valid response options
included none/not performed in the last week, on 1-2 days, 3-4 days, 5 or more days. Based on
these options we created a measure that indicates whether both spouses do a similar amount of
the task, whether the wife does more, or whether the husband does more.
TABLE 1 ABOUT HERE
Key independent variable: Health
We examine three dimensions of health: physical limitations, level of energy, and
functional limitations. Respondents could indicate whether they had any of the following health
problems (breathing, heart/circulation, stomach, back/neck, shoulders/arms/hands,
hip/leg/knee/feet). For each possible problem, respondents who indicated they experienced
limitations due the issue on 1-2 out of last 7 days were assigned a value of 1, if they experienced
limitations on 3 or more days they were assigned the value of 2. The physical limitations
measure we use is based on the sum across all possible health problems.
The energy measure indicates how frequently (in the last 7 days) low energy or
exhaustion limited daily activities. Response options ranged from 0 (no low energy in last 7
days) to 4 (limitations due to low energy or exhaustion on 5+ days).

8
TABLE 2 ABOUT HERE
The functional limitations measure is based on how many of the following limitations the
respondent experience: serious difficulty hearing, seeing (even when wearing glasses),
concentrating, remembering or making decisions, walking or climbing stairs, dressing or bathing,
doing errands alone).
Controls
We include controls for spouses’ age (centered around the mean for husbands and wives),
year of survey (2009 vs 2013), and, for time diary analyses, day of diary (see Table 1). Future
version of this paper will included an expanded set of controls.
Analytic approach
In the first step, we model the amount of time women and spend performing household
chores. Using clustered OLS regressions, we adjust standard error because most respondents
have two data points for the dependent variable (from two time diaries within the same week). In
a second step, we estimate multinomial logistic regressions that predict a couple’s division of
labor as a function of husbands’ and wives’ health.
Findings
We find that all three dimensions of health we examine shape the gender gap in
housework time (see Table 3). As expected, the poorer wives’ health, the smaller the gender gap
in housework, the worse a husbands’ health, the larger the gender gap. The results also provide
support for the doing gender hypothesis H2. However, the fact that both men’s and women’s
heath issues significantly affect the gender gap in housework time provides initial support for
H1a.

9
TABLE 3 ABOUT HERE
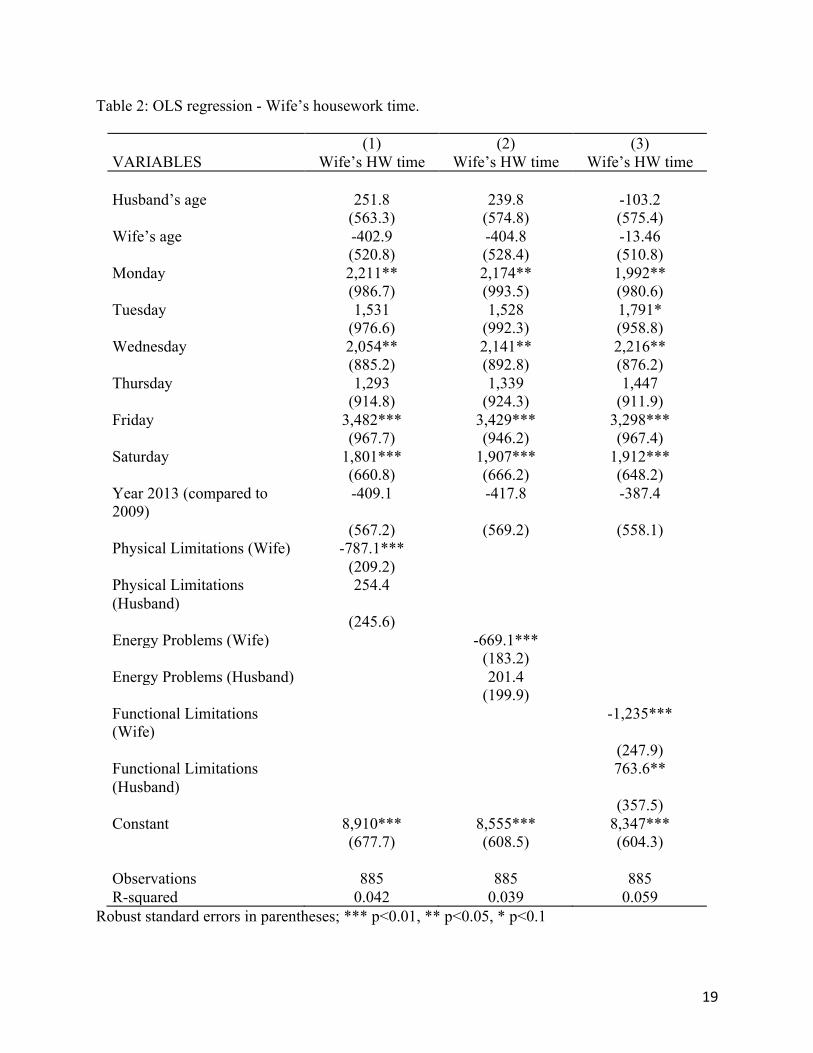
Next, we look at wives’ and husbands’ housework performance separately (see Table 4
and 5). We find that women’s physical health problems and level of energy reduce women’s
housework time, but their husbands’ health problems do not increase the time they spend. When
it comes to functional limitations both are significant. Women’s functional limitations and men’s
functional limitations reduce housework time.
TABLE 4 ABOUT HERE
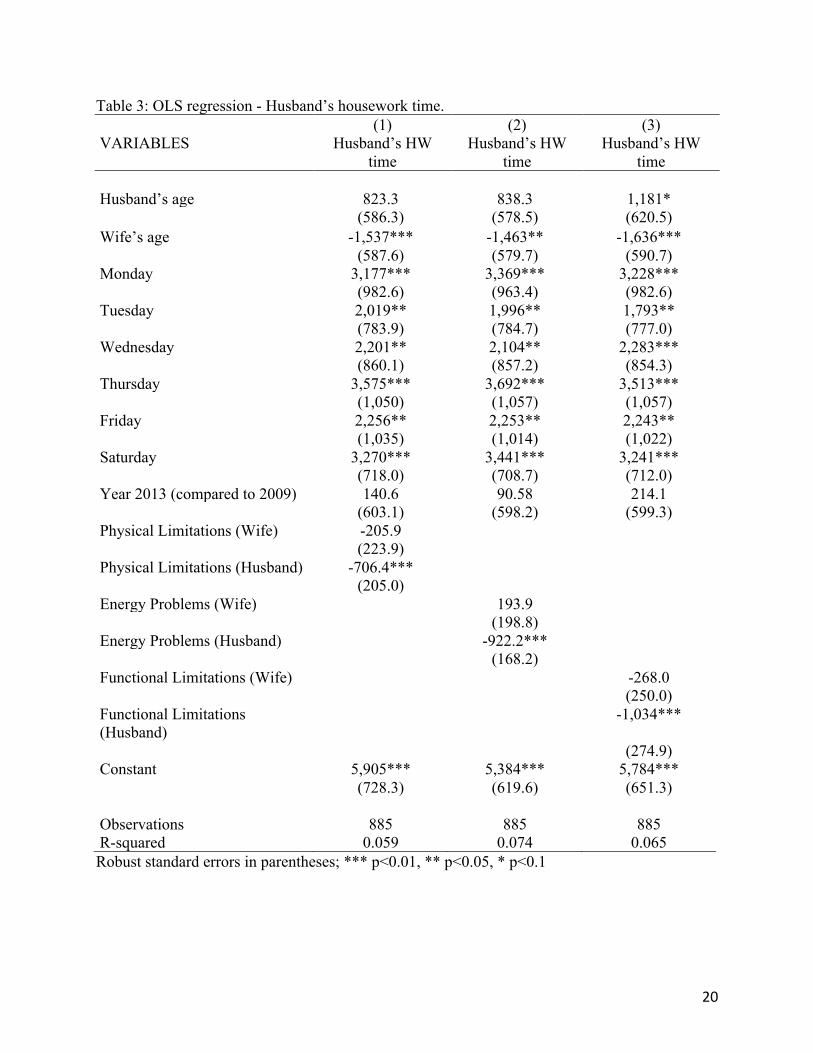
When we look at men’s housework time the picture is quite different. Only men’s health
issues, functional limitations or energy level in particular, affect their housework time. However,
their wives’ health does not significantly affect their housework patterns at all. Overall, the
results do not provide additional support for the doing gender hypothesis H2 since both men and
women reduce their housework efforts in repose to their own health. However, given that men’s
health problems may increase women’s housework performance, yet women’s health problems
do not affect men’s housework performance, suggests a stronger effect of men’s health (H1b).
In short, men’s health does not only affect their own housework but that of their partners.
TABLE 5 ABOUT HERE
In a second analytic step we look at the division of labor between spouses across six
different tasks. The most female dominated task is laundry. As the number of women’s health
problems increases, the probability of the wife doing more laundry decreases and the probably of
equal division of labor (and, to some extent, the probability of men doing more laundry than
women) increases. But up until the maximum number of possible reported health problems,

10
women doing laundry on more days than men, is still is the outcome with the greatest
probability. This provides strong support for the doing gender hypothesis H2.
FIGURE 1 ABOUT HERE
The division of who does laundry was mostly unaffected by women’s energy (men’s
energy also did not have a clear effect, results not shown), but physical and functional limitations
shaped the probability of who does more. The number of functional limitations had the most
dramatic effect. As with the number of limitations, the probability of women doing more laundry
than men decreases. Once wives have four or more functional limitations, the probability of men
doing more laundry than their wives exceeds that of equal sharing.
The effect of men’s health decreases men’s participation, more so or similar to women’s
health. These results support H1b, as men’s health seems to shift the predicted division of labor
more than women’s health, but there is also evidence for H2, as there are clear limitations in the
way health affects housework performance.
Although typically considered “female” tasks, in our sample of older adults who do not
work for pay, cleaning house and preparing dinner were more egalitarian than laundry duties. As
wives’ health problems become more numerous, couples are predicted to share dinner duties
equally, and the probability that the wife is mostly responsible for dinner duties declines. This
pattern in similar across three three measures of health. The effect of functional limitations
stands out: as wives’ number of functional limitations increase, the probability of men preparing
dinner on more days than their wives increases more dramatically than for other measures of
health. Men’s health has very limited effect on the predicted division of labor for dinner
preparation. It seems that women’s health has a stronger effect than that of men’s’ health. Again,
11
although there is some evidence that health can limit women’s housework performance, gender
trumps health (in line with H2).
FIGURE 2 ABOUT HERE
Cleaning, by comparison, is more egalitarian that the previous two tasks. The probability
that both partners do a similar amount of cleaning is fairly constant across the number of
women’s health problems. The probability that the wife does more cleaning slightly decrease as
wives’ health worsens. But only for the most dramatic measure of health, functional limitations,
did wives’ health problems increase the probability that men do more cleaning than their wives.
The effects of men’s health on the who does more of the cleaning is very similar across all
dimensions of health, but most pronounced for functional functional limitations. As men’s
functional l limitations increase, the probably that they participate equally in cleaning drops
substantially.
FIGURE 3 ABOUT HERE
Paying bills and baking is a chore that does not seem to vary very much based on
women’s physical health or (lack of) energy, with functional limitations as the only exception.
For bill paying there is an “earlier” trade-off between spouses, in that as wives have more than
two limitations, men’s primary responsibility is the outcome with the greatest probability. The
probability of women taking over bill paying does not increase to the same extent as their
husbands’ health limitations increase, which fails to support either H1a or H1b.
FIGURE 4 ABOUT HERE
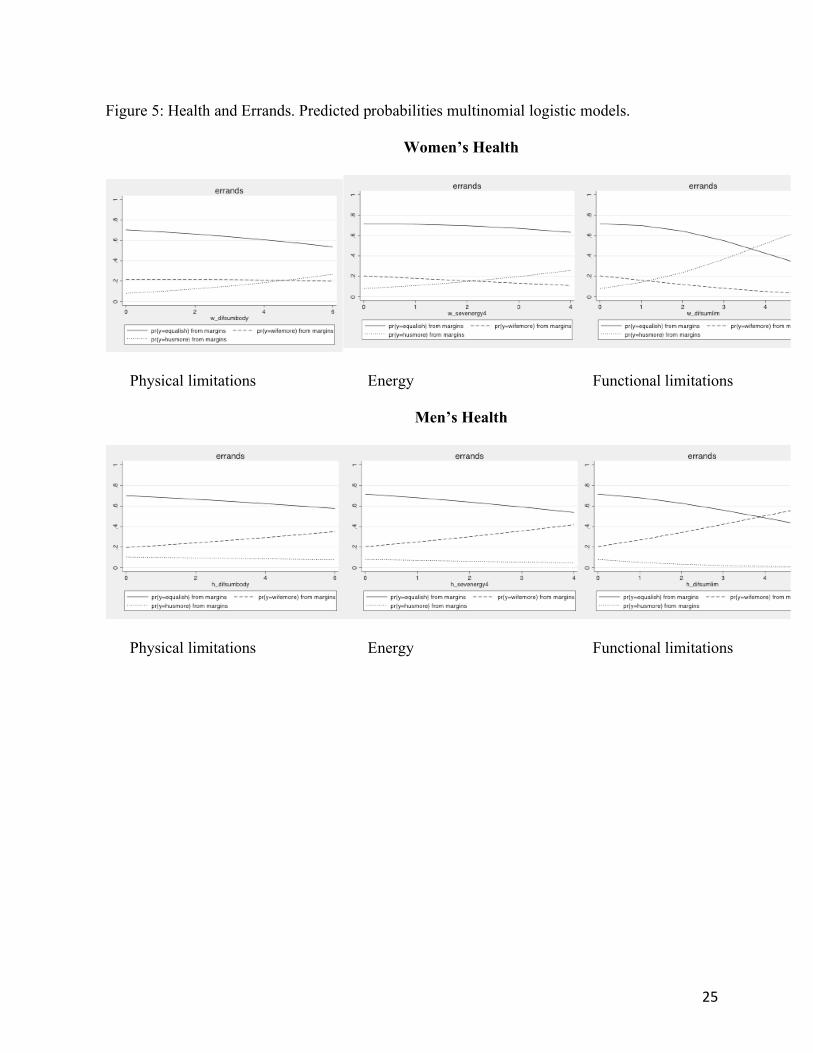
Who runs errands is not very reactive to the number of women’s physical limitation or
level of energy. An equal division of labor is the most likely outcome at all levels of health. As

12
before, functional limitations have a stronger effect - in couples where wives have four or more
physical limitations, husband’s primary responsibility is more likely than equal sharing.
This pattern is repeated for men’s health –the probably of equal sharing decreases as
men’s health gets worse, and the probability of women doing more errands increases roughly to
the same extent than men’s responsibility for errands increases as women’s’ health declines
(which supports H1a).
FIGURE 5 ABOUT HERE
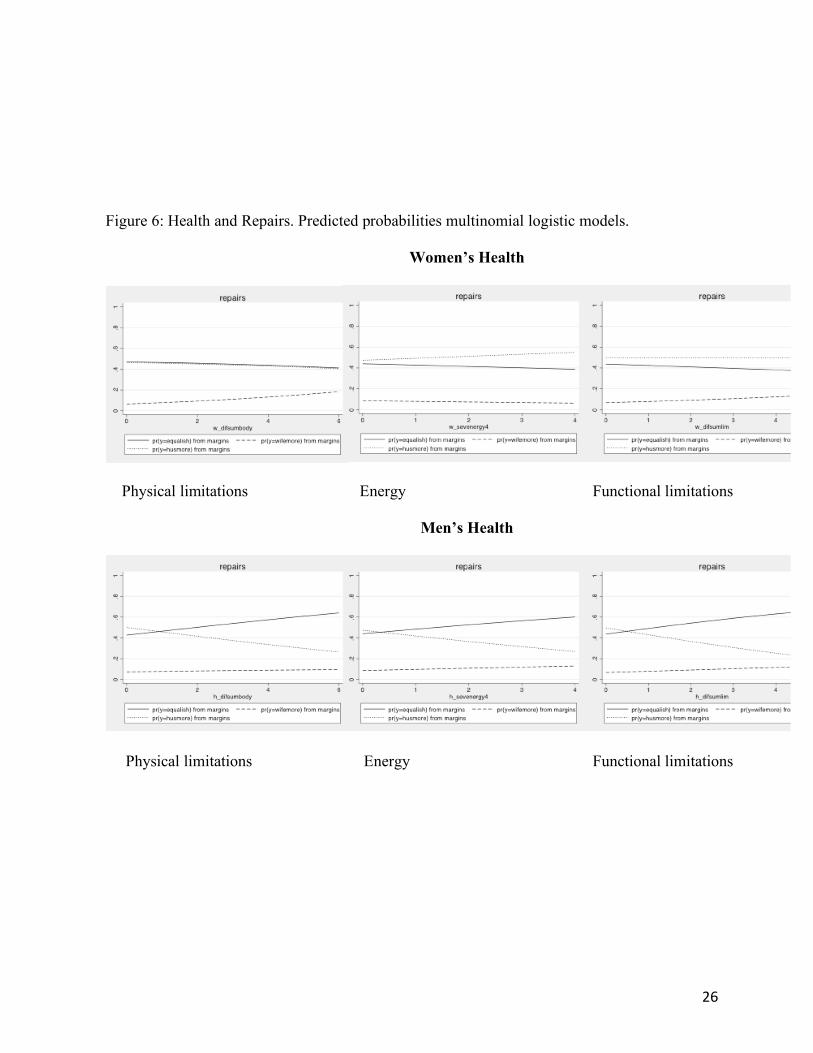
Doing repairs and home improvement is a male dominated task; wives’ physical
limitations , energy levels, or functional limitations have a very limited effect on the predicted
division of labor of repairs, lending support for H2. As the number of husbands’ physical and
functional limitations increases and energy problems arise, the probability of them being primary
responsibly for repairs decreases and the probability of equal sharing increases, but not the
probability of wives’ primary responsibility.
FIGURE 6 ABOUT HERE
Summary and Conclusion
Our analyses showed that when it comes to housework time, women’s time spend on chores is
shaped by their own health and their husbands’ health, whereas men’s time in housework is
largely shaped by their own health. When we explore the division of six housework tasks
between spouses we find a more complex patterns. Couples adjust the division of labor based on
both men’s and women’s health, but this is done in a gendered way. Tasks that are typically done
by female partners typically become equally shared one women’s health declines. Tasks that are
shared equally become more likely to be shared equally as women’s health worsens. Only in the
scenario of a great number of functional limitations do we predict the responsibility to shift over

13
to the husband. Repairs and home improvement is the only task included that is somewhat male
dominated or shared equally, and mirroring the results for female dominated tasks poor health of
husbands increases equal sharing rather than wives “taking over” responsibility for repairs.
Overall, our results indicate that women are more likely to adjust their housework patterns in
response to their partners’ health, and do so more quickly than men do. Housework is responsive
to health, but tasks remain strongly gendered. Only if a partner exhibits a very high level of
physical limitations does health trump gender. From a practical viewpoint our findings imply
that when practitioners want to understand especially women’s life circumstances and their
domestic work load, understanding their spouses health status is crucial. Given all that we now
about

14
References
Baxter, J., Haynes, M., & Hewitt, B. (2010). Pathways into marriage: Cohabitation and the domestic division of labor. Journal of family issues.
Bianchi, Suzanne M, Melissa A Milkie, Liana C Sayer, and John P Robinson. 2000. “Is Anyone Doing the Housework? Trends in the Gender Division of Household Labor.” Social Forces 79 (1): 191–228.
Bianchi, Suzanne M, Liana C Sayer, Melissa A Milkie, and John P Robinson. 2012. “Housework: Who Did, Does or Will Do It, and How Much Does It Matter?” Social Forces 91 (1): 55–63.
Bianchi, S. M., & Spain, D. (1999). Women, work, and family in America. Sociology of Families: Readings, 170.
Bird, C.E. 1999. Gender, Household Labor, and Psychological Distress: The Impact of the Amount and Division of Housework. Journal of Health and Social Behavior 40 (1), pp. 32-45
Dorfman, Lorraine T., and D. Alex Heckert. 1988. “Egalitarianism in Retired Rural Couples: Household Tasks, Decision Making, and Leisure Activities.” Family Relations 37 (1): 73–78. doi:10.2307/584433.
Everard, Kelly M, Helen W Lach, Edwin B Fisher, and M Carolyn Baum. 2000. “Relationship of Activity and Social Support to the Functional Health of Older Adults.” The Journals of Gerontology Series B: Psychological Sciences and Social Sciences 55 (4): S208–12.
Freedman, VA & Cornman, JC. 2014. “The Panel Study of Income Dynamic: Second Supplement on Disability and Use of Time (DUST 2013) User Guide: Release 2013.1.” Institute for Social Research, University of Michigan.
Furstenberg Jr, F. F. (2010). On a new schedule: Transitions to adulthood and family change. The future of children, 20(1), 67-87.
Geist, Claudia, and Philip N Cohen. 2011. “Headed toward Equality? Housework Change in Comparative Perspective.” Journal of Marriage and Family 73 (4): 832–44.
Geist, C., & Cohen, P. N. (2011). Headed toward equality? Housework change in comparative perspective. Journal of Marriage and Family, 73(4), 832-844.
Goldberg, A. E., & Perry-Jenkins, M. (2004). Division of labor and working-class women's well-being across the transition to parenthood. Journal of Family Psychology, 18(1), 225.
Glass, J. and T. Fujimoto. 1994. Housework, Paid Work, and Depression Among Husbands and Wives. Journal of Health and Social Behavior. Vol 35:179-191.
Leopold, Thomas, and Jan Skopek. 2015. “Convergence or Continuity? The Gender Gap in Household Labor After Retirement.” Journal of Marriage and Family 77 (4): 819–32. doi:10.1111/jomf.12199.
MacDermid, S. M., Huston, T. L., & McHale, S. M. (1990). Changes in marriage associated with the transition to parenthood: Individual differences as a function of sex-role attitudes and changes in the division of household labor. Journal of Marriage and the Family, 475-486.
Ross, Ce E, and C E Bird. 1994. “Sex Stratification and Health Lifestyle: Consequences for Men’s and Women’s Perceived Health.” Journal of Health and Social Behavior, 161–78.
Ross, C.E., J. Mirowky and J. Huber. 1983. Dividing Work, Sharing Work, and In-Between: Marriage Patterns and Depression. American Sociological Review Vol. 48, No. 6 (Dec., 1983), pp. 809-823

15
Silverstein, Merril, and Roseann Giarrusso. 2010. “Aging and Family Life: A Decade Review.” Journal of Marriage and Family 72 (5): 1039–58. doi:10.1111/j.1741-3737.2010.00749.x.
Solomon, Catherine Richards, Alan C Acock, and Alexis J Walker. 2004. “Gender Ideology and Investment in Housework Postretirement Change.” Journal of Family Issues 25 (8): 1050–71.
Streib, Gordon F., and Rubye Wilkerson Beck. 1980. “Older Families: A Decade Review.” Journal of Marriage and Family 42 (4): 937–56. doi:10.2307/351834.
Szinovacz, Maximiliane. 1992. “Is Housework Good for Retirees?” Family Relations, 230–38. Szinovacz, Maximiliane, and Paula Harpster. 1994. “Couples’ Employment/Retirement Status
and the Division of Household Tasks.” Journal of Gerontology 49 (3): S125–36. doi:10.1093/geronj/49.3.S125.
Utz, Rebecca L, Erin B Reidy, Deborah Carr, Randolph Nesse, and Camille Wortman. 2004. “The Daily Consequences of Widowhood The Role of Gender and Intergenerational Transfers on Subsequent Housework Performance.” Journal of Family Issues 25 (5): 683–712.
West, C. and D.H. Zimmerman. 1987. “Doing Gender.” Gender & Society 1 (2): 125–51. doi:10.1177/0891243287001002002.

16
Table 1: Descriptive Statistics: Dependent Variables and Controls
Variable % or mean(SD) Age Wife 69.42 (7.28) Husband 72.19 (7.83) Year 2009 40.33% 2013 59.66% Total Housework Time (from diary) Difference 2359 (9902) Wife 9141 (7592) Husband 6782 (8002) Tasks (from survey) Laundry Equal 30.73% Wife does more 62.58% Husband does more 7.57% Cleaning Equal 48.56% Wife does more 43.87% Husband does more 7.57% Dinner Equal 44.74% Wife does more 48.32% Husband does more 6.93% Errands Equal 66.07% Wife does more 22.32% Husband does more 11.61% Repairs Equal 46.67% Wife does more 09.11% Husband does more 44.22% Bills Equal 38.53% Wife does more 36.08% Husband does more 25.39% Day of the Week Monday 9.15% Tuesday 8.14% Wednesday 9.15% Thursday 8.81% Friday 8.59% Saturday 25.42% Sunday 30.73%
17
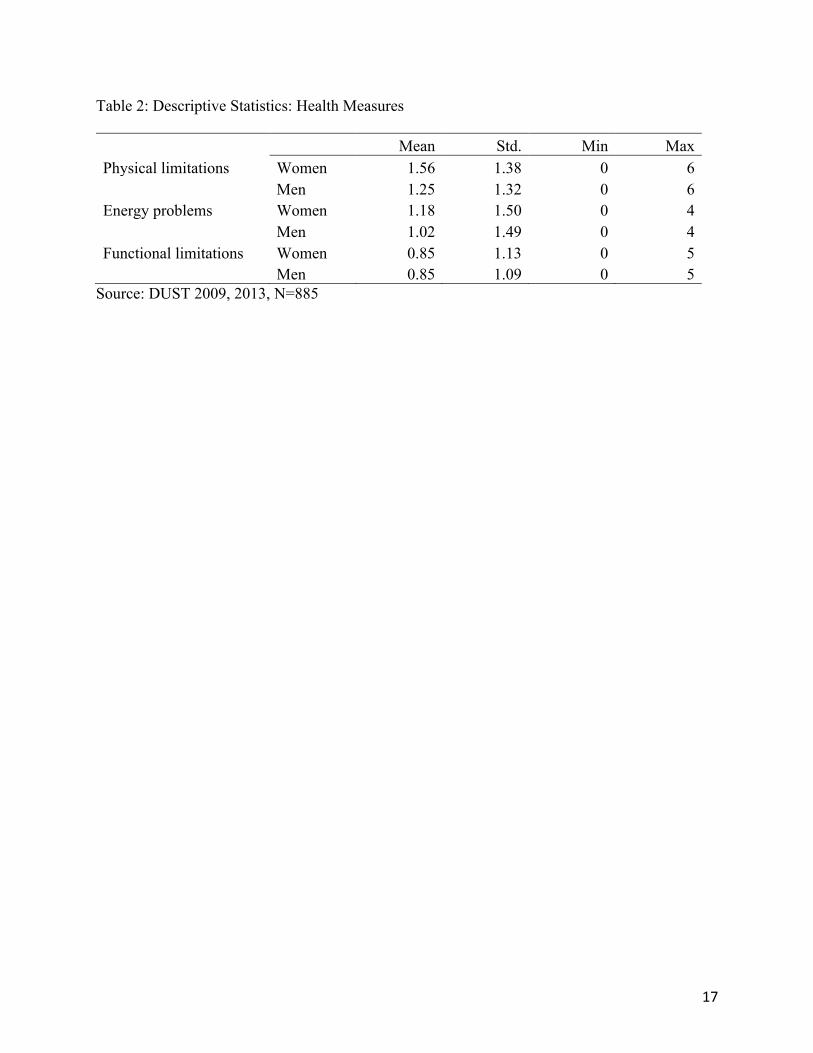
Table 2: Descriptive Statistics: Health Measures
Mean Std. Min Max
Physical limitations Women 1.56 1.38 0 6
Men 1.25 1.32 0 6
Energy problems Women 1.18 1.50 0 4
Men 1.02 1.49 0 4
Functional limitations Women 0.85 1.13 0 5
Men 0.85 1.09 0 5
Source: DUST 2009, 2013, N=885

18
Table 3: OLS regression – housework gap between husbands and wives VARIABLES Husband’s –
Wife’s HW time
Husband’s –Wife’s HW
time
Husband’s –Wife’s HW
time Husband’s age -571.5 -598.4 -1,284 (809.4) (822.4) (843.5) Wife’s age 1,134 1,058 1,622** (797.4) (796.7) (798.3) Monday -965.6 -1,194 -1,236 (1,293) (1,280) (1,272) Tuesday -487.9 -468.2 -2.368 (1,205) (1,223) (1,201) Wednesday -147.2 37.35 -67.88 (1,071) (1,072) (1,068) Thursday -2,281** -2,352** -2,067* (1,135) (1,150) (1,131) Friday 1,226 1,176 1,056 (1,298) (1,243) (1,284) Saturday -1,469* -1,534* -1,329 (890.7) (882.1) (876.5) Year 2013 (compared to 2009) -549.7 -508.4 -601.5 (747.6) (732.5) (733.2) Physical Limitations (Wife) -581.2** (294.8) Physical Limitations (Husband) 960.8*** (311.0) Energy Problems (Wife) -863.0*** (260.4) Energy Problems (Husband) 1,124*** (264.6) Functional Limitations (Wife) -967.3*** (340.0) Functional Limitations (Husband) 1,797*** (437.5) Constant 3,005*** 3,171*** 2,563*** (881.1) (721.7) (766.8) Observations 885 885 885 R-squared 0.038 0.059 0.059 Robust standard errors in parentheses
*** p<0.01, ** p<0.05, * p<0.1
19
Table 2: OLS regression - Wife’s housework time.
(1) (2) (3) VARIABLES Wife’s HW time Wife’s HW time Wife’s HW time Husband’s age 251.8 239.8 -103.2 (563.3) (574.8) (575.4) Wife’s age -402.9 -404.8 -13.46 (520.8) (528.4) (510.8) Monday 2,211** 2,174** 1,992** (986.7) (993.5) (980.6) Tuesday 1,531 1,528 1,791* (976.6) (992.3) (958.8) Wednesday 2,054** 2,141** 2,216** (885.2) (892.8) (876.2) Thursday 1,293 1,339 1,447 (914.8) (924.3) (911.9) Friday 3,482*** 3,429*** 3,298*** (967.7) (946.2) (967.4) Saturday 1,801*** 1,907*** 1,912*** (660.8) (666.2) (648.2) Year 2013 (compared to 2009)
-409.1 -417.8 -387.4
(567.2) (569.2) (558.1) Physical Limitations (Wife) -787.1*** (209.2) Physical Limitations (Husband)
254.4
(245.6) Energy Problems (Wife) -669.1*** (183.2) Energy Problems (Husband) 201.4 (199.9) Functional Limitations (Wife)
-1,235***
(247.9) Functional Limitations (Husband)
763.6**
(357.5) Constant 8,910*** 8,555*** 8,347*** (677.7) (608.5) (604.3) Observations 885 885 885 R-squared 0.042 0.039 0.059
Robust standard errors in parentheses; *** p<0.01, ** p<0.05, * p<0.1
20
Table 3: OLS regression - Husband’s housework time. (1) (2) (3) VARIABLES Husband’s HW
time Husband’s HW
time Husband’s HW
time Husband’s age 823.3 838.3 1,181* (586.3) (578.5) (620.5) Wife’s age -1,537*** -1,463** -1,636*** (587.6) (579.7) (590.7) Monday 3,177*** 3,369*** 3,228*** (982.6) (963.4) (982.6) Tuesday 2,019** 1,996** 1,793** (783.9) (784.7) (777.0) Wednesday 2,201** 2,104** 2,283*** (860.1) (857.2) (854.3) Thursday 3,575*** 3,692*** 3,513*** (1,050) (1,057) (1,057) Friday 2,256** 2,253** 2,243** (1,035) (1,014) (1,022) Saturday 3,270*** 3,441*** 3,241*** (718.0) (708.7) (712.0) Year 2013 (compared to 2009) 140.6 90.58 214.1 (603.1) (598.2) (599.3) Physical Limitations (Wife) -205.9 (223.9) Physical Limitations (Husband) -706.4*** (205.0) Energy Problems (Wife) 193.9 (198.8) Energy Problems (Husband) -922.2*** (168.2) Functional Limitations (Wife) -268.0 (250.0) Functional Limitations (Husband)
-1,034***
(274.9) Constant 5,905*** 5,384*** 5,784*** (728.3) (619.6) (651.3) Observations 885 885 885 R-squared 0.059 0.074 0.065 Robust standard errors in parentheses; *** p<0.01, ** p<0.05, * p<0.1

21
Figure 1: Health and Laundry. Predicted probabilities from multinomial logistic models
Women’s Health
Physical limitations Energy Functional limitations
Men’s Health
Physical limitations Energy Functional limitations

22
Figure 2: Health and Dinner. Predicted probabilities multinomial logistic models.
Women’s Health
Physical limitations Energy Functional limitations
Men’s Health
Physical limitations Energy Functional limitations

23
Figure 3: Health and Cleaning. Predicted probabilities multinomial logistic models.
Women’s Health
Physical limitations Energy Functional limitations
Men’s Health
Physical limitations Energy Functional limitations

24
Figure 4: Health and Paying Bills. Predicted probabilities multinomial logistic models.
Women’s Health
Physical limitations
Men’s Health
Physical limitations Energy Functional limitations
25
Figure 5: Health and Errands. Predicted probabilities multinomial logistic models.
Women’s Health
Physical limitations Energy Functional limitations
Men’s Health
Physical limitations Energy Functional limitations
26
Figure 6: Health and Repairs. Predicted probabilities multinomial logistic models.
Women’s Health
Physical limitations Energy Functional limitations
Men’s Health
Physical limitations Energy Functional limitations
ons