hmong 2000 census publication: data & analysis a ... · associate professor of social work,...
TRANSCRIPT

HMONG 2000 CENSUS PUBLICATION: DATA & ANALYSIS
A publication of Hmong National Development, Inc. & Hmong Cultural and Resource Center Lead Organizations:
Hmong National Development Inc. (HND), Washington, DC Hmong Cultural and Resource Center, Saint Paul, MN
Contributing Authors:
Serge Lee, Ph.D. Mark E. Pfeifer, Ph.D. Reverend Kou Seying, Ph.D. Richard M. Todd, Ph.D. and Michael Grover, M.A. Halee Vang, Ph.D. Candidate Chia Youyee Vang, Ph.D. Candidate Zha Blong Xiong, Ph.D. and Arunya Tuicomepee Kou Yang, Ed.D.
Data Collection:
Malay Thao, Intern, Hmong National Development, Inc., Washington, DC Mark E. Pfeifer, Ph.D., Hmong Cultural Center, St. Paul, MN Asia Pacific American Community Development Center, UCLA Asian American Studies
Center Reviewers/Editor: Bo Thao, Executive Director, Hmong National Development, Inc., Washington, DC
Louisa Schein, Ph.D., Rutgers University, Newark, NJ Max Niedzweicki, Executive Director, Southeast Asia Resource Action Center,
Washington, DC
Hmong National Development, Inc. (HND) 1112 16 Street N.W., Suite 110
Washington, DC 20036 (202) 463-2118 * (202) 463-2119 Fax [email protected] * www.hndlink.org

1
ACKNOWLEDGEMENTS
In fall 2003, Hmong National Development, Inc. (HND) began an effort with the Hmong Cultural Center in St. Paul, Minnesota to further look at the long awaited release of Hmong-origin data from the 2000 Census. Though we agree with the Hmong community that there was probably a significant undercount of Hmong families and individuals by the Census, we do find the data useful. The Census numbers provide data that we can use to assist in our understanding of the conditions of Hmong families in America. This publication is meant to serve as a vehicle for further discussion about the progress, current needs, and future of our community. It is also HND�s hope that this publication will encourage more people to continue being engaged in the collection of data so that future disaggregated data can be more readily available. I am extremely pleased that the analysis of the Census data in this publication was done in collaboration with several Hmong American scholars, as well as with other scholars who have specific interests in the Hmong community. To our knowledge, this may be the only publication that has collaborated with Hmong scholars. I hope you find this publication to be thought provoking and useful in your work. Lastly, I especially want to thank Mark Pfeifer of the Hmong Cultural Center for his support of this project; Malay Lo-Thao, our intern for spending much of her time on the data collection; and the Asia Pacific American Community Development Center at UCLA for helping us with the maps. Again, I thank all the scholars for contributing their articles, adding life to the publication. Lastly, my appreciations to Max Niedzweicki, Executive Director of SEARAC and Louisa Schein, Professor at Rutgers University for their assistance in reviewing the publication.
Bo Thao
Executive Director Hmong National Development, Inc.
The views expressed in this publication by the authors do not necessarily reflect those of Hmong National Development, Inc. (HND). This report follows the Census Bureau in using the term �Hmong,� instead of �Mong�; however, as Dr. Paoze Thao (1999: 3-4) reports, community members disagree about appropriate terminology for the group or groups. The terms �Hmong�, �Mong�, �H/Mong�, �Hmong� have all been used. (Source: Thao, Paoze. 1999. Mong Education at the Crossroads. Lanham, MD: University Press of America.)

2
TABLE OF CONTENTS
ACKNOWLEDGEMENT Page 1 HMONG POPULATION, DEMOGRAPHIC, Page 3 SOCIOECONOMIC, AND EDUCATIONAL TRENDS IN THE 2000 CENSUS By Mark E. Pfeifer, Ph.D. and Serge Lee, Ph.D. HMONG FAMILIES IN AMERICA IN 2000: Page 12 CONTINUITY AND CHANGE By Zha Blong Xiong, Ph.D. and Arunya Tuicomepee PROFILE OF HMONG EDUCATIONAL ATTAINMENT Page 21 By Kou Yang, Ed.D. and Mark E. Pfeifer, Ph.D. HMONG AMERICAN WOMEN�S EDUCATIONAL Page 23 ATTAINMENT: IMPLICATIONS FOR HMONG AMERICAN WOMEN AND MEN By Halee Vang, Ph.D. Candidate WHAT YOU CANNOT SEE IN THE U.S. 2000 CENSUS Page 26 By Reverend Kou Seying (Kxf. Nyaj Kub Thoj) CONTESTED ECONOMIC GROWTH Page 29 AMONG HMONG AMERICANS By Chia Youyee Vang, Ph.D. Candidate HMONG HOMEOWNERSHIP: UP SHARPLY IN THE 1990S BUT STILL LAGGING IN THE CENTRAL VALLEY Page 32 By Michael Grover and Richard M. Todd ABOUT THE AUTHORS Page 37 APPENDIXES Page 39 Maps and Tables

3
HMONG POPULATION, DEMOGRAPHIC, SOCIOECONOMIC, AND EDUCATIONAL TRENDS IN THE 2000 CENSUS
Mark E. Pfeifer, Ph.D.
Director, Hmong Resource Center, Hmong Cultural Center, Saint Paul, MN
Serge Lee, Ph.D. Associate Professor of Social Work, California State University, Sacramento
Introduction and Methodology
In the summer of 2001, the U.S Census Bureau released Hmong-origin data from the 2000 Census. The 2000 Census figures were met with considerable skepticism from representatives of the Hmong community. Community-based professionals who work closely with persons of Hmong origin have suggested that the census figures may represent an actual count of only half of the actual Hmong population across the country and in particular cities. Language and cultural barriers, a lack of community information about the census as well as widespread suspicion of government surveys have all been suggested as possible causes of an undercount.1 It seems very plausible that the 2000 Census data that were collected from persons of Hmong origin was at least somewhat skewed to the proportion of the population that is more acculturated into mainstream American culture in terms of education, English language ability and other socioeconomic variables. It may also be speculated that some Hmong continue to prefer identifying themselves with their motherland, thereby identifying themselves as Laotian, while others wish to be identified as Hmong. For these reasons, any census figures pertaining to the Hmong origin population should be interpreted with the recognition that there was likely a significant undercount and that many of the Hmong persons missed might be those less integrated into American society. While the census figures do represent a significant undercount of the Hmong population, the census information is useful. The 2000 data help explicate population, demographic, educational and socioeconomic trends among Hmong residing in the United States. Documentation of these trends provides a better understanding about the acculturation processes the Hmong have experienced in the past two decades. Documentation of these trends helps provide information to policymakers, service providers, and the philanthropic community about the characteristics, service needs, and successes of the growing Hmong communities across the U.S. In addition, it helps the Hmong American community to see its own challenges, growth, and progress in the U.S. This paper uses 2000 Census data to present an overview of Hmong population, demographic, socioeconomic, and educational distributions across the United States. It provides an overview of several facets of Hmong integration, including national population trends, changes in regional population distributions, patterns of Hmong clustering in particular metropolitan areas within given states and regions, age and gender demographics, year of entry trends, internal Hmong migration within the U.S., linguistic isolation, language ability, disability status, citizenship status, educational attainment, housing tenure, income, median earnings, poverty status, public assistance income, labor force participation, unemployment rate, industry distribution and occupational distribution, and where available and relevant, Hmong census distributions by gender are also discussed. In this first section, a summary discussion of key trends in the census data is provided. In subsequent sections, scholars analyze important issues related to Hmong acculturation and advancement in U.S. society that are discernible or in some cases not discernible in the census data. The project to compile and analyze the census data for this report has represented a partnership between Hmong National Development, Inc. (HND) in Washington D.C., the Hmong Resource Center at the Hmong Cultural Center in Saint Paul, MN and several Hmong and non-Hmong scholars. This publication represents the first detailed assessment of Hmong income, poverty status, percentage of families and children in poverty, educational progress, gender and regional differences in socioeconomic and education and demography across the major Hmong population centers of the United States using 2000 Census data. 1 �Census 2000: The Missing Hmong?� Hmong Times Newspaper, August 16, 2001

4
The data in this report were derived from Summary File 1, Summary File 2 and Summary File 4 of the Census. The figures represent persons who claimed Hmong ethnic origin as their sole identity on the census form (i.e. Hmong Alone). State data related to Hmong populations is presented for states where more than 200 Hmong were counted in the 2000 Census and where data is available for a full range of demographic, educational and socioeconomic variables. These states are: Alaska, California, Colorado, Georgia, Kansas, Massachusetts, Michigan, Minnesota, North Carolina, Oklahoma, Oregon, Pennsylvania, Rhode Island, South Carolina, Washington and Wisconsin. A few other states, including Illinois, Iowa, Ohio, and Texas had between 200 to 500 Hmong enumerated, but lacked available data for a wide range of variables, likely due to the relatively modest size of the Hmong populations in these locales. For this reason, Hmong populations in these four states are not included in the full data analysis. Where comparable 1990 data were available, changes in the Hmong distributions over the decade between 1990 and 2000 are discussed. Unfortunately, changes by the U.S. census over the decade in specific demographic and socioeconomic variable measurements make direct temporal comparisons difficult on most specific variables with the exception of general population figures. In addition, the small Hmong populations in all but a few states, and the difficulty of finding state level ethnic origin 1990 data that included Hmong, made temporal state by state comparisons very difficult. Any 1990 to 2000 comparisons discussed in the paper are of national level data. In some cases, the variables discussed in the text between the two periods are similar but slightly different due to changes in measurement by the census bureau. National Trends 94,439 persons of Hmong origin were counted in the 50 U.S. states and District of Columbia in 1990. 186,310 were enumerated in the 50 states and Washington D.C. in 2000, representing a 97percent increase in the census enumerations over the course of the decade (Table 1). As in 1990, the largest Hmong population was observed residing in California (Table 2), where census takers counted just over 65,000 Hmong. The next largest populations were recorded in Minnesota (41,800) and Wisconsin (33,791) � these states also ranked second and third in 1990. Rounding out the top five state populations were North Carolina (7,093) and Michigan (5,383). After these five states, the census calculated the most sizable Hmong populations in Colorado (3,000), Oregon (2,101), Georgia (1,468) Washington (1,294) and Massachusetts (1,127). As noted above, it is widely believed in the Hmong community that the 2000 Census represents an undercount of the Hmong population. For this reason, community estimates of Hmong population in each state collected by Hmong National Development, Inc. in Washington are also provided (Table 2A).2 Regional Trends Overall, the 2000 Census indicate the strongest growth in numbers of the Hmong population has occurred in parts of the South and Midwest states. Lesser rates of growth are apparent in the Eastern and especially the Western states. The data indicate pronounced shifts in the Hmong population away from the West and toward certain regions of the Midwest and the South while the Hmong population in the Eastern Seaboard states remained very small. Within each of the four major regions, contrasting trends were also quite visible between states. The following is a discussion of some of the most prominent trends in Hmong population settlement in each of the four major regions of the U.S. There is some evidence from the Census data that while enclave communities remain strong; Hmong Americans are beginning to move out to places where employment is more readily available. 3
Northeast Of the four major regions, by far the smallest number of Hmong was counted in the Eastern Seaboard states (Table 2). About 2 percent of the nation�s Hmong population lived in the Northeast in both 1990 and 2000. Rhode Island, which constituted the major enclave of Hmong residence on the East Coast in the 1990 census, actually saw a decrease in its Hmong population according to the 2000 enumeration (Table 2). The 1,001 Hmong counted in Rhode Island in 2000 ranked second to the 1,127 tallied in neighboring Massachusetts. The census figures indicate a sizable gain in the Hmong population of Massachusetts over the decade. Substantial increases of small Hmong populations were also apparent in Pennsylvania, New York, and Connecticut.
2 Hmong estimates are based on figures given to HND by local Hmong leaders and service organizations. 3 �Census shows more go for Gopher state�, Pioneer Press, August 05, 2003.

5
South The 10,350 Hmong counted in the Southern U.S. in 2000 represented just over 6 percent of the entire national Hmong population, an impressive increase from just 1.3 percent in 1990 (Table 2). The significant gain in the Hmong population was mostly focused within a few states in the Southeastern region of the U.S. South. Some of the most substantial gains in Hmong population in the entire country over the entire decade occurred in the adjacent states of North and South Carolina. In North Carolina, the Hmong population increased from 544 to 7,093 over the ten-year period (Table 2). In South Carolina, only 40 Hmong were counted in 1990 compared to 519 in 2000. Impressive increases in the Hmong population were also observed in the two nearby Southeastern states of Georgia and Florida. The other sub-region of the South with apparent gains in Hmong residents included the neighboring states of Oklahoma and Texas. In these two states, the overall populations remained small but exhibited noteworthy increases from 1990.
Midwest The share of the U.S. Hmong population living in the Midwest states increased from 41 percent in 1990 to 49 percent in 2000 (Table 2). The rate of increase in the Hmong population within the Midwestern states was 115 percent over the decade. As in 1990, the Hmong population in the Midwest was strongly concentrated in the states of Minnesota and Wisconsin. Both states saw major increases in Hmong-origin residents. The rate of increase of the Hmong population in Minnesota was 135 percent (Table 2). In Wisconsin, the population exhibited a rate of increase of 99 percent. Similar impressive gains to a smaller overall base of Hmong residents were also apparent in the state of Michigan, where the tallied population exhibited an increase of 133 percent between the two census dates. In Kansas and Ohio the population nearly doubled. Much lower rates of growth were documented among the small Hmong populations in Illinois and Indiana, while the population actually decreased in the states of Iowa and Nebraska.
West California still had by far the largest Hmong population of any state in the country in 2000; however, the trend in the Western states as a whole contrasts sharply with those noted in the South and the Midwest. The overall rate of increase for the Hmong population over the decade in the West was only about 38 percent, much lower than that observed in each of the three other regions (Table 2). In 1990, the Hmong population in the Western states represented 55 percent of the national total. In 2000, the proportion of Hmong residing in the West made up 42 percent of the population counted across the country. As with the other regions, significant variation was apparent in sub-regions of the Western states. The rate of increase among Hmong in California over the decade was only 38 percent - a much lower rate of growth compared to other Hmong enclave states, such as Minnesota, Wisconsin, Michigan, and North Carolina. The two most notable states with dramatic rates of increase in Hmong population were Colorado, where the population increased almost 150 percent, and Oregon, where the number of tallied Hmong residents more than tripled over the decade. In Nevada, a very small Hmong community also grew significantly. In the states of Montana and Washington, established Hmong communities grew more modestly, while in Alaska the census shows the emergence of a new moderately sized Hmong community between 1990 and 2000. Metropolitan Distributions of Hmong Population Among U.S. metropolitan areas, by far the largest Hmong population lived in Minneapolis-St. Paul (40,707) (Table 3). The second largest concentration of Hmong was in Fresno (22,456). It is noteworthy that the positions of the Twin Cities and Fresno in the rank-hierarchy flip-flopped between 1990 and 2000. Fresno had possessed the largest Hmong population in 1990 (19,444) while the Twin Cities were home to the second most sizable community a decade earlier (17,764). The census figures help document the much stronger growth in the Hmong population of Minneapolis-St. Paul. After Fresno, the next most sizable Hmong populations in 2000 were enumerated in Sacramento-Yolo (16,621), Milwaukee-Racine (8,078) and Merced, CA (6,148). Stockton-Lodi, CA; Appleton-Oshkosh-Neenah, WI; Wausau, WI; Hickory-Morganton-Lenoir, NC; and Detroit-Ann Arbor-Flint, MI round out the ten largest metropolitan concentrations of Hmong.

6
U.S. Regional Distributions of Metropolitan Areas with Sizable Hmong Communities
Northeast As noted above, the Hmong population counted in the Eastern Seaboard states was very small relative to that found in certain parts of the nation�s other three major regions. Within the East, the largest enumerated communities were apparent in the Boston-Worcester-Lawrence, MA (1,052) and Providence-Fall River-Warwick, RI (1,004) metropolitan areas (Table 3). Other moderate sized communities were visible in Lancaster, PA, the Philadelphia metropolitan area and in Syracuse, NY.
South In the Southeastern U.S., Hickory-Morganton-Lenoir, NC emerged over the decade as the region�s primary center of Hmong residence. The Hmong population in the Hickory-Morganton-Lenoir area rose dramatically from just 433 in 1990 to 4,207 in 2000 (Table 3). The Atlanta, GA metro possessed the second largest number of tallied Hmong residents in 2000 (1,097). It was closely followed by another North Carolina metropolitan area � Charlotte-Gastonia-Rock Hill (1,024). Across the rest of the South, other moderately sized Hmong communities were documented in Tulsa, OK and Greenville-Spartanburg-Anderson, S.C.
Midwest Minneapolis-St. Paul (40,707) clearly consolidated its role as the primary center of Hmong residence and institutional life in the Midwest and the entire United States over the 1990 to 2000 period (Table 3). Strong growth was also apparent in the Hmong populations of several metropolitan areas located in nearby Wisconsin. These cities include Milwaukee-Racine (8,078), Appleton-Oshkosh-Neenah (4,741), as well as Wausau, Green Bay, Sheboygan, La Crosse, Madison, and Eau Claire. Eight of the ten most sizable Hmong populations in the Midwest are in Wisconsin cities. The other major city of Hmong residence in the Midwest that emerges from the census data is the Detroit-Ann Arbor metropolitan area (3,926).
West
In the West, California cities dominate the hierarchy of Hmong residential distribution in a manner similar to that of the Twin Cities and the Wisconsin metros in the Midwest. Eight of the ten largest metropolitan Hmong populations in the West were located in California (Table 3). In 2000, Fresno continued as the largest Hmong populated city in the Western region (22,456). However, the rate of residential growth in Fresno lagged significantly behind that of the metro with the second largest population � Sacramento (16,621). While the population in Fresno increased 13.4 percent over the decade (from 19,444 in 1990), the population tallied in Sacramento increased 150 percent from just 5,551 in 1990. Merced (6,148), Stockton-Lodi (5,653) and the Denver-Boulder (2,976) metros possessed the next largest Hmong communities according to the 2000 Census figures. Yuba City, CA; Los Angeles, Portland-Salem, OR; San Diego and Visalia-Tulare-Porterville, CA rounded out the ten largest Hmong populations among cities in the Western states. Age Distribution The 2000 Census data show that the U.S. Hmong population is skewed very young (Table 4). The Hmong are the only ethnically based population in the 2000 Census to have a median age under 20. This holds true in every state where there is a significant number of Hmong residing. The national figure indicates that 56 percent of Hmong enumerated in the U.S. in 2000 were under 18 years old. More than half of Hmong across the U.S. were under 18 compared to about a quarter of the entire U.S. population. In every other age category, Hmong were strongly under-represented compared to the population of the U.S. as a whole. This trend held true in the 18 to 24, 25 to 44, 45 to 64 and 65 years and over age categories. The youthful character of the Hmong population is seen in the median age figure. The median age of Hmong across the U.S. was 16.1 years compared to 35.3 for the entire population. Gender Distribution

7
According to the 2000 data, the gender balance in the Hmong population across the U.S. slightly favored males (Table 5). Fifty-one percent of the Hmong counted are males. These figures differ from the entire U.S. population in which females constitute the majority. No change has occurred in the gender distribution since 1990, where census data also indicated that 51 percent of the Hmong population was male. Household and Family Size The 2000 Census show the average Hmong household size continues to be much larger than that of the overall U.S. population (Table 6). The average U.S. Hmong household size was 6.28 persons compared to 2.59 for the overall U.S. population. The average U.S. Hmong family size was 6.51 persons in contrast to 3.14 persons among the entire U.S. population. Population Year of Entry Year of entry data for the 2000 Census show some interesting variations in the time of arrival of the Hmong population across different states. Nationally, the largest proportions of enumerated Hmong (26.4 percent and 28 percent respectively) arrived in the U.S. between 1985 to 1989 and 1990 to 1994. Lesser proportions of Hmong reported arriving in the U.S. from 1975 to 1979, 1980 to 1984 and 1995 to 2000 periods. Comparing differences between the states, those who came in the 1975 to 1979 period make up nearly 40 percent of Colorado�s Hmong population, and one-third of the population in Georgia, but only 13 percent of the population in Minnesota, 14 percent in California and 11 percent in Wisconsin. By contrast, those who came to the U.S. between 1995 and 2000 make up larger relative proportions of the Hmong populations in California, Minnesota, Wisconsin, Michigan, Washington, and Alaska compared to the other states. These states appear to attract many of the Hmong who arrived in the U.S. in recent years. Migration Within the U.S. Migration data from the 2000 Census (Table 8) provide evidence of the differential movement of Hmong to certain states since 1995. The data also show the movement of Hmong between different regions of the country. Few Hmong in Alaska, Georgia, Oklahoma, Oregon, and South Carolina lived in the same house in 1995, providing evidence of the fairly recent movement of many Hmong to these states. The modest-sized Hmong populations in Kansas, Massachusetts, Pennsylvania, Rhode Island, and Washington appear to be more residentially stable as more than 50 percent of them lived in the same house in 2000 as they did in 1995. In other states such as California, Michigan, Minnesota, North Carolina, and Wisconsin the percentage of the Hmong population residing in the same house in both 1995 and 2000 fell somewhere in between these two extremes. Perhaps the most useful portion of the migration data comes from the section pertaining to the percentage of Hmong who lived in a different house in 1995 than in 2000, who came from within the same state or alternately from a different state. The data indicate California (12.4 percent), and to a lesser extent Wisconsin (45.8 percent), attracted fewer Hmong migrants from other states in the 1995-2000 period compared to states, such as Minnesota (73.4 percent), North Carolina (83 percent), Georgia (83.1 percent), Alaska (100 percent), Oklahoma (90.1 percent), South Carolina (95.9 percent) and several others. The data also show that some states attracted many Hmong from outside their immediate regions. For example, 70.4 percent of Hmong Minnesotans who lived in a different house in 2000 compared to 1995 came from the West (most likely from California). Likewise, 84.2 percent of Hmong North Carolinians came from the Western U.S. Similarly, 86.2 percent and 88.1 percent of Hmong in the same situation in Alaska and South Carolina respectively came from the West. Minnesota attracted the largest percentage of Hmong migrating from other regions. Massachusetts lured the largest percentage of Hmong from elsewhere in the Northeast. Rhode Island, Minnesota, and Kansas brought in the largest relative percentages of Hmong migrating from elsewhere in the Midwestern region, though it should be noted that the Hmong population samples in Kansas and Rhode Island are relatively small. In sum, the trends show a general movement of Hmong away from the West to several states. Minnesota appears to have attracted the strongest percentages of Hmong from various regions throughout the country from 1995 to 2000. Linguistic Isolation

8
The 2000 Census data (Table 9) revealed that the percentage of Hmong in the U.S. who were linguistically isolated4 remained much higher than in the general population (34.8 percent compared to 4.1 percent); however, it should be noted that the percentage of Hmong reporting linguistic isolation has decreased significantly since 1990 when the national figure for linguistic isolation among Hmong was 60 percent. Ability to Speak English by Age The 2000 Census data indicate that the largest proportion of Hmong aged 5 to 17 years old could speak English �very well� or �well.� Hmong aged 5 to 17 showed a lower percentage in the �very well� category and a higher percentage in the �well� category compared to the general U.S. population of the same age. The percentage of U.S. Hmong aged 5 to 17 who reported speaking English �not well at all� was also somewhat higher than the U.S. population as a whole. Hmong aged 18 to 64 years were most significantly over-represented in the speak English �not well� category, and underrepresented in the speak English �very well� cohort compared to the overall U.S. population. Not surprisingly, Hmong aged 65 years and over were mostly concentrated in the speak English �not at all� category compared to the general American population of their age group. This figure is evidence of the linguistic isolation of the elderly Hmong-Americans. Disabilities Shown in Table 10, the Hmong in the U.S. were somewhat less likely to report having one disability compared to the U.S. population as a whole. At the same time, Hmong were somewhat more likely to report having two or more types of disabilities. Hmong reporting one type of disability were over-represented in the categories of having a mental disability, self-care disability, go-outside-home disability and employment disability. Hmong were underrepresented compared to the U.S. population as a whole in the categories of having a sensory disability or a physical disability. Citizenship Status 2000 Census data indicate that 55.6 percent of Hmong were foreign-born, compared to 11.1 percent in the general population. Of the foreign-born Hmong living in the U.S., 68.6 percent were not citizens compared to 59.7 percent of all foreign-born living in the U.S. Conversely, just over 30 percent of foreign-born Hmong had become naturalized citizens compared to 40.3 percent of all foreign-born persons living in the U.S. In 1990, just 9 percent of foreign-born Hmong had become naturalized U.S. citizens demonstrating that the progress in naturalization has occurred rapidly in the Hmong community from 1990 to 2000. Educational Attainment The Hmong population has made noteworthy progress in educational attainment since 1990, when only about 11 percent of the population held a high school diploma, and 3 percent reported holding a Bachelor�s degree. Though in 2000 the proportion of Hmong who were high school graduates (27.2 percent), held an Associate or Bachelor�s degree (11.7 percent) or Master�s Degree (1.5 percent) showed some increase in educational attainment. Table 13 continues to illustrate a significant gap for the Hmong in all levels of education. The Hmong figures were considerably lower than the figures for the entire U.S. population in all categories. Differences in the educational attainment of the Hmong population between states are further discussed in Kou Yang and Mark Pfeifer�s later article. Gender Differences in Educational Attainment The educational attainment figures (Tables 13A, 13B) show higher attainment levels among Hmong men compared to women nationally and in every state. A more detailed discussion of gender differences in educational attainment
4 The U.S. Census defines Linguistic Isolation as households in which no adult speaks only English; and no adult speaks English �very well.�

9
in Kou Yang and Mark Pfeifer�s article as well as Halee Vang and Rev. Kou Seying Thao�s articles are in this publication. Housing Tenure The Hmong homeownership rate has improved greatly since 1990, when just 13 percent of Hmong reported owning their homes. According to the 2000 Census data, 61.26 percent of Hmong rented while 38.74 percent owned their homes. This contrasts to the two-thirds of all Americans who own their homes. Significant variation in housing tenure is apparent between Hmong populations in different states. In Michigan, Kansas, Minnesota, Colorado, Georgia, Massachusetts, South Carolina, and Pennsylvania, Hmong homeownership rates exceeded 50 percent; however, in California, the Hmong homeownership rate was only 16 percent. This significantly brings down the national Hmong average, given the large numbers of Hmong living in California. The levels of Hmong homeownership are also quite low in Alaska, Oregon, Washington, Rhode Island, and Oklahoma. Income The 2000 Census indicates that the median Hmong household income was $32,076, about three-fourths of the $41,994 figure for the entire U.S. population. The median Hmong family income was $32,384, 64 percent of the $50,046 for all Americans. The Hmong per capita income in the U.S. was only $6,600, about one-third of the $21,587 figure for the entire U.S. population. There are still gaps, but Hmong incomes have improved significantly since 1990, when the enumerated Hmong median household income was just over $14,000, about 46 percent of the $30,000 for the general population. There is noteworthy state variation in Hmong incomes across the U.S. Hmong median household were much lower in California ($24,542) and Alaska ($25,179) compared to all other states. Hmong median household income was highest in Georgia ($54,000) and Colorado ($50,058). Indeed, in Georgia, Colorado, Massachusetts, South Carolina and Rhode Island, the Hmong median household income exceeded the average for the entire state populations. In these states the Hmong median household income ranged from about $45,000 to over $50,000. In most other states, Hmong median household income ranged from $35,000 to $45,000. Median Earnings by Gender According to the 2000 Census, the median earnings of enumerated Hmong ($15,835) were about two-third of the figure for the U.S. population as a whole ($23,755). As in the general U.S. population, a gender imbalance in earnings was apparent. The median earnings of Hmong males ($18,221) were significantly higher than those of Hmong females ($13,056). Poverty Status in 1999 by Age The percentile of Hmong persons across the U.S. living below the poverty level in 1999 was 38 percent compared to 12 percent of the entire population of the U.S. While still quite high compared to the overall U.S. population, the percentage of Hmong living below the poverty level across the U.S. has declined greatly from just above 60 percent in 1990. Poverty rates of Hmong populations differed greatly by state. The poverty rates of Hmong were highest in California and Alaska, where they exceeded 50 percent (53 percent and 60 percent respectively). Hmong poverty rates were enumerated below 20 percent in Georgia, Rhode Island, North Carolina, Massachusetts, South Carolina, Oregon, and Colorado. In Michigan, Wisconsin, and Minnesota, Hmong poverty rates were around 30 percent. In Washington State the Hmong poverty rate was 46 percent. The census shows that in most states, more than half of the Hmong population living in poverty in 1999 was under 18 years old. This reflects the youthful demographics of the Hmong population and represents a noteworthy contrast to the situation among the general population of most states in which the largest proportion of persons living below the poverty level are over 18 years old. A piece of good news is the fact that in states such as California, Minnesota, Wisconsin, Michigan, Colorado, Washington and Alaska, only one-third of the Hmong 18 years and older population lived under the poverty line � a big improvement over the situation in 1990.
10
Public Assistance Income Table 18 shows that 30 percent of the U.S. Hmong received public assistance income compared to 3 percent of the entire U.S. population. This represents a significant decrease from the 67 percent who reported receiving public assistance income in 1990. Again, the 2000 data reveal significant variation between Hmong populations in different states. Fifty (50) percent of Hmong in California and 70 percent of Hmong in Alaska reported receiving public assistance income, as did 35 percent of Hmong in Rhode Island and 28 percent in Minnesota. In Michigan, Wisconsin, Colorado, Kansas, Pennsylvania, Massachusetts and South Carolina, between 10 to 20 percent of Hmong reported receiving public assistance income. In Oregon, North Carolina, Oklahoma, and Georgia, less then 10 percent of Hmong stated that they received public assistance income in 1999. Employment Status The 2000 Census data indicate that 47 percent of Hmong Americans 16 years and older were not in the labor force compared to 36 percent of the entire national population of the same cohort (Table 19). Hmong labor force participation differed greatly among the states. Around 50 percent of Hmong in California, Minnesota, Alaska and Oklahoma were not being in the labor force compared to only around one-third in Georgia, South Carolina, Rhode Island, Oregon, Washington, North Carolina, and Massachusetts. In 2000 the unemployment rate among U.S. Hmong 16 years and over in the labor force was 10 percent compared to 18 percent in 1990, but still notably higher than the unemployment rate of 6 percent for the entire U.S. population. The 2000 Census indicates that the unemployment rates of the Hmong population also varied greatly between states with the highest Hmong unemployment rates in Washington State (22 percent), Alaska (16 percent) and California (14 percent), and the lowest Hmong unemployment rates in North Carolina (7 percent), Michigan (6 percent), Colorado (6 percent), Kansas (6 percent), Massachusetts (6 percent), Oregon (4 percent), South Carolina (3 percent) and Oklahoma (0 percent). In the two largest Hmong populated states of Minnesota and Wisconsin, the Hmong exhibited unemployment rates of 9 percent, significantly higher than the 3 percent for both states� entire populations in the pre-recession economy of early 2000. Employment Status by Gender Significantly higher percentages of Hmong females 16 years and over were not in the labor force (54 percent) compared to Hmong males (41 percent) resembling gender participation patterns in the entire U.S. population. The data also show that Hmong females were far more likely to not be in the labor force (54 percent) compared to the entire female U.S. population aged 16 and over (42 percent). The unemployment rates of U.S. Hmong males and females did not differ at 10 percent. Industry Distribution by Gender Employed Hmong men and women who were 16 years and older clustered mainly in manufacturing jobs (43 percent), followed by the arts and entertainment industry at 11 percent. The third major job concentration among Hmong men were retail trade, education, health and human services at 9 percent each. These distributions are fairly similar to the national population in these sectors. Employed Hmong women are also concentrated in manufacturing jobs (34 percent) comparing to only 9 percent of the national population, followed by education, health and human services at 21 percent (32 percent for the national female population), Hmong female employment in the arts, entertainment and recreation sector was at 10 percent, slightly higher than the national average, which stood at 9 percent. The states with the highest distribution of Hmong men and women in manufacturing jobs were South Carolina, North Carolina, Massachusetts, and Wisconsin. The states with the lowest distribution of Hmong men and women in manufacturing jobs were Alaska and California. Other states with major Hmong populations including Minnesota, Wisconsin and Oregon were somewhat in the middle. Variations in Hmong industrial sector concentration were apparent by state. In most states, with the notable exceptions of California, Alaska, Rhode Island, Oklahoma, and Kansas, greater than 50 percent of employed Hmong men worked in manufacturing. In California, Hmong men were to some extent clustered in education, health and

11
social services jobs and exhibited a much more modest agglomeration in manufacturing positions. In Kansas, notably exceptional large shares of Hmong men and women worked in transportation, warehousing, utilities, and food services, and in the case of Hmong women, education, health and social services. In examining all the prestigious job sectors in the U.S. economy, such as professional, scientific, management and administrative, Hmong men and women have made considerable progress considering that two decades ago the Hmong were among the preliterate refugee groups to the United States. The 2000 Census puts the Hmong distribution in these types of jobs at 7 percent for Hmong men and 5 percent for Hmong women compared to 10 percent for US men and 9 percent for US women. These types of jobs were almost unknown to most Hmong even a decade ago. Occupational Distribution by Gender In terms of measurements of occupational distribution, Hmong females (37 percent) and males (46 percent) aged 16 and over were concentrated disproportionately in production, transportation, and materials moving occupations compared to the general U.S. population which is similar to the distributions in 1990. These occupations are associated with the manufacturing positions discussed in the previous section. The next largest proportions of Hmong females (28 percent) were working in sales and office occupations followed by various management and professional occupations (17 percent), and a range of service occupations (17 percent), particularly food preparation and serving related jobs. As noted in the previous section, Hmong males exhibited somewhat stronger concentrations than Hmong females in manufacturing. Hmong men were somewhat less likely than females to be employed in service occupations and sales and office jobs. In comparison to the entire U.S. labor force, Hmong men and women were much less likely to work in management and professional related jobs and construction positions. Hmong male concentrations in services and sales and office occupations did not differ greatly from the national average. U.S. Hmong females, however, were less likely to work in sales and office occupations compared to U.S. females generally. In terms of state by state differences in occupational distributions of Hmong men and women, probably the most significant observation is the much lesser clustering of Hmong women and men in production, transportation, and materials moving occupations (largely conterminous with manufacturing jobs) in California compared to almost every state. In California, employed Hmong of both genders are somewhat more likely to work in service occupations, sales and offices, and management jobs compared to Hmong in most other states. Another noteworthy trend is the lack of Hmong concentration in fields that were previously known to them. One would suspect that a formerly preliterate people, such as, the Hmong would continue to have a strong desire to work in a sector such as farming, fishing, and forestry; however, the 2000 data indicate otherwise. The number indicates that as with the larger American public, only about 1 percent of Hmong were employed in farming, fishing and forestry jobs. The next census will reveal whether this trend will change, as there seems to also be more movement of the Hmong into rural areas.5
5 �Hmong Are Moving Again. This Time to Poultry Farms�, Wall Street Journal, January 26, 2004.

12
HMONG FAMILIES IN AMERICA IN 2000: CONTINUITY AND CHANGE
Zha Blong Xiong, Ph.D. Assistant Professor of Social Sciences, General College, University of Minnesota
Arunya Tuicomepee
Student, University of Minnesota Introduction
Since their arrival to the United States in 1975, several books and countless articles have been published to document the Hmong history, their involvement in the secret war in Southeast Asia, and their resettlement to the United States and other Western countries (For a complete list of references, see Hmong Culture Center, 2004; Yang, 2001). However, most published books and articles have not examined the Hmong family and the prevalence of early marriages in any systematic way. The purpose of this article is to explore the way in which Hmong families differ from U.S. families and examine the prevalence of early marriages in the Hmong community. This article uses 2000 U.S. Census data to shed some light on the phenomena and articulate needs that should be addressed in this community. The exact data file used for this article derived from the Census Bureau�s Public Use Microdata Samples (PUMS), Summary File 4 (SF 4). Household variables were selected from Summary File 4 to provide cross-tabulated data for our analyses. All of the data, except Table A, were based on the Census �long form� data, which was completed by a sample of about one-sixth of the population. National Trends in Population Since 1980, the Hmong population in the United States has quadrupled. Though this is a significant increase, these numbers only represent the census data. The census figures may have fallen short of the real population figures because of language and cultural barriers, unfamiliarity with surveys, and a history of suspicion of government etc. that led many to be non-responsive to the census. In 1980, there were 47,430 individuals who indicated that they were Hmong. By 1990, the number grew to 94,439 individuals, representing a 99 percent increase. From 1990 to 2000, the Hmong population went from 94,439 to 186,310, representing a 97 percent increase in that decade. Thus, from 1980 to 2000 the Hmong population increased by 295 percent. This drastic growth can be attributed to the high fertility rate in Hmong families. For instance, in 1990 about 35 percent of the Hmong population consisted of U.S. born children. The median age for the Hmong in 1990 was under 13, compared to 33 for the general American population. In 2000, over half of the U.S. Hmong population (56 percent) was under the age of 18. The median age of Hmong across the U.S. was 16.1 years compared to 35.3 for the entire U.S. population. If this growth pattern continues, it is projected that by 2010 the Hmong population will increase to about 368, 894 and by 2020 this population will reach one million. Trends of Ethnic Enclaves Ethnic enclaves continue to be a pattern in the Hmong American communities across the nation. Census data collected in 1990 and 2000 show that the pattern of Hmong individuals living in areas where other Hmong lived continued to be a trend. For example, in 1990 about 89 percent of the Hmong lived in California (46,892), Minnesota (16,833), and Wisconsin (16,373). A decade later, most Hmong (about 75 percent) are still concentrated in these three states, California (65,000), Minnesota (41,800) and Wisconsin (33,791). This pattern of enclaves has been a long tradition for the Hmong. Historically, the Hmong inhabited isolated villages away from the dominant culture throughout China and Southeast Asia (Yang, 1993), and prior to the huge influx of Hmong refugees from Laos to Thailand in 1975, about 65 percent of the Hmong population dwelled only in three provinces, Xieng Khouang (75,000), Luang Prabang (60,000), and Houa Phanh (55,000) (Yang, 1993). This ethnic enclave phenomenon formed in countries of resettlement has traditionally served as a social support mechanism, strengthened cultural preservation and ethnic pride, and most importantly, sheltered the Hmong against external prejudices and domination (Hamilton-Merritt, 1993).

13
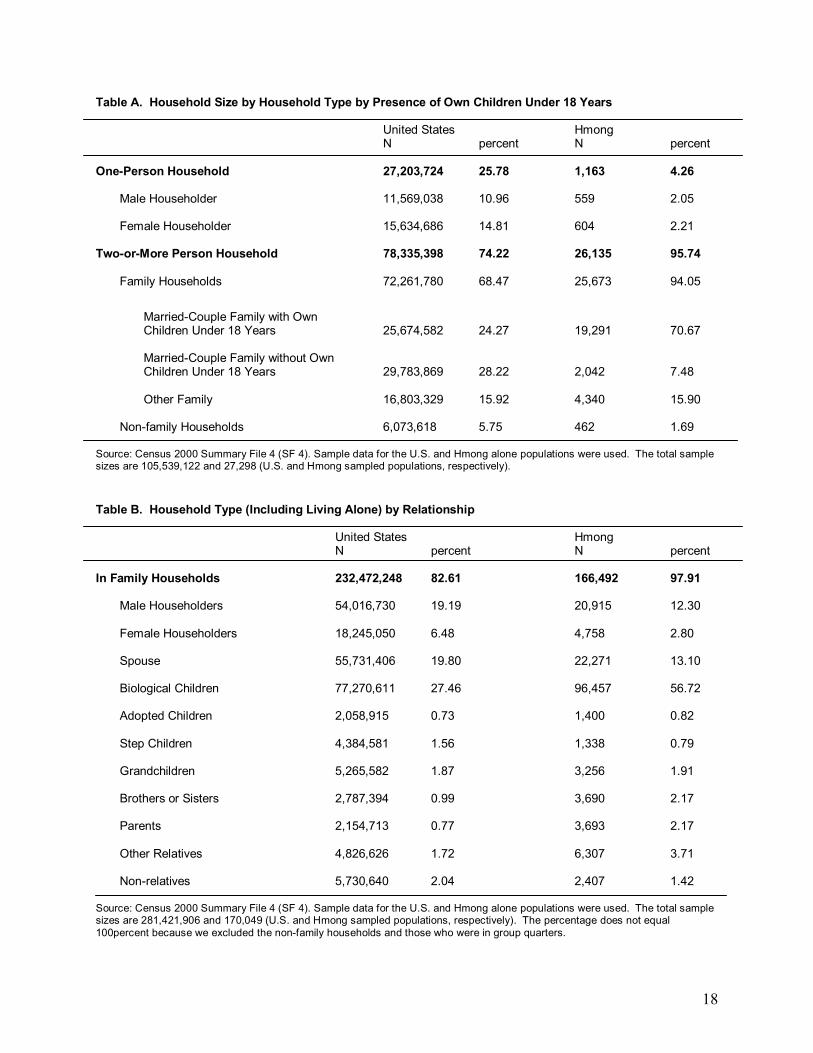
Establishing such a solid social boundary for the Hmong population, to some extent, may have impacted its members� ability to integrate linguistically into the larger society. For example, the 2000 Census found there were significantly more Hmong aged 18 to 64 in the category "speak English not well� and fewer Hmong were in the category �speak English very well� compared to the overall U.S. and other immigrant populations. Another study which used a random sample of urban Hmong, Somalis, Russians, and Hispanics in Minnesota also found a similar pattern where 40 percent of the Hmong surveyed reported that they �cannot speak English at all� compared to only 11 percent Somalis, even though they were in the U.S. longer (mean = 9.7 years) compared to Somalis (mean = 3.8 years) (Wilder Research Center, 2000). The latent consequence of ethnic enclaves will need to be observed and documented further to understand what ramifications it may have on the social, political, and economic integration of the Hmong into mainstream American society. Family Type, Size, and Composition Based on the census definition, the family household refers to anyone who is related by blood (i.e., biological children and their parents, siblings, and grandchildren), marriage (i.e., husband, wife, in-law), or adoption (i.e., adopted son or daughter). A non-family household refers to any individual(s) residing in the same household who is not related to the first householder (or �person 1�) by blood, marriage, or adoption. Members of the non-family household include roomers, boarders, housemates, roommates, unmarried partners, foster children, and other non-relatives, such as friends (Census Bureau, 2000). Three household types were examined for this report using data from the �one-person household,� �two-or-more person household type,� and �male/female householder with no wife/husband present� (see Table B).
Single-Adult Families The single-adult family type is based on data from the �one-person household� data. Historically, this family type was rare in Hmong agrarian society. In an agrarian society, the family is the central focus of an individual�s life in order to meet the day-to-day demands. However, after only two and a half decades in post-industrial American society, this type of family structure in the Hmong population has shifted towards the trend in the U.S. The census found 4.26 percent Hmong individuals living by themselves in a single-adult family compared to 25.78 percent of the U.S. population. Although the number of Hmong single-adult families is still relatively small, it is no longer rare. As the second generation Hmong, who are more acculturated than the 1.5 and first generations (Zhou & Bankston, 1998) reach adulthood, they are becoming financially independent and are able to delay marriage and childbearing. In turn, more are able to choose this type of living arrangement. We speculate that this emerging family type or living arrangement will continue to increase in the next decade since half of the Hmong population in the U.S. consists of people younger than 18 years of age, most of whom are second generation Hmong Americans. Married-Couple Families With Own Children Overall, there were more Hmong married-couple families with children compared to the U.S. population. The census found 71 percent of the Hmong population compared to 24 percent of the U.S. population living in this type of family. What does this mean? Two explanations are proposed. First, scholars (Dunnigan et al., 1996; Donnelly, 1994) point out that Hmong tend to marry young as most are married by the age of 16. Because the transition to adulthood in Hmong traditional culture is acquired through marriage and having children, it is expected that the Hmong figure for married-couple families with their own children would be high. On the other hand, the data might also suggest that due to the high divorce and remarriage rates in the U.S. population, U.S. children living in the family may not necessarily be related biologically to the head of the household. For example, sociologists found that about two-thirds of divorced women and three-fourths of divorced men eventually remarry, possibly creating stepparents and stepchildren (Schaefer, 2004). The 2000 Census data also illustrate that there were more U.S. married couples raising children who were not their biological children compared to Hmong married couples. Whether or not this dominant family structure in the Hmong community will continue in the future is something to be observed in the next decade.

14
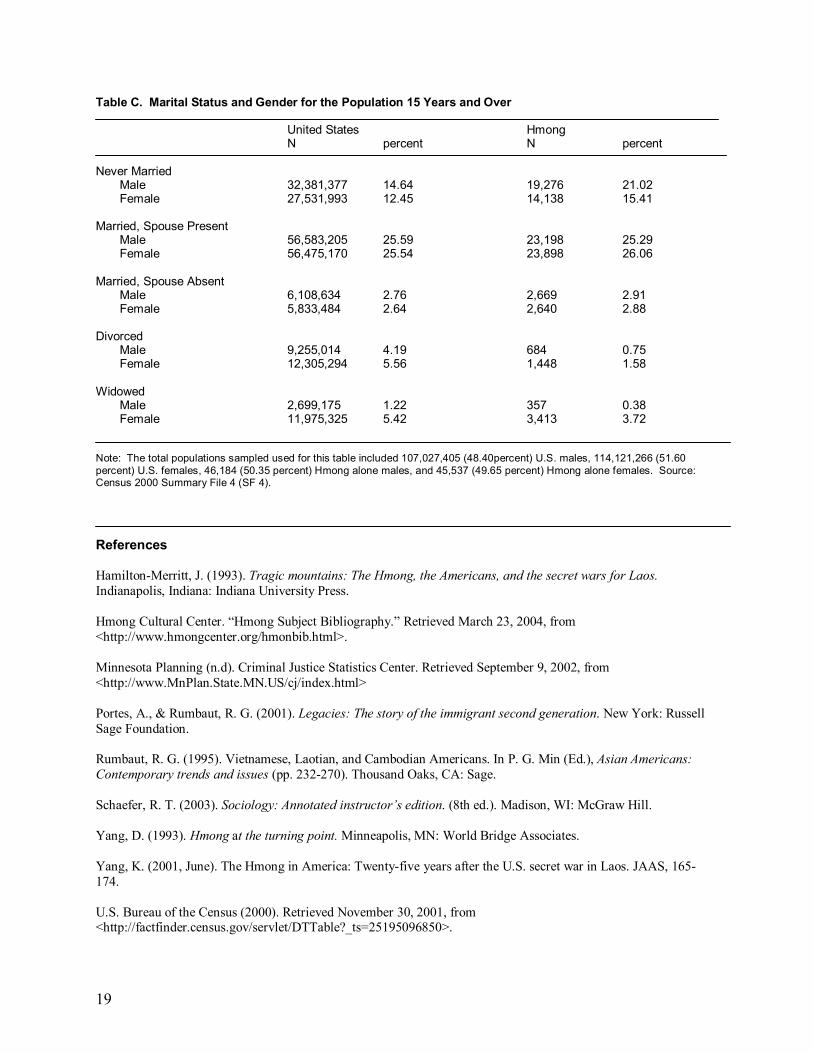
One-Parent Families One-parent families have attracted media attention and are central to political and TV talk shows since children raised in this family structure generally tend to perform poorer in school compared to children who come from married-couple families (Portes & Rumbaut, 2001). Although the number of one-parent families has tripled over the past three decades in this country (Statistical Abstract, 1995, Table 71; 2001, Table 57, cited in Henslin, 2004), the 2000 Census data showed that the U.S. overall rate was still lower than that of specific ethnic groups, including the Hmong. It is a paradox to find that the proportion of Hmong one-parent families (11.99 percent) was higher than the U.S. one-parent family proportion (9.06 percent) since the Hmong divorce rate was lower compared to the U.S. divorce rate (Figure 3). Further analyses of the census data is needed to make any conclusions about this finding since data used for this report were limited to Summary File 4. Whether or not Hmong have a higher proportion of one-parent families as compared to the U.S. population may not be the issue here. It appears that the proportion of one-parent families in the Hmong population is high. Why is there an increase in the one-parent Hmong families? Due to the lack of other data to help explain this paradox, we speculate that although legal divorce is rare, common law divorce or separation may not be uncommon in the Hmong community (Table C). Perhaps these common law practices, including early and polygamous unions and dissolutions, have contributed to the rise of one-parent families in the Hmong community. Family Composition More than half of the Hmong households (56.75 percent) consisted of biological children, who were under the age of 18 compared to U.S. family households (27.46 percent). The U.S. households tended to have a higher proportion of stepchildren (1.56 percent) as compared to Hmong families (0.79 percent). This higher proportion is expected in the U.S. households since the divorce and remarriage rates among the general American adult population were higher than in Hmong households (Table C). Hmong households were more likely to include biological children, but they also tended to have more extended family members as compared the general U.S. households. The data illustrate that Hmong households included a higher percentage of grandchildren, brothers or sisters, parents, and other relatives (10 percent) in comparison to U.S. households (5 percent). As suspected, this finding is consistent with the literature on the structure of Hmong families that Hmong families, in general, has traditionally been large, usually comprised of two to three generations that ranged from ten to twenty or more people living in the same household unit (Yang, 1993). It should be noted that although Hmong families included more extended family members than in the general U.S. households, the nuclear family structure (a married couple with their biological children) is still the predominant household composition. Early Marriages Among Modern Hmong Historically, early marriages served a legitimate purpose in the family and community in an agrarian society. In the agrarian society, the sooner a son brings home a bride the more tasks the mother, in particular, is able to share her household responsibilities, and the more help the family will gain from the extra body to work on the farm. Thus, the prevalence of early marriages in the Hmong�s earlier history raised no concern to the community. If people suddenly delayed marriages, it would be a concern to the family and society in an agrarian culture. However, because the Hmong are now living in post-industrial American society, it is important to assess if early marriage is still prevalent in the Hmong community. Segmented studies and observations seem to show that early marriage still exists and is prevalent in the Hmong community. Some studies found that the majority of Hmong females get married between the ages of 13 and 23 and most were married by the age of 16 (Dunnigan et al., 1996; Donnelly, 1994). In order to find out whether early marriages are still prevalent, data on those who never married and those who were married were examined.

15
Never Married
The census found that there were significantly more never-married Hmong under the age of 25 (31.46 percent) in comparison to the U.S. never-married population under 25 (14.92 percent). This discrepancy is expected since the majority of the Hmong population is very young. However, when looking at the Hmong data only, there were fewer never-married females compared to the males under the age of 24 (17.93 percent male vs. 13.53 percent female). The question becomes why were there more never-married Hmong males in the younger age groups despite the equal gender distribution in the never-married Hmong population (50.35 percent for male and 49.65 percent for female)? This disparity between the two genders in this age group can be explained by understanding some the historical acceptable cultural practices. In its history, it was not unusual for an older Hmong man to marry a younger woman (Figure 2). It was believed that because of status, the older male could better provide for his wife and family. Thus, marrying early is expected to be more prevalent among females than males. Married with a Spouse Present Census data shows that there were significantly more Hmong married women and men under the age of 24 (approximately 7 percent) in comparison to the general U.S. population (2 percent) (Figure 3). If converted, this 7 percent in real numbers (by multiplying this percentage by the total population counted) we estimate that there were about 11,815 individuals aged 24 or younger who reported they were married in 2000. However, by combining the data of both genders the difference between early marriage for males and females is masked. Females under the age of 24 marry earlier (4.97 percent) compared to males in that same age group (1.96 percent). This finding suggests that early marriage is more prevalent for Hmong females than males. Furthermore, we speculate that these early marriages may, to some extent, impact young Hmong women�s opportunities to enroll in higher education in order to attain advanced degrees (Figures 4 and 5). Figure 1. Never Married Population by Race, Gender, and Age
0 . 0 0 %
2 . 0 0 %
4 . 0 0 %
6 . 0 0 %
8 . 0 0 %
1 0 . 0 0 %
1 2 . 0 0 %
1 4 . 0 0 %
1 5 to 1 9y e a r s
2 0 to 2 4y e a r s
2 5 t o 2 9y e a r s
3 0 to 3 4y e a r s
3 5 to 4 4y e a r s
4 5 t o 5 4y e a r s
5 5 to 5 9y e a r s
U .S . m a le U . S . fe m a le H m o ng m a le H m o ng fe m a le
Note: The data presented on this graph were based on a cross-sectional design. Readers are cautioned not to interpret these lines as longitudinal data. A line graph was chosen for a presentational purpose only. Source: U.S. Census Bureau, 2000 (Summary File 4).

16
Figure 2. Married with Spouse Presented by Race, Gender, and Age
0 . 0 0 %
1 . 0 0 %
2 . 0 0 %
3 . 0 0 %4 . 0 0 %5 . 0 0 %
6 . 0 0 %7 . 0 0 %
8 . 0 0 %
9 . 0 0 %
1 5 to 1 9y e a r s
2 0 to 2 4y e a r s
2 5 to 2 9y e a r s
3 0 t o 3 4y e a r s
3 5 to 4 4y e a r s
4 5 to 5 4y e a r s
5 5 to 5 9y e a r s
U . S . m a le U . S . f e m a le H m o ng m a le H m o ng f e m a le
Note: The data presented on this graph were based on a cross-sectional design. Readers are cautioned not to interpret these lines as longitudinal data. A line graph was chosen for a presentational purpose only. Source: U.S. Census Bureau, 2000 (Summary File 4). Figure 3. Divorced by Race and Gender
0 . 0 0 0 %
0 . 2 0 0 %
0 . 4 0 0 %
0 . 6 0 0 %
0 . 8 0 0 %
1 . 0 0 0 %
1 . 2 0 0 %
1 . 4 0 0 %
1 . 6 0 0 %
1 . 8 0 0 %
1 5 t o1 9
y e a r s
2 0 t o2 4
y e a r s
2 5 t o2 9
y e a r s
3 0 t o3 4
y e a r s
3 5 t o4 4
y e a r s
4 5 t o5 4
y e a r s
5 5 t o5 9
y e a r s
U . S . m a le U . S . f e m a le H m o n g m a le H m o n g f e m a le
Note: The data presented on this graph were based on a cross-sectional design. Readers are cautioned not to interpret these lines as longitudinal data. A line graph was chosen for a presentational purpose only. Source: U.S. Census Bureau, 2000 (Summary File 4).

17
Figure 4. School Enrollment by Race and Gender
0.001.002.003.00
4.005.006.007.008.009.00
Nur
sery
scho
ol,
pres
choo
l:
Gra
de 1
togr
ade
4
Gra
de 9
togr
ade
12:
In g
radu
ate
orpr
ofes
sion
alsc
hool
U.S. Male U.S. Female Hmong Male Hmong Female
Note: The data presented on this graph were based on a cross-sectional design. Readers are cautioned not to interpret these lines as longitudinal data. A line graph was chosen for a presentational purpose only. Source: U.S. Census Bureau, 2000 (Summary File 4). Figure 5. Educational Attainment by Race and Gender
0 . 0 00 . 0 20 . 0 40 . 0 60 . 0 80 . 1 00 . 1 20 . 1 40 . 1 60 . 1 8
Grade 9
- 12
H.S. Grad
uate
Colleg
e, No D
egree
AA/AS Deg
ree
BA/BS Deg
ree
MA/MS D
egree
Prof./D
octor
ate D
egree
U . S . M a le U . S . F e m a le H m o n g M a le H m o n g F e m a le
Note: The data presented on this graph were based on a cross-sectional design. Readers are cautioned not to interpret these lines as longitudinal data. A line graph was chosen for a presentational purpose only. Source: U.S. Census Bureau, 2000 (Summary File 4).
18
Table A. Household Size by Household Type by Presence of Own Children Under 18 Years
United States Hmong N percent N percent One-Person Household 27,203,724 25.78 1,163 4.26
Male Householder 11,569,038 10.96 559 2.05 Female Householder 15,634,686 14.81 604 2.21
Two-or-More Person Household 78,335,398 74.22 26,135 95.74
Family Households 72,261,780 68.47 25,673 94.05
Married-Couple Family with Own Children Under 18 Years 25,674,582 24.27 19,291 70.67 Married-Couple Family without Own Children Under 18 Years 29,783,869 28.22 2,042 7.48 Other Family 16,803,329 15.92 4,340 15.90
Non-family Households 6,073,618 5.75 462 1.69 Source: Census 2000 Summary File 4 (SF 4). Sample data for the U.S. and Hmong alone populations were used. The total sample sizes are 105,539,122 and 27,298 (U.S. and Hmong sampled populations, respectively). Table B. Household Type (Including Living Alone) by Relationship
United States Hmong N percent N percent In Family Households 232,472,248 82.61 166,492 97.91
Male Householders 54,016,730 19.19 20,915 12.30 Female Householders 18,245,050 6.48 4,758 2.80
Spouse 55,731,406 19.80 22,271 13.10 Biological Children 77,270,611 27.46 96,457 56.72
Adopted Children 2,058,915 0.73 1,400 0.82
Step Children 4,384,581 1.56 1,338 0.79 Grandchildren 5,265,582 1.87 3,256 1.91 Brothers or Sisters 2,787,394 0.99 3,690 2.17 Parents 2,154,713 0.77 3,693 2.17 Other Relatives 4,826,626 1.72 6,307 3.71 Non-relatives 5,730,640 2.04 2,407 1.42
Source: Census 2000 Summary File 4 (SF 4). Sample data for the U.S. and Hmong alone populations were used. The total sample sizes are 281,421,906 and 170,049 (U.S. and Hmong sampled populations, respectively). The percentage does not equal 100percent because we excluded the non-family households and those who were in group quarters.
19
Table C. Marital Status and Gender for the Population 15 Years and Over
United States Hmong N percent N percent Never Married
Male 32,381,377 14.64 19,276 21.02 Female 27,531,993 12.45 14,138 15.41
Married, Spouse Present Male 56,583,205 25.59 23,198 25.29 Female 56,475,170 25.54 23,898 26.06
Married, Spouse Absent
Male 6,108,634 2.76 2,669 2.91 Female 5,833,484 2.64 2,640 2.88
Divorced
Male 9,255,014 4.19 684 0.75 Female 12,305,294 5.56 1,448 1.58
Widowed
Male 2,699,175 1.22 357 0.38 Female 11,975,325 5.42 3,413 3.72
Note: The total populations sampled used for this table included 107,027,405 (48.40percent) U.S. males, 114,121,266 (51.60 percent) U.S. females, 46,184 (50.35 percent) Hmong alone males, and 45,537 (49.65 percent) Hmong alone females. Source: Census 2000 Summary File 4 (SF 4). References
Hamilton-Merritt, J. (1993). Tragic mountains: The Hmong, the Americans, and the secret wars for Laos. Indianapolis, Indiana: Indiana University Press. Hmong Cultural Center. �Hmong Subject Bibliography.� Retrieved March 23, 2004, from <http://www.hmongcenter.org/hmonbib.html>. Minnesota Planning (n.d). Criminal Justice Statistics Center. Retrieved September 9, 2002, from <http://www.MnPlan.State.MN.US/cj/index.html> Portes, A., & Rumbaut, R. G. (2001). Legacies: The story of the immigrant second generation. New York: Russell Sage Foundation. Rumbaut, R. G. (1995). Vietnamese, Laotian, and Cambodian Americans. In P. G. Min (Ed.), Asian Americans: Contemporary trends and issues (pp. 232-270). Thousand Oaks, CA: Sage. Schaefer, R. T. (2003). Sociology: Annotated instructor�s edition. (8th ed.). Madison, WI: McGraw Hill. Yang, D. (1993). Hmong at the turning point. Minneapolis, MN: World Bridge Associates. Yang, K. (2001, June). The Hmong in America: Twenty-five years after the U.S. secret war in Laos. JAAS, 165-174. U.S. Bureau of the Census (2000). Retrieved November 30, 2001, from <http://factfinder.census.gov/servlet/DTTable?_ts=25195096850>.

20
Wilder Research Center (2000, November). Speaking for themselves: A survey of Hispanic, Hmong, Russian, and Somali immigrants in Minneapolis-St. Paul. Retrieved from March 10, 2004, from <http://www1.umn.edu/ihrc/wilder/wilder.htm#top>. Zhou, M and Bankston, Carl L. III. (1998). Growing up American: How Vietnamese children adapt to life in the United States. New York, NY: Russell Sage Foundation.

21
PROFILE OF HMONG EDUCATIONAL ATTAINMENT
Kou Yang, Ed.D. Chair, Ethnic and Gender Studies Department, and Associate Professor of Asian American Studies,
California State University, Stanislaus
Mark E. Pfeifer, Ph.D. Director, Hmong Resource Center, Hmong Cultural Center, St. Paul, MN
Educational Background of the Hmong
The Hmong came to the United States as refugees of the Secret War in Laos during the Vietnam War. Many speculated that they were unprepared linguistically, culturally, educationally, and economically to adapt to their new life in the United States. Most of the 130,000 Hmong refugees who have entered the United States since 1975 were pre-literate. A survey of the West coast in 1982 found that 70 percent of Hmong refugees were pre-literate (Ranard, 1988). Even earlier in the 1970s, D. Yang (1993) studied the Hmong of Laos and found that more than 90 percent of Hmong villagers were pre-literate. This was not unexpected because most of the Hmong of Laos did not have formal schooling. In Laos, only a few wealthy Hmong families could afford to send their sons to school in the 1930s. Given that the Hmong did not have their first village school until around 1939, it is not surprising to learn that the first Hmong to graduate high school did not happen till 1942; followed by the first college graduate in 1966, and the first doctorate graduate in 1972 (K. Yang, 2003b). This history coupled with living an agrarian society meant that the Hmong had to start their educational development and their new life in America at the very base of society. After almost three decades in the United States, the estimated 300,000Hmong American population has observed many successes, though it also continues to face many challenges in educational attainment. Since they first entered the United States in 1975, education has continuously been one of the most pressing issues facing Hmong Americans. Problems, such as low educational attainment, high drop-out rates, low test scores, and other educational related issues have preoccupied the Hmong American community (K. Yang, 2003a). The 1990 Census lists Hmong Americans as the Asian American group that had the lowest educational attainment (Shinagawa & Jiang, 1998). It showed that only three percent (3 percent) of Hmong Americans reported holding a Bachelor�s degree in 1990 compared to 58 percent of Asian Indians, who had the highest educational achievement among all Asian Americans in the United States. (Shinagawa & Jiang, 1998). Hmong American Educational Attainment Data from the 2000 Census indicates that almost half (45.3 percent) of the Hmong American population have no formal schooling compared to only 1.4 percent of all U.S. population in the same category. Given the Hmong�s educational history, this figure appears to be consistent with the percentage of Hmong who are foreign born (55.6 percent). Without educational preparation, many foreign born Hmong might not have been able to go beyond English-as-a-second language classes and vocational school. About 27.2 percent of Hmong Americans enumerated in the 2000 Census were high school graduates, 11.7 percent held Associates or Bachelor�s degrees, and 1.5 percent held graduate degrees. These percentages are much lower than figures for the general U.S. population, where 49.7 percent had high school diplomas, 21.9 percent held college degrees, and 8.9 percent had graduate degrees. However, when compared with 1990 Census data (where only 11 percent of Hmong held high school diplomas and only 3 percent had Bachelor�s degrees) there have been significant improvements for the Hmong. Interesting differences are observed in the educational attainment of the Hmong population between states. Hmong in California and Alaska are more likely to have reported having no schooling (the figure is above 50 percent in both states) compared to the population elsewhere. In certain states, including Georgia, Oregon, Massachusetts and Rhode Island, less than 25 percent of the enumerated Hmong had no schooling. Conversely, the percentage of Hmong who were high school graduates was much higher in Rhode Island, Oklahoma, Massachusetts, Oregon, Pennsylvania and Kansas compared to the national Hmong average. The states with the highest percentage of Hmong with a Bachelor�s or Associate�s Degree include Washington, Colorado, Oregon, Georgia and Rhode Island. Somewhat lower percentages of Hmong with Bachelor�s or Associate�s Degrees compared to the national average

22
were found in California, South Carolina, Kansas, Pennsylvania, Alaska and Oklahoma. Hmong in Minnesota, Wisconsin and Michigan resembled the U.S. Hmong average in terms of percentage holding a college degree. Gender Differences in Educational Attainment The educational attainment figures (Tables 13A, 13B) show higher attainment levels among Hmong men compared to women nationally and in every state. 56.8 percent of enumerated Hmong women across the United States reported having completed no schooling compared to 33.5 percent of Hmong men. 34.4 percent of enumerated Hmong men in the U.S. were high school graduates in comparison to 20.1 percent of U.S. Hmong women. 16.5 percent of enumerated Hmong men held Bachelor�s or Associates Degrees in contrast to 7.0 percent of Hmong women. 2.1 percent of Hmong men had attained a graduate degree compared to 1.0 percent of Hmong women. These figures seem to show the differential extent to which schooling has been available to Hmong men compared to Hmong women in Laos and perhaps also the United States. Unfortunately, the figures do not provide case breakdowns or useful gender-specific information about current enrollment so it is difficult to discern the extent to which the gender gaps are or are not being bridged in the current generation of Hmong enrolled and completing high school and college. References Bureau of the U.S. Census (2000). Educational Attainment, Data Set: Census 2000 Summary File 4 (SF4) Ranard, D.A. (1988, November), The Hmong. In America (1). Shinagawa, Larry Hajima and Michael Jiang (1998), Atlas of American Diversity. AltaMira Press. Yang, D. (1993), Hmong at The Turning Point, in Hmong at The Turning Point ed. Jean L. Blake, (Minneapolis: WorldBridge Associates, 1993). Yang, K. (2003a), Hmong Americans: Felt Needs, Problems and Community Development. Hmong Studies Journal, Vol. 4. Yang, K. (2003b), Hmong Diaspora of the Post War Period. Asian and Pacific Migration Journal, Vol. 12, No. 3. Notes 1. The 2000 U.S. Census counted Hmong Americans to be about 186,000. Many Hmong community leaders, however, estimated Hmong American population to be over 250,000 in 2004. It is probably between 200,000 and 250,000 because Hmong have a very young population and it is a very fast growing community.

23
HMONG AMERICAN WOMEN�S EDUCATIONAL ATTAINMENT: IMPLICATIONS FOR HMONG AMERICAN WOMEN AND MEN
Halee Vang, Ph.D. Candidate
University of Minnesota Introduction The earliest Hmong refugees to enter the United States arrived in 1975. The release of the 2000 Census, approximately 29 years later, shows Hmong Americans progressing slowly in the area of education. The majority of Hmong had little formal education prior to entering the U.S. Despite their low levels of formal education, many Hmong have managed to achieve some sort of education in the U.S. This determined nature is shown in the 2000 Census education data for the population; however, it is important to note that even with some progress, Hmong Americans still lag far behind most other Asian groups, as well as the general U.S. population when it comes to educational achievement in all levels. This article will discuss the educational attainment of Hmong women and Hmong men using the 2000 Census data. It will also discuss the widely held Hmong community perception and feeling that Hmong women are becoming more successful in education than Hmong men, despite the contradicting data reported in the 2000 Census. Hmong Women�s Educational Attainment From the mountains of Laos to a Senate seat in Minnesota, Hmong women have come a long way in higher education. According to the 2000 Census, Hmong women aged 25 years or older still lag behind in education when compared with the general U.S. female population. The Hmong census data included in this publication provides information about Hmong educational attainment in sixteen states, including: Alaska, California, Colorado, Georgia, Kansas, Massachusetts, Michigan, Minnesota, North Carolina, Oklahoma, Oregon, Pennsylvania, Rhode Island, South Carolina, Washington, and Wisconsin. The educational attainment data is organized into six categories: 1) No Schooling Completed, 2) 8th Grade or Less, 3) High School, No Diploma, 4) High School Graduate, including equivalency, 5) Associate or Bachelor�s Degree, and 6) Master�s Degree or Higher. In this paper, I will examine four out of the six categories: No Schooling Completed, High School Graduate (including equivalency), Associate or Bachelor�s Degree, and Master�s Degree or Higher. The 2000 Census data shows the percentages for Hmong women in these four categories as 56.8 percent for No Schooling Completed, 20.1 percent for High School Graduate, 7 percent for Associate or Bachelor�s Degree, and 1 percent for Master�s Degree or Higher. Cross-State Comparisons of Hmong Women�s Educational Attainment Comparing Hmong women�s educational attainment across the sixteen states and focusing on the low and high percentages is useful in understanding the differences in states, as well as to provide some comparison to the overall U.S. population. Among Hmong women in the No Schooling Completed category, Rhode Island had the lowest percent at 22.8, while Alaska had the highest at 87 percent. In the category of High School Graduate, again Alaska and Rhode Island are at opposites with zero percent and 48.7 percent respectively. In the Associate or Bachelor�s Degree category, Oklahoma and Kansas had zero (0) percent and Washington State showed that 16.4 percent of its Hmong women possessed an Associate or Bachelor�s degree. Finally, in the fourth category of Master�s Degree or Higher, twelve out of sixteen states showed zero (0) percent of Hmong women with advanced degrees, while Washington State enumerated 2.5 percent of Hmong women holding a graduate degree. Though examination of these numbers may make it appear that the educational attainment levels of Hmong women differ significantly across states, it is important to note that overall, Hmong women still lag far behind the overall U.S. population in all categories. Even in the categories with higher percentages, Hmong women�s educational attainment still remains much lower. For example, 56.8 percent of Hmong women had No Schooling Completed. This compares to 1.4 percent for all U.S. women. While 51 percent of all women in the U.S. are High School Graduates, only 20.1 percent of Hmong females are in the same category. In higher education seven (7) percent of Hmong women held an Associate or Bachelor�s Degree, compared to 21.8 percent of U.S. females. Again, only one (1) percent of enumerated Hmong females held a Master�s Degree or Higher compared to 7.8 percent of the overall

24
U.S. female population. Despite the gains made over the years, the fact remains that Hmong women�s educational attainment is still relatively low. Comparing Hmong Women�s and Men�s Educational Attainment In the same four categories of No Schooling Completed, High School Graduate (including equivalency), Associate or Bachelor�s Degree, and Master�s Degree or Higher, it is easily observed that the overall educational attainment trend of both genders in the Hmong population are very similar when compared to the U.S. population. However, when compared with each other, Hmong men appear to be doing better than Hmong women in some categories. For example, in the category of Associate or Bachelor�s Degree, between zero (0) percent and 16 percent of Hmong women were counted in this category, compared to 12 percent to 39 percent of Hmong men. In the category of Master�s Degree or Higher, Hmong women exhibited zero (0) percent in twelve of the sixteen states. This compares to seven states where Hmong men exhibit zero (0) percent in this category. When compared with the general U.S. population, both Hmong women and men still lag significantly behind. For example, only one (1) percent of Hmong women and two (2) percent of Hmong men had acquired their Master�s Degree or Higher. In the entire U.S. population the tabulated figure is eight (8) percent for females and ten (10) percent for males. Another difference is that there is no state where the overall U.S. population exhibits zero (0) percent in the category of Master�s Degree or Higher. Census Data vs. the Hmong Community�s Perceptions As shown, an examination based solely on the enumerated numbers in the 2000 Census data seems to show that there are more Hmong men who have achieved higher education compared to Hmong women. However, there exists a strong feeling in the Hmong community that Hmong women are becoming more successful in higher education than Hmong men. What is the basis for this belief and why does it exist? The Hmong community�s perception that Hmong women are becoming more successful than Hmong men in studying at college and obtaining higher education degrees is something that appears to be widely accepted. It is not clear whether those who believe this are saying that there are just more Hmong women now who are achieving some kind of higher education than in the past, or if they are implying that there are actually more Hmong women obtaining higher education than Hmong men. Whatever the case, when the question of who is more successful educationally is asked of Hmong persons, the response increasingly has become that Hmong women are becoming more successful. To clarify the meaning of �becoming more successful� greater in depth research needs to be conducted; however, in the meantime, this portion offers some thoughts on why this perception exists at all. Why is there such a difference between what the Census data shows and what the Hmong community�s perception is? There are some possible explanations for this contradiction. Exploration of Some Possible Explanations There are many possible explanations for the contradictions between the Census figures and what the community perceives about the educational attainment of Hmong men and women. First, intuitively, it makes sense when one looks at the history of the population. Historically, Hmong men received much more support in their pursuit of education while only a few Hmong women were allowed to attend school. Hmong girls were taught household chores in preparation for marriage. In the U.S., education is free and open to all boys and girls. This tremendously improved the educational opportunities for Hmong girls. Historical behavior might also explain the community�s perception that Hmong women are more successful in higher education then Hmong men. Again, with little research there are no conclusions that can be drawn, but perhaps the fact that Hmong women have historically not had these types of educational opportunities might explain why they may try harder to succeed when given the opportunities in higher education. In addition, Hmong girls are often given a lot of home responsibilities that might have actually served to better prepare them in their educational endeavors. Thus, to the community it could appear that Hmong women are becoming more successful in education than Hmong men.

25
It could also be that Hmong women have acquired, over time, the ability to adapt to new situations more quickly because of traditional expectations that they will leave their families after marriage. Hmong girls learn to move from one situation to another, while Hmong men remain with the family. This may better prepare Hmong women to be flexible and adjust to new environments. It should be noted that the Census data undercounts the population, and the actual extent of current Hmong educational attainment of both genders might be skewed. In addition, Hmong elders face cultural and linguistic barriers, as well as the feeling of not trusting outsiders with information, and may not have provided information about their family members, including children who are away at school. Thus, more research is needed to corroborate the Census data. Finally, another factor that may contribute to the perception that Hmong women are more successful in higher education than Hmong men may be due to news media images. The media often portrays minority men negatively. Thus, Hmong and other Southeast Asian men are often seen as violent or belonging to gangs. These images seen by the public and the community may lead to the general feeling that Hmong men are not doing well in education. Implications for the Community It is difficult to draw conclusive implications from the Census data for the community. Much more research needs to be done; however, if current education trends continue for Hmong women, one might speculate that Hmong men and women will continue struggling in their pursuit of higher education. If the community perception of Hmong women becoming more successful in higher education than Hmong men is not disputed, then the community may find it challenging to support both genders to achieve more in higher education. Hmong women who achieve educational success may increasingly be perceived as misfits within their own community, and may leave the Hmong community enclave to seek support and leadership opportunities outside of the community.

26
WHAT YOU CANNOT SEE IN THE U.S. 2000 CENSUS
Reverend Kou Seying (Kxf. Nyaj Kub Thoj), Professor Concordia University, St. Paul, MN
Introduction What you cannot see in the U.S. 2000 Census are the many facets of the HMong community. This commentary is an attempt to describe some of the facets that relate to higher education and the Christian community. While the 2000 Census displays many interesting changes in the HMong-origin data, many important dynamics have taken place during the same period that is not reflected in the Census. To fully appreciate these dynamics requires more focused research and studies within each area. This is beyond the scope of this brief commentary. Education Since I began teaching at Concordia University in the early 1990s, I noticed some major changes within the HMong student body. In any given course that I taught in the first half of the 1990s, the HMong male students tended to dominate in the achievement of better grades in comparison to their female counterparts. By the mid-1990s, my grade records suggested the opposite was occurring. There are a number of possible explanations for this. In the early 1990s, there were more HMong male students enrolled than female students. From the mid 1990s forward, I saw an increase in the enrollment of HMong female students at Concordia. This was also reflected in my congregation, which consists primarily of HMong in the twenty-something to thirty-something age categories, where there are more HMong men with bachelor degrees or higher degrees than women. At the same time, I have observed more women, especially young mothers, returning to or starting their college education. In some cases this happened because the husband recognizes that it is time for his wife to return to or start college even though he did not finish college. This is one variable to consider. This does not necessarily explain why HMong female students are increasingly dominating the top honors in the classroom. Here, I offer my pastoral opinion versus my teaching experiences. One of the many challenges to a HMong family, particularly young families, has to do with the identification of appropriate roles among males and females. HMong women have only their traditional roles in the home, but are increasingly taking more responsibilities outside the home, such as working. On the other hand, HMong men are struggling with their identities, unsure of their roles in the community and their clans. It is my observation through my pastoral care ministry that more young HMong men are having this identity crisis. As a result of this identity crisis among HMong males, the men tend to fill their void with extracurricular activities that are outside the home and community. This poses a challenge to the ability of HMong males to do well in school and complete college. It also contributes to the challenges in the home, whether as a husband or a son. At the same time, many young HMong mothers recognize the difficulty of life without an education; thus, they become more focused on their own education. This means that HMong women sometimes have to break the HMong traditional mandates at the risk of unconformity. For example, several of my HMong female students gave birth in the middle of a semester, but were not willing to miss class for more than two weeks. Though I was more than happy to accommodate their adherence to the HMong customary practice of a new mother staying home for one month after giving birth, these young women insisted on continuing their education. It is important to note that this observation does not imply that HMong female students will always do better than HMong male students. It is simply an observation that relates to some of the trends I have observed over a decade of teaching HMong students in the higher education context. Many HMong male students have excelled in the classroom over and over again. Some of them have become very successful in their careers. However, to see the positive contributions by HMong female students in higher education is quite refreshing given the lack of opportunity for them in our HMong history.

27
Religion/Christianity One of the concerns expressed in the early 1980s by some in the HMong community was the loss of the HMong language and culture. Many felt that as the HMong became Christians, they would forfeit the HMong language and culture, because Christianity was seen primarily as a Western phenomenon and an �American religion�. Within the last few years, however, many of these same individuals that raised these earlier concerns commented that the Christian church has become one of the best sources of the HMong language and cultural preservation. There are some explainable reasons for this. First of all, the Bible was translated into the HMong language (in both the Blue (Green) and White dialects) long before the arrival of HMong to America. Reading the Bible in the HMong language is a weekly occurrence both in Bible study and the worship context. Secondly, the hymnal also plays a vital role in the preservation of the HMong language. Instead of becoming obsolete, more new hymnals were published in the 1990s in mostly mainline denominations. Thus, the language was not in danger of disappearing just because HMong became Christians or joined the church. Young people and children prefer speaking English most of the time, but once Sunday school/Bible study and worship begins, English subsides and the HMong language takes precedence. Many HMong churches hold mid-week prayer services as well. This allows at least two occasions on a weekly basis to speak the language. As language is preserved, many aspects of HMong culture are also preserved as well. Preservation may be an inadequate term to describe this, but certainly the church has cultivated the HMong language and culture well. Christian HMong churches continue to grow. They will continue to play important roles in the lives of the HMong in America. Young people are asking difficult questions about traditional HMong beliefs. As the HMong become more educated, they will seek to understand their faith, as well as seek knowledge about the traditional animistic realm. A HMong scholar once remarked, �Either the young people will become Christians or Atheists.� It will be interesting to research the movement between religions among the HMong in the next decade. Some Thoughts on the Future of HMong in America As the 2000 Census indicates, the HMong have progressed in many areas over the past decade. The future looks very bright and quite encouraging. The HMong population here in the U.S. has the opportunity to impact not only the community here in the U.S., but worldwide through their educational, religious, socio-economic, and political influences. I am very encouraged by the surge in HMong-related scholarship. As more and more centers and universities conduct HMong studies and publish HMong-related scholarly works, it will have a global impact. Not many doors have been opened to HMong works in higher education, but there are many non-HMong who understand the untapped resources that the HMong can provide. They are very willing to make it possible to bring HMong-related scholarship to the forefront at the highest academic levels. In terms of contributions to the Christian church, the resources to equip HMong Christian leaders worldwide will primarily come from the HMong in America. The two biggest reasons for this are related to the financial and educational resources present in the HMong-American Christian community. In the last half-century since the HMong first became Christians, we have been mostly influenced by Western theology. In the decades and centuries to come, the HMong church will shift to more self-theologizing. As the center of Christianity shifts out of the West to Africa, Latin America, and Asia, the HMong will find a very fitting place to develop their own biblical theology with less of a Western coating. The HMong have much to offer in this area. If the Twin Cities metropolitan area provides any indication of the success stories of the HMong, HMong socio-economic and political influence will spread far and wide directly and indirectly. The economic resources available from the large Minneapolis-St. Paul HMong community will be unmatched by any other given HMong community around the world. This will have an interesting impact on how the rest of the HMong world perceives HMong Americans. Many of the HMong socio-economic-political issues around the world will be addressed in meaningful ways by the Twin Cities community due to it size and institutional scope. With these influences, the HMong will be able to move further ahead than at any time in their previous history. This statement perhaps best summarizes the future of the HMong, �The HMong have already transformed the City of St. Paul. The influence of HMong here

28
will impact the state of Minnesota, the nation, and the rest of the world as it is already the case in many areas.� (A statement by the Center for HMong Studies-Concordia University, St. Paul.)

29
CONTESTED ECONOMIC GROWTH AMONG HMONG AMERICANS
Chia Youyee Vang President of CHIA Consulting, Inc.
Ph.D. Candidate, University of Minnesota Introduction
Regardless of how and when people arrive in America, one of the underlying reasons for migrating is the hope for economic success, which is often achieved through educational and employment opportunities. Prior educational and work experiences in a home country often indicate the degree to which an immigrant will achieve upward economic mobility in America. As forced migrants, Hmong refugees have different experiences of coming to America than earlier immigrants of Asian descent. However, the legacy of labor challenges faced by the Chinese, Japanese, Filipinos, and Koreans in early America suggest that many Hmong refugees are affected by the historical labor isolation placed on people of Asian descent. Hmong refugees share similar characteristics with other Southeast Asians and some of the more recent refugee groups from Africa and Latin America. They all have limited or lack formal education, forcing members of these communities into jobs with little potential to move up. This essay discusses some of the critical reasons why caution should be taken when celebrating the significant improvement in income for the Hmong population from 1990 to 2000. Furthermore, it calls for a closer analysis of the quality of life of Hmong Americans. Draining the System or Is the System Draining Them? Various works of scholarship and media articles have highlighted the challenges faced by Hmong refugees in adjusting to life in America since the late 1970s when the first wave of Hmong refugees arrived in the United States. Many institutions treat the use of public assistance as a problem unique to the Hmong while some advocates �use� low-income, illiterate Hmong community members as a �showcase� for welfare rights efforts. For example, when the federal welfare law passed in August 1996, it gave states block grants to design, implement and evaluate their own welfare programs. During the 1996 and 1997 Minnesota legislative sessions, it was common to see busloads of Hmong men and women brought to the State Capitol to advocate for responsive welfare benefits. Many could not read the signs they held, but they stood in groups waiting for their mostly white leaders to gesture where they should go. As a lobbyist for a local nonprofit research and advocacy organization at the time, I watched as one man after another told stories of how they had fought for the Americans, and that the Americans had promised to take care of them. The women talked about how difficult it would be for them to go to work, because they had many children. There seemed to be some sympathy for the elderly and disabled, but those who spoke of the difficulties of having eight to ten children brought both surprise and suspicion from the legislators and the audience at the hearings. The non-verbal response from the audience indicated the demoralizing of Hmong women for having children they could not financially support. In one particular hearing, a Hmong woman testified that the reason she could not go to work was due to her hearing problems. A legislator challenged her by asking, �You can�t hear at all?� The woman replied, �No, I can�t.� He further asked, �But you can hear me from where you�re sitting?� Through the interpreter, she replied that she could hear him. He sat back in his chair and shook his head with disbelief. On the front pages of local newspapers, Hmong women and children, along with other women of color with dependent children, were displayed as hard-to-serve clients who had multiple barriers, all needing access to a variety of supportive services that cost the system too much. Some would argue that having large families is a Hmong cultural practice, and I would agree. However, I would argue that prior to the more stringent 1996 welfare law, there were underlying systemic promotions for Hmong men and women to have large families. Rather than being �punished� for having large families, Hmong couples would receive additional benefits, thus encouraging couples to have more children. Are the Hmong simply victims of larger social forces, or do they also have decision-making power regarding their health and well-being? In her study of Cambodian refugees in Oakland and San Francisco, anthropologist Aiwha Ong argues that while refugees become subjects of norms, rules, and systems, they also modify practices and agendas while nimbly deflecting control and interjecting critique. While Cambodian refugees are subjects who are acted upon, they also

30
act on their own behalf in pursuing values and assets that may contradict the ones assigned to them by the prevailing values. Ong further articulates that the dependence on a wide array of services was learned in the refugee camps.1 Like Cambodian refugees, Hmong refugees also had to define and redefine themselves to �fit� into particular system categories in order to obtain resources that were available for survival. Coming mostly from an agrarian background where people were proud and self-sufficient, accepting �hand-outs� was a new concept learned by the Hmong in refugee camps and in the United States. In retrospect, I would contend that if more Hmong refugees had been provided with the opportunity to work and provide for their families, rather than directed to the welfare office, many families might be financially better off today. Over the last several decades, I have observed that those Hmong refugees who resettled into areas with fewer Hmong families were more likely to be introduced to job opportunities after their refugee cash assistance ended than those resettled in areas with a large Hmong population. While social service agencies were important to the adjustment to American life, some services may have hindered Hmong refugees� potential to improve their economic situation. Income Growth but Wealth Disparity Although Census 2000 data show significant improvement in income for the enumerated U.S. Hmong population, it is troubling that the Hmong household income is only 64 percent of the U.S. household income. This is further complicated by the fact that the average number of family members in a Hmong household is three times that of the general U.S. population, which may explain the low enumerated Hmong per capita income of $6,600. Additionally, since those who completed Census questionnaires were most likely to be literate with higher socio-economic status, it can be assumed that if all Hmong, including those who are illiterate and are in the lower wage sectors had responded, the per capita income might even be lower. As table 15 illustrates, Hmong per capita income in 2000 is only 50 percent of the US per capita income in 1990, indicating that the standard of living for Hmong families significantly lags behind the general population. Such gaps can be explained by the concentration of Hmong people in manufacturing and service jobs in urban communities. Table 15 also shows an interesting income contrast between different States with Hmong populations. It can be speculated that the higher incomes may be due to the success of agricultural businesses that pioneering Hmong have established in southern states. Poverty Despite Economic Achievement The reduction of enumerated U.S. Hmong receiving public assistance from 1990 (67 percent) to 2000 (30 percent) suggests that the Hmong are becoming economically independent. Entrance into the labor force as well as the establishment of small businesses has allowed Hmong Americans to enjoy prosperity as never before. Despite their larger family size, Hmong Americans seem to be able to make ends meet. As the symbol of the American dream, homeownership has become a reality for many. It is important, however, to keep in mind that although there is economic achievement, the quality of life may still be problematic. For example, some Hmong parents may have accumulated wealth due to hard work and commitment at their jobs, but it may be at the expense of having very little time to spend with their children. Like many low-income families in mainstream society, Hmong parents may have to work different shifts and/or multiple jobs in order to put food on the table. Such situations present challenges to the family dynamic where spouses and children may feel neglected, leading to resentment and an increasing generation gap between young and old. Table 17 presents a troubling picture of the economic status of Hmong families. Whereas the total U.S. population with incomes below the poverty level was 12 percent, nearly 40 percent of the U.S. Hmong population in 2000 had income below the poverty level. Furthermore, the high percentage of Hmong under the age of 18 living in poverty (63 percent) has serious implications for the Hmong and mainstream community. Resiliency documented for the first generation of Hmong Americans show that many young people growing up in poverty have been able to overcome such barriers to achieve educational and economic success. It appears unlikely that most in this second generation, born and raised in poverty, will follow similar paths. Although there are variations in the motivation of young Hmong Americans to pursue higher educational opportunities, it is clear that extreme poverty has resulted in high dropout rates and a sense of hopelessness among the poorest community members. What is also disturbing about the data presented in Table 17 is the large difference between the overall state percentage and the percentage

31
of Hmong Americans living below the poverty line in States such as Alaska, California, Washington, Minnesota, and Michigan, all of which have between 30 percent and 60 percent of its total Hmong population living in poverty. Conclusion What does the future hold for Hmong Americans with respect to income and poverty? Further exploration needs to be pursued to examine the living conditions of Hmong populations across the United States. States such as Arkansas and Missouri have recently attracted a growing number of Hmong community members to the poultry industry. Quantitative data obtained from Census figures provide a snapshot of the status of living conditions; however, it lacks the thoughts and feelings from Hmong Americans. These data elements would be strengthened significantly by qualitative information about the daily lives of Hmong men, women, and children. The extent to which the Hmong has achieved economic prosperity and the American dream is heading in a positive direction. If past trends can be used to forecast future possibilities, the Hmong will eventually become successfully integrated into the economic fabric of American society. On the other hand, one must pay careful attention to the large percentage of the young Hmong population currently living in poverty. The downturn in the economy combined with the decreasing quality of public education in urban cities throughout the U.S. could force this new generation of Hmong Americans to fill low paying jobs, leading to a large working-poor population. Endnotes 1. Ong, Aiwha. 2003. Buddha is Hiding: Refugees, Citizenship, the New America. California Series in Public
Anthropology. Berkeley, Los Angeles, London: University of California Press

32
HMONG HOMEOWNERSHIP: UP SHARPLY IN THE 1990s BUT STILL LAGGING IN THE CENTRAL VALLEY
Michael Grover and Richard M. Todd6 Federal Reserve Bank of Minneapolis
In the initial stages of Hmong settlement in the United States, pessimism about the long-term prospects for their economic success was sometimes expressed [Daniels 1990, pp. 369-370]. The low level of Hmong homeownership in 1990 was consistent with this view. Whereas other immigrants arriving in the U.S. during the period of peak Hmong arrival (1975-1984) had achieved homeownership rates of 30 to 45 percent by 1990 [Borjas 2002, Table 1], Hmong homeownership remained below 10 percent. We use Census data7 to show that this situation changed dramatically in the 1990s. As part of a broader pattern of Hmong adaptation and economic gains, Hmong homeownership rates rose rapidly across most of the United States and generally closed the homeownership gap between the Hmong and other immigrant groups. However, some Hmong communities � most importantly the large Hmong settlements in metropolitan statistical areas (MSAs) of California�s Central Valley � did not fully share in the general rise in Hmong homeownership and now lag far behind the overall Hmong and immigrant populations in homeownership. We argue below that low levels of skills, employment, and income in Central Valley Hmong communities explain much but not all of this regional gap in Hmong homeownership. We further argue that the gap does not appear to be related to either housing prices or any general pattern of elevated discrimination against minority homebuyers in the Central Valley. We conclude with some ideas for further research on the regional gap in Hmong homeownership. Immigrant Homeownership Rises with Time in the United States Homeownership rates among cohorts of U.S. immigrants are usually quite low in the first few years after arrival in the U.S. and then rise over a 30 to 40 period to nearly converge with native-born homeownership rates. For example, Borjas [2002] estimates that among U.S. immigrant households whose head arrived between 1995 and 1999, only about 15 percent owned their home by 2000. This is similar to the initial experience of those who arrived in 1975-79, whose homeownership rate was about 20 percent in 1980. However, homeownership for this 1975-79 cohort jumped to over 45 percent in 1990 and to 56 percent in 2000. Similarly, the homeownership rate for U.S. immigrants arriving in 1985-89 jumped from 16 percent in 1990 to 35 percent in 2000. Borjas�s Table 1 further shows that by 2000 the homeownership rate for immigrants arriving before 1965 exceeded 70 percent, above the U.S. average and near the rate of ownership for native born households of the same age. The tendency for immigrant homeownership to start low and rise sharply reflects both cultural and economic adaptation. Many immigrants, especially in recent years, come to the U.S. with skills and education that do not prepare them to obtain high-paying jobs. With time they acquire better education, English language ability, and vocational skills, which translate into higher rates of employment and higher wages and incomes. Initially many immigrants also tend to cluster in a few �gateway� cities, like New York or Los Angeles, where high housing prices make homeownership difficult. With time, immigrants can relocate to areas with more affordable homes. Additional time in the U.S. also helps overcome inhibiting factors such as uncertainty over whether and where to settle in the U.S and lack of familiarity with the U.S. home buying process. Finally, life changes often associated with time in the U.S., such as marrying, or having children, often lead to a greater desire to own a home. Hmong Homeownership Rates Have Risen Sharply from Low Levels in 1990 The national Hmong homeownership rate in 1990 was under 10 percent, and rates ranged from about 6 to 12 percent in the three areas of concentrated Hmong settlement that we focus on � MSAs in the California Central Valley,
6 The views expressed here are those of the authors and do not necessarily represent the views of the Federal Reserve Bank of Minneapolis or the Federal Reserve System. 7 Data sources used in this article include: U.S. Census 1990 and 2000 Summary File 4; 5 Percent Sample U.S. Census Public Use Microdata Series 2000; 5 Percent Sample U.S. Census Public Use Microdata Series 1990 from Steven Ruggles and Matthew Sobek et al, Integrated Public Use Microdata Series (IPUMS): Version 3.0, Minneapolis: Historical Census Projects, University of Minnesota, 2003, http://www.ipums.org.

33
Wisconsin, and Minneapolis-St. Paul (MSP). Considering that most Hmong household heads had been in the U.S. for 5 to 15 years by that time, this rate was 20 to 35 percentage points below typical U.S. immigrant patterns. [Borjas 2002, Tables 1 and 2]. The Hmong disparity with other immigrant groups probably reflected significant cultural and material disadvantages facing Hmong refugees in their early years in the U.S., such as limited wealth at time of arrival, limited experience with English and written language, limited exposure to Western culture, low levels of formal education, limited experience in factory or office work, and residual health issues associated with their refugee and wartime experiences. By 2000, much of the earlier disparity in Hmong homeownership rates had disappeared. The rate of Hmong homeownership jumped to about 39 percent nationally and to about 54 percent in the large MSP and Wisconsin Hmong communities. Based on data for all immigrants arriving in the U.S. between 1975 and 1984, this cut the gap between Hmong and typical immigrant homeownership rates to 17 percentage points or less nationwide and to essentially zero (or negative) in MSP, Wisconsin MSAs, and many other areas of Hmong settlement. Sharp homeownership increases among younger Hmong household heads led the way. For example, in the three main areas of settlement (MSP and Wisconsin and Central Valley MSAs), Hmong households headed by individuals who had been 15-34 years old in 1990 experienced about a 40 percentage point rise in homeownership rates by 2000 (from 0-5 percent to 40-50 percent rates of ownership). The increasing skills, employment, and income of Hmong-Americans contributed to the sharp rise in Hmong homeownership in the 1990s. The percentage of Hmong household heads with at least a high school education rose from 37 to 47 percent between 1990 and 2000, and the percentage proficient in English rose from 40 to 55 percent. These and other skill increases were associated with an even steeper rise in workforce participation, from 23 percent of household heads in 1990 to 55 percent in 2000. Over the same period, the percentage of Hmong households with public assistance income fell from 71 to 34 percent. Greater employment helped boosted Hmong median household income by over 50 percent, after adjusting for inflation, between 1990 and 2000. The percentage of Hmong households with income below the poverty level fell from 60 to 38 percent over the same period. These indicators all point to a significant increase in the 1990s in the ability of Hmong households to buy a home. But Hmong Homeownership Lagged in the Central Valley MSAs While Hmong homeownership rates in most of the country were growing to 30 to 50 percent or more, rates in Fresno, Sacramento, and other MSAs in the large Hmong community in California�s Central Valley rose to only into the teens by 2000. Lagging Hmong homeownership in the Central Valley can be partly explained by the lower level of Hmong household income in that region. However, a significant gap remains even after controlling for differences in income (at least as income is measured in Census 2000). We examine and largely reject some other potential explanations, such as higher housing prices or an elevated level of discrimination against minorities generally. In 1990, only 4 percent of the Hmong households owned their homes in the Central Valley MSAs that we study (Chico, Fresno, Merced, Modesto, Sacramento-Yolo, Stockton, Visalia-Tulare-Porterville, and Yuba City). By 2000, about 16 percent of Hmong households in these MSAs were homeowners, a quadrupling of the 1990 rate but only a 12 percentage point gain over a decade in which Hmong homeownership rates grew by over 40 percentage points in MSP, Wisconsin MSAs, and other areas. No Central Valley MSA had a Hmong homeownership rate of even 20 percent by 2000. Low levels of skills, employment, and income among Hmong households in the Central Valley contributed to the low rate of homeownership there. Only 39 percent of Hmong household heads in the Central Valley MSAs had at least a high school education in 2000, and only 49 percent rated themselves proficient in English. High school graduation rates averaged 10 to 20 percentage points higher for Hmong household heads in MSP and the Wisconsin MSAs, and English proficiency rates were 10 to 15 percentage points higher there too. Workforce participation rates for Hmong household heads were 8 to 10 percentage points lower in the Central Valley MSAs than in MSP and the Wisconsin MSAs, and in 1999 the median income of Hmong households in the Central Valley MSAs ($24,500) was about two-thirds of median Hmong household income in MSP ($35,000) or the Wisconsin MSAs ($39,500). In 1999, poverty and use of public assistance remained high (about 51 percent for both) in the Central Valley MSAs as well. By 1999, the Hmong poverty rate had fallen to 33 percent in MSP and 21 percent in the

34
Wisconsin MSAs, and public assistance usage was even lower (27 and 13 percent, respectively). The large gap in income alone would depress Hmong homeownership in the Central Valley. However, household income reported in Census 2000 does not fully explain the gap. We control for the effects of income and age by computing homeownership rates within income categories for younger (head under age 45) Hmong households in MSP and the Central Valley and Wisconsin MSAs. Among younger Hmong households with income in the $20,000 to $39,999 range in the Central Valley MSAs, about 12 percent own their home, as compared to over 45 percent of younger Hmong households in MSP and the Wisconsin MSAs. Central Valley Hmong homeownership rates also lagged MSP and Wisconsin MSA rates by 15 to 40 percentage points for younger households with incomes in the $0-$19,999, $40,000-59,999, and $60,000- 79,999 income ranges as well. In other words, much of the Hmong homeownership gap in the Central Valley remains unexplained even after taking into account the lower Hmong incomes in that region. Do housing prices account for the remaining gap? We think not. Although California is famous for expensive real estate prices, housing remained relatively affordable in the Central Valley throughout the 1990s. We verify this by comparing the value of homes reported in Census 2000 by non-Hispanic white households in the Central Valley MSAs with those reported by non-Hispanic white households in MSP and Wisconsin MSAs with significant Hmong population. We find that the distribution of values is similar in these areas, with over half the reported values under $150,000 in 2000 and an additional 20 percent in the $150,000-199,999 range. We conclude that housing costs do not seem to explain the low level of Hmong homeownership in the Central Valley MSAs in 2000. A similar comparison leads us to reject differences in generic discrimination against minorities as an explanation. We compute the homeownership rate of younger (head under age 45) African-American households in six separate income brackets for MSP and the Central Valley and Wisconsin MSAs with significant Hmong settlement. We find nearly no difference in the African-American homeownership rates across the three regions once we have controlled for income and age in this way. At least for younger households, income alone appears to fully explain any differences in African-American homeownership rates, with no evidence that non-income factors like discrimination are higher in the Central Valley. Examination of other racial and ethnic groups also yields no evidence of elevated discrimination against minorities in general in the Central Valley MSAs. This evidence does not rule out the possibility that discrimination against Hmong households is higher in the Central Valley, but if so, it would not appear to be part of a general pattern of higher discrimination against minorities there. Apart from the skill, employment, and income differences discussed above, we have been unable to isolate other demographic differences to account for the regional gap in Hmong homeownership. The median age of household heads, household size, the number of years since arrival in the U.S., and many other individual and household Hmong demographic measures are not significantly different among the three areas studied. Concluding Remarks We document that Hmong homeownership rates in most of the United States rose sharply in the 1990s and significantly closed the homeownership gap between the Hmong and other 1975-1989 immigrant groups that was very wide in the 1990 census. The narrowing of this homeownership gap paralleled the rapid growth in Hmong households� skills, employment, and income in the 1990s. We also show that one large Hmong settlement area � MSAs in the Central Valley of California � failed to fully participate in the Hmong homeownership boom, and we note that lagging Hmong income levels in that area partly explain part the disparity. However, we present evidence that lower incomes cannot explain the entire Hmong homeownership gap in the Central Valley, and that the same is true for differences in housing prices, the general level of discrimination against minority home buyers, and regional Hmong demographic characteristics. We conclude that a full explanation of the low level of Hmong homeownership in the Central Valley MSAs requires further research on topics that may not be easily addressed with Census data alone. Potential effects such as those associated with current and past public assistance program participation, occupational opportunities, secondary migration patterns, and the responsiveness of local public and private institutions may require a combination of cross-disciplinary methodology, formal theoretical and statistical modeling, and creative use of alternative sources of information and data.

35
We close by noting that a more complete explanation of the regional differences in Hmong homeownership would be of more than historical interest. Because immigration and refugee resettlement are continuing at high levels in the U.S. and other high income countries, understanding the factors that contribute to long-run economic success for immigrants and refugees is important to the design of effective immigration and resettlement policies. These issues are heightened within the Hmong community now by the expected arrival from Thailand of thousands more Hmong refugees in 2004-2005. Understanding the patterns of Hmong success can also contribute to the broader question of why homeownership rates in the U.S. lag for minority groups in general. Finally, with immigrants making up a growing proportion of the younger working age population in the U.S. at the same time that the large cohort of U.S. natives born between 1946 and 1964 prepares to retire, the factors that determine homeownership among immigrants may be very important for understanding the housing prices, and thus the home equity and wealth, of all Americans. Tables
Homeownership Rates in Immigrant and Hmong Households, 2000*
2000 Homeownership Rate Minneapolis-St. Paul MSA Wisconsin MSAs California Central Valley MSAs
Household characteristics
All Immigrant
s Hmong*
Hmong Homeownersh
ip Rate
Hmong Household
Estimate
Hmong Homeownership
Rate
Hmong Household
Estimate
Hmong Homeownership
Rate
Hmong Household
Estimate
All households 47.4 37.5 54.3 6,380 53.5 4,039 16.2 8,091
Households by year of migration
1995-99 14.5 19.9 32.7 278 34.9 149 8.9 528 1990-94 26.4 20.5 34.4 1,380 34.5 585 3.6 1,629 1985-89 35.3 42.5 63.9 1,485 55.6 1,251 14.7 1,733 1980-84 46.0 36.8 53.7 1,869 48.3 1,136 16.9 2,245 1975-79 56.4 50.7 70.2 1,368 69.8 918 28.2 1,956 1970-74 60.0 ----- ----- ----- ----- ----- ----- ----- 1965-69 68.2 ----- ----- ----- ----- ----- ----- ----- 1960-64 72.8 ----- ----- ----- ----- ----- ----- ----- 1950-59 77.8 ----- ----- ----- ----- ----- ----- -----
* Only includes Hmong households from California�s Central Valley MSAs, Minneapolis-St. Paul MSA, and Wisconsin MSAs that report a year of arrival of 1975 or later. Sources: George Borjas, �Homeownership in the Immigrant Population,� May 2002, 37; Census 2000, 5 percent PUMS sample.
Hmong Household Estimates, 2000 Weighted 5 percent Census PUMS sample
Characteristic
California Central Valley MSAs Wisconsin MSAs Minneapolis-St. Paul, MN-WI
MSA
Households 8,314 4,180 6,506
Median household income $24,500 $39,500 $35,000
Workforce participation 51.8% 59.7% 62.5%
Poverty rate 51.1% 21.1% 33.3%
Mean public assistance income $4,029 $469 $1,792

36
Households using public assistance 51.0% 12.6% 27.2%
High school graduate 38.5% 48.6% 57.9%
Median age of household head 39 38 35
Median year of entry to U.S. 1983 1984 1984
Median household size 7 6 6
English able 48.7% 59.4% 63.5%
Married household head 82.1% 84.2% 76.7%
Hmong Household Estimates, 1990 and 2000* Weighted 5 percent Census PUMS sample
Characteristic 1990 2000
Number of Households 11,556 19,000
Median household income (in 2000 dollars) $19,335 $30,100
Workforce Participation 22.5% 55.2%
Poverty rate 59.5% 38.4%
Mean public assistance income (in 2000 dollars) $10,879 $2,480
Households using public assistance 70.5% 34.4%
High school graduate 36.8% 47.4%
Median age of household head 36 37
Median household size 7 6
English able 40.2% 54.6%
Married 79.9% 80.7%
Homeownership rate 6.8% 37.5%
* Only includes Hmong households from California�s Central Valley MSAs, Minneapolis-St. Paul MSA, and Wisconsin MSAs.
Hmong Homeownership Rates in MSAs, 1990-2000
Geographic area 1990 2000 United States MSAs* 11.6% 38.5% Minneapolis-St Paul MSA** 12.2 54.3 Wisconsin MSAs** 8.5 53.5 California Central Valley MSAs** 3.9 16.2 All Other U.S. MSAs* 30.9 49.8
* Census Summary File 4 1990 and 2000 ** 5 percent Census IPUMS sample (1990) and 5 Percent Census PUMS sample (2000)
References Borjas, George J. (2002), �Homeownership in the Immigrant Population.� Harvard University (May). [CHECK for more complete reference.] Daniels, Roger (1990), Coming to America: A History of Immigration and Ethnicity in American Life. New York, New York: HarperCollins Publishers

37
ABOUT THE AUTHORS SERGE LEE, Ph.D., is a social work research professor at California State University, Sacramento. He is the first Hmong American to hold a Ph.D. degree in Social Welfare. His areas of specialization include cross-cultural issues, child and family welfare, international social work, and health and mental health issues of Southeast Asians. MARK E. PFEIFER, Ph.D. Following work as a Visiting Assistant Professor at a university in Missouri, Mark came to the Hmong Cultural Center to manage the Hmong Resource Center in April 2000. He holds a Bachelor's Degree in Urban Affairs from Marquette University in Milwaukee, an M.A. in Urban Studies from Temple University in Philadelphia, and a Ph.D. in Social and Urban Geography from the University of Toronto. Mark is an author of an annotated bibliography of Hmong-related works. In addition, Mark serves as editor of the peer-reviewed Hmong Studies Journal (www.hmongstudies.org) and the Review of Vietnamese Studies (www.vstudies.org), an online academic journal that is part of his own Vietnamese Studies website. REVEREND KOU SEYING (Kxf. Nyaj Kub Thoj). Reverend Kou Seying is the first ordained HMong pastor in the Lutheran Church-Missouri Synod (LC-MS). He received his Bachelor Degree from Concordia University Wisconsin where he also taught in the aviation program. He completed his pastoral studies in 1991 with the Master of Divinity Degree from Concordia Theological Seminary-Ft. Wayne, Indiana. His graduate studies include systematic theology at Luther Seminary in St. Paul, Minnesota. Presently, he is completing his Ph.D. degree in Missiology from Concordia Theological Seminary-Ft. Wayne, Indiana. Rev. Seying served his vicarage in Merced, California. In 1991, he was ordained and installed as the first HMong pastor in LC-MS. He served as the pastor of HMong Lutheran Church in St. Paul, Minnesota from 1991-96. In 1995, he began a new task while serving the HMong congregation as a missionary-at-large for the Minnesota South District. He became a fulltime faculty member of Concordia University-St. Paul since 1998. Besides teaching theology and other HMong related areas, he serves as special adviser to the president and executive director of the HMong Institute. He was instrumental in the development of the Center for HMong Studies at Concordia University. Rev. Seying also leads the HMong worship and Bible studies at Bethlehem Lutheran Church in St. Paul, Minnesota. In addition, he is the speaker of Light of Life, a Christian radio program broadcasts in the HMong language. Rev. Seying and his family reside in St. Paul, Minnesota. CHIA YOUYEE VANG is president of CHIA Consulting, Inc., a research, evaluation and planning consulting firm based in Minneapolis, Minnesota. She is pursuing her doctoral degree in American Studies at the University of Minnesota. Her research interest is post-1965 immigration, with an emphasis on refugee resettlement. HALEE VANG is currently a Ph.D. candidate at the University of Minnesota, studying K-12 educational policy and administration and international education. She also holds a Master�s degree in special education with an emphasis on migrant education and students from linguistically diverse cultures from the State University of New York, New Paltz and a Bachelor�s degree in elementary education from Hamline University, Minnesota. Her areas of study are: women and leadership, the instruction of English Language Learners with disabilities, the Teachers of Color Policy in Minnesota, and bilingual education. ZHA BLONG XIONG, Ph.D. is an Assistant Professor of Social Sciences in the General College at the University of Minnesota. Dr. Xiong received his B.A. degree from Winona State University and his M.A. and Ph.D. degrees in the Department of Family Social Science at the University of Minnesota. He has been involved in research centered on parenting adolescent children in refugee and immigrant families, family education, and youth delinquency. He has served on the board of directors for the Hmong Nationality Archives, Minnesota parenting Association, and Dakota Alliance for Prevention; served as an advisory member of the Children, Youth, and Families Consortium at the University of Minnesota; and as a member of the personnel committee for the National Council on Family Relations. Dr. Xiong has co-published two parenting curricula and written several scholarly articles on Hmong and other Southeast Asian children, youth, and families.
KOU YANG, Ed.D. is the Chair of the Ethnic and Gender Studies Department, and Associate Professor of Asian American Studies at California State University, Stanislaus. He is also the Co-Director of California State University, Stanislaus� 2004 Fulbright Group Project to China. Dr. Kou Yang is also a member of the Board of

38
Directors of Hmong National Development, Inc. and has previously served on many local committees and nonprofit boards, including the Commission of the Future of Education in Fresno County. MICHAEL GROVER is a Research Associate with the Community Affairs Program at the Federal Reserve Bank of Minneapolis. Michael's research interests focus on housing, homeownership, urban development, and community development corporations. He obtained a Ph.D. in urban studies from the University of Wisconsin at Milwaukee in May of 2004. Michael has a B.A. in history from Saint Cloud State University and an M.A. in American history from the University of Wisconsin at Milwaukee. Before coming to the Federal Reserve Bank of Minneapolis, he was a senior health workforce analyst with the Minnesota Department of Health. RICHARD M. TODD is a Vice President in the Supervision, Credit, and Regulation Division of the Federal Reserve Bank of Minneapolis, with responsibilities for Community Affairs, Bank Applications, and Credit/Payments System Risk. He has also served at the Bank as an Economist in the Research Department and as an officer in Information Technology. Dr. Todd has published articles in economics on monetary policy, business cycles, financial regulation, forecasting, and seasonality and has taught as an adjunct professor at the University of Minnesota, the University of St. Thomas, the Warsaw School of Economics, and Macalester College. He holds a Ph. D. in Agricultural and Applied Economics from the University of Minnesota.

39
APPENDIXES MAPS
Map 1 � Hmong Americans by County 2000 Map 2 � Hmong by County 2000 (dot density) Map 3 � Hmong Growth by State 1990 � 2000 Map 4 � Hmong Population Change by County for California 1990 � 2000 Map 5 � Hmong Population Change by County for Minnesota 1990 � 2000 Map 6 � Hmong Population Change by County for Wisconsin 1990 � 2000
TABLES
Table 1: Hmong Population Table 2: U.S. Regions and States Table 2A: Hmong American Population Table 3: Metropolitan Areas Table 4: Age Distribution Table 5: Gender Distribution Table 6: Household Size and Household Size by Tenure Table 7: Year of Entry Table 8: Migration Table 9: Linguistic Isolation Table 10: Ability to Speak English by Age Table 11: Types of Disability Table 12: Citizenship Status Table 13: Educational Attainment Table 13A: Educational Attainment, Males Table 13B: Educational Attainment, Females Table 14: Housing Tenure Table 15: Income Table 16: Median Earnings by Gender Table 17: Poverty Status in 1999 by Age Table 18: Public Assistance Income in 1999 for Household Table 19: Employment Status Table 19A: Employment Status by Sex Table 20A: Industry Distribution Table 20B: Industry Distribution (continued) Table 20C: Industry Distribution (continued) Table 21A: Occupational Distribution, Males Table 21B: Occupational Distribution, Males (continued) Table 21C: Occupational Distribution, Males (continued) Table 21D: Occupational Distribution, Females Table 21E: Occupational Distribution, Females (continued) Table 21F: Occupational Distribution, Females (continued)

40
Map 1 � Hmong Americans by County 2000
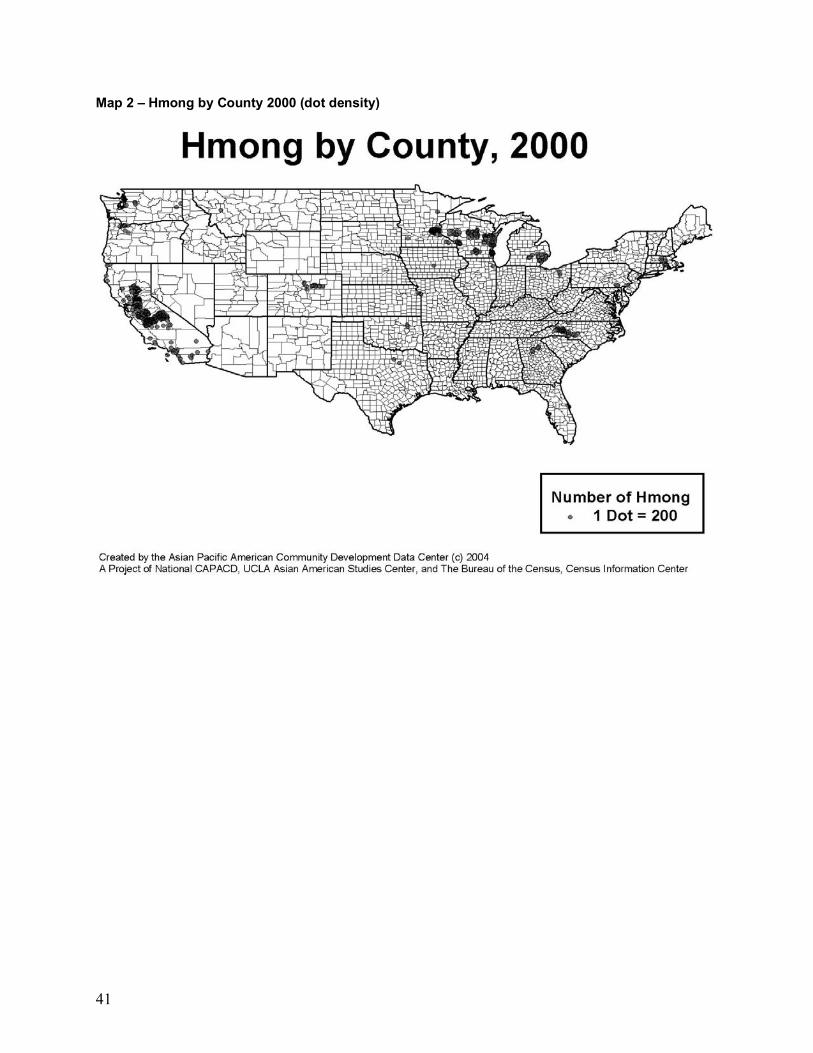
41
Map 2 � Hmong by County 2000 (dot density)
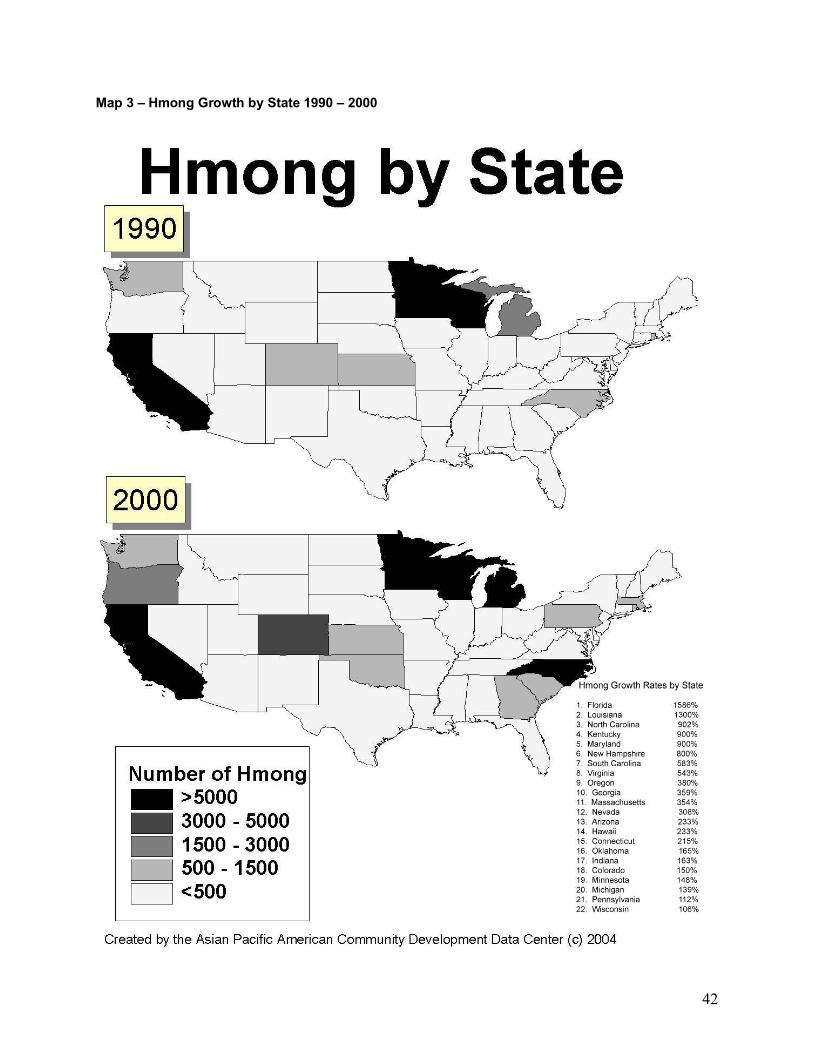
42
Map 3 � Hmong Growth by State 1990 � 2000

43
Map 4 � Hmong Population Change by County for California 1990 � 2000
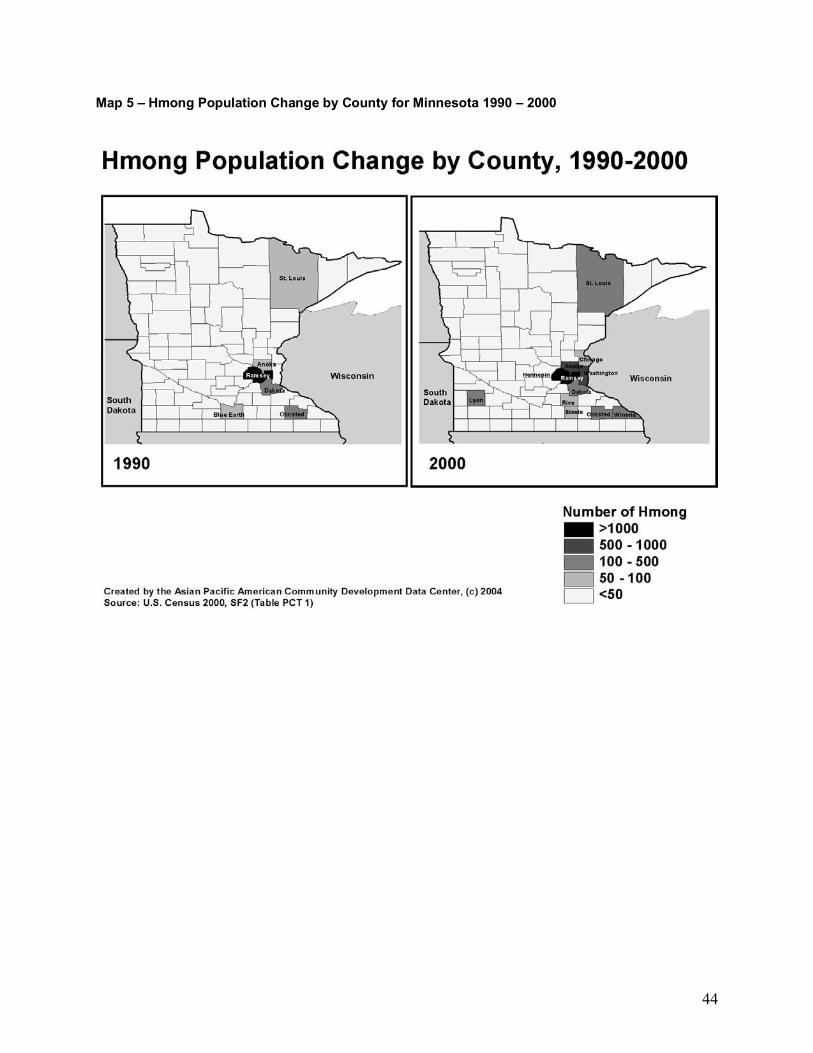
44
Map 5 � Hmong Population Change by County for Minnesota 1990 � 2000

45
Map 6 � Hmong Population Change by County for Wisconsin 1990 � 2000