hemas india.pptx
TRANSCRIPT
Launch of Hair Care in India
HEMAS India Pvt. Ltd.4th April’ 2014
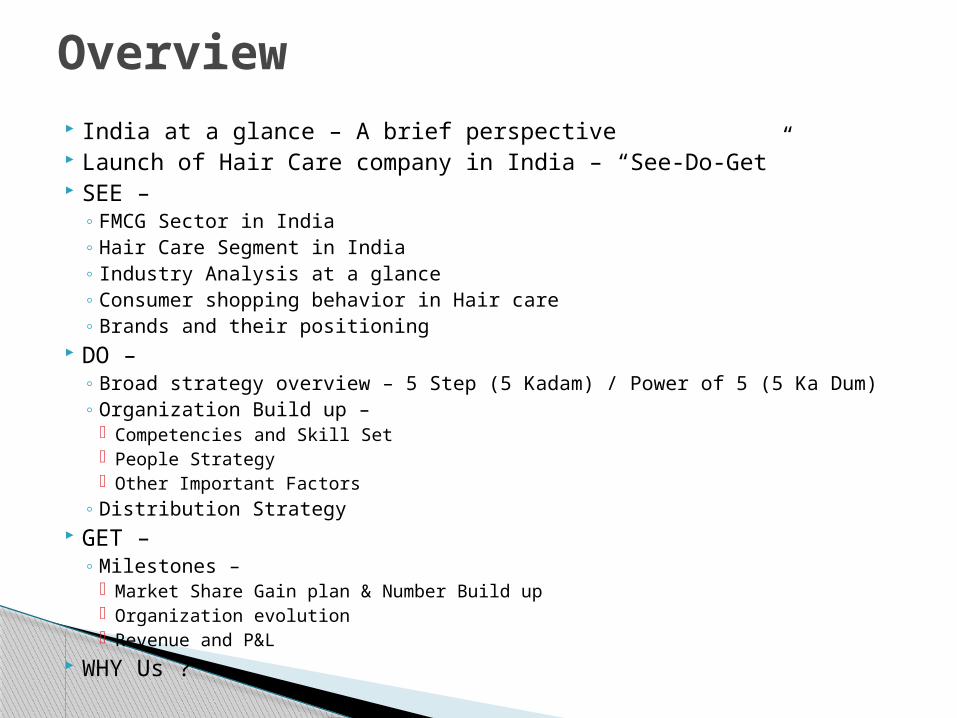
India at a glance – A brief perspective Launch of Hair Care company in India – “See-Do-Get” SEE –
◦ FMCG Sector in India◦ Hair Care Segment in India◦ Industry Analysis at a glance◦ Consumer shopping behavior in Hair care◦ Brands and their positioning
DO – ◦ Broad strategy overview – 5 Step (5 Kadam) / Power of 5 (5 Ka Dum)◦ Organization Build up –
Competencies and Skill Set People Strategy Other Important Factors
◦ Distribution Strategy GET –
◦ Milestones – Market Share Gain plan & Number Build up Organization evolution Revenue and P&L
WHY Us ?
Overview
‘SEE’ Part – India, Indian FMCG Market, Indian Hair Oil Market
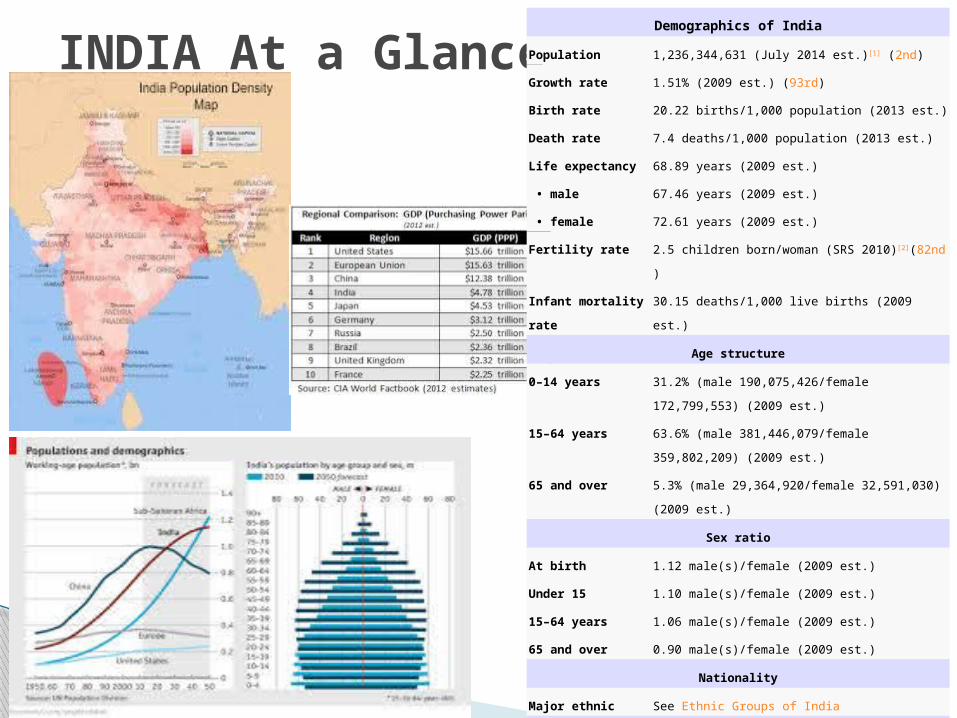
INDIA At a Glance Demographics of India
Population 1,236,344,631 (July 2014 est.)[1] (2nd)
Growth rate 1.51% (2009 est.) (93rd)
Birth rate 20.22 births/1,000 population (2013 est.)
Death rate 7.4 deaths/1,000 population (2013 est.)
Life expectancy 68.89 years (2009 est.)
• male 67.46 years (2009 est.)
• female 72.61 years (2009 est.)
Fertility rate 2.5 children born/woman (SRS 2010)[2](82nd)
Infant mortality rate 30.15 deaths/1,000 live births (2009 est.)
Age structure
0–14 years 31.2% (male 190,075,426/female 172,799,553) (2009
est.)
15–64 years 63.6% (male 381,446,079/female 359,802,209) (2009
est.)
65 and over 5.3% (male 29,364,920/female 32,591,030) (2009 est.)
Sex ratio
At birth 1.12 male(s)/female (2009 est.)
Under 15 1.10 male(s)/female (2009 est.)
15–64 years 1.06 male(s)/female (2009 est.)
65 and over 0.90 male(s)/female (2009 est.)
Nationality
Major ethnic See Ethnic Groups of India
Language
Official See Languages of India
INDIA At a Glance continued..
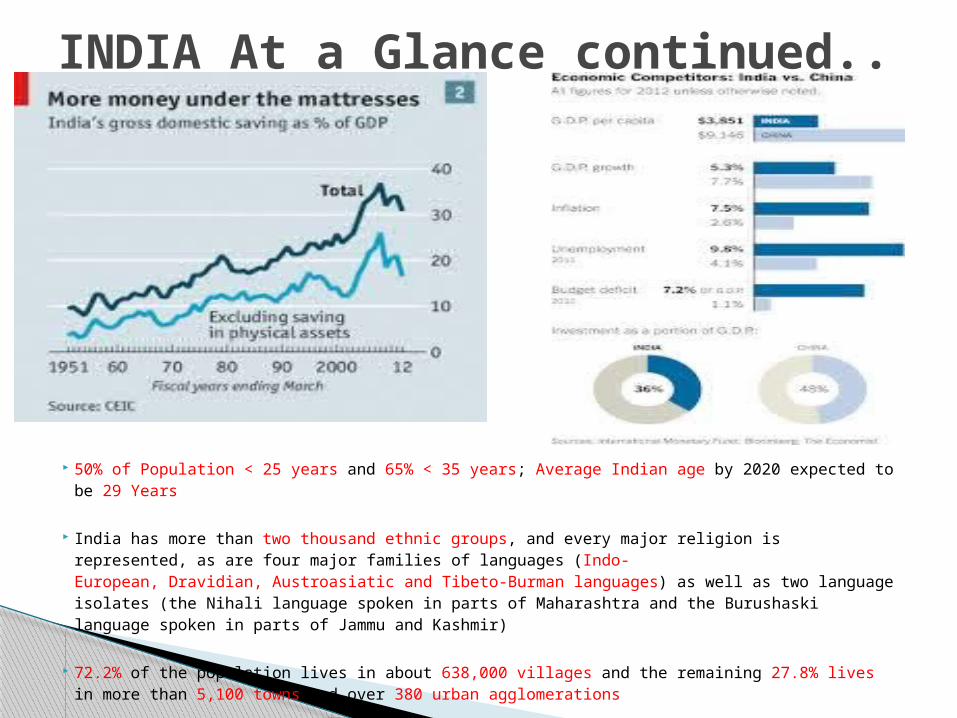
50% of Population < 25 years and 65% < 35 years; Average Indian age by 2020 expected to be 29 Years
India has more than two thousand ethnic groups, and every major religion is represented, as are four major families of languages (Indo-European, Dravidian, Austroasiatic and Tibeto-Burman languages) as well as two language isolates (the Nihali language spoken in parts of Maharashtra and the Burushaski language spoken in parts of Jammu and Kashmir)
72.2% of the population lives in about 638,000 villages and the remaining 27.8% lives in more than 5,100 towns and over 380 urban agglomerations
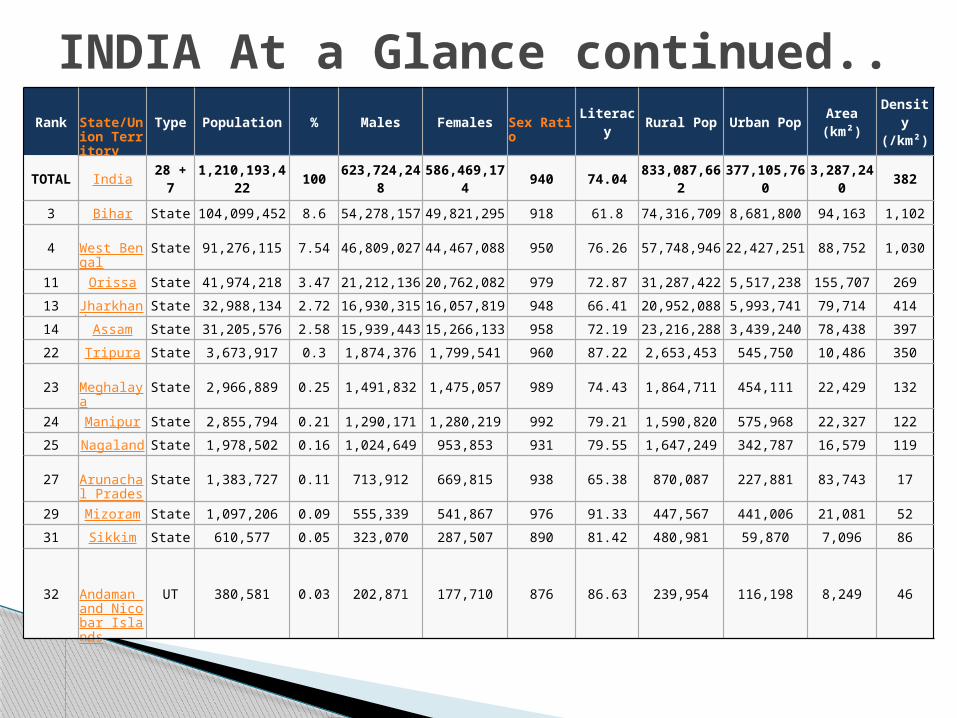
INDIA At a Glance continued..Rank State/Unio
n TerritoryType Population % Males Females Sex Ratio Literacy Rural Pop Urban Pop Area (km²) Density
(/km²)
TOTAL India 28 + 7 1,210,193,422 100 623,724,248 586,469,174 940 74.04 833,087,662 377,105,760 3,287,240 382
3 Bihar State 104,099,452 8.6 54,278,157 49,821,295 918 61.8 74,316,709 8,681,800 94,163 1,102
4 West Bengal State 91,276,115 7.54 46,809,027 44,467,088 950 76.26 57,748,946 22,427,251 88,752 1,030
11 Orissa State 41,974,218 3.47 21,212,136 20,762,082 979 72.87 31,287,422 5,517,238 155,707 269
13 Jharkhand State 32,988,134 2.72 16,930,315 16,057,819 948 66.41 20,952,088 5,993,741 79,714 414
14 Assam State 31,205,576 2.58 15,939,443 15,266,133 958 72.19 23,216,288 3,439,240 78,438 397
22 Tripura State 3,673,917 0.3 1,874,376 1,799,541 960 87.22 2,653,453 545,750 10,486 350
23 Meghalaya State 2,966,889 0.25 1,491,832 1,475,057 989 74.43 1,864,711 454,111 22,429 132
24 Manipur State 2,855,794 0.21 1,290,171 1,280,219 992 79.21 1,590,820 575,968 22,327 122
25 Nagaland State 1,978,502 0.16 1,024,649 953,853 931 79.55 1,647,249 342,787 16,579 119
27 Arunachal Pradesh
State 1,383,727 0.11 713,912 669,815 938 65.38 870,087 227,881 83,743 17
29 Mizoram State 1,097,206 0.09 555,339 541,867 976 91.33 447,567 441,006 21,081 52
31 Sikkim State 610,577 0.05 323,070 287,507 890 81.42 480,981 59,870 7,096 86
32 Andaman and Nicobar Islands
UT 380,581 0.03 202,871 177,710 876 86.63 239,954 116,198 8,249 46
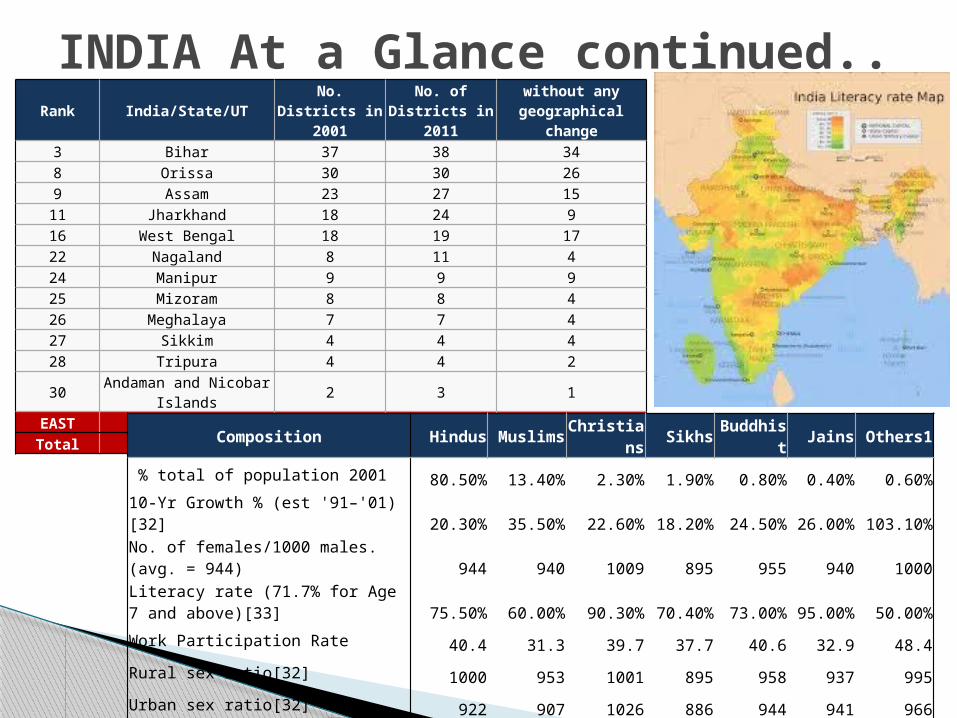
INDIA At a Glance continued..Rank India/State/UT No. Districts in
2001No. of Districts in
2011without any
geographical change3 Bihar 37 38 348 Orissa 30 30 269 Assam 23 27 15
11 Jharkhand 18 24 916 West Bengal 18 19 1722 Nagaland 8 11 424 Manipur 9 9 925 Mizoram 8 8 426 Meghalaya 7 7 427 Sikkim 4 4 428 Tripura 4 4 2
30 Andaman and Nicobar Islands 2 3 1
EAST EAST 168 184 129Total INDIA 593 640 464
Composition Hindus Muslims Christians Sikhs Buddhist Jains Others1
% total of population 2001 80.50% 13.40% 2.30% 1.90% 0.80% 0.40% 0.60%10-Yr Growth % (est '91–'01)[32] 20.30% 35.50% 22.60% 18.20% 24.50% 26.00% 103.10%No. of females/1000 males. (avg. = 944) 944 940 1009 895 955 940 1000Literacy rate (71.7% for Age 7 and above)[33] 75.50% 60.00% 90.30% 70.40% 73.00% 95.00% 50.00%Work Participation Rate 40.4 31.3 39.7 37.7 40.6 32.9 48.4Rural sex ratio[32] 1000 953 1001 895 958 937 995Urban sex ratio[32] 922 907 1026 886 944 941 966Child sex ratio (0–6 yrs) 925 950 964 786 942 870 976
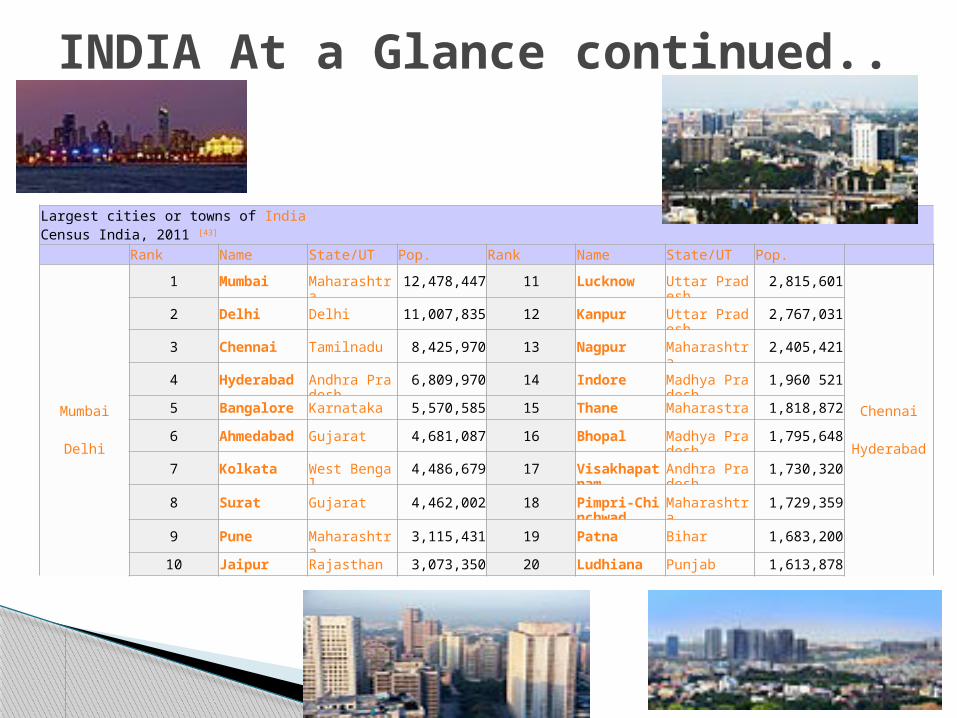
INDIA At a Glance continued..
Largest cities or towns of IndiaCensus India, 2011 [43]
Rank Name State/UT Pop. Rank Name State/UT Pop.
Mumbai
Delhi
1 Mumbai Maharashtra 12,478,447 11 Lucknow Uttar Pradesh
2,815,601
Chennai
Hyderabad
2 Delhi Delhi 11,007,835 12 Kanpur Uttar Pradesh
2,767,031
3 Chennai Tamilnadu 8,425,970 13 Nagpur Maharashtra 2,405,421
4 Hyderabad Andhra Pradesh
6,809,970 14 Indore Madhya Pradesh
1,960 5215 Bangalore Karnataka 5,570,585 15 Thane Maharastra 1,818,8726 Ahmedaba
dGujarat 4,681,087 16 Bhopal Madhya Pra
desh1,795,648
7 Kolkata West Bengal 4,486,679 17 Visakhapatnam
Andhra Pradesh
1,730,320
8 Surat Gujarat 4,462,002 18 Pimpri-Chinchwad
Maharashtra 1,729,359
9 Pune Maharashtra 3,115,431 19 Patna Bihar 1,683,20010 Jaipur Rajasthan 3,073,350 20 Ludhiana Punjab 1,613,878
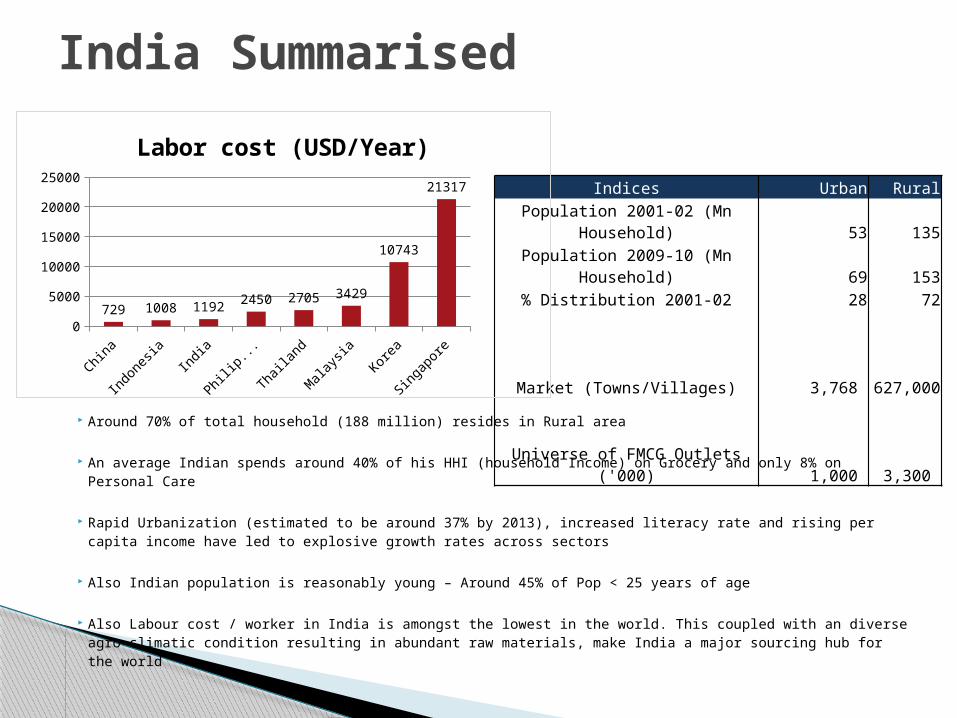
India Summarised
Indices Urban RuralPopulation 2001-02 (Mn Household) 53 135Population 2009-10 (Mn Household) 69 153
% Distribution 2001-02 28 72
Market (Towns/Villages) 3,768 627,000
Universe of FMCG Outlets ('000) 1,000
3,300
Around 70% of total household (188 million) resides in Rural area
An average Indian spends around 40% of his HHI (household Income) on Grocery and only 8% on Personal Care
Rapid Urbanization (estimated to be around 37% by 2013), increased literacy rate and rising per capita income have led to explosive growth rates across sectors
Also Indian population is reasonably young – Around 45% of Pop < 25 years of age
Also Labour cost / worker in India is amongst the lowest in the world. This coupled with an diverse agro-climatic condition resulting in abundant raw materials, make India a major sourcing hub for the world
China
Indon
esia
India
Philip
ines
Thailan
d
Malaysi
aKo
rea
Singa
pore
0
5000
10000
15000
20000
25000
729 1008 1192 2450 2705 3429
10743
21317
Labor cost (USD/Year)
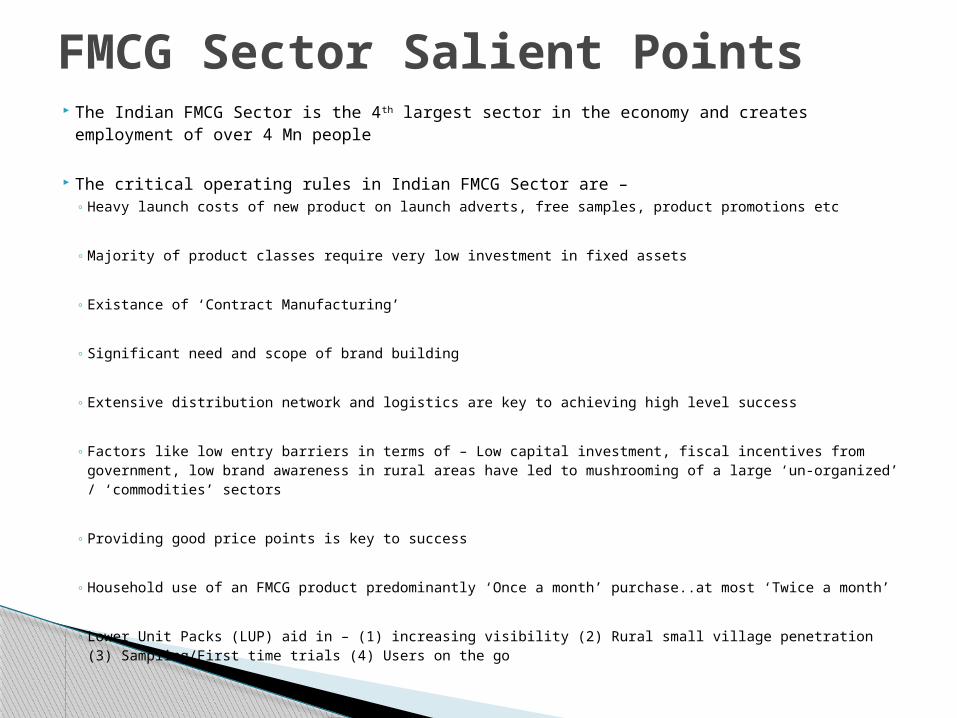
FMCG Sector Salient Points The Indian FMCG Sector is the 4th largest sector in the economy and creates employment
of over 4 Mn people
The critical operating rules in Indian FMCG Sector are –◦ Heavy launch costs of new product on launch adverts, free samples, product promotions etc
◦ Majority of product classes require very low investment in fixed assets
◦ Existance of ‘Contract Manufacturing’
◦ Significant need and scope of brand building
◦ Extensive distribution network and logistics are key to achieving high level success
◦ Factors like low entry barriers in terms of – Low capital investment, fiscal incentives from government, low brand awareness in rural areas have led to mushrooming of a large ‘un-organized’ / ‘commodities’ sectors
◦ Providing good price points is key to success
◦ Household use of an FMCG product predominantly ‘Once a month’ purchase..at most ‘Twice a month’
◦ Lower Unit Packs (LUP) aid in – (1) increasing visibility (2) Rural small village penetration (3) Sampling/First time trials (4) Users on the go
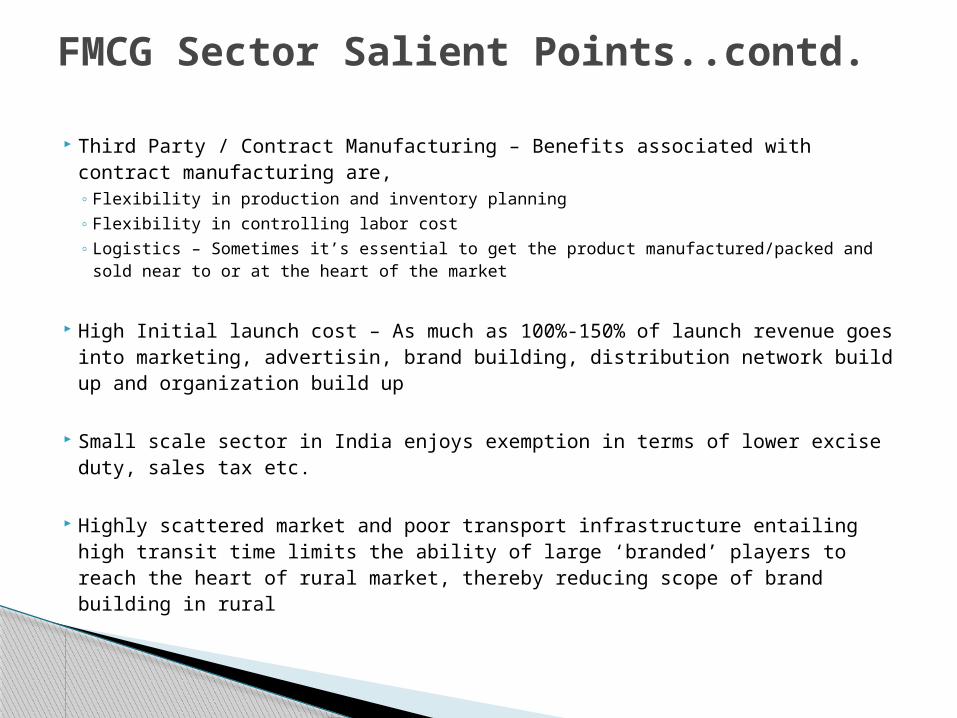
FMCG Sector Salient Points..contd.
Third Party / Contract Manufacturing – Benefits associated with contract manufacturing are,◦ Flexibility in production and inventory planning◦ Flexibility in controlling labor cost◦ Logistics – Sometimes it’s essential to get the product manufactured/packed and
sold near to or at the heart of the market
High Initial launch cost – As much as 100%-150% of launch revenue goes into marketing, advertisin, brand building, distribution network build up and organization build up
Small scale sector in India enjoys exemption in terms of lower excise duty, sales tax etc.
Highly scattered market and poor transport infrastructure entailing high transit time limits the ability of large ‘branded’ players to reach the heart of rural market, thereby reducing scope of brand building in rural
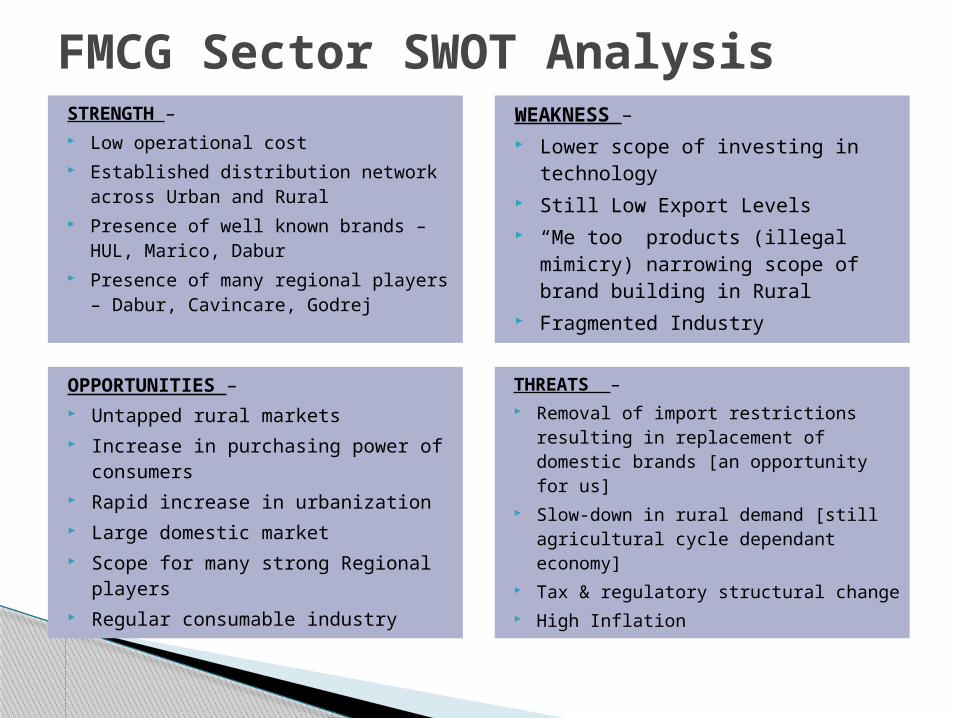
FMCG Sector SWOT AnalysisSTRENGTH – Low operational cost Established distribution network
across Urban and Rural Presence of well known brands –
HUL, Marico, Dabur Presence of many regional players
– Dabur, Cavincare, Godrej
WEAKNESS – Lower scope of investing in
technology Still Low Export Levels “Me too” products (illegal
mimicry) narrowing scope of brand building in Rural
Fragmented Industry
OPPORTUNITIES – Untapped rural markets Increase in purchasing power of
consumers Rapid increase in urbanization Large domestic market Scope for many strong Regional
players Regular consumable industry
THREATS – Removal of import restrictions
resulting in replacement of domestic brands [an opportunity for us]
Slow-down in rural demand [still agricultural cycle dependant economy]
Tax & regulatory structural change High Inflation
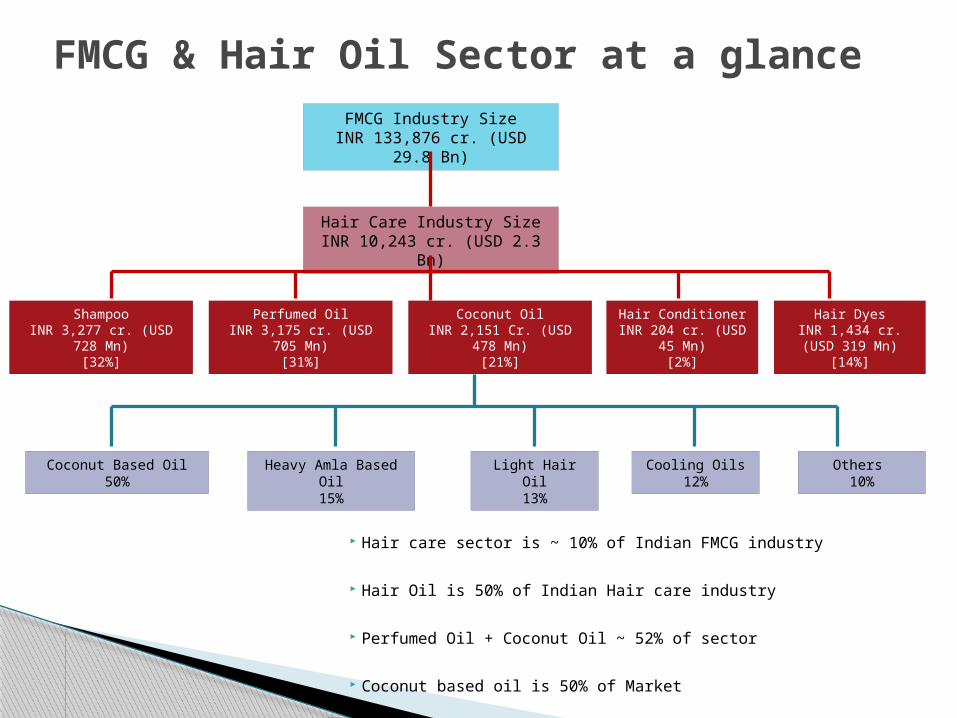
Hair care sector is ~ 10% of Indian FMCG industry
Hair Oil is 50% of Indian Hair care industry
Perfumed Oil + Coconut Oil ~ 52% of sector
Coconut based oil is 50% of Market
FMCG & Hair Oil Sector at a glance
ShampooINR 3,277 cr. (USD 728
Mn)[32%]
FMCG Industry SizeINR 133,876 cr. (USD 29.8
Bn)
Hair ConditionerINR 204 cr. (USD 45
Mn)[2%]
Hair DyesINR 1,434 cr. (USD
319 Mn)[14%]
Perfumed OilINR 3,175 cr. (USD 705
Mn)[31%]
Coconut OilINR 2,151 Cr. (USD 478
Mn)[21%]
Hair Care Industry SizeINR 10,243 cr. (USD 2.3 Bn)
Coconut Based Oil50%
Heavy Amla Based Oil
15%
Light Hair Oil13%
Cooling Oils12%
Others 10%
Indian Hair Care Market Salients points of 2012 –
◦ Hair care increased by 18% in 2012 value terms◦ Consumers willing to spend more and try salon hair care products at
home aids value growth◦ Colorants sees the fastest value growth◦ HUL led hair care category with 17% value share
Due to varied consumption habits of consumers, wherein coconut oil and edible oil is interchanged, the actual hair oil industry may even be bigger than pegged
Perceived benefits of Hair oil – ◦ Hair nourishment & strengthening◦ Faster and better hair growth◦ Reduce problem of falling hair
Basically two types of Hair oil –◦ Coconut based hair oil – 2/3rd of the market ~ 72% share◦ Non greasy perfumed hair oil – 1/3rd of the market
Penetration of Hair oil very high at close to 87~88% In the branded hair oil market, Marico (Parachute brand) and
Dabur are the leading players
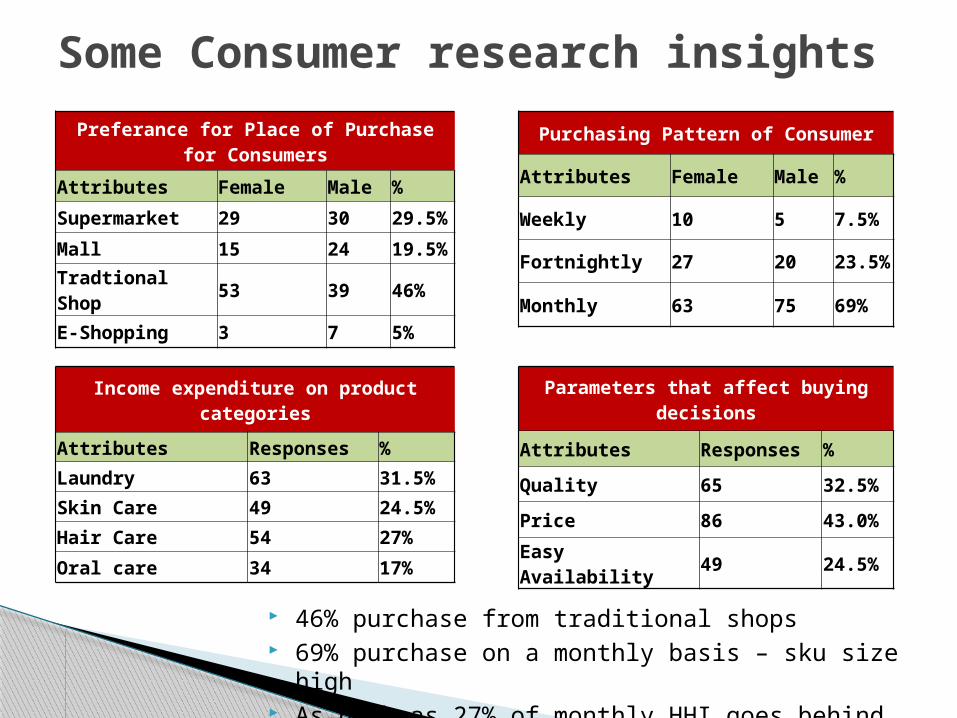
Some Consumer research insightsPurchasing Pattern of Consumer
Attributes Female Male %
Weekly 10 5 7.5%
Fortnightly 27 20 23.5%
Monthly 63 75 69%
Preferance for Place of Purchase for Consumers
Attributes Female Male %
Supermarket 29 30 29.5%
Mall 15 24 19.5%
Tradtional Shop 53 39 46%
E-Shopping 3 7 5%
Income expenditure on product categories
Attributes Responses %Laundry 63 31.5%Skin Care 49 24.5%Hair Care 54 27%
Oral care 34 17%
Parameters that affect buying decisions
Attributes Responses %
Quality 65 32.5%
Price 86 43.0%
Easy Availability 49 24.5%
46% purchase from traditional shops 69% purchase on a monthly basis – sku size high As high as 27% of monthly HHI goes behind hair
care
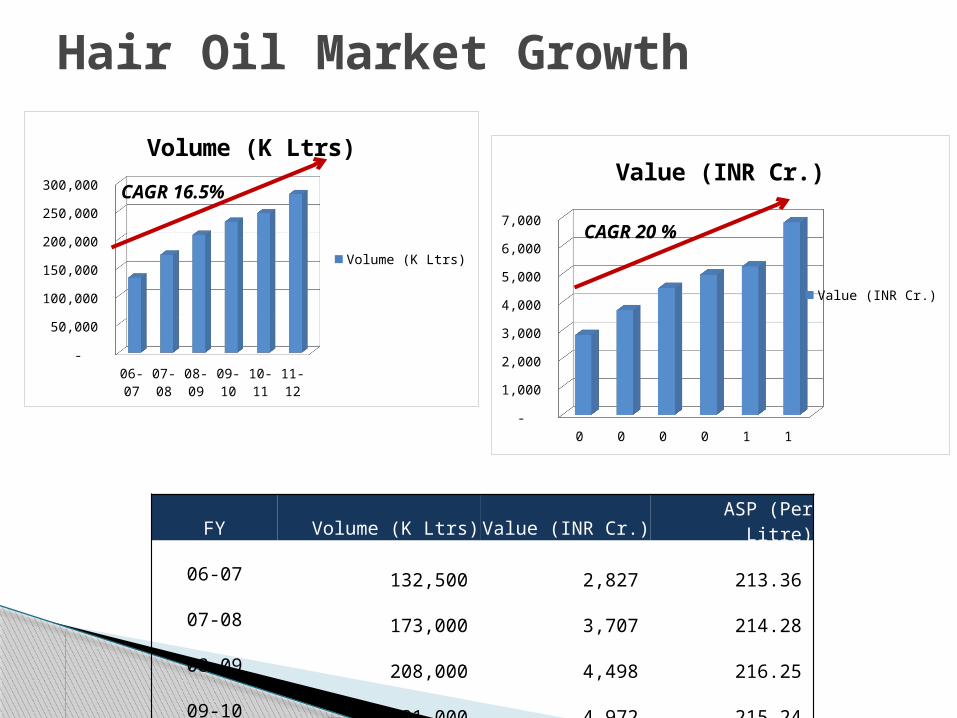
Hair Oil Market Growth
06-07 07-08 08-09 09-10 10-11 11-12 -
50,000
100,000
150,000
200,000
250,000
300,000
Volume (K Ltrs)
Volume (K Ltrs)
06-07 07-08 08-09 09-10 10-11 11-12 -
1,000
2,000
3,000
4,000
5,000
6,000
7,000
Value (INR Cr.)
Value (INR Cr.)
CAGR 16.5%
CAGR 20 %
FY Volume (K Ltrs) Value (INR Cr.) ASP (Per Litre)06-07 132,500 2,827 213.36 07-08 173,000 3,707 214.28 08-09 208,000 4,498 216.25 09-10 231,000 4,972 215.24 10-11 246,000 5,262 213.90 11-12 280,000 6,824 243.71
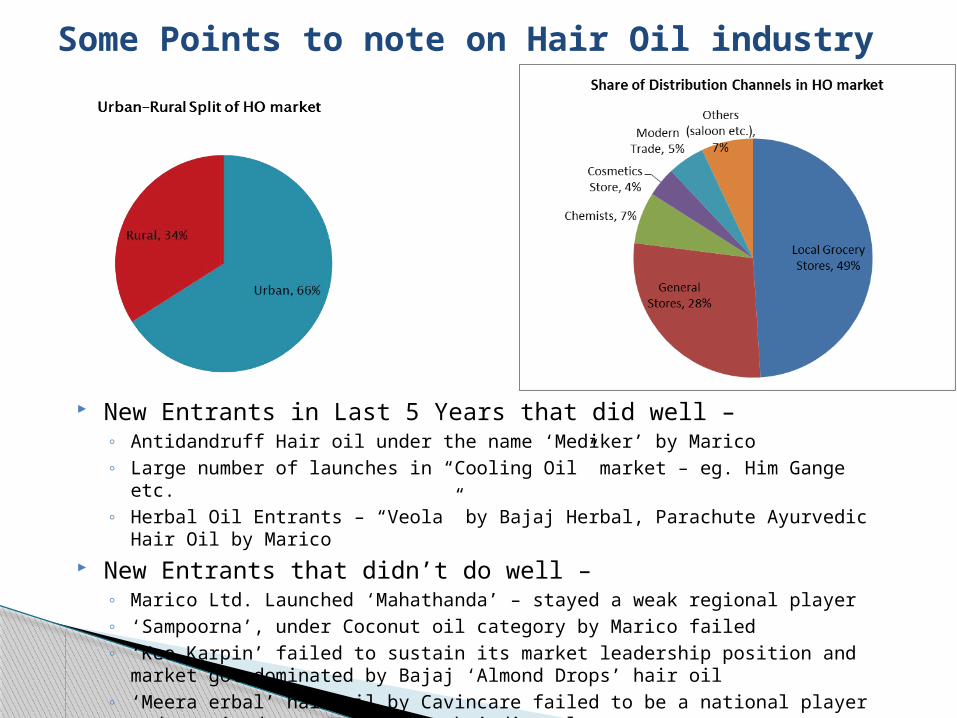
Some Points to note on Hair Oil industry
New Entrants in Last 5 Years that did well – ◦ Antidandruff Hair oil under the name ‘Mediker’ by Marico◦ Large number of launches in “Cooling Oil” market – eg. Him Gange etc.◦ Herbal Oil Entrants – “Veola” by Bajaj Herbal, Parachute Ayurvedic Hair Oil by
Marico New Entrants that didn’t do well –
◦ Marico Ltd. Launched ‘Mahathanda’ – stayed a weak regional player◦ ‘Sampoorna’, under Coconut oil category by Marico failed◦ ‘Keo Karpin’ failed to sustain its market leadership position and market got
dominated by Bajaj ‘Almond Drops’ hair oil◦ ‘Meera erbal’ hair oil by Cavincare failed to be a national player and remained a
competing South indian player
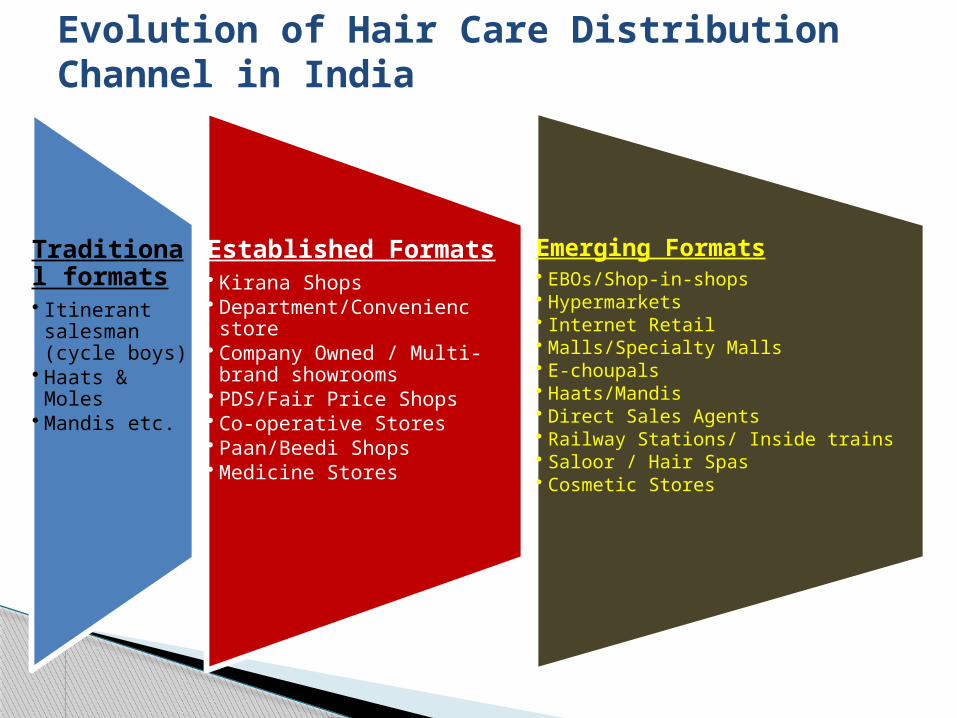
Evolution of Hair Care Distribution Channel in India
Traditional formats• Itinerant salesman (cycle boys)
• Haats & Moles• Mandis etc.
Established Formats• Kirana Shops• Department/Convenienc store• Company Owned / Multi-brand showrooms
• PDS/Fair Price Shops• Co-operative Stores• Paan/Beedi Shops• Medicine Stores
Emerging Formats• EBOs/Shop-in-shops• Hypermarkets• Internet Retail• Malls/Specialty Malls• E-choupals• Haats/Mandis• Direct Sales Agents• Railway Stations/ Inside trains• Saloor / Hair Spas• Cosmetic Stores
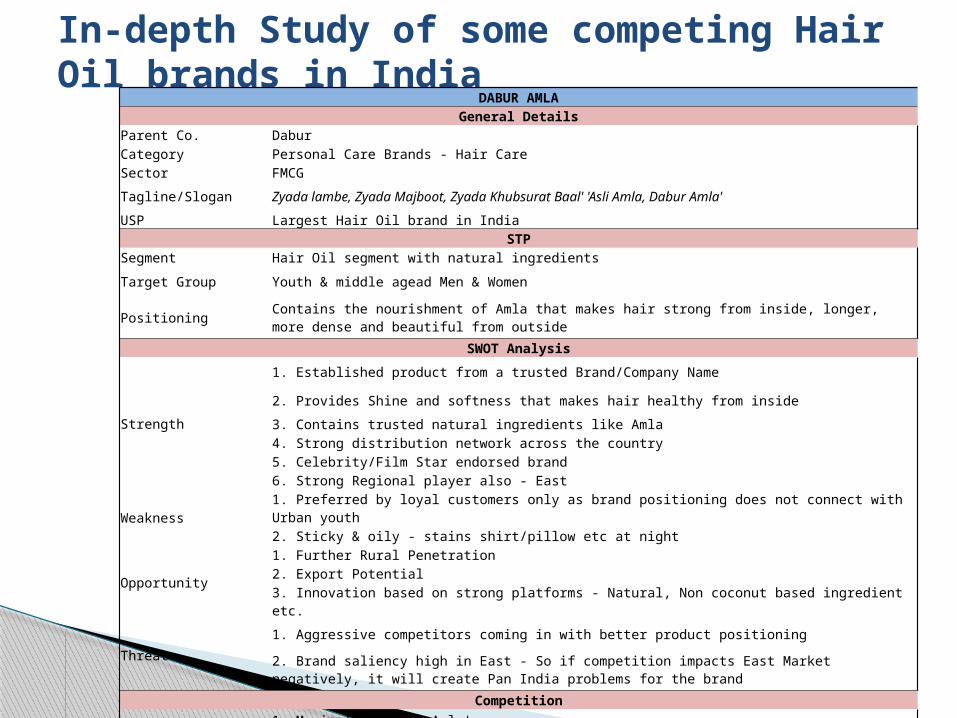
In-depth Study of some competing Hair Oil brands in India
DABUR AMLAGeneral Details
Parent Co. DaburCategory Personal Care Brands - Hair CareSector FMCG
Tagline/Slogan Zyada lambe, Zyada Majboot, Zyada Khubsurat Baal' 'Asli Amla, Dabur Amla'
USP Largest Hair Oil brand in IndiaSTP
Segment Hair Oil segment with natural ingredients
Target Group Youth & middle agead Men & Women
Positioning Contains the nourishment of Amla that makes hair strong from inside, longer, more dense and beautiful from outside
SWOT Analysis
Strength
1. Established product from a trusted Brand/Company Name
2. Provides Shine and softness that makes hair healthy from inside
3. Contains trusted natural ingredients like Amla4. Strong distribution network across the country5. Celebrity/Film Star endorsed brand6. Strong Regional player also - East
Weakness 1. Preferred by loyal customers only as brand positioning does not connect with Urban youth
2. Sticky & oily - stains shirt/pillow etc at night
Opportunity
1. Further Rural Penetration2. Export Potential
3. Innovation based on strong platforms - Natural, Non coconut based ingredient etc.
Threat1. Aggressive competitors coming in with better product positioning
2. Brand saliency high in East - So if competition impacts East Market negatively, it will create Pan India problems for the brand
Competition
Competitors1. Marico's 'Shanti Amla'2. Bajaj 'Brahmi Amla' hair oil3. Emami Plus Hair Oil
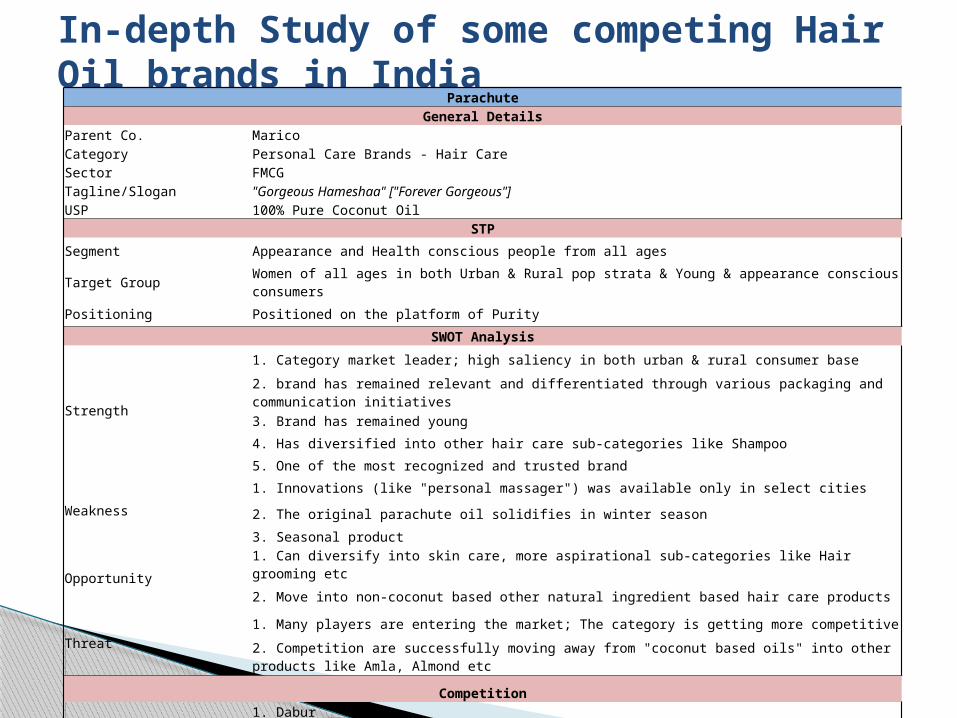
In-depth Study of some competing Hair Oil brands in India
ParachuteGeneral Details
Parent Co. MaricoCategory Personal Care Brands - Hair CareSector FMCGTagline/Slogan "Gorgeous Hameshaa" ["Forever Gorgeous"]USP 100% Pure Coconut Oil
STPSegment Appearance and Health conscious people from all ages
Target Group Women of all ages in both Urban & Rural pop strata & Young & appearance conscious consumers
Positioning Positioned on the platform of PuritySWOT Analysis
Strength
1. Category market leader; high saliency in both urban & rural consumer base
2. brand has remained relevant and differentiated through various packaging and communication initiatives
3. Brand has remained young4. Has diversified into other hair care sub-categories like Shampoo5. One of the most recognized and trusted brand
Weakness1. Innovations (like "personal massager") was available only in select cities
2. The original parachute oil solidifies in winter season3. Seasonal product
Opportunity1. Can diversify into skin care, more aspirational sub-categories like Hair grooming etc
2. Move into non-coconut based other natural ingredient based hair care products
Threat1. Many players are entering the market; The category is getting more competitive
2. Competition are successfully moving away from "coconut based oils" into other products like Amla, Almond etc
Competition
Competitors1. Dabur2. Emami Navratna3. HUL
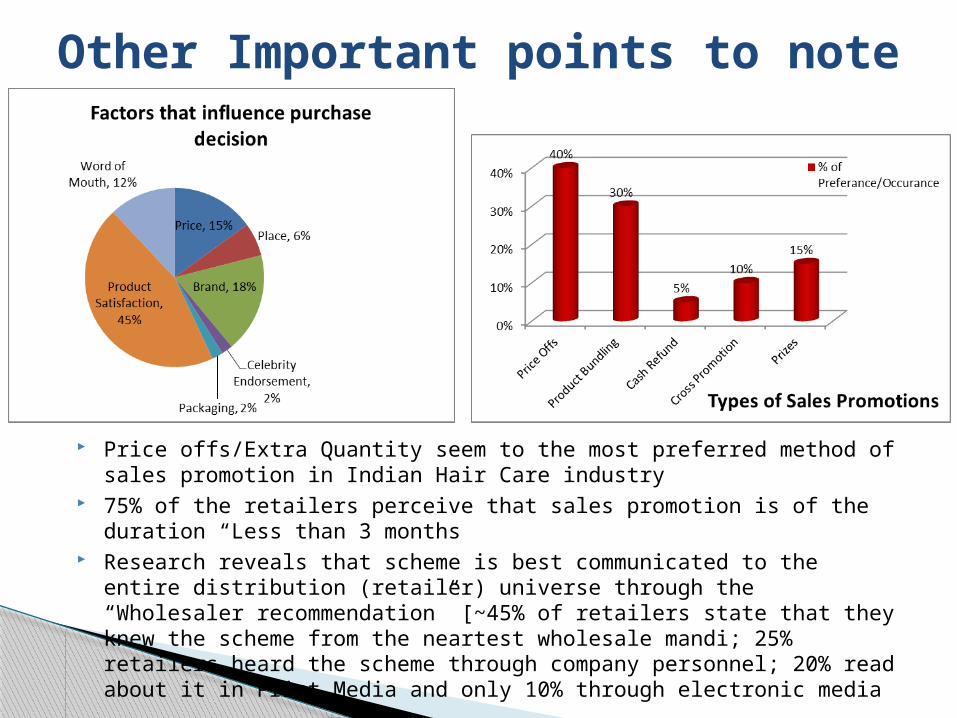
Other Important points to note
Price offs/Extra Quantity seem to the most preferred method of sales promotion in Indian Hair Care industry
75% of the retailers perceive that sales promotion is of the duration “Less than 3 months
Research reveals that scheme is best communicated to the entire distribution (retailer) universe through the “Wholesaler recommendation” [~45% of retailers state that they knew the scheme from the neartest wholesale mandi; 25% retailers heard the scheme through company personnel; 20% read about it in Print Media and only 10% through electronic media
HEMAS India Strategy – ‘DO’ Part
PEOPLE – Build a winning
Organization
PRODUCT – What kind of
products may workl
PLACEMENT –
Distribution Blue Print
PROMOTION – Trade, BTL, ATL Strategy
100 Cr. In Year 2 -
Milestones
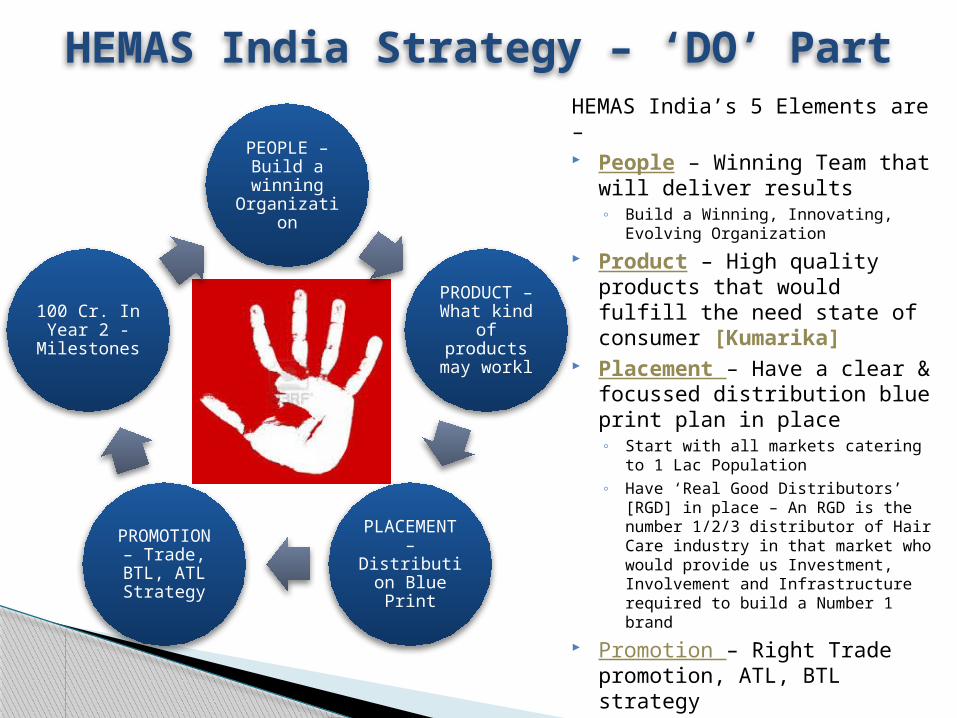
HEMAS India Strategy – ‘DO’ PartHEMAS India’s 5 Elements are – People – Winning Team that
will deliver results◦ Build a Winning, Innovating, Evolving
Organization Product – High quality
products that would fulfill the need state of consumer [Kumarika]
Placement – Have a clear & focussed distribution blue print plan in place◦ Start with all markets catering to 1 Lac
Population◦ Have ‘Real Good Distributors’ [RGD] in
place – An RGD is the number 1/2/3 distributor of Hair Care industry in that market who would provide us Investment, Involvement and Infrastructure required to build a Number 1 brand
Promotion – Right Trade promotion, ATL, BTL strategy
Destroy Competition – Build a 100 cr. Power brand within 1.5 years of Launch
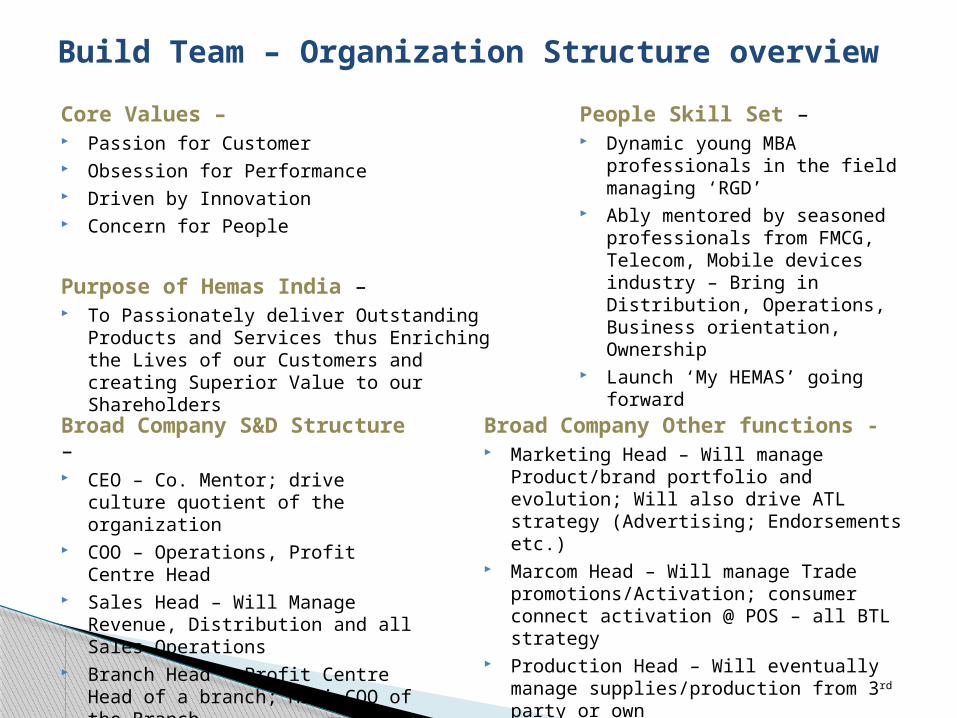
Build Team – Organization Structure overviewCore Values – Passion for Customer Obsession for Performance Driven by Innovation Concern for People
Purpose of Hemas India – To Passionately deliver Outstanding Products
and Services thus Enriching the Lives of our Customers and creating Superior Value to our Shareholders
People Skill Set – Dynamic young MBA professionals
in the field managing ‘RGD’ Ably mentored by seasoned
professionals from FMCG, Telecom, Mobile devices industry – Bring in Distribution, Operations, Business orientation, Ownership
Launch ‘My HEMAS’ going forward
Broad Company S&D Structure – CEO – Co. Mentor; drive culture
quotient of the organization COO – Operations, Profit Centre
Head Sales Head – Will Manage Revenue,
Distribution and all Sales Operations
Branch Head – Profit Centre Head of a branch; Mini COO of the Branch
Sales Officers – Drive Sales & distribution in the geography
Broad Company Other functions - Marketing Head – Will manage
Product/brand portfolio and evolution; Will also drive ATL strategy (Advertising; Endorsements etc.)
Marcom Head – Will manage Trade promotions/Activation; consumer connect activation @ POS – all BTL strategy
Production Head – Will eventually manage supplies/production from 3rd party or own
Finance Head – Will manage finance, commercial & compliance/legal aspects as of now
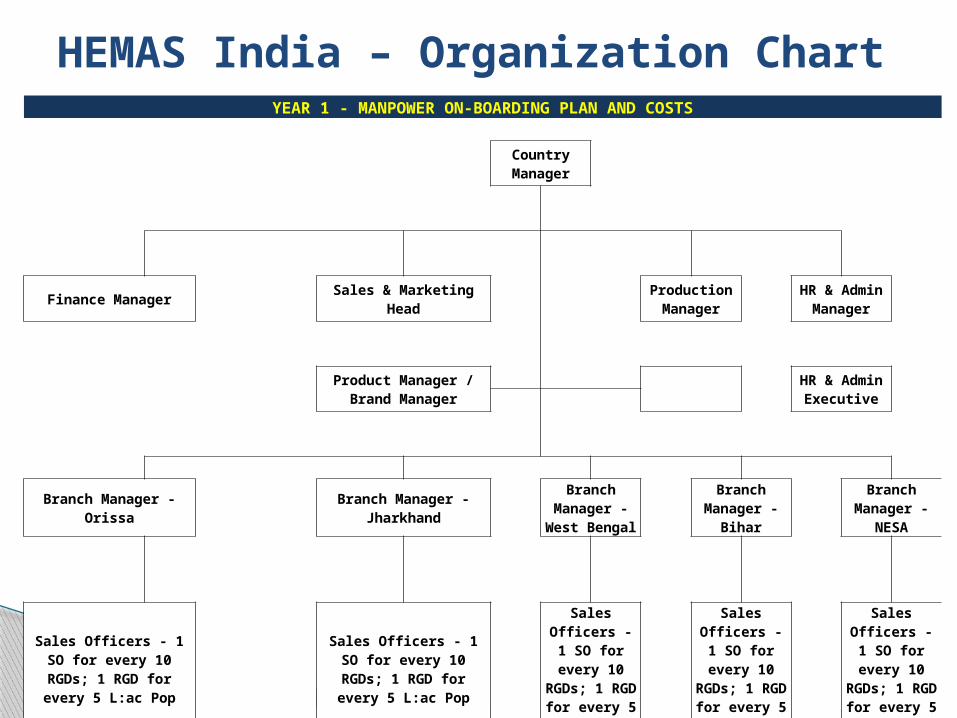
HEMAS India – Organization ChartYEAR 1 - MANPOWER ON-BOARDING PLAN AND COSTS
Country
Manager
Finance Manager Sales & Marketing Head Production Manager
HR & Admin Manager
Product Manager / Brand
Manager HR & Admin
Executive
Branch Manager - Orissa
Branch Manager - Jharkhand Branch Manager
- West Bengal Branch Manager
- Bihar Branch Manager
- NESA
Sales Officers - 1 SO for every 10 RGDs; 1 RGD for every 5
L:ac Pop
Sales Officers - 1 SO for every 10 RGDs; 1 RGD for every 5
L:ac Pop
Sales Officers - 1 SO for every 10 RGDs; 1 RGD for every 5 L:ac Pop
Sales Officers - 1 SO for every 10 RGDs; 1 RGD for every 5 L:ac Pop
Sales Officers - 1 SO for every 10 RGDs; 1 RGD for every 5 L:ac Pop
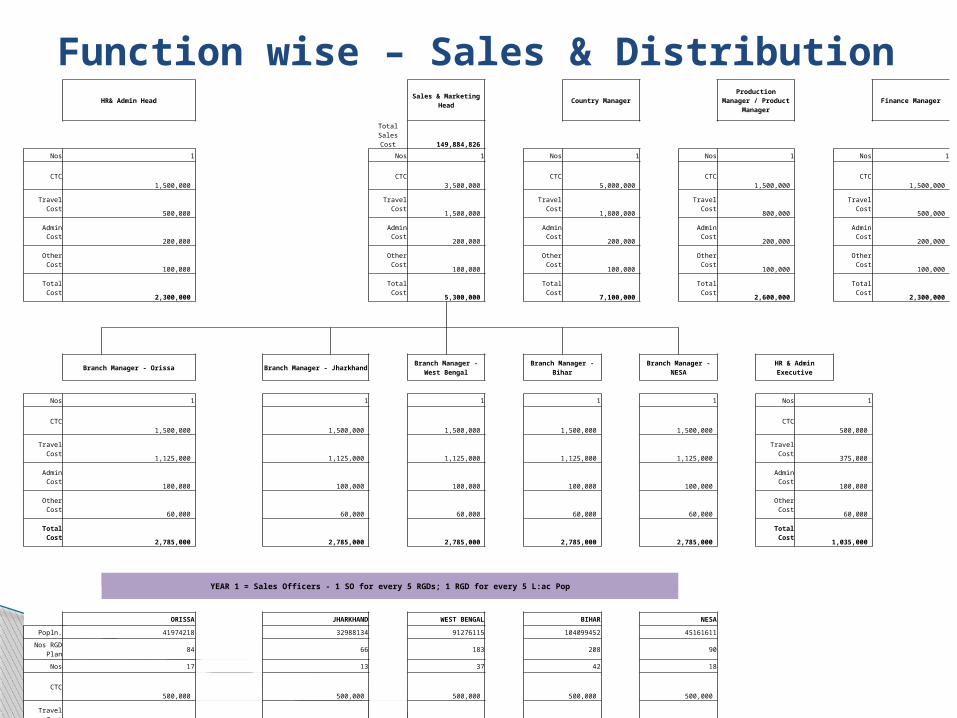
Function wise – Sales & Distribution
HR& Admin Head
Sales & Marketing Head
Country Manager Production Manager /
Product Manager
Finance Manager
Total Sales Cost
149,884,826
Nos 1 Nos 1 Nos 1 Nos 1 Nos 1
CTC 1,500,000 CTC
3,500,000 CTC 5,000,000 CTC
1,500,000 CTC 1,500,000
Travel Cost 500,000 Travel Cost
1,500,000 Travel Cost 1,800,000 Travel Cost
800,000 Travel Cost 500,000
Admin Cost 200,000 Admin Cost
200,000 Admin Cost 200,000 Admin Cost
200,000 Admin Cost 200,000
Other Cost 100,000 Other Cost
100,000 Other Cost 100,000 Other Cost
100,000 Other Cost 100,000
Total Cost 2,300,000 Total Cost
5,300,000 Total Cost 7,100,000 Total Cost
2,600,000 Total Cost 2,300,000
Branch Manager - Orissa
Branch Manager - Jharkhand Branch Manager - West
Bengal
Branch Manager - Bihar
Branch Manager - NESA
HR & Admin Executive
Nos 1 1 1 1 1 Nos 1 CTC
1,500,000 1,500,000
1,500,000 1,500,000
1,500,000 CTC 500,000
Travel Cost 1,125,000
1,125,000 1,125,000
1,125,000 1,125,000 Travel Cost
375,000 Admin Cost
100,000 100,000
100,000 100,000
100,000 Admin Cost 100,000
Other Cost 60,000
60,000 60,000
60,000 60,000 Other Cost
60,000 Total Cost
2,785,000 2,785,000
2,785,000 2,785,000
2,785,000 Total Cost 1,035,000
YEAR 1 = Sales Officers - 1 SO for every 5 RGDs; 1 RGD for every 5 L:ac Pop
ORISSA JHARKHAND WEST BENGAL BIHAR NESA Popln. 41974218 32988134 91276115 104099452 45161611
Nos RGD Plan 84 66 183 208 90
Nos 17 13 37 42 18 CTC
500,000 500,000
500,000 500,000
500,000 Travel Cost
375,000 375,000
375,000 375,000
375,000 Admin Cost
25,000 25,000
25,000 25,000
25,000 Other Cost
25,000 25,000
25,000 25,000
25,000 Total Cost
15,530,461 12,205,610
33,772,163 38,516,797
16,709,796
TOTAL BRANCH S&D
Salary COST
18,315,461 14,990,610
36,557,163 41,301,797
19,494,796

KumarikaNature’s way to beautiful hair, Kumarika. Formulated with the goodness of indigenous herbs and natural ingredients, trusted by generations of Sri Lankan Women, the Kumarika range of hair care products repair and nourish your hair leaving it radiant and beautiful.
o Formulated with the goodness of indigenous herbs and natural ingredients
o Kumarika makes your hair look healthier and vibrant
o A range of products on offer for daily useKumarika has been used in Sri Lanka Australia, Bangladesh, Jordan, France, Dubai, United Kingdom, Pakistan, Indonesia, New Zeland, West Indies and more
Kumarika
King Coconut Oil & Rice Hair Oil
Lime & Dill Hair Oil
Herbal Hair Oil
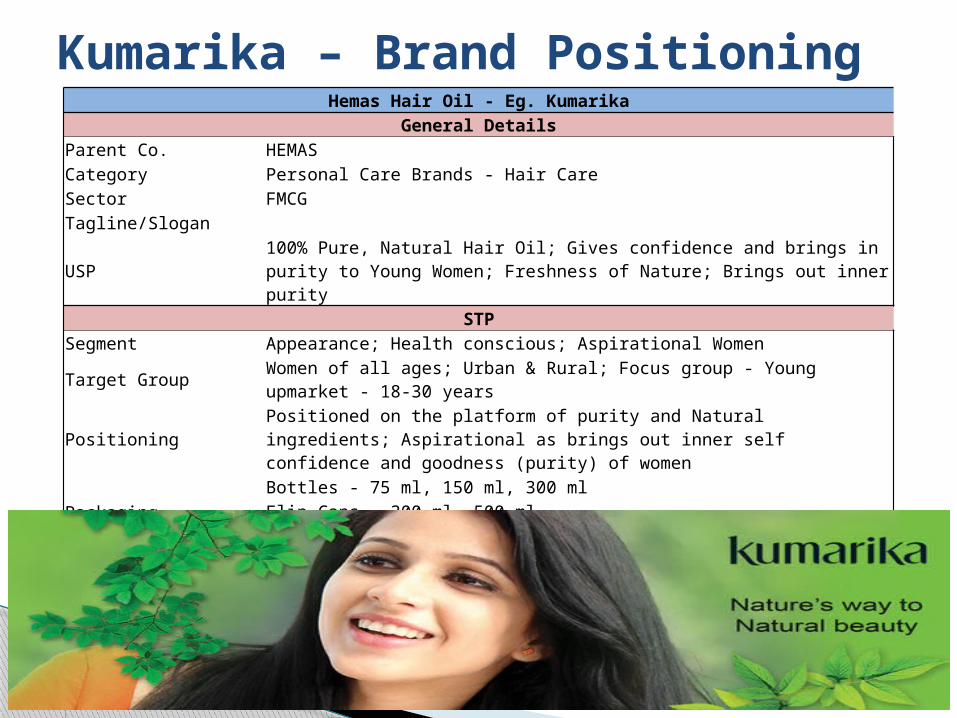
Kumarika – Brand PositioningHemas Hair Oil - Eg. Kumarika
General DetailsParent Co. HEMASCategory Personal Care Brands - Hair CareSector FMCGTagline/Slogan
USP 100% Pure, Natural Hair Oil; Gives confidence and brings in purity to Young Women; Freshness of Nature; Brings out inner purity
STPSegment Appearance; Health conscious; Aspirational Women
Target Group Women of all ages; Urban & Rural; Focus group - Young upmarket - 18-30 years
Positioning Positioned on the platform of purity and Natural ingredients; Aspirational as brings out inner self confidence and goodness (purity) of women
PackagingBottles - 75 ml, 150 ml, 300 mlFlip Cans - 300 ml, 500 mlSachets - Re 1/- & Refill Packs - 150 ml
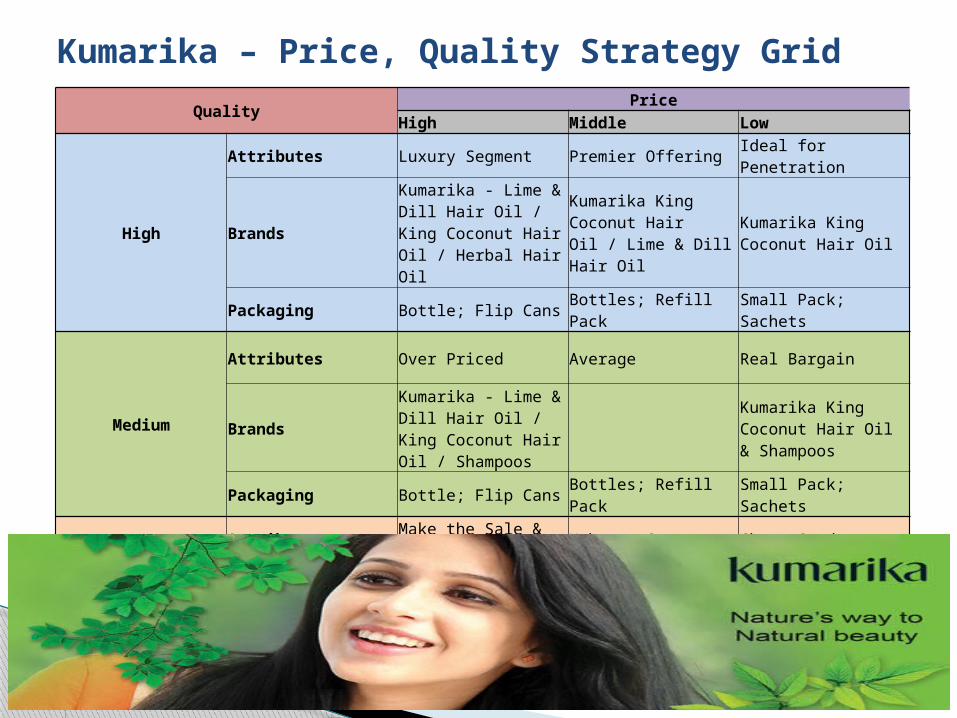
Kumarika – Price, Quality Strategy GridQuality Price
High Middle Low
High
Attributes Luxury Segment Premier Offering Ideal for Penetration
BrandsKumarika - Lime & Dill Hair Oil / King Coconut Hair Oil / Herbal Hair Oil
Kumarika King Coconut Hair Oil / Lime & Dill Hair Oil
Kumarika King Coconut Hair Oil
Packaging Bottle; Flip Cans Bottles; Refill Pack Small Pack; Sachets
Medium
Attributes Over Priced Average Real Bargain
BrandsKumarika - Lime & Dill Hair Oil / King Coconut Hair Oil / Shampoos
Kumarika King Coconut Hair Oil & Shampoos
Packaging Bottle; Flip Cans Bottles; Refill Pack Small Pack; Sachets
Low
Attributes Make the Sale & Run Unhappy Customer Cheap Goods
Brands Local Commoditised Hair Oils
Local Commoditised Hair Oils
Local Commoditised Hair Oils
Packaging Medium/Small bottles Small bottles; Owned bottles for refill
Small bottles; Owned bottles for refill

Important Points on Distribution
Competition (Dabur) Supply Chain – ◦ 29 factories; 47 Stocking Points; 4 Regional offices; 6 mother warehouses;
50 CFAs; 1000 SKUs◦ Hemas India (East) –
6 CFAs [Patna (Bihar), Ranchi (Jharkhand), Kolkata (Kol Metro; ROB), Siliguri (North Bengal & Sikkim), Guwahati (NESA), Bhubaneshwar (Orissa)]
1 Regional Office (Kolkata); 5 Branch offices in the 5 CFAs MIS –
◦ Need In-house developed, easy-to-use, Intranet/Internet (with VPN) based data-warehouse displays, as-of-yesterday sales, recievables, banking & other KPI measurement dashboard MIS
◦ Dabur has incorporated an MIS system comprising of over 5000 pages of reportin of various data points
◦ Initially work on Tally / Oracle based system; SAP/ERP based to be launched within 2nd year of operation in India
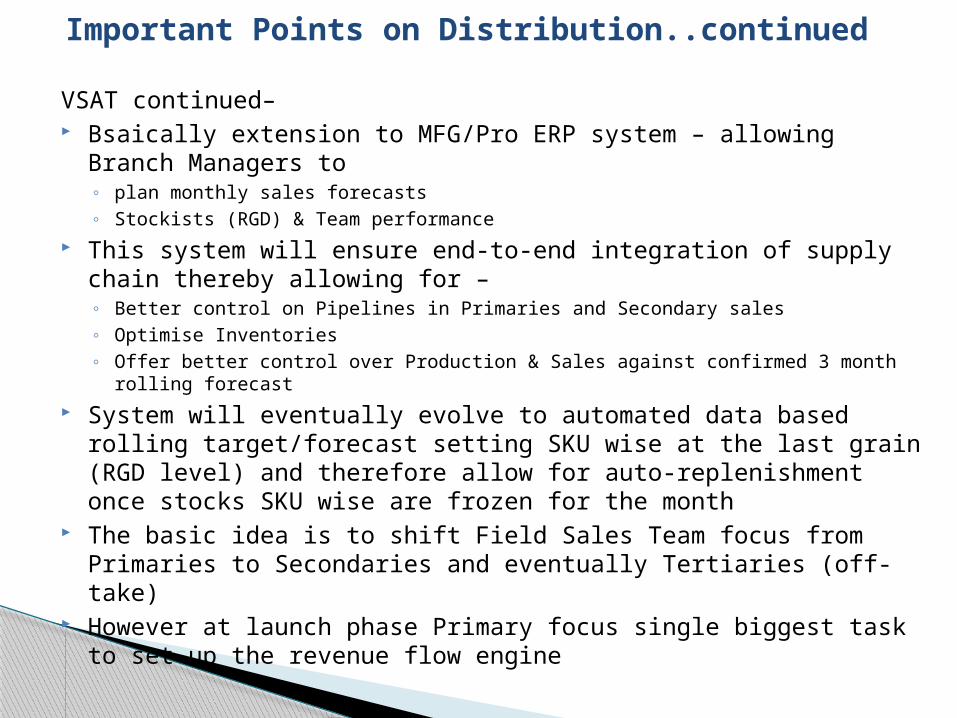
Important Points on Distribution..continued
VSAT continued– Bsaically extension to MFG/Pro ERP system – allowing Branch
Managers to ◦ plan monthly sales forecasts◦ Stockists (RGD) & Team performance
This system will ensure end-to-end integration of supply chain thereby allowing for –◦ Better control on Pipelines in Primaries and Secondary sales◦ Optimise Inventories◦ Offer better control over Production & Sales against confirmed 3 month rolling
forecast System will eventually evolve to automated data based rolling
target/forecast setting SKU wise at the last grain (RGD level) and therefore allow for auto-replenishment once stocks SKU wise are frozen for the month
The basic idea is to shift Field Sales Team focus from Primaries to Secondaries and eventually Tertiaries (off-take)
However at launch phase Primary focus single biggest task to set up the revenue flow engine
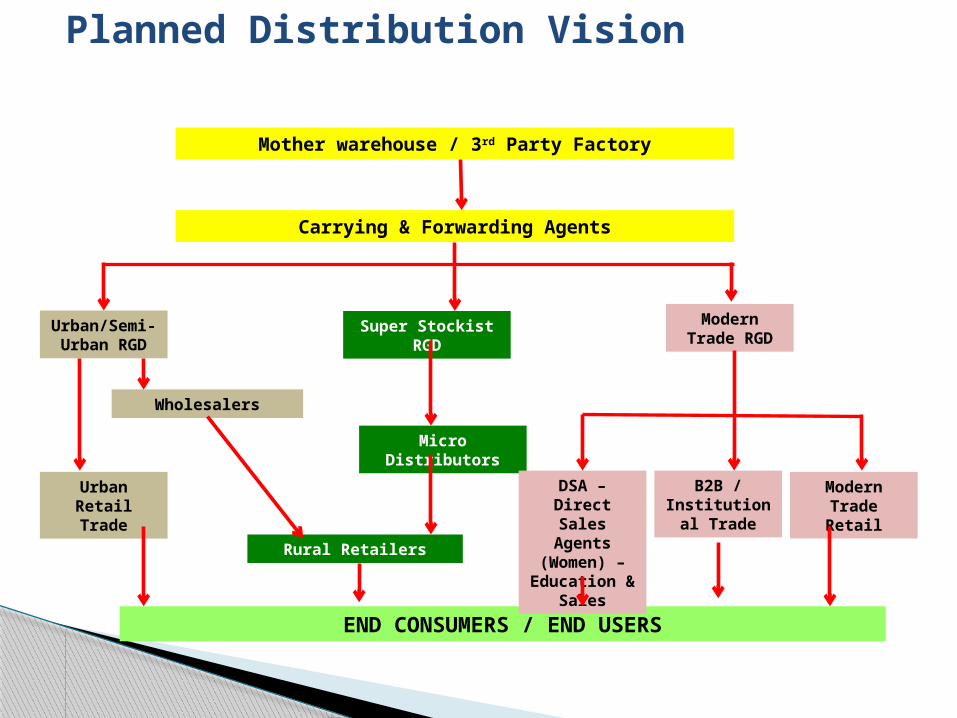
Planned Distribution Vision
Urban/Semi-Urban RGD
Wholesalers
Urban Retail Trade
Modern Trade RGD
Modern Trade Retail
B2B / Institutional
Trade
Super Stockist RGD
Micro Distributors
Rural Retailers
END CONSUMERS / END USERS
DSA – Direct Sales Agents (Women) – Education &
Sales
Carrying & Forwarding Agents
Mother warehouse / 3rd Party Factory
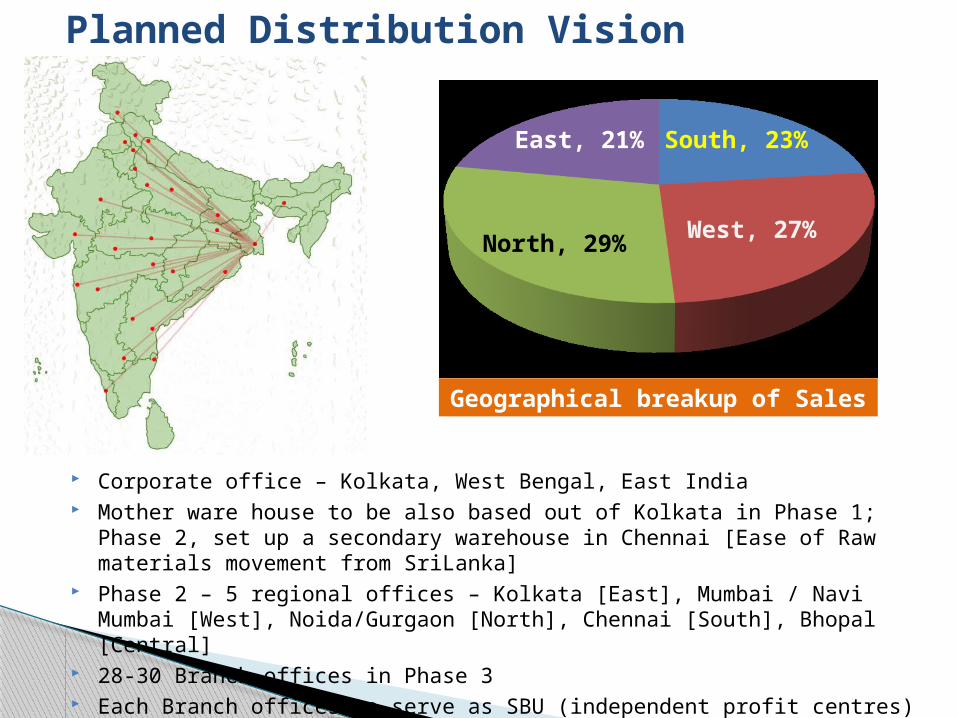
Planned Distribution Vision
Corporate office – Kolkata, West Bengal, East India Mother ware house to be also based out of Kolkata in Phase 1; Phase 2, set
up a secondary warehouse in Chennai [Ease of Raw materials movement from SriLanka]
Phase 2 – 5 regional offices – Kolkata [East], Mumbai / Navi Mumbai [West], Noida/Gurgaon [North], Chennai [South], Bhopal [Central]
28-30 Branch offices in Phase 3 Each Branch offices to serve as SBU (independent profit centres) in the long
run
North, 29%
East, 21% South, 23%
West, 27%
Geographical breakup of Sales
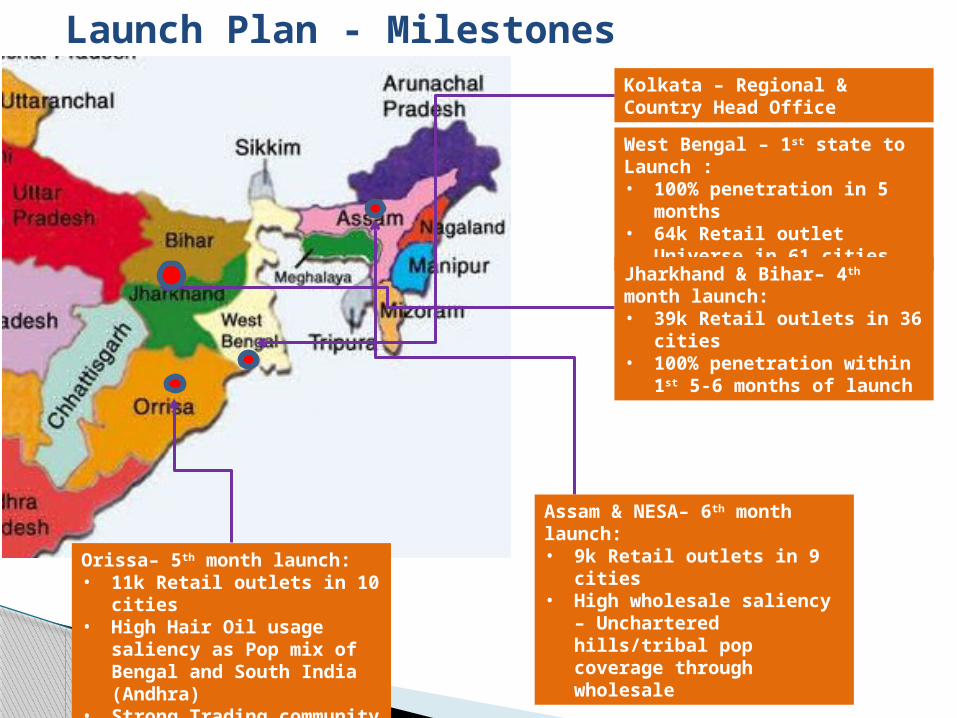
Launch Plan - MilestonesKolkata – Regional & Country Head Office
West Bengal – 1st state to Launch :• 100% penetration in 5 months• 64k Retail outlet Universe in 61
cities
Jharkhand & Bihar– 4th month launch:• 39k Retail outlets in 36 cities• 100% penetration within 1st 5-6
months of launch
Assam & NESA– 6th month launch:• 9k Retail outlets in 9 cities• High wholesale saliency –
Unchartered hills/tribal pop coverage through wholesale
Orissa– 5th month launch:• 11k Retail outlets in 10 cities• High Hair Oil usage saliency as Pop
mix of Bengal and South India (Andhra)
• Strong Trading community
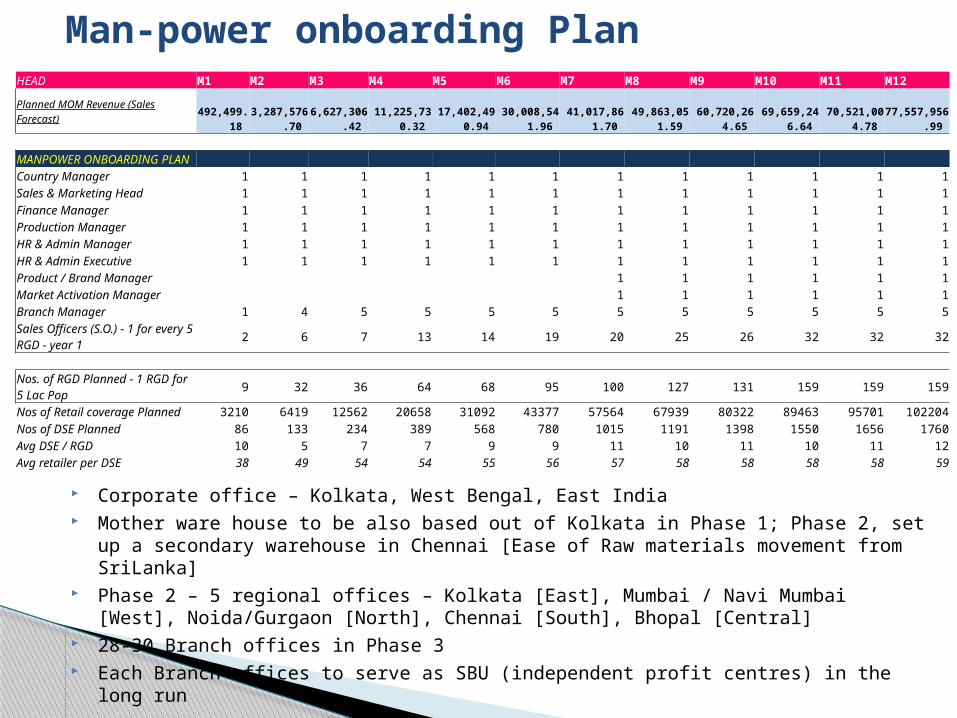
Man-power onboarding PlanHEAD M1 M2 M3 M4 M5 M6 M7 M8 M9 M10 M11 M12Planned MOM Revenue (Sales Forecast)
492,499.18
3,287,576.70
6,627,306.42
11,225,730.32
17,402,490.94
30,008,541.96
41,017,861.70
49,863,051.59
60,720,264.65
69,659,246.64
70,521,004.78
77,557,956.99 MANPOWER ONBOARDING PLAN Country Manager 1 1 1 1 1 1 1 1 1 1 1 1Sales & Marketing Head 1 1 1 1 1 1 1 1 1 1 1 1Finance Manager 1 1 1 1 1 1 1 1 1 1 1 1Production Manager 1 1 1 1 1 1 1 1 1 1 1 1HR & Admin Manager 1 1 1 1 1 1 1 1 1 1 1 1HR & Admin Executive 1 1 1 1 1 1 1 1 1 1 1 1Product / Brand Manager 1 1 1 1 1 1Market Activation Manager 1 1 1 1 1 1Branch Manager 1 4 5 5 5 5 5 5 5 5 5 5Sales Officers (S.O.) - 1 for every 5 RGD - year 1 2 6 7 13 14 19 20 25 26 32 32 32
Nos. of RGD Planned - 1 RGD for 5 Lac Pop 9 32 36 64 68 95 100 127 131 159 159 159
Nos of Retail coverage Planned 3210 6419 12562 20658 31092 43377 57564 67939 80322 89463 95701 102204Nos of DSE Planned 86 133 234 389 568 780 1015 1191 1398 1550 1656 1760Avg DSE / RGD 10 5 7 7 9 9 11 10 11 10 11 12Avg retailer per DSE 38 49 54 54 55 56 57 58 58 58 58 59
Corporate office – Kolkata, West Bengal, East India Mother ware house to be also based out of Kolkata in Phase 1; Phase 2, set up a
secondary warehouse in Chennai [Ease of Raw materials movement from SriLanka] Phase 2 – 5 regional offices – Kolkata [East], Mumbai / Navi Mumbai [West],
Noida/Gurgaon [North], Chennai [South], Bhopal [Central] 28-30 Branch offices in Phase 3 Each Branch offices to serve as SBU (independent profit centres) in the long run
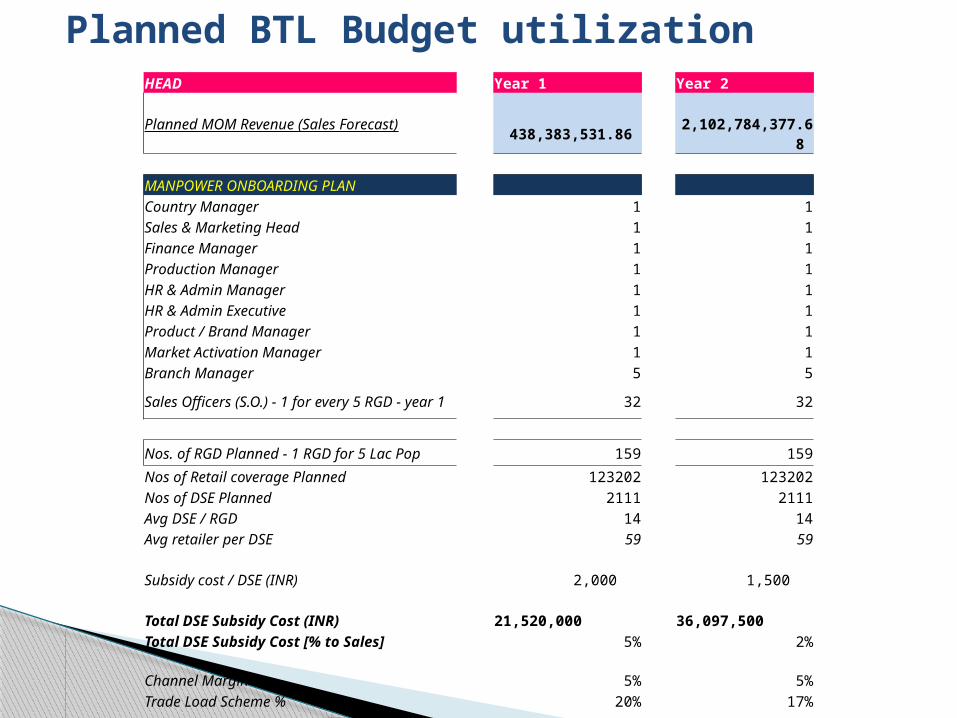
Planned BTL Budget utilizationHEAD Year 1 Year 2Planned MOM Revenue (Sales Forecast) 438,383,531.86 2,102,784,377.68 MANPOWER ONBOARDING PLAN Country Manager 1 1Sales & Marketing Head 1 1Finance Manager 1 1Production Manager 1 1HR & Admin Manager 1 1HR & Admin Executive 1 1Product / Brand Manager 1 1Market Activation Manager 1 1Branch Manager 5 5
Sales Officers (S.O.) - 1 for every 5 RGD - year 1 32 32
Nos. of RGD Planned - 1 RGD for 5 Lac Pop 159 159Nos of Retail coverage Planned 123202 123202Nos of DSE Planned 2111 2111Avg DSE / RGD 14 14Avg retailer per DSE 59 59Subsidy cost / DSE (INR) 2,000 1,500 Total DSE Subsidy Cost (INR) 21,520,000 36,097,500 Total DSE Subsidy Cost [% to Sales] 5% 2%
Channel Margin % 5% 5%Trade Load Scheme % 20% 17%
Channel Margin Cost (INR) 21,919,177 105,139,219 Trade Load Scheme Cost (INR) 87,676,706 357,473,344
Total S&D / BTL Cost (INR) 131,115,883 498,710,063 Total S&D / BTL Cost [% to Sales] 30% 24%
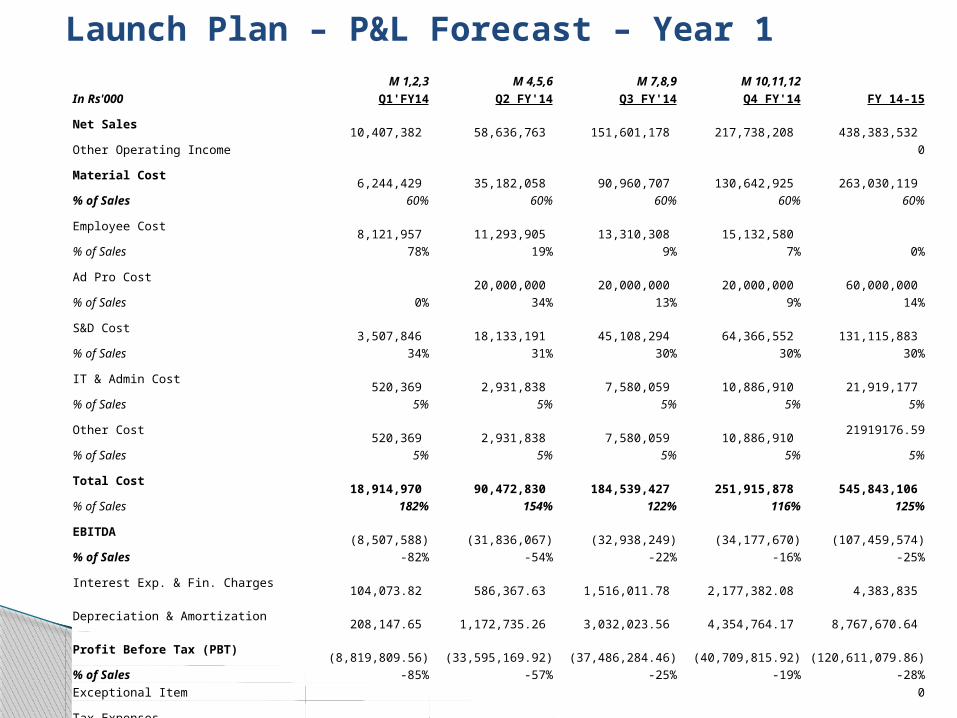
Launch Plan – P&L Forecast – Year 1 M 1,2,3 M 4,5,6 M 7,8,9 M 10,11,12 In Rs'000 Q1'FY14 Q2 FY'14 Q3 FY'14 Q4 FY'14 FY 14-15Net Sales 10,407,382 58,636,763 151,601,178 217,738,208 438,383,532 Other Operating Income 0Material Cost 6,244,429 35,182,058 90,960,707 130,642,925 263,030,119 % of Sales 60% 60% 60% 60% 60%Employee Cost 8,121,957 11,293,905 13,310,308 15,132,580 % of Sales 78% 19% 9% 7% 0%Ad Pro Cost 20,000,000 20,000,000 20,000,000 60,000,000 % of Sales 0% 34% 13% 9% 14%S&D Cost 3,507,846 18,133,191 45,108,294 64,366,552 131,115,883 % of Sales 34% 31% 30% 30% 30%IT & Admin Cost 520,369 2,931,838 7,580,059 10,886,910 21,919,177 % of Sales 5% 5% 5% 5% 5%Other Cost 520,369 2,931,838 7,580,059 10,886,910 21919176.59% of Sales 5% 5% 5% 5% 5%Total Cost 18,914,970 90,472,830 184,539,427 251,915,878 545,843,106 % of Sales 182% 154% 122% 116% 125%EBITDA (8,507,588) (31,836,067) (32,938,249) (34,177,670) (107,459,574)% of Sales -82% -54% -22% -16% -25%Interest Exp. & Fin. Charges 104,073.82 586,367.63 1,516,011.78 2,177,382.08 4,383,835 Depreciation & Amortization 208,147.65 1,172,735.26 3,032,023.56 4,354,764.17 8,767,670.64 Profit Before Tax (PBT) (8,819,809.56) (33,595,169.92) (37,486,284.46) (40,709,815.92) (120,611,079.86)% of Sales -85% -57% -25% -19% -28%Exceptional Item 0Tax Expenses 1,300,922.79 7,329,595.40 18,950,147.24 27,217,276.05 54,797,941.48 Provision for Taxation for Earlier Years 0PAT (Before extraordinary items) (10,120,732.35) (40,924,765.33) (56,436,431.70) (67,927,091.97) (175,409,021.35)% of Sales -97% -70% -37% -31% -40%Extraoridinary Item 0PAT (Profit After Extraordinary Items) (10,120,732.35) (40,924,765.33) (56,436,431.70) (67,927,091.97) (175,409,021.35)% of Sales -97% -70% -37% -31% -40%Minority Interest - (Profit / Loss) 0PAT (After Extra Ord. Item & Min. Int.) (10,120,732.35) (40,924,765.33) (56,436,431.70) (67,927,091.97) (175,409,021.35)% of Sales -97% -70% -37% -31% -40%