q3 financial statement - hemas holdings, ltd
TRANSCRIPT
HEMAS HOLDINGS PLC Interim Report - 3rd Quarter 2012/13
CEO’s Review
It is with great pleasure that I present you the results of the third quarter of 2012/13. Your Company has been successful in
continuing the growth momentum it enjoyed during the first half of this year. The financial statements are prepared in
compliance with Sri Lanka Financial Reporting Standards (SLFRS) for the current year, while a second set of financial
statements have been prepared as per Sri Lanka Accounting Standards (SLAS) for both the current and previous year for the
ease of comparison.
The Group posted a revenue growth of 26.1% to record Rs. 19.2Bn (as per SLAS) for the period ending 31 December, 2012.
Our Power, Healthcare and FMCG sectors were the main contributors to the increase in revenue, posting a growth of 40.9%,
22.0% and 15.4% respectively. Group earnings grew by 25.8%, to record Rs. 1,052Mn, driven by FMCG, Healthcare and
Transportation sectors which grew at 27.2%, 31.1% and 35.8%, respectively for the period ending December, 2012. Earnings in
our Leisure sector swung from a loss of Rs. 8Mn last year to a profit of Rs. 98Mn this year.
The FMCG sector recorded revenue of Rs. 5.6Bn, which is a 15.4% growth over the previous nine months; however, much of
this growth was price led. The sector was the largest contributor to Group earnings posting Rs. 548Mn for the period ending 31st
December 2012, a growth of 27.2%. Our Personal wash category, led by our beauty soap Velvet, performed very well during the
quarter recording a growth in both volume and value terms, while our Personal care segment recorded the highest market share
achieved over two years despite a very challenging environment. During the period our Oral care brand Clogard recorded the
highest market share achieved since 2008, while Kumarika strengthened its market leadership position achieving the highest
market share since the brand was launched. In November, two new variants of deodorant were introduced under Gold; our
brand catering to the male grooming segment, while our brands Goya and Pro Sport launched new fragrance variants
strengthening our market position in this category. Going forward we foresee new challenges in the industry, especially with the
imposition of VAT on large scale wholesalers and supermarkets introduced in the 2013 Budget proposals, but are optimistic
about the next quarter. Continuing with our efforts to fund the education of disadvantaged children in the country under the ‘Big
heart’ project, a 20-20 cricket match was organized reuniting the 96 world cup champions who played against the Sri Lankan
cricket legends, who stepped forward as volunteers for this worthy cause. The event was a great success and all the funds
raised were directed to the ‘Nana Diriya’ program of the Ministry of Child Development and Women Affairs. The ‘Big heart’
project was launched to celebrate 50 years of our flagship brand ‘Baby Cheramy’.
The Healthcare sector posted a revenue growth of 22.0% to record Rs. 6.7Bn, driven by the growth in Hospitals as well as
Pharmaceutical Distribution. The sector posted a healthy earnings growth of 31.1%, to reach cumulative earnings of Rs. 375Mn
for the year under review. Our Pharmaceuticals business continued to maintain its market leadership position with a market
share of 17.8% (Source: IMS) in a rapidly growing industry which grew at 18% during the period ending 31st December, 2012.
Our Hospital business also posted strong results with a 28.1% growth in turnover during the year under review. Progress in
constructing our third hospital at Thalawathugoda is on schedule, and we expect to serve our first patient on 1st May, 2013.
During the quarter, we concluded preliminary discussions to introduce dialysis services at our hospitals, a key milestone on our
way to becoming a comprehensive healthcare services provider in the community.
Our Leisure sector enjoyed an excellent nine months posting revenue growth of 49.5% to close at Rs 1.1Bn, largely attributable
to a good winter season performance. Club Hotel Dolphin led the sector with a topline growth of 22.0% and an average
occupancy of 85%. Avani Kalutara resort was officially declared open by Hon. Basil Rajapakse, in November 2012. During the
quarter under review, Serendib Leisure Hotels received several accolades with Avani Bentota being awarded the Agoda Gold
Circle Award for excellence in on-line distribution, while Club Hotel Dolphin was awarded Holiday Check Award 2013 for being
one of the 99 most popular hotels worldwide in the “Family” category. Avani Bentota and Hotel Sigiriya won the Merit Certificates
by the EU-SWITCH ASIA for conservation and waste management. Whilst our performance so far has been encouraging, we
eagerly anticipate a meaningful initiative by Sri Lanka Tourism to market the destination to the right target segments. With
increased inventory coming into the market, demand creation will be key to maintaining rates and occupancy at current levels.
Transportation Sector topline grew by 38.0% over last year to Rs 747Mn driven by the performance in the Aviation and Maritime
Segments. Sector earnings stood at Rs 217Mn, reflecting an impressive growth of 35.8% year-on-year. Our Aviation Segment
performed well with our Outbound travel business continuing to increase its market share. Our Maritime arm commenced
operations on a joint venture with Mercantile Shipping in Galle to transport crew and sea marshals. As of date, our crew boats
have steadily gained acceptance among key clients and their feedback is encouraging. Our Feeder Agency business enjoyed a
steady quarter and also served new customers by providing maritime services, positively impacting earnings. In our Logistics
segment, we expanded our service portfolio into contract warehousing apart from the empty container transport business at
Hemas Logistics. The performance of our freight forwarding and courier partners was also noteworthy and supported overall
growth in the sector.
Our Power sector recorded a revenue growth of 40.9% reaching Rs 4.4Bn driven by escalating fuel prices. Despite our
‘Giddawa’ hydro power plant being affected by floods during the quarter, the hydro power segment recorded an increase in
revenue of 31.6% for the period, mainly attributable to the improved performance of ‘Magal Ganga’. Sector earnings declined by
14.3% compared with the corresponding period last year due to higher finance costs and exchange losses, most of which were
unrealized translation losses. Over the next quarter we expect to continue our pre-development work on new projects in Sri
Lanka and in the East-African region.
This holiday season an initiative was undertaken by ‘Piyawara’, our CSR project, to set up an ‘Angel Christmas Tree’ to collect
Christmas gifts for unprivileged children in the Northern Province. The project was successful in winning the support of
employees across the Group. As a result over 800 gifts were distributed to the children in Mulativue, Ambalnagar and
Kilinochchi with the support of the Sri Lanka Army. During the quarter Hemas Outreach foundation also sponsored a three day
residential teacher training program in the Northern Province which was organized by Ministry of Education.
We enter the last quarter, which is traditionally our best, with positive momentum and look forward to closing out the year on a
positive note.
Husein Esufally
Chief Executive Officer
Colombo
February 1, 2013
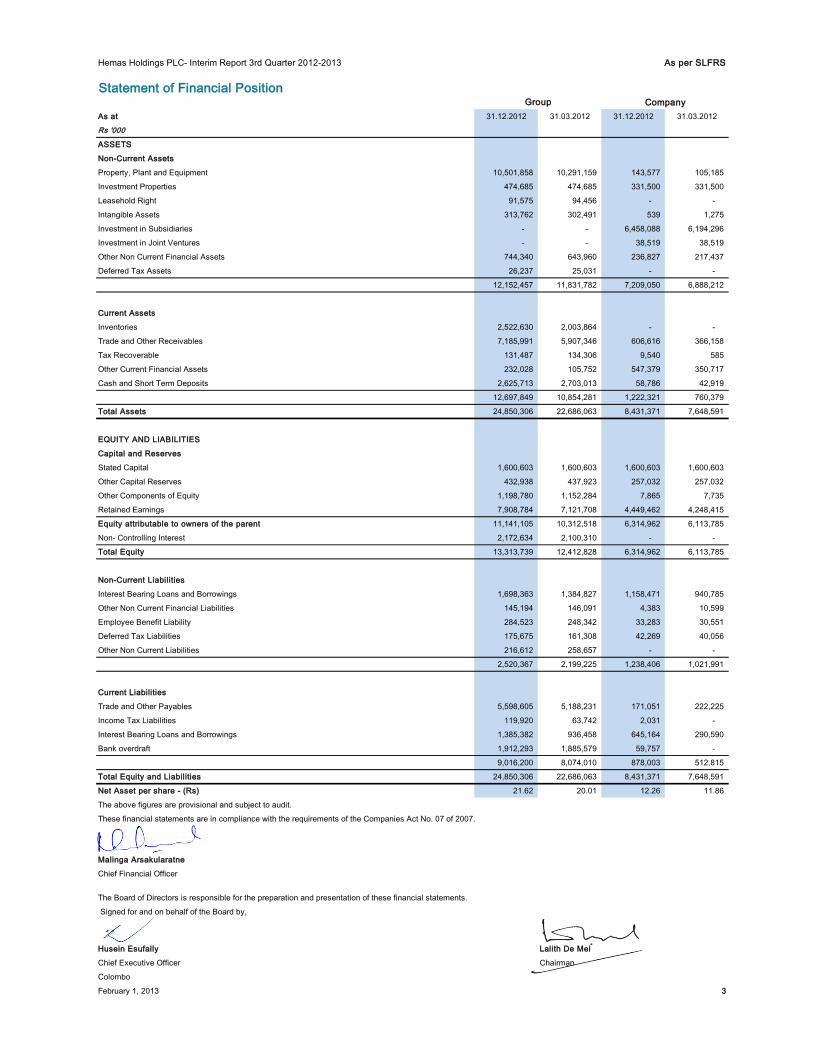
Hemas Holdings PLC- Interim Report 3rd Quarter 2012-2013 As per SLFRS
Statement of Financial Position
As at 31.12.2012 31.03.2012 31.12.2012 31.03.2012
Rs '000
ASSETS
Non-Current Assets
Property, Plant and Equipment 10,501,858 10,291,159 143,577 105,185
Investment Properties 474,685 474,685 331,500 331,500
Leasehold Right 91,575 94,456 - -
Intangible Assets 313,762 302,491 539 1,275
Investment in Subsidiaries - - 6,458,088 6,194,296
Investment in Joint Ventures - - 38,519 38,519
Other Non Current Financial Assets 744,340 643,960 236,827 217,437
Deferred Tax Assets 26,237 25,031 - -
12,152,457 11,831,782 7,209,050 6,888,212
Current Assets
Inventories 2,522,630 2,003,864 - -
Trade and Other Receivables 7,185,991 5,907,346 606,616 366,158
Tax Recoverable 131,487 134,306 9,540 585
Other Current Financial Assets 232,028 105,752 547,379 350,717
Cash and Short Term Deposits 2,625,713 2,703,013 58,786 42,919
12,697,849 10,854,281 1,222,321 760,379
Total Assets 24,850,306 22,686,063 8,431,371 7,648,591
EQUITY AND LIABILITIES
Capital and Reserves
Stated Capital 1,600,603 1,600,603 1,600,603 1,600,603
Other Capital Reserves 432,938 437,923 257,032 257,032
Other Components of Equity 1,198,780 1,152,284 7,865 7,735
Retained Earnings 7,908,784 7,121,708 4,449,462 4,248,415
Equity attributable to owners of the parent 11,141,105 10,312,518 6,314,962 6,113,785
Non- Controlling Interest 2,172,634 2,100,310 - -
Total Equity 13,313,739 12,412,828 6,314,962 6,113,785
Non-Current Liabilities
Interest Bearing Loans and Borrowings 1,698,363 1,384,827 1,158,471 940,785
Other Non Current Financial Liabilities 145,194 146,091 4,383 10,599
Employee Benefit Liability 284,523 248,342 33,283 30,551
Deferred Tax Liabilities 175,675 161,308 42,269 40,056
Other Non Current Liabilities 216,612 258,657 - -
2,520,367 2,199,225 1,238,406 1,021,991
Current Liabilities
Trade and Other Payables 5,598,605 5,188,231 171,051 222,225
Income Tax Liabilities 119,920 63,742 2,031 -
Interest Bearing Loans and Borrowings 1,385,382 936,458 645,164 290,590
Bank overdraft 1,912,293 1,885,579 59,757 -
9,016,200 8,074,010 878,003 512,815
Total Equity and Liabilities 24,850,306 22,686,063 8,431,371 7,648,591
Net Asset per share - (Rs) 21.62 20.01 12.26 11.86
The above figures are provisional and subject to audit.
These financial statements are in compliance with the requirements of the Companies Act No. 07 of 2007.
- - 0 -
Malinga Arsakularatne
Chief Financial Officer
The Board of Directors is responsible for the preparation and presentation of these financial statements.
Signed for and on behalf of the Board by,
Husein Esufally Lalith De Mel
Chief Executive Officer Chairman
Colombo
February 1, 2013 3
Group Company
Hemas Holdings PLC- Interim Report 3rd Quarter 2012-2013 As per SLFRS
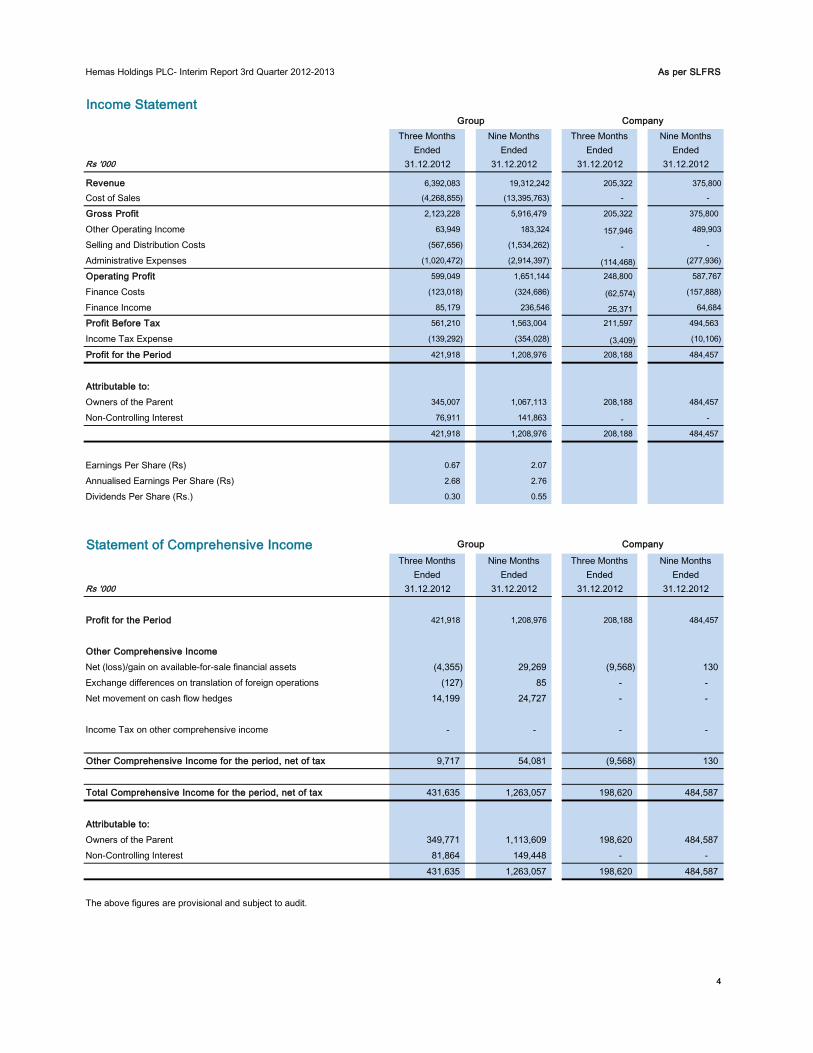
Income Statement
Three Months
Ended
Nine Months
Ended
Three Months
Ended
Nine Months
Ended
Rs '000 31.12.2012 31.12.2012 31.12.2012 31.12.2012
Revenue 6,392,083 19,312,242 205,322 375,800
Cost of Sales (4,268,855) (13,395,763) - -
Gross Profit 2,123,228 5,916,479 205,322 375,800
Other Operating Income 63,949 183,324 157,946 489,903
Selling and Distribution Costs (567,656) (1,534,262) - -
Administrative Expenses (1,020,472) (2,914,397) (114,468) (277,936)
Operating Profit 599,049 1,651,144 248,800 587,767
Finance Costs (123,018) (324,686) (62,574) (157,888)
Finance Income 85,179 236,546 25,371 64,684
Profit Before Tax 561,210 1,563,004 211,597 494,563
Income Tax Expense (139,292) (354,028) (3,409) (10,106)
Profit for the Period 421,918 1,208,976 208,188 484,457
Attributable to:
Owners of the Parent 345,007 1,067,113 208,188 484,457
Non-Controlling Interest 76,911 141,863 - -
421,918 1,208,976 208,188 484,457
Earnings Per Share (Rs) 0.67 2.07
Annualised Earnings Per Share (Rs) 2.68 2.76
Dividends Per Share (Rs.) 0.30 0.55
Statement of Comprehensive IncomeThree Months
Ended
Nine Months
Ended
Three Months
Ended
Nine Months
Ended
Rs '000 31.12.2012 31.12.2012 31.12.2012 31.12.2012
Profit for the Period 421,918 1,208,976 208,188 484,457
Other Comprehensive Income
Net (loss)/gain on available-for-sale financial assets (4,355) 29,269 (9,568) 130
Exchange differences on translation of foreign operations (127) 85 - -
Net movement on cash flow hedges 14,199 24,727 - -
Income Tax on other comprehensive income - - - -
Other Comprehensive Income for the period, net of tax 9,717 54,081 (9,568) 130
Total Comprehensive Income for the period, net of tax 431,635 1,263,057 198,620 484,587
Attributable to:
Owners of the Parent 349,771 1,113,609 198,620 484,587
Non-Controlling Interest 81,864 149,448 - -
431,635 1,263,057 198,620 484,587
The above figures are provisional and subject to audit.
4
Group Company
Group Company
Hemas Holdings PLC- Interim Report 3rd Quarter 2012-2013 As per SLFRS
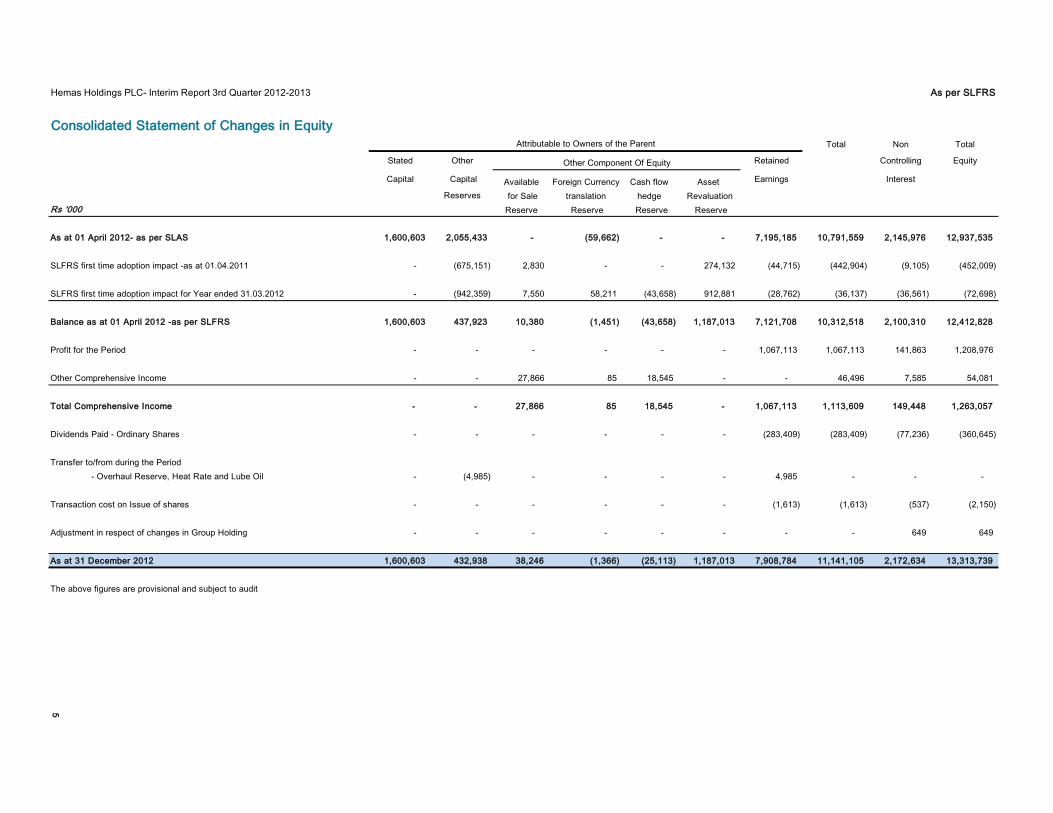
Consolidated Statement of Changes in Equity
Total Non Total
Stated Other Retained Controlling Equity
Capital Capital Available Foreign Currency Cash flow Asset Earnings Interest
Reserves for Sale translation hedge Revaluation
Rs '000 Reserve Reserve Reserve Reserve
As at 01 April 2012- as per SLAS 1,600,603 2,055,433 - (59,662) - - 7,195,185 10,791,559 2,145,976 12,937,535
SLFRS first time adoption impact -as at 01.04.2011 - (675,151) 2,830 - - 274,132 (44,715) (442,904) (9,105) (452,009)
SLFRS first time adoption impact for Year ended 31.03.2012 - (942,359) 7,550 58,211 (43,658) 912,881 (28,762) (36,137) (36,561) (72,698)
Balance as at 01 April 2012 -as per SLFRS 1,600,603 437,923 10,380 (1,451) (43,658) 1,187,013 7,121,708 10,312,518 2,100,310 12,412,828
Profit for the Period - - - - - - 1,067,113 1,067,113 141,863 1,208,976
Other Comprehensive Income - - 27,866 85 18,545 - - 46,496 7,585 54,081
Total Comprehensive Income - - 27,866 85 18,545 - 1,067,113 1,113,609 149,448 1,263,057
Dividends Paid - Ordinary Shares - - - - - - (283,409) (283,409) (77,236) (360,645)
Transfer to/from during the Period
- Overhaul Reserve, Heat Rate and Lube Oil - (4,985) - - - - 4,985 - - -
Transaction cost on Issue of shares - - - - - - (1,613) (1,613) (537) (2,150)
Adjustment in respect of changes in Group Holding - - - - - - - - 649 649
As at 31 December 2012 1,600,603 432,938 38,246 (1,366) (25,113) 1,187,013 7,908,784 11,141,105 2,172,634 13,313,739
The above figures are provisional and subject to audit
5
Attributable to Owners of the Parent
Other Component Of Equity
Hemas Holdings PLC- Interim Report 3rd Quarter 2012-2013
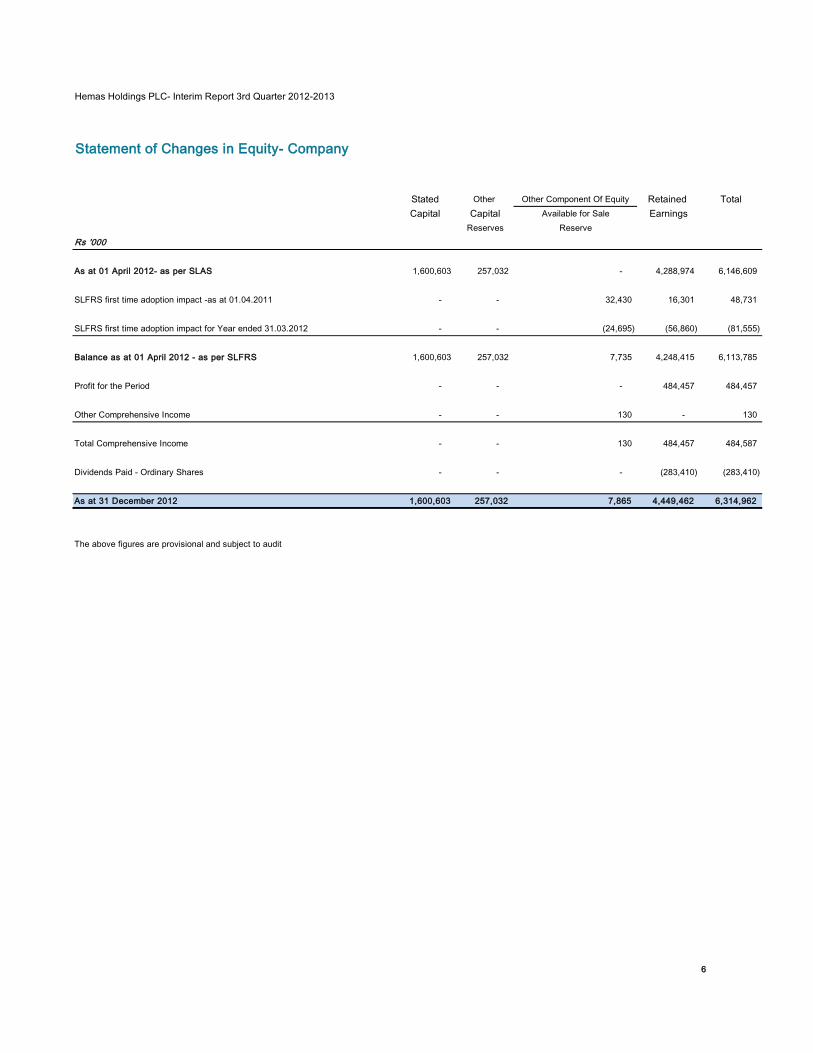
Statement of Changes in Equity- Company
Stated Other Other Component Of Equity Retained Total
Capital Capital Available for Sale Earnings
Reserves Reserve
Rs '000
As at 01 April 2012- as per SLAS 1,600,603 257,032 - 4,288,974 6,146,609
SLFRS first time adoption impact -as at 01.04.2011 - - 32,430 16,301 48,731
SLFRS first time adoption impact for Year ended 31.03.2012 - - (24,695) (56,860) (81,555)
Balance as at 01 April 2012 - as per SLFRS 1,600,603 257,032 7,735 4,248,415 6,113,785
Profit for the Period - - - 484,457 484,457
Other Comprehensive Income - - 130 - 130
Total Comprehensive Income - - 130 484,457 484,587
Dividends Paid - Ordinary Shares - - - (283,410) (283,410)
As at 31 December 2012 1,600,603 257,032 7,865 4,449,462 6,314,962
The above figures are provisional and subject to audit
6
Hemas Holdings PLC- Interim Report 3rd Quarter 2012-2013 As per SLFRS
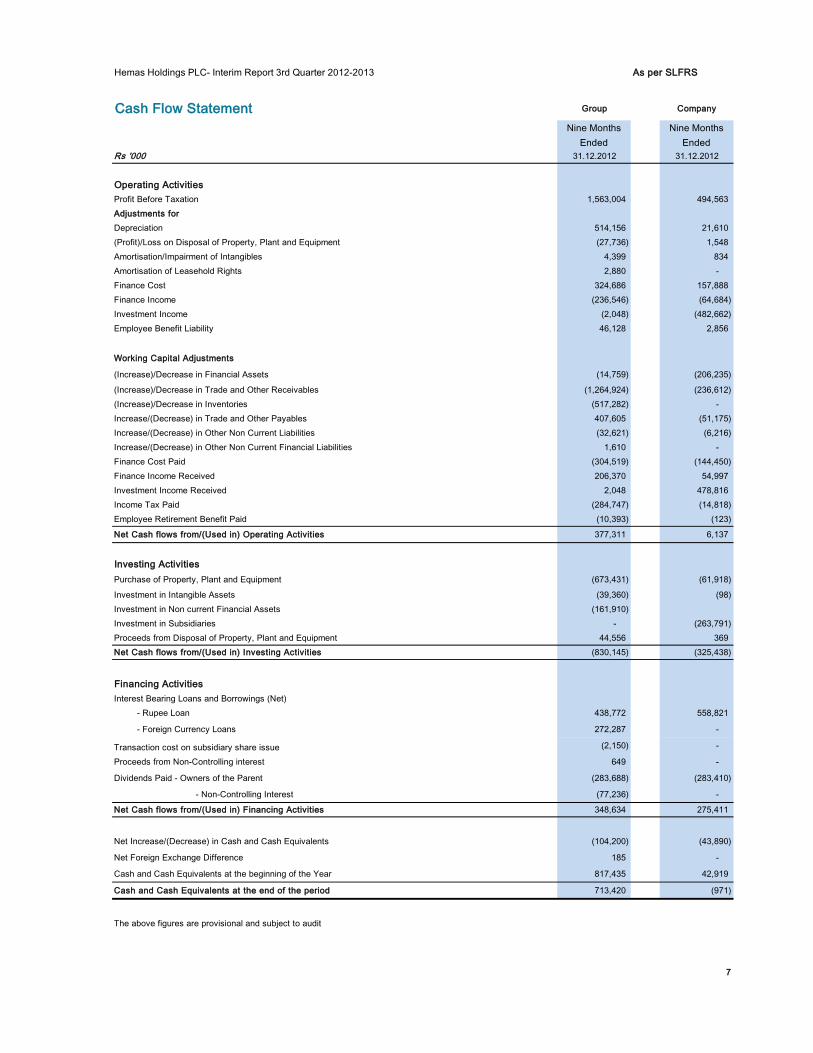
Cash Flow Statement Group Company
Nine Months
Ended
Nine Months
Ended
Rs '000 31.12.2012 31.12.2012
Operating Activities
Profit Before Taxation 1,563,004 494,563
Adjustments for
Depreciation 514,156 21,610
(Profit)/Loss on Disposal of Property, Plant and Equipment (27,736) 1,548
Amortisation/Impairment of Intangibles 4,399 834
Amortisation of Leasehold Rights 2,880 -
Finance Cost 324,686 157,888
Finance Income (236,546) (64,684)
Investment Income (2,048) (482,662)
Employee Benefit Liability 46,128 2,856
Working Capital Adjustments
(Increase)/Decrease in Financial Assets (14,759) (206,235)
(Increase)/Decrease in Trade and Other Receivables (1,264,924) (236,612)
(Increase)/Decrease in Inventories (517,282) -
Increase/(Decrease) in Trade and Other Payables 407,605 (51,175)
Increase/(Decrease) in Other Non Current Liabilities (32,621) (6,216)
Increase/(Decrease) in Other Non Current Financial Liabilities 1,610 -
Finance Cost Paid (304,519) (144,450)
Finance Income Received 206,370 54,997
Investment Income Received 2,048 478,816
Income Tax Paid (284,747) (14,818)
Employee Retirement Benefit Paid (10,393) (123)
Net Cash flows from/(Used in) Operating Activities 377,311 6,137
Investing Activities
Purchase of Property, Plant and Equipment (673,431) (61,918)
Investment in Intangible Assets (39,360) (98)
Investment in Non current Financial Assets (161,910)
Investment in Subsidiaries - (263,791)
Proceeds from Disposal of Property, Plant and Equipment 44,556 369
Net Cash flows from/(Used in) Investing Activities (830,145) (325,438)
Financing Activities
Interest Bearing Loans and Borrowings (Net)
- Rupee Loan 438,772 558,821
- Foreign Currency Loans 272,287 -
Transaction cost on subsidiary share issue (2,150) -
Proceeds from Non-Controlling interest 649 -
Dividends Paid - Owners of the Parent (283,688) (283,410)
- Non-Controlling Interest (77,236) -
Net Cash flows from/(Used in) Financing Activities 348,634 275,411
Net Increase/(Decrease) in Cash and Cash Equivalents (104,200) (43,890)
Net Foreign Exchange Difference 185 -
Cash and Cash Equivalents at the beginning of the Year 817,435 42,919
Cash and Cash Equivalents at the end of the period 713,420 (971)
The above figures are provisional and subject to audit
7
As per SLFRS
Hemas Holdings PLC- Interim Report 3rd Quarter 2012-2013
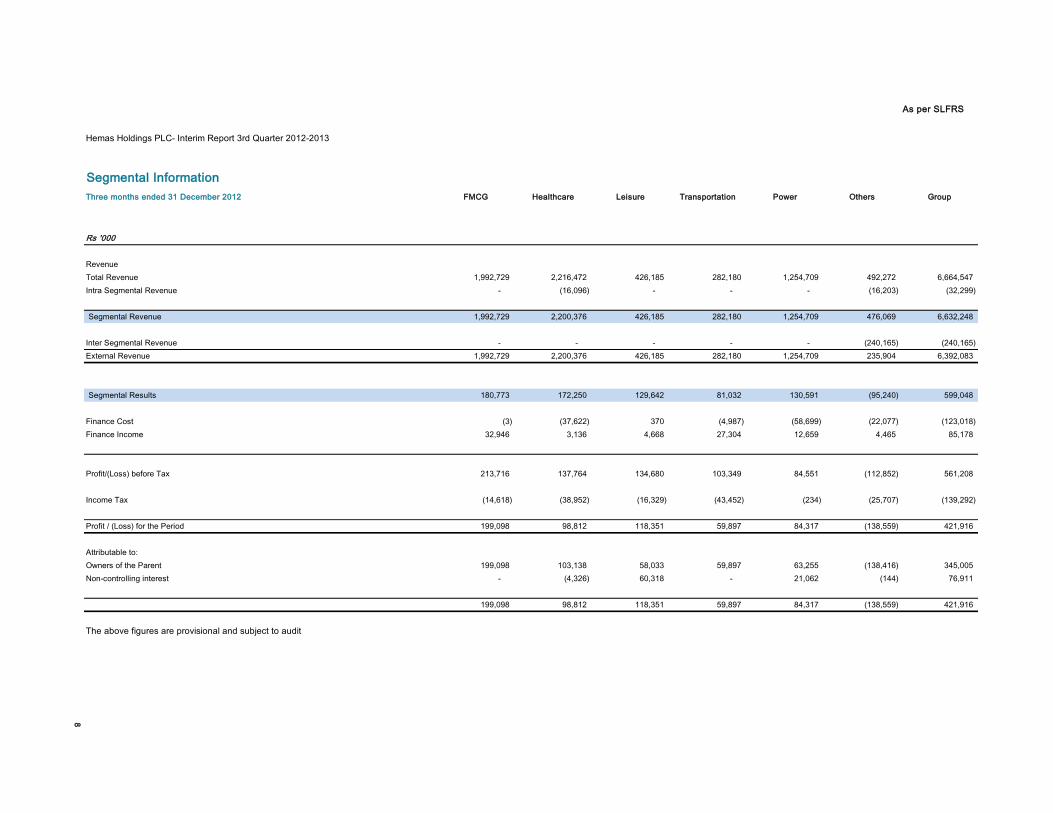
Segmental Information
Three months ended 31 December 2012 FMCG Healthcare Leisure Transportation Power Others Group
Rs '000
Revenue
Total Revenue 1,992,729 2,216,472 426,185 282,180 1,254,709 492,272 6,664,547
Intra Segmental Revenue - (16,096) - - - (16,203) (32,299)
Segmental Revenue 1,992,729 2,200,376 426,185 282,180 1,254,709 476,069 6,632,248
Inter Segmental Revenue - - - - - (240,165) (240,165)
External Revenue 1,992,729 2,200,376 426,185 282,180 1,254,709 235,904 6,392,083
Segmental Results 180,773 172,250 129,642 81,032 130,591 (95,240) 599,048
Finance Cost (3) (37,622) 370 (4,987) (58,699) (22,077) (123,018)
Finance Income 32,946 3,136 4,668 27,304 12,659 4,465 85,178
Profit/(Loss) before Tax 213,716 137,764 134,680 103,349 84,551 (112,852) 561,208
Income Tax (14,618) (38,952) (16,329) (43,452) (234) (25,707) (139,292)
Profit / (Loss) for the Period 199,098 98,812 118,351 59,897 84,317 (138,559) 421,916
Attributable to:
Owners of the Parent 199,098 103,138 58,033 59,897 63,255 (138,416) 345,005
Non-controlling interest - (4,326) 60,318 - 21,062 (144) 76,911
199,098 98,812 118,351 59,897 84,317 (138,559) 421,916
The above figures are provisional and subject to audit
8
As per SLFRS
Hemas Holdings PLC- Interim Report 3rd Quarter 2012-2013
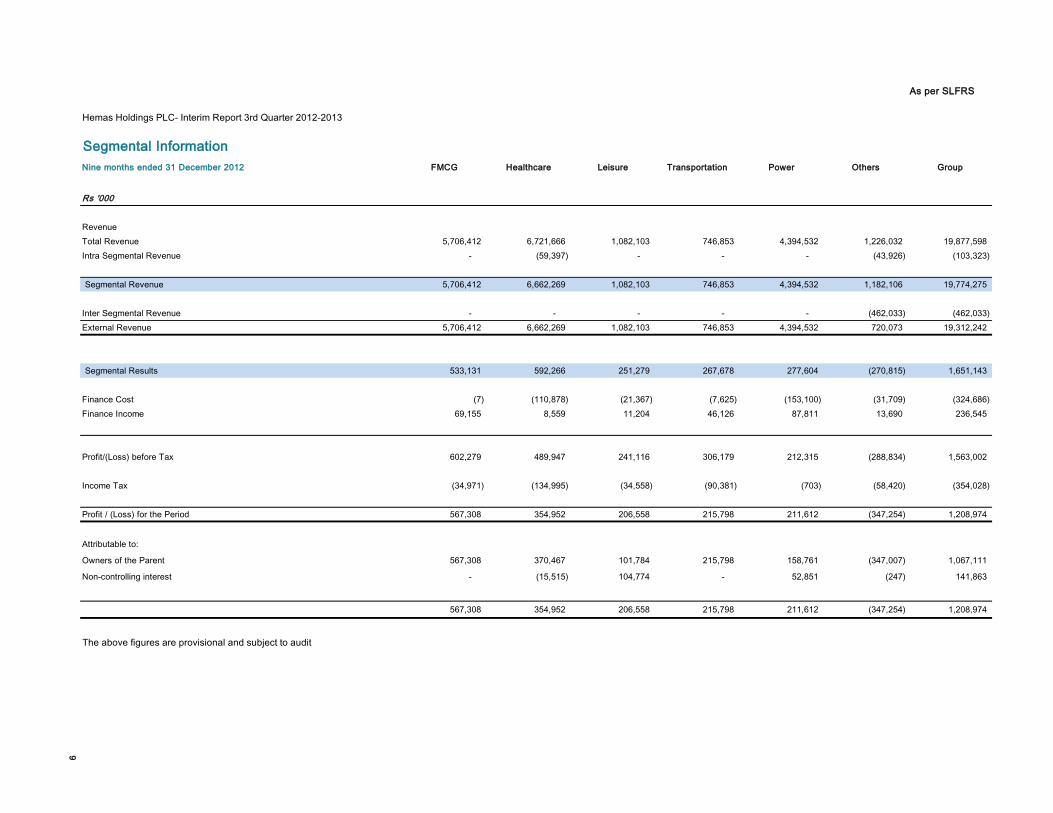
Segmental Information
Nine months ended 31 December 2012 FMCG Healthcare Leisure Transportation Power Others Group
Rs '000
Revenue
Total Revenue 5,706,412 6,721,666 1,082,103 746,853 4,394,532 1,226,032 19,877,598
Intra Segmental Revenue - (59,397) - - - (43,926) (103,323)
Segmental Revenue 5,706,412 6,662,269 1,082,103 746,853 4,394,532 1,182,106 19,774,275
Inter Segmental Revenue - - - - - (462,033) (462,033)
External Revenue 5,706,412 6,662,269 1,082,103 746,853 4,394,532 720,073 19,312,242
Segmental Results 533,131 592,266 251,279 267,678 277,604 (270,815) 1,651,143
Finance Cost (7) (110,878) (21,367) (7,625) (153,100) (31,709) (324,686)
Finance Income 69,155 8,559 11,204 46,126 87,811 13,690 236,545
Profit/(Loss) before Tax 602,279 489,947 241,116 306,179 212,315 (288,834) 1,563,002
Income Tax (34,971) (134,995) (34,558) (90,381) (703) (58,420) (354,028)
Profit / (Loss) for the Period 567,308 354,952 206,558 215,798 211,612 (347,254) 1,208,974
Attributable to:
Owners of the Parent 567,308 370,467 101,784 215,798 158,761 (347,007) 1,067,111
Non-controlling interest - (15,515) 104,774 - 52,851 (247) 141,863
567,308 354,952 206,558 215,798 211,612 (347,254) 1,208,974
The above figures are provisional and subject to audit
9
Hemas Holdings PLC- Interim Report 3rd Quarter 2012-2013 - - As per SLAS
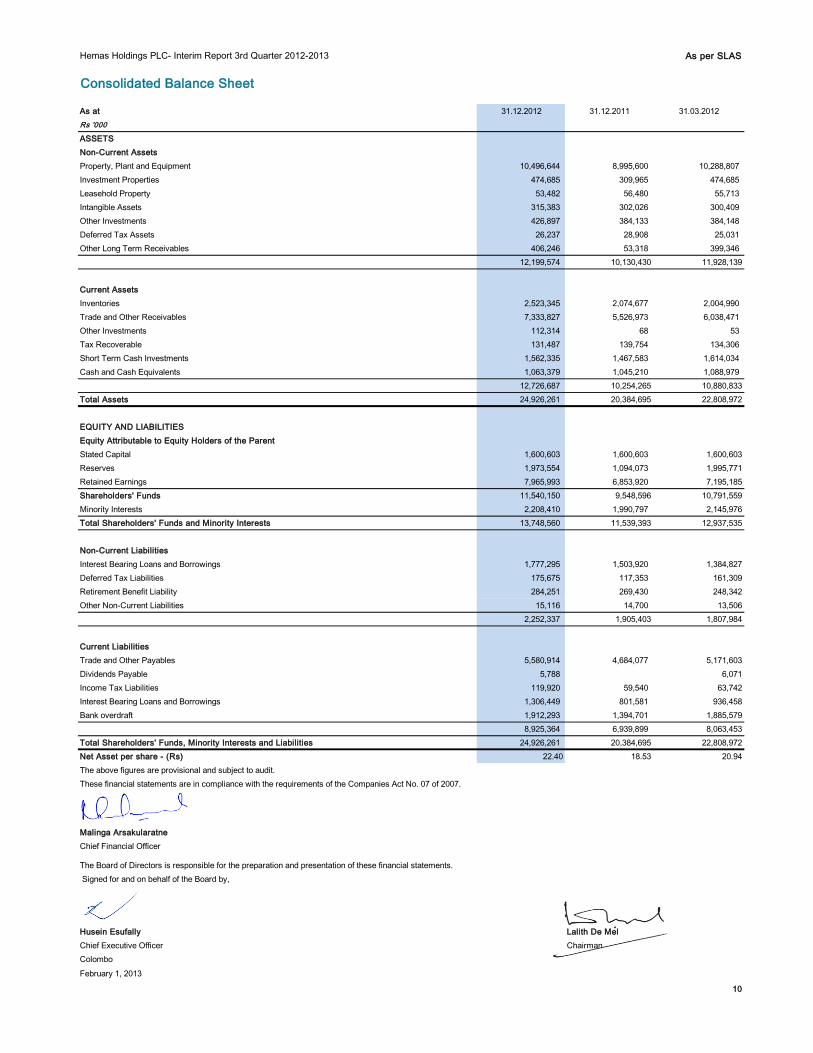
Consolidated Balance Sheet
As at 31.12.2012 31.12.2011 31.03.2012
Rs '000
ASSETS
Non-Current Assets
Property, Plant and Equipment 10,496,644 8,995,600 10,288,807
Investment Properties 474,685 309,965 474,685
Leasehold Property 53,482 56,480 55,713
Intangible Assets 315,383 302,026 300,409
Other Investments 426,897 384,133 384,148
Deferred Tax Assets 26,237 28,908 25,031
Other Long Term Receivables 406,246 53,318 399,346
12,199,574 10,130,430 11,928,139
Current Assets
Inventories 2,523,345 2,074,677 2,004,990
Trade and Other Receivables 7,333,827 5,526,973 6,038,471
Other Investments 112,314 68 53
Tax Recoverable 131,487 139,754 134,306
Short Term Cash Investments 1,562,335 1,467,583 1,614,034
Cash and Cash Equivalents 1,063,379 1,045,210 1,088,979
12,726,687 10,254,265 10,880,833
Total Assets 24,926,261 20,384,695 22,808,972
EQUITY AND LIABILITIES
Equity Attributable to Equity Holders of the Parent
Stated Capital 1,600,603 1,600,603 1,600,603
Reserves 1,973,554 1,094,073 1,995,771
Retained Earnings 7,965,993 6,853,920 7,195,185
Shareholders' Funds 11,540,150 9,548,596 10,791,559
Minority Interests 2,208,410 1,990,797 2,145,976
Total Shareholders' Funds and Minority Interests 13,748,560 11,539,393 12,937,535
Non-Current Liabilities
Interest Bearing Loans and Borrowings 1,777,295 1,503,920 1,384,827
Deferred Tax Liabilities 175,675 117,353 161,309
Retirement Benefit Liability 284,251 269,430 248,342
Other Non-Current Liabilities 15,116 14,700 13,506
2,252,337 1,905,403 1,807,984
Current Liabilities
Trade and Other Payables 5,580,914 4,684,077 5,171,603
Dividends Payable 5,788 6,071
Income Tax Liabilities 119,920 59,540 63,742
Interest Bearing Loans and Borrowings 1,306,449 801,581 936,458
Bank overdraft 1,912,293 1,394,701 1,885,579
8,925,364 6,939,899 8,063,453
Total Shareholders' Funds, Minority Interests and Liabilities 24,926,261 20,384,695 22,808,972
Net Asset per share - (Rs) 22.40 18.53 20.94
The above figures are provisional and subject to audit.
These financial statements are in compliance with the requirements of the Companies Act No. 07 of 2007.
- - 0
Malinga Arsakularatne
Chief Financial Officer
The Board of Directors is responsible for the preparation and presentation of these financial statements.
Signed for and on behalf of the Board by,
Husein Esufally Lalith De Mel
Chief Executive Officer Chairman
Colombo
February 1, 2013
10
Hemas Holdings PLC- Interim Report 3rd Quarter 2012-2013 As per SLAS
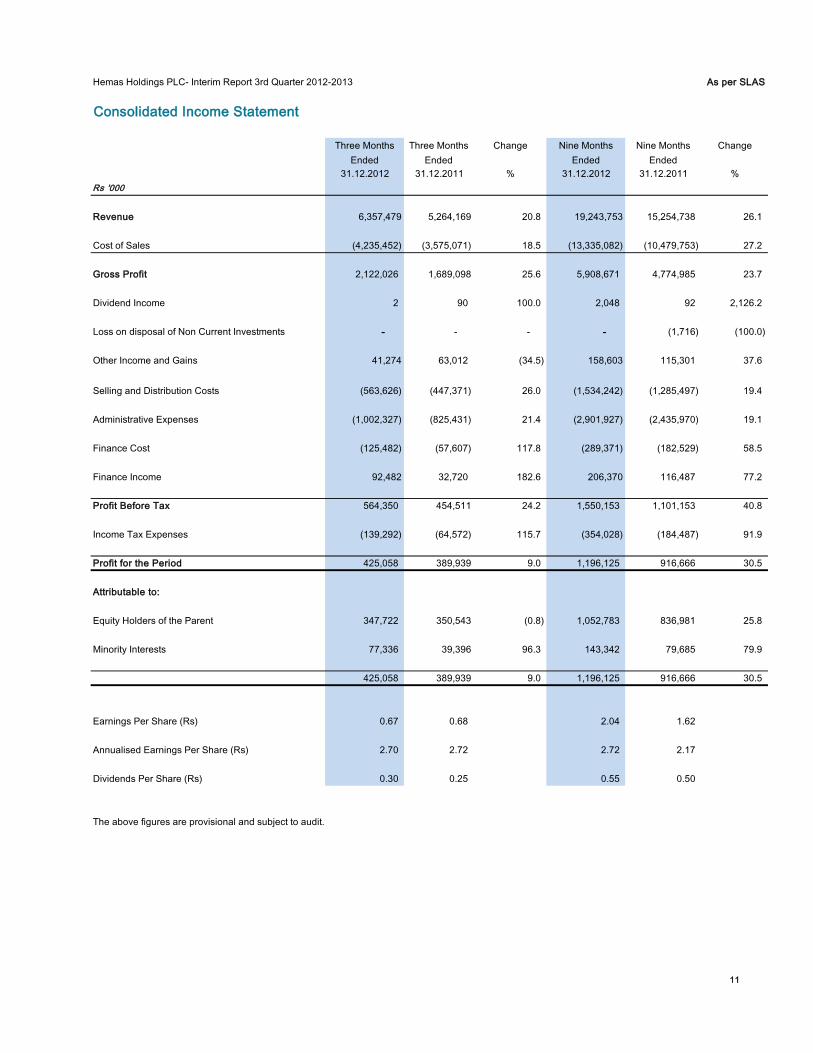
Consolidated Income Statement
Three Months
Ended
Three Months
Ended
Change Nine Months
Ended
Nine Months
Ended
Change
31.12.2012 31.12.2011 % 31.12.2012 31.12.2011 %
Rs '000
Revenue 6,357,479 5,264,169 20.8 19,243,753 15,254,738 26.1
Cost of Sales (4,235,452) (3,575,071) 18.5 (13,335,082) (10,479,753) 27.2
Gross Profit 2,122,026 1,689,098 25.6 5,908,671 4,774,985 23.7
Dividend Income 2 90 100.0 2,048 92 2,126.2
Loss on disposal of Non Current Investments - - - - (1,716) (100.0)
Other Income and Gains 41,274 63,012 (34.5) 158,603 115,301 37.6
Selling and Distribution Costs (563,626) (447,371) 26.0 (1,534,242) (1,285,497) 19.4
Administrative Expenses (1,002,327) (825,431) 21.4 (2,901,927) (2,435,970) 19.1
Finance Cost (125,482) (57,607) 117.8 (289,371) (182,529) 58.5
Finance Income 92,482 32,720 182.6 206,370 116,487 77.2
Profit Before Tax 564,350 454,511 24.2 1,550,153 1,101,153 40.8
Income Tax Expenses (139,292) (64,572) 115.7 (354,028) (184,487) 91.9
Profit for the Period 425,058 389,939 9.0 1,196,125 916,666 30.5
Attributable to:
Equity Holders of the Parent 347,722 350,543 (0.8) 1,052,783 836,981 25.8
Minority Interests 77,336 39,396 96.3 143,342 79,685 79.9
425,058 389,939 9.0 1,196,125 916,666 30.5
Earnings Per Share (Rs) 0.67 0.68 2.04 1.62
Annualised Earnings Per Share (Rs) 2.70 2.72 2.72 2.17
Dividends Per Share (Rs) 0.30 0.25 0.55 0.50
The above figures are provisional and subject to audit.
11
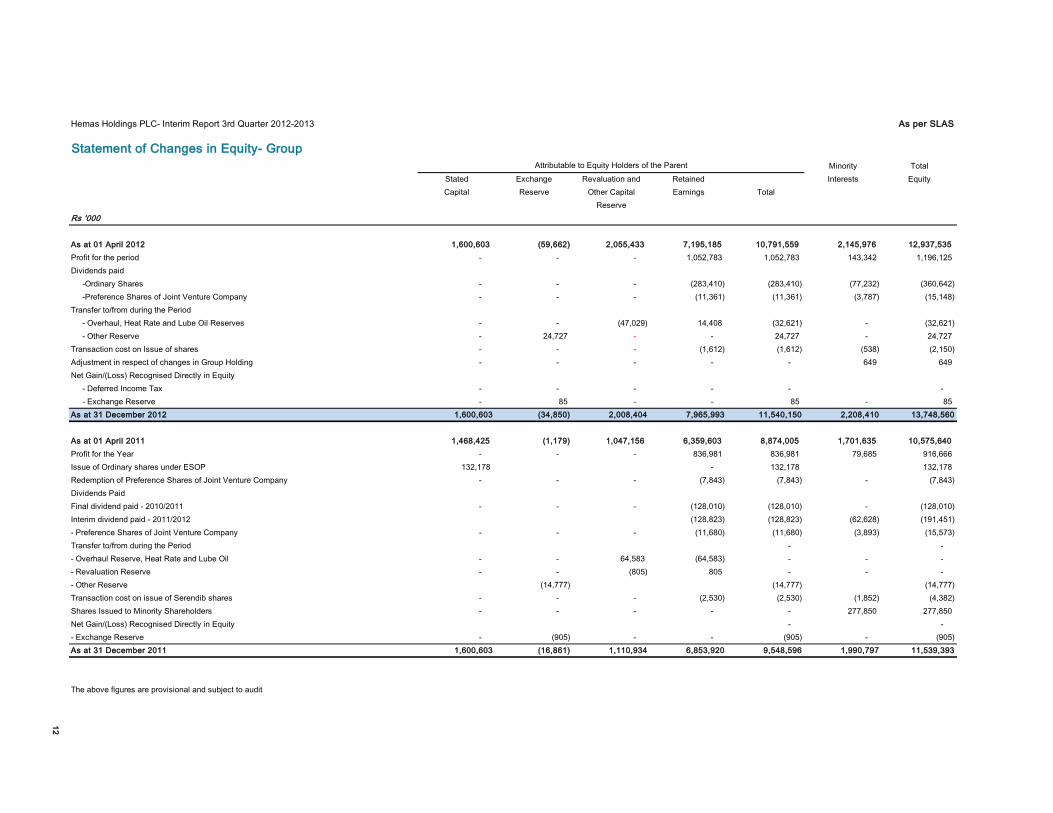
Hemas Holdings PLC- Interim Report 3rd Quarter 2012-2013 As per SLAS
Statement of Changes in Equity- Group
Minority Total
Stated Exchange Revaluation and Retained Interests Equity
Capital Reserve Other Capital Earnings Total
Reserve
Rs '000
As at 01 April 2012 1,600,603 (59,662) 2,055,433 7,195,185 10,791,559 2,145,976 12,937,535
Profit for the period - - - 1,052,783 1,052,783 143,342 1,196,125
Dividends paid
-Ordinary Shares - - - (283,410) (283,410) (77,232) (360,642)
-Preference Shares of Joint Venture Company - - - (11,361) (11,361) (3,787) (15,148)
Transfer to/from during the Period
- Overhaul, Heat Rate and Lube Oil Reserves - - (47,029) 14,408 (32,621) - (32,621)
- Other Reserve - 24,727 - - 24,727 - 24,727
Transaction cost on Issue of shares - - - (1,612) (1,612) (538) (2,150)
Adjustment in respect of changes in Group Holding - - - - - 649 649
Net Gain/(Loss) Recognised Directly in Equity
- Deferred Income Tax - - - - - -
- Exchange Reserve - 85 - - 85 - 85
As at 31 December 2012 1,600,603 (34,850) 2,008,404 7,965,993 11,540,150 2,208,410 13,748,560
As at 01 April 2011 1,468,425 (1,179) 1,047,156 6,359,603 8,874,005 1,701,635 10,575,640
Profit for the Year - - - 836,981 836,981 79,685 916,666
Issue of Ordinary shares under ESOP 132,178 - 132,178 132,178
Redemption of Preference Shares of Joint Venture Company - - - (7,843) (7,843) - (7,843)
Dividends Paid
Final dividend paid - 2010/2011 - - - (128,010) (128,010) - (128,010)
Interim dividend paid - 2011/2012 (128,823) (128,823) (62,628) (191,451)
- Preference Shares of Joint Venture Company - - - (11,680) (11,680) (3,893) (15,573)
Transfer to/from during the Period - -
- Overhaul Reserve, Heat Rate and Lube Oil - - 64,583 (64,583) - - -
- Revaluation Reserve - - (805) 805 - - -
- Other Reserve (14,777) (14,777) (14,777)
Transaction cost on issue of Serendib shares - - - (2,530) (2,530) (1,852) (4,382)
Shares Issued to Minority Shareholders - - - - - 277,850 277,850
Net Gain/(Loss) Recognised Directly in Equity - -
- Exchange Reserve - (905) - - (905) - (905)
As at 31 December 2011 1,600,603 (16,861) 1,110,934 6,853,920 9,548,596 1,990,797 11,539,393
The above figures are provisional and subject to audit
12
Attributable to Equity Holders of the Parent
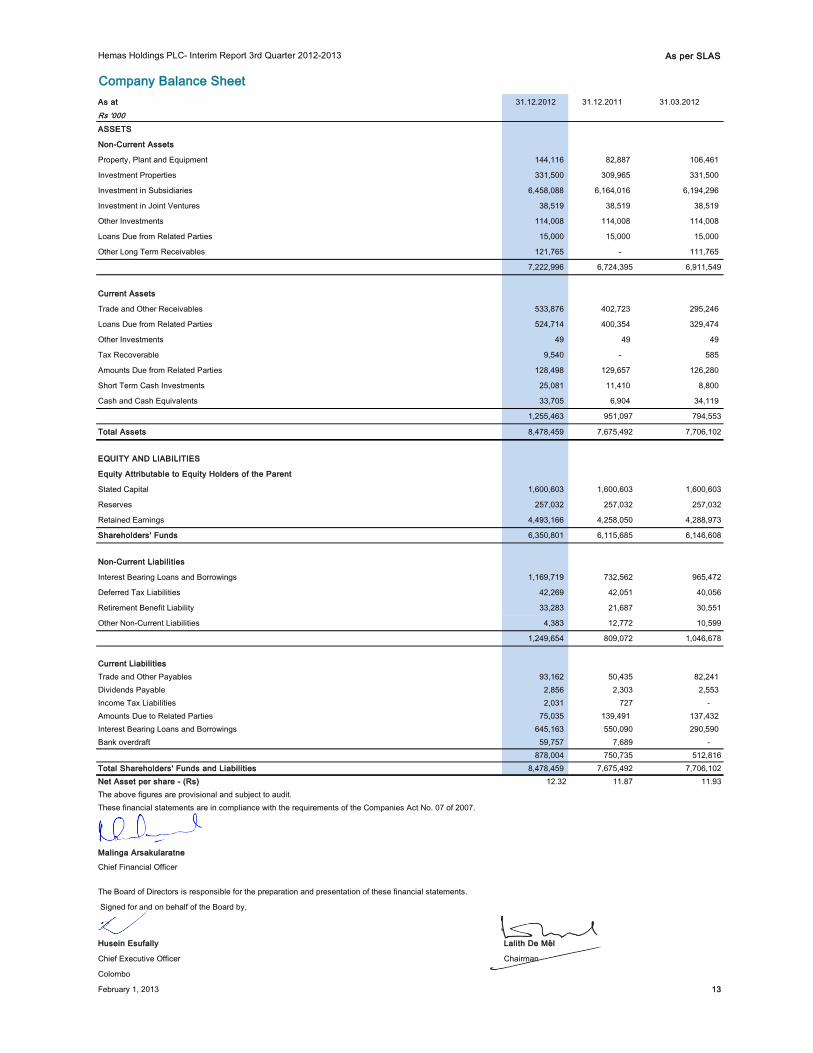
Hemas Holdings PLC- Interim Report 3rd Quarter 2012-2013 As per SLAS
Company Balance Sheet
As at 31.12.2012 31.12.2011 31.03.2012
Rs '000
ASSETS
Non-Current Assets
Property, Plant and Equipment 144,116 82,887 106,461
Investment Properties 331,500 309,965 331,500
Investment in Subsidiaries 6,458,088 6,164,016 6,194,296
Investment in Joint Ventures 38,519 38,519 38,519
Other Investments 114,008 114,008 114,008
Loans Due from Related Parties 15,000 15,000 15,000
Other Long Term Receivables 121,765 - 111,765
7,222,996 6,724,395 6,911,549
Current Assets
Trade and Other Receivables 533,876 402,723 295,246
Loans Due from Related Parties 524,714 400,354 329,474
Other Investments 49 49 49
Tax Recoverable 9,540 - 585
Amounts Due from Related Parties 128,498 129,657 126,280
Short Term Cash Investments 25,081 11,410 8,800
Cash and Cash Equivalents 33,705 6,904 34,119
1,255,463 951,097 794,553
Total Assets 8,478,459 7,675,492 7,706,102
EQUITY AND LIABILITIES
Equity Attributable to Equity Holders of the Parent
Stated Capital 1,600,603 1,600,603 1,600,603
Reserves 257,032 257,032 257,032
Retained Earnings 4,493,166 4,258,050 4,288,973
Shareholders' Funds 6,350,801 6,115,685 6,146,608
Non-Current Liabilities
Interest Bearing Loans and Borrowings 1,169,719 732,562 965,472
Deferred Tax Liabilities 42,269 42,051 40,056
Retirement Benefit Liability 33,283 21,687 30,551
Other Non-Current Liabilities 4,383 12,772 10,599
1,249,654 809,072 1,046,678
Current Liabilities
Trade and Other Payables 93,162 50,435 82,241
Dividends Payable 2,856 2,303 2,553
Income Tax Liabilities 2,031 727 -
Amounts Due to Related Parties 75,035 139,491 137,432
Interest Bearing Loans and Borrowings 645,163 550,090 290,590
Bank overdraft 59,757 7,689 -
878,004 750,735 512,816
Total Shareholders' Funds and Liabilities 8,478,459 7,675,492 7,706,102
Net Asset per share - (Rs) 12.32 11.87 11.93
The above figures are provisional and subject to audit.
These financial statements are in compliance with the requirements of the Companies Act No. 07 of 2007.
- - -
Malinga Arsakularatne
Chief Financial Officer
The Board of Directors is responsible for the preparation and presentation of these financial statements.
Signed for and on behalf of the Board by,
Husein Esufally Lalith De Mel
Chief Executive Officer Chairman
Colombo
February 1, 2013 13
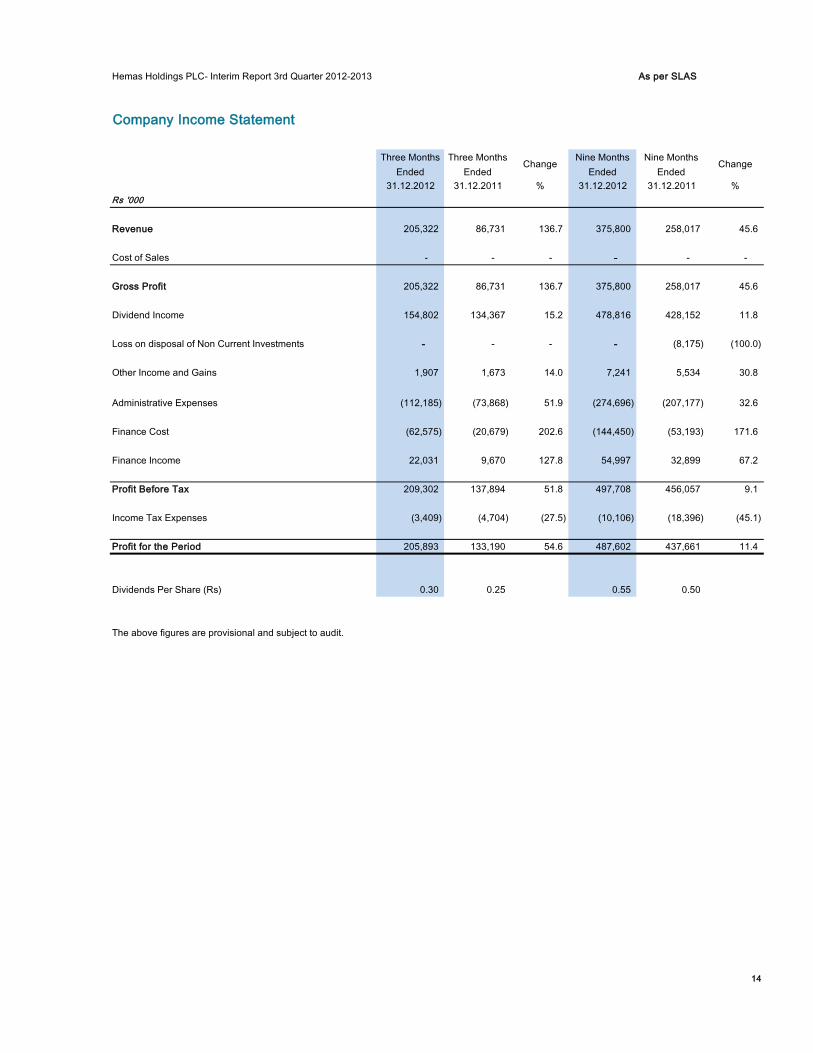
Hemas Holdings PLC- Interim Report 3rd Quarter 2012-2013 As per SLAS
Company Income Statement
Three Months
Ended
Three Months
EndedChange
Nine Months
Ended
Nine Months
EndedChange
31.12.2012 31.12.2011 % 31.12.2012 31.12.2011 %
Rs '000
Revenue 205,322 86,731 136.7 375,800 258,017 45.6
Cost of Sales - - - - - -
Gross Profit 205,322 86,731 136.7 375,800 258,017 45.6
Dividend Income 154,802 134,367 15.2 478,816 428,152 11.8
Loss on disposal of Non Current Investments - - - - (8,175) (100.0)
Other Income and Gains 1,907 1,673 14.0 7,241 5,534 30.8
Administrative Expenses (112,185) (73,868) 51.9 (274,696) (207,177) 32.6
Finance Cost (62,575) (20,679) 202.6 (144,450) (53,193) 171.6
Finance Income 22,031 9,670 127.8 54,997 32,899 67.2
Profit Before Tax 209,302 137,894 51.8 497,708 456,057 9.1
Income Tax Expenses (3,409) (4,704) (27.5) (10,106) (18,396) (45.1)
Profit for the Period 205,893 133,190 54.6 487,602 437,661 11.4
Dividends Per Share (Rs) 0.30 0.25 0.55 0.50
The above figures are provisional and subject to audit.
14
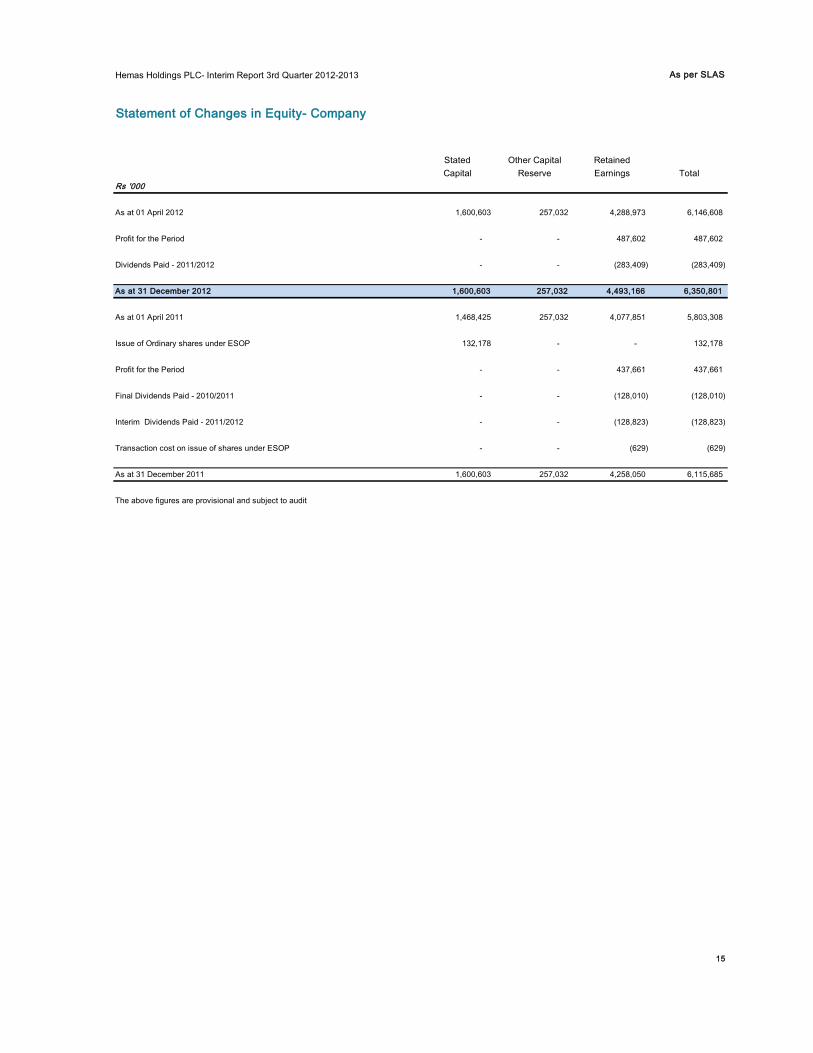
Hemas Holdings PLC- Interim Report 3rd Quarter 2012-2013
Statement of Changes in Equity- Company
Stated Other Capital Retained
Capital Reserve Earnings Total
Rs '000
As at 01 April 2012 1,600,603 257,032 4,288,973 6,146,608
Profit for the Period - - 487,602 487,602
Dividends Paid - 2011/2012 - - (283,409) (283,409)
As at 31 December 2012 1,600,603 257,032 4,493,166 6,350,801
As at 01 April 2011 1,468,425 257,032 4,077,851 5,803,308
Issue of Ordinary shares under ESOP 132,178 - - 132,178
Profit for the Period - - 437,661 437,661
Final Dividends Paid - 2010/2011 - - (128,010) (128,010)
Interim Dividends Paid - 2011/2012 - - (128,823) (128,823)
Transaction cost on issue of shares under ESOP - - (629) (629)
As at 31 December 2011 1,600,603 257,032 4,258,050 6,115,685
The above figures are provisional and subject to audit
15
As per SLAS
Hemas Holdings PLC- Interim Report 3rd Quarter 2012-2013
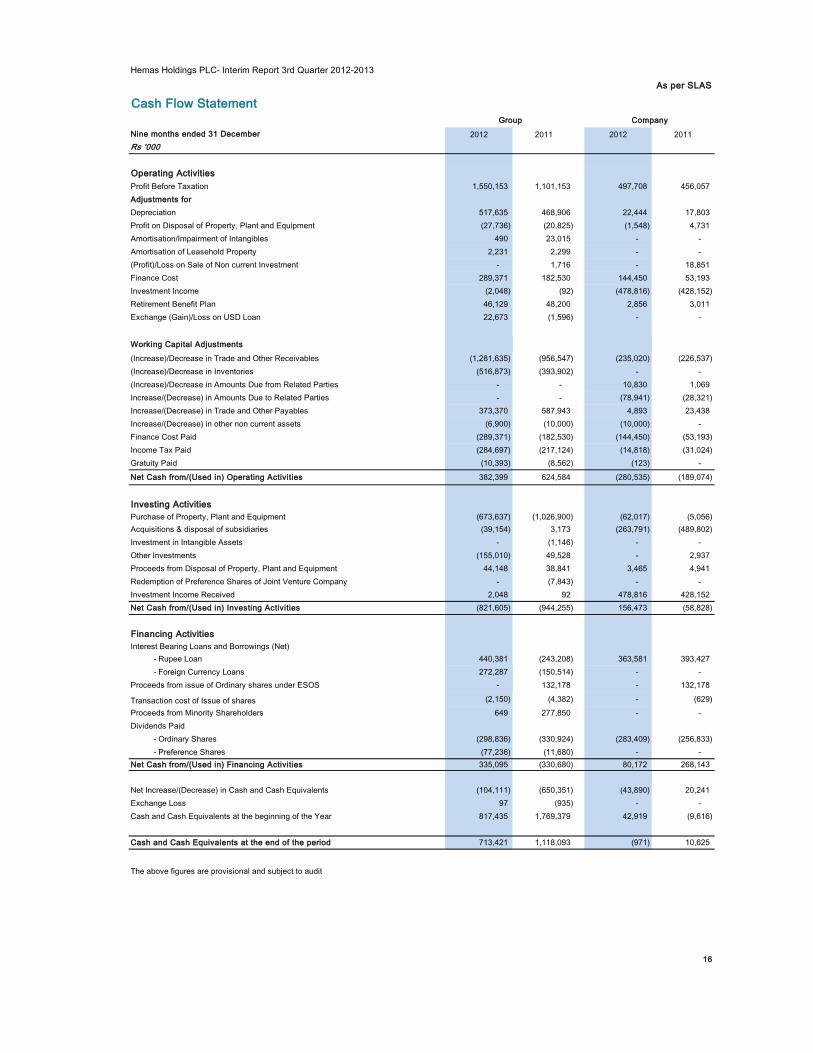
As per SLAS
Cash Flow Statement
Nine months ended 31 December 2012 2011 2012 2011
Rs '000
Operating Activities
Profit Before Taxation 1,550,153 1,101,153 497,708 456,057
Adjustments for
Depreciation 517,635 468,906 22,444 17,803
Profit on Disposal of Property, Plant and Equipment (27,736) (20,825) (1,548) 4,731
Amortisation/Impairment of Intangibles 490 23,015 - -
Amortisation of Leasehold Property 2,231 2,299 - -
(Profit)/Loss on Sale of Non current Investment - 1,716 - 18,851
Finance Cost 289,371 182,530 144,450 53,193
Investment Income (2,048) (92) (478,816) (428,152)
Retirement Benefit Plan 46,129 48,200 2,856 3,011
Exchange (Gain)/Loss on USD Loan 22,673 (1,596) - -
Working Capital Adjustments
(Increase)/Decrease in Trade and Other Receivables (1,281,635) (956,547) (235,020) (226,537)
(Increase)/Decrease in Inventories (516,873) (393,902) - -
(Increase)/Decrease in Amounts Due from Related Parties - - 10,830 1,069
Increase/(Decrease) in Amounts Due to Related Parties - - (78,941) (28,321)
Increase/(Decrease) in Trade and Other Payables 373,370 587,943 4,893 23,438
Increase/(Decrease) in other non current assets (6,900) (10,000) (10,000) -
Finance Cost Paid (289,371) (182,530) (144,450) (53,193)
Income Tax Paid (284,697) (217,124) (14,818) (31,024)
Gratuity Paid (10,393) (8,562) (123) -
Net Cash from/(Used in) Operating Activities 382,399 624,584 (280,535) (189,074)
Investing Activities
Purchase of Property, Plant and Equipment (673,637) (1,026,900) (62,017) (5,056)
Acquisitions & disposal of subsidiaries (39,154) 3,173 (263,791) (489,802)
Investment in Intangible Assets - (1,146) - -
Other Investments (155,010) 49,528 - 2,937
Proceeds from Disposal of Property, Plant and Equipment 44,148 38,841 3,465 4,941
Redemption of Preference Shares of Joint Venture Company - (7,843) - -
Investment Income Received 2,048 92 478,816 428,152
Net Cash from/(Used in) Investing Activities (821,605) (944,255) 156,473 (58,828)
Financing Activities
Interest Bearing Loans and Borrowings (Net)
- Rupee Loan 440,381 (243,208) 363,581 393,427
- Foreign Currency Loans 272,287 (150,514) - -
Proceeds from issue of Ordinary shares under ESOS - 132,178 - 132,178
Transaction cost of Issue of shares (2,150) (4,382) - (629)
Proceeds from Minority Shareholders 649 277,850 - -
Dividends Paid
- Ordinary Shares (298,836) (330,924) (283,409) (256,833)
- Preference Shares (77,236) (11,680) - -
Net Cash from/(Used in) Financing Activities 335,095 (330,680) 80,172 268,143
Net Increase/(Decrease) in Cash and Cash Equivalents (104,111) (650,351) (43,890) 20,241
Exchange Loss 97 (935) - -
Cash and Cash Equivalents at the beginning of the Year 817,435 1,769,379 42,919 (9,616)
Cash and Cash Equivalents at the end of the period 713,421 1,118,093 (971) 10,625
The above figures are provisional and subject to audit
16
Group Company
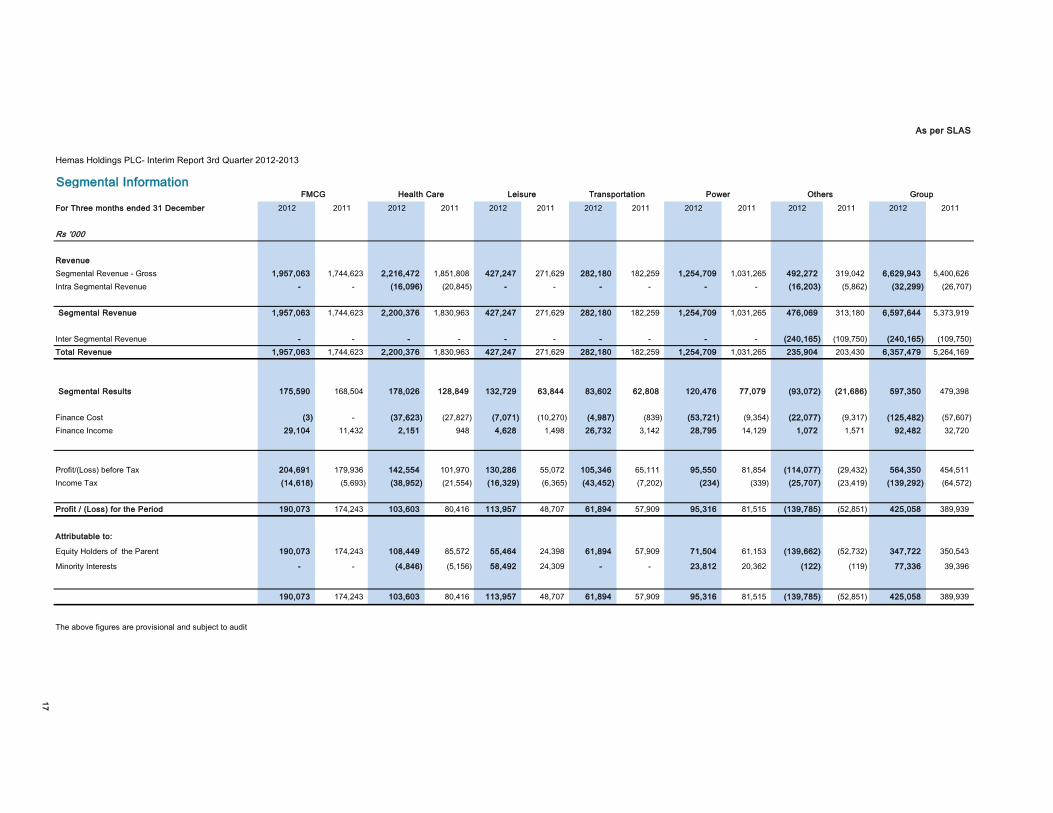
Hemas Holdings PLC- Interim Report 3rd Quarter 2012-2013
Segmental Information
For Three months ended 31 December 2012 2011 2012 2011 2012 2011 2012 2011 2012 2011 2012 2011 2012 2011
Rs '000
Revenue
Segmental Revenue - Gross 1,957,063 1,744,623 2,216,472 1,851,808 427,247 271,629 282,180 182,259 1,254,709 1,031,265 492,272 319,042 6,629,943 5,400,626
Intra Segmental Revenue - - (16,096) (20,845) - - - - - - (16,203) (5,862) (32,299) (26,707)
Segmental Revenue 1,957,063 1,744,623 2,200,376 1,830,963 427,247 271,629 282,180 182,259 1,254,709 1,031,265 476,069 313,180 6,597,644 5,373,919
Inter Segmental Revenue - - - - - - - - - - (240,165) (109,750) (240,165) (109,750)
Total Revenue 1,957,063 1,744,623 2,200,376 1,830,963 427,247 271,629 282,180 182,259 1,254,709 1,031,265 235,904 203,430 6,357,479 5,264,169
Segmental Results 175,590 168,504 178,026 128,849 132,729 63,844 83,602 62,808 120,476 77,079 (93,072) (21,686) 597,350 479,398
Finance Cost (3) - (37,623) (27,827) (7,071) (10,270) (4,987) (839) (53,721) (9,354) (22,077) (9,317) (125,482) (57,607)
Finance Income 29,104 11,432 2,151 948 4,628 1,498 26,732 3,142 28,795 14,129 1,072 1,571 92,482 32,720
Profit/(Loss) before Tax 204,691 179,936 142,554 101,970 130,286 55,072 105,346 65,111 95,550 81,854 (114,077) (29,432) 564,350 454,511
Income Tax (14,618) (5,693) (38,952) (21,554) (16,329) (6,365) (43,452) (7,202) (234) (339) (25,707) (23,419) (139,292) (64,572)
Profit / (Loss) for the Period 190,073 174,243 103,603 80,416 113,957 48,707 61,894 57,909 95,316 81,515 (139,785) (52,851) 425,058 389,939
Attributable to:
Equity Holders of the Parent 190,073 174,243 108,449 85,572 55,464 24,398 61,894 57,909 71,504 61,153 (139,662) (52,732) 347,722 350,543
Minority Interests - - (4,846) (5,156) 58,492 24,309 - - 23,812 20,362 (122) (119) 77,336 39,396
190,073 174,243 103,603 80,416 113,957 48,707 61,894 57,909 95,316 81,515 (139,785) (52,851) 425,058 389,939
The above figures are provisional and subject to audit
17
As per SLAS
FMCG Health Care Leisure Transportation Power Others Group
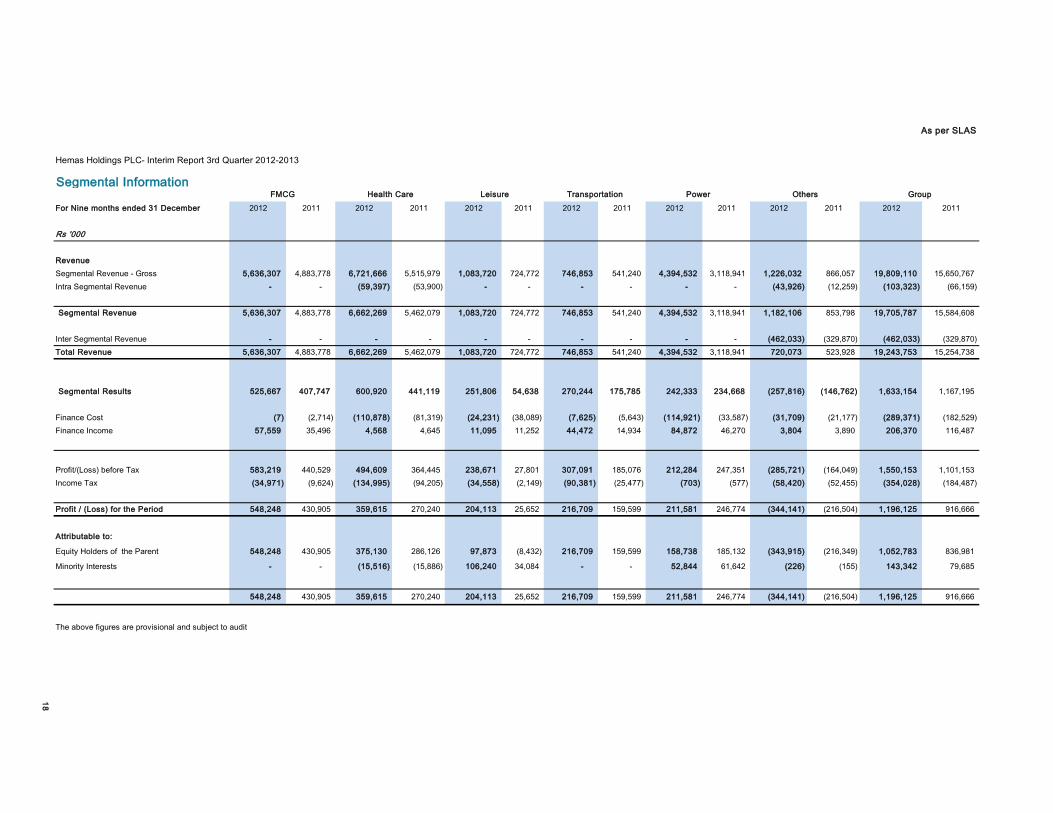
Hemas Holdings PLC- Interim Report 3rd Quarter 2012-2013
Segmental Information
For Nine months ended 31 December 2012 2011 2012 2011 2012 2011 2012 2011 2012 2011 2012 2011 2012 2011
Rs '000
Revenue
Segmental Revenue - Gross 5,636,307 4,883,778 6,721,666 5,515,979 1,083,720 724,772 746,853 541,240 4,394,532 3,118,941 1,226,032 866,057 19,809,110 15,650,767
Intra Segmental Revenue - - (59,397) (53,900) - - - - - - (43,926) (12,259) (103,323) (66,159)
Segmental Revenue 5,636,307 4,883,778 6,662,269 5,462,079 1,083,720 724,772 746,853 541,240 4,394,532 3,118,941 1,182,106 853,798 19,705,787 15,584,608
Inter Segmental Revenue - - - - - - - - - - (462,033) (329,870) (462,033) (329,870)
Total Revenue 5,636,307 4,883,778 6,662,269 5,462,079 1,083,720 724,772 746,853 541,240 4,394,532 3,118,941 720,073 523,928 19,243,753 15,254,738
Segmental Results 525,667 407,747 600,920 441,119 251,806 54,638 270,244 175,785 242,333 234,668 (257,816) (146,762) 1,633,154 1,167,195
Finance Cost (7) (2,714) (110,878) (81,319) (24,231) (38,089) (7,625) (5,643) (114,921) (33,587) (31,709) (21,177) (289,371) (182,529)
Finance Income 57,559 35,496 4,568 4,645 11,095 11,252 44,472 14,934 84,872 46,270 3,804 3,890 206,370 116,487
Profit/(Loss) before Tax 583,219 440,529 494,609 364,445 238,671 27,801 307,091 185,076 212,284 247,351 (285,721) (164,049) 1,550,153 1,101,153
Income Tax (34,971) (9,624) (134,995) (94,205) (34,558) (2,149) (90,381) (25,477) (703) (577) (58,420) (52,455) (354,028) (184,487)
Profit / (Loss) for the Period 548,248 430,905 359,615 270,240 204,113 25,652 216,709 159,599 211,581 246,774 (344,141) (216,504) 1,196,125 916,666
Attributable to:
Equity Holders of the Parent 548,248 430,905 375,130 286,126 97,873 (8,432) 216,709 159,599 158,738 185,132 (343,915) (216,349) 1,052,783 836,981
Minority Interests - - (15,516) (15,886) 106,240 34,084 - - 52,844 61,642 (226) (155) 143,342 79,685
548,248 430,905 359,615 270,240 204,113 25,652 216,709 159,599 211,581 246,774 (344,141) (216,504) 1,196,125 916,666
The above figures are provisional and subject to audit
18
As per SLAS
FMCG Health Care Leisure Transportation Power Others Group
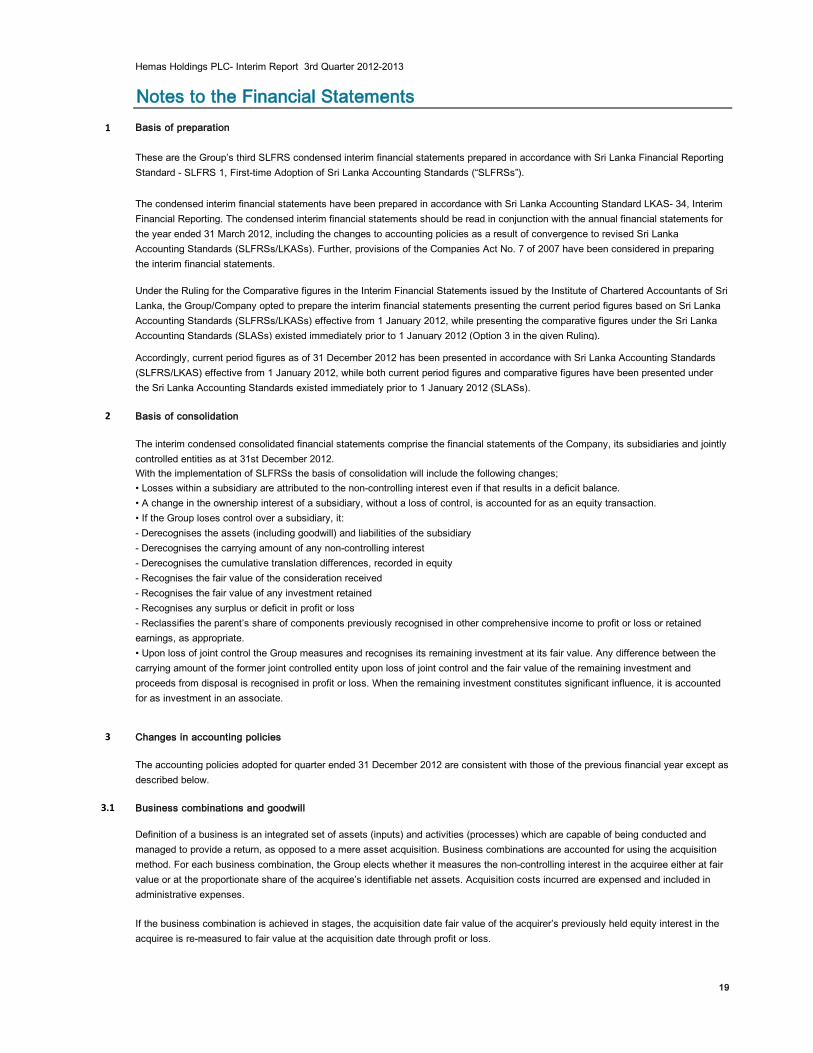
Hemas Holdings PLC- Interim Report 3rd Quarter 2012-2013
Notes to the Financial Statements
1 Basis of preparation
2
3
3.1
19
The accounting policies adopted for quarter ended 31 December 2012 are consistent with those of the previous financial year except as
described below.
Business combinations and goodwill
Definition of a business is an integrated set of assets (inputs) and activities (processes) which are capable of being conducted and
managed to provide a return, as opposed to a mere asset acquisition. Business combinations are accounted for using the acquisition
method. For each business combination, the Group elects whether it measures the non-controlling interest in the acquiree either at fair
value or at the proportionate share of the acquiree’s identifiable net assets. Acquisition costs incurred are expensed and included in
administrative expenses.
If the business combination is achieved in stages, the acquisition date fair value of the acquirer’s previously held equity interest in the
acquiree is re-measured to fair value at the acquisition date through profit or loss.
Basis of consolidation
The interim condensed consolidated financial statements comprise the financial statements of the Company, its subsidiaries and jointly
controlled entities as at 31st December 2012.
With the implementation of SLFRSs the basis of consolidation will include the following changes;
• Losses within a subsidiary are attributed to the non-controlling interest even if that results in a deficit balance.
• A change in the ownership interest of a subsidiary, without a loss of control, is accounted for as an equity transaction.
• If the Group loses control over a subsidiary, it:
- Derecognises the assets (including goodwill) and liabilities of the subsidiary
- Derecognises the carrying amount of any non-controlling interest
- Derecognises the cumulative translation differences, recorded in equity
- Recognises the fair value of the consideration received
- Recognises the fair value of any investment retained
- Recognises any surplus or deficit in profit or loss
- Reclassifies the parent’s share of components previously recognised in other comprehensive income to profit or loss or retained
earnings, as appropriate.
• Upon loss of joint control the Group measures and recognises its remaining investment at its fair value. Any difference between the
carrying amount of the former joint controlled entity upon loss of joint control and the fair value of the remaining investment and
proceeds from disposal is recognised in profit or loss. When the remaining investment constitutes significant influence, it is accounted
for as investment in an associate.
Changes in accounting policies
These are the Group’s third SLFRS condensed interim financial statements prepared in accordance with Sri Lanka Financial Reporting
Standard - SLFRS 1, First-time Adoption of Sri Lanka Accounting Standards (“SLFRSs”).
The condensed interim financial statements have been prepared in accordance with Sri Lanka Accounting Standard LKAS- 34, Interim
Financial Reporting. The condensed interim financial statements should be read in conjunction with the annual financial statements for
the year ended 31 March 2012, including the changes to accounting policies as a result of convergence to revised Sri Lanka
Accounting Standards (SLFRSs/LKASs). Further, provisions of the Companies Act No. 7 of 2007 have been considered in preparing
the interim financial statements.
Under the Ruling for the Comparative figures in the Interim Financial Statements issued by the Institute of Chartered Accountants of Sri
Lanka, the Group/Company opted to prepare the interim financial statements presenting the current period figures based on Sri Lanka
Accounting Standards (SLFRSs/LKASs) effective from 1 January 2012, while presenting the comparative figures under the Sri Lanka
Accounting Standards (SLASs) existed immediately prior to 1 January 2012 (Option 3 in the given Ruling).
Accordingly, current period figures as of 31 December 2012 has been presented in accordance with Sri Lanka Accounting Standards
(SLFRS/LKAS) effective from 1 January 2012, while both current period figures and comparative figures have been presented under
the Sri Lanka Accounting Standards existed immediately prior to 1 January 2012 (SLASs).
Hemas Holdings PLC- Interim Report 3rd Quarter 2012-2013
Notes to the Financial Statements
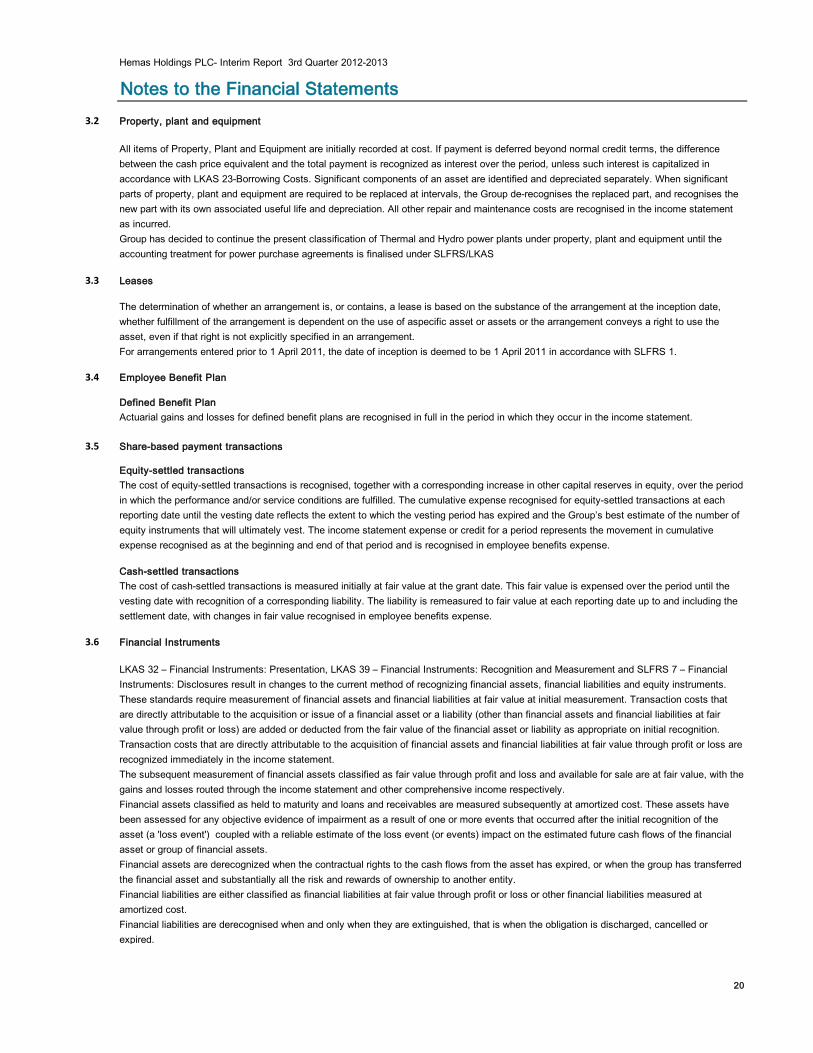
3.2
3.3
3.4
3.5
3.6
20
Defined Benefit Plan
Actuarial gains and losses for defined benefit plans are recognised in full in the period in which they occur in the income statement.
Share-based payment transactions
Equity-settled transactions
The cost of equity-settled transactions is recognised, together with a corresponding increase in other capital reserves in equity, over the period
in which the performance and/or service conditions are fulfilled. The cumulative expense recognised for equity-settled transactions at each
reporting date until the vesting date reflects the extent to which the vesting period has expired and the Group’s best estimate of the number of
equity instruments that will ultimately vest. The income statement expense or credit for a period represents the movement in cumulative
expense recognised as at the beginning and end of that period and is recognised in employee benefits expense.
Cash-settled transactions
The cost of cash-settled transactions is measured initially at fair value at the grant date. This fair value is expensed over the period until the
vesting date with recognition of a corresponding liability. The liability is remeasured to fair value at each reporting date up to and including the
settlement date, with changes in fair value recognised in employee benefits expense.
Financial Instruments
LKAS 32 – Financial Instruments: Presentation, LKAS 39 – Financial Instruments: Recognition and Measurement and SLFRS 7 – Financial
Instruments: Disclosures result in changes to the current method of recognizing financial assets, financial liabilities and equity instruments.
These standards require measurement of financial assets and financial liabilities at fair value at initial measurement. Transaction costs that
are directly attributable to the acquisition or issue of a financial asset or a liability (other than financial assets and financial liabilities at fair
value through profit or loss) are added or deducted from the fair value of the financial asset or liability as appropriate on initial recognition.
Transaction costs that are directly attributable to the acquisition of financial assets and financial liabilities at fair value through profit or loss are
recognized immediately in the income statement.
The subsequent measurement of financial assets classified as fair value through profit and loss and available for sale are at fair value, with the
gains and losses routed through the income statement and other comprehensive income respectively.
Financial assets classified as held to maturity and loans and receivables are measured subsequently at amortized cost. These assets have
been assessed for any objective evidence of impairment as a result of one or more events that occurred after the initial recognition of the
asset (a 'loss event') coupled with a reliable estimate of the loss event (or events) impact on the estimated future cash flows of the financial
asset or group of financial assets.
Financial assets are derecognized when the contractual rights to the cash flows from the asset has expired, or when the group has transferred
the financial asset and substantially all the risk and rewards of ownership to another entity.
Financial liabilities are either classified as financial liabilities at fair value through profit or loss or other financial liabilities measured at
amortized cost.
Financial liabilities are derecognised when and only when they are extinguished, that is when the obligation is discharged, cancelled or
expired.
Employee Benefit Plan
Property, plant and equipment
All items of Property, Plant and Equipment are initially recorded at cost. If payment is deferred beyond normal credit terms, the difference
between the cash price equivalent and the total payment is recognized as interest over the period, unless such interest is capitalized in
accordance with LKAS 23-Borrowing Costs. Significant components of an asset are identified and depreciated separately. When significant
parts of property, plant and equipment are required to be replaced at intervals, the Group de-recognises the replaced part, and recognises the
new part with its own associated useful life and depreciation. All other repair and maintenance costs are recognised in the income statement
as incurred.
Group has decided to continue the present classification of Thermal and Hydro power plants under property, plant and equipment until the
accounting treatment for power purchase agreements is finalised under SLFRS/LKAS
Leases
The determination of whether an arrangement is, or contains, a lease is based on the substance of the arrangement at the inception date,
whether fulfillment of the arrangement is dependent on the use of aspecific asset or assets or the arrangement conveys a right to use the
asset, even if that right is not explicitly specified in an arrangement.
For arrangements entered prior to 1 April 2011, the date of inception is deemed to be 1 April 2011 in accordance with SLFRS 1.
Hemas Holdings PLC- Interim Report 3rd Quarter 2012-2013
Notes to the Financial Statements
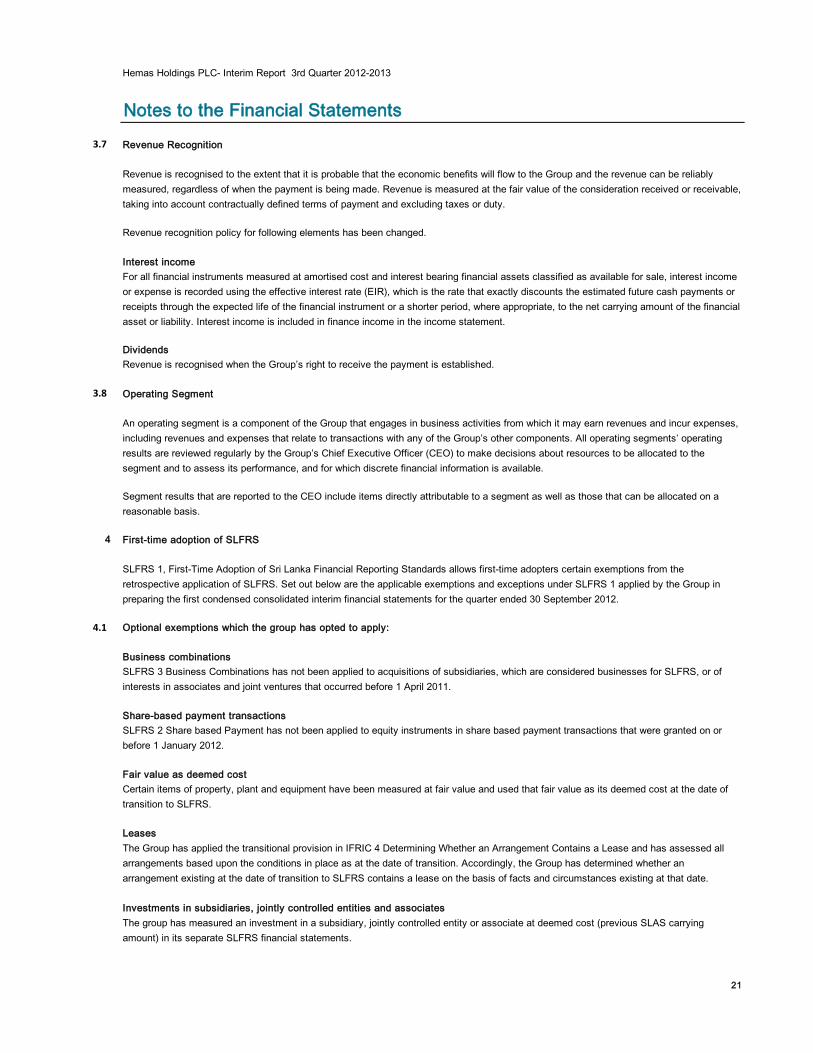
3.7
3.8
4
4.1
21
Optional exemptions which the group has opted to apply:
Business combinations
SLFRS 3 Business Combinations has not been applied to acquisitions of subsidiaries, which are considered businesses for SLFRS, or of
interests in associates and joint ventures that occurred before 1 April 2011.
Share-based payment transactions
SLFRS 2 Share based Payment has not been applied to equity instruments in share based payment transactions that were granted on or
before 1 January 2012.
Fair value as deemed cost
Certain items of property, plant and equipment have been measured at fair value and used that fair value as its deemed cost at the date of
transition to SLFRS.
Leases
The Group has applied the transitional provision in IFRIC 4 Determining Whether an Arrangement Contains a Lease and has assessed all
arrangements based upon the conditions in place as at the date of transition. Accordingly, the Group has determined whether an
arrangement existing at the date of transition to SLFRS contains a lease on the basis of facts and circumstances existing at that date.
Investments in subsidiaries, jointly controlled entities and associates
The group has measured an investment in a subsidiary, jointly controlled entity or associate at deemed cost (previous SLAS carrying
amount) in its separate SLFRS financial statements.
SLFRS 1, First-Time Adoption of Sri Lanka Financial Reporting Standards allows first-time adopters certain exemptions from the
retrospective application of SLFRS. Set out below are the applicable exemptions and exceptions under SLFRS 1 applied by the Group in
preparing the first condensed consolidated interim financial statements for the quarter ended 30 September 2012.
Revenue Recognition
Revenue is recognised to the extent that it is probable that the economic benefits will flow to the Group and the revenue can be reliably
measured, regardless of when the payment is being made. Revenue is measured at the fair value of the consideration received or receivable,
taking into account contractually defined terms of payment and excluding taxes or duty.
Revenue recognition policy for following elements has been changed.
Interest income
For all financial instruments measured at amortised cost and interest bearing financial assets classified as available for sale, interest income
or expense is recorded using the effective interest rate (EIR), which is the rate that exactly discounts the estimated future cash payments or
receipts through the expected life of the financial instrument or a shorter period, where appropriate, to the net carrying amount of the financial
asset or liability. Interest income is included in finance income in the income statement.
Dividends
Revenue is recognised when the Group’s right to receive the payment is established.
Operating Segment
An operating segment is a component of the Group that engages in business activities from which it may earn revenues and incur expenses,
including revenues and expenses that relate to transactions with any of the Group’s other components. All operating segments’ operating
results are reviewed regularly by the Group’s Chief Executive Officer (CEO) to make decisions about resources to be allocated to the
segment and to assess its performance, and for which discrete financial information is available.
Segment results that are reported to the CEO include items directly attributable to a segment as well as those that can be allocated on a
reasonable basis.
First-time adoption of SLFRS
Hemas Holdings PLC- Interim Report 3rd Quarter 2012-2013
Notes to the Financial Statements
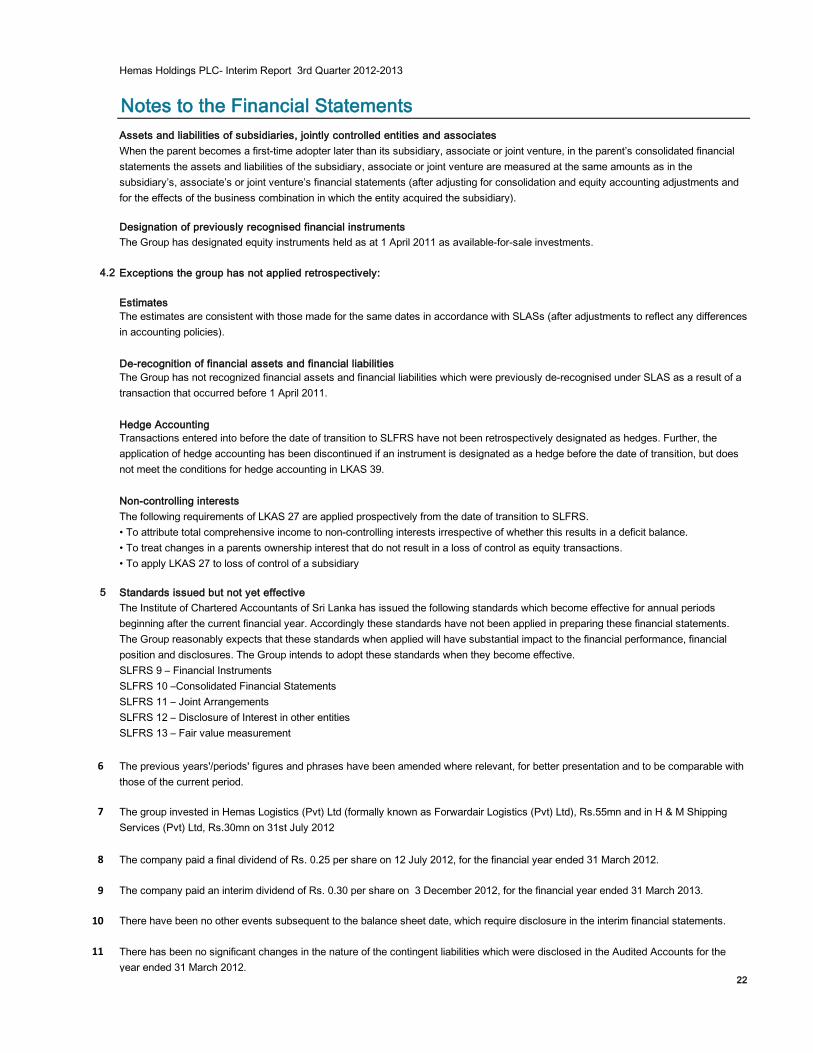
4.2
5
6
7
8
9
10 There have been no other events subsequent to the balance sheet date, which require disclosure in the interim financial statements.
11
22
There has been no significant changes in the nature of the contingent liabilities which were disclosed in the Audited Accounts for the
year ended 31 March 2012.
Standards issued but not yet effective
The Institute of Chartered Accountants of Sri Lanka has issued the following standards which become effective for annual periods
beginning after the current financial year. Accordingly these standards have not been applied in preparing these financial statements.
The Group reasonably expects that these standards when applied will have substantial impact to the financial performance, financial
position and disclosures. The Group intends to adopt these standards when they become effective.
SLFRS 9 – Financial Instruments
SLFRS 10 –Consolidated Financial Statements
SLFRS 11 – Joint Arrangements
SLFRS 12 – Disclosure of Interest in other entities
SLFRS 13 – Fair value measurement
The previous years'/periods' figures and phrases have been amended where relevant, for better presentation and to be comparable with
those of the current period.
The company paid a final dividend of Rs. 0.25 per share on 12 July 2012, for the financial year ended 31 March 2012.
The group invested in Hemas Logistics (Pvt) Ltd (formally known as Forwardair Logistics (Pvt) Ltd), Rs.55mn and in H & M Shipping
Services (Pvt) Ltd, Rs.30mn on 31st July 2012
The company paid an interim dividend of Rs. 0.30 per share on 3 December 2012, for the financial year ended 31 March 2013.
The following requirements of LKAS 27 are applied prospectively from the date of transition to SLFRS.
• To attribute total comprehensive income to non-controlling interests irrespective of whether this results in a deficit balance.
• To treat changes in a parents ownership interest that do not result in a loss of control as equity transactions.
• To apply LKAS 27 to loss of control of a subsidiary
Assets and liabilities of subsidiaries, jointly controlled entities and associates
When the parent becomes a first-time adopter later than its subsidiary, associate or joint venture, in the parent’s consolidated financial
statements the assets and liabilities of the subsidiary, associate or joint venture are measured at the same amounts as in the
subsidiary’s, associate’s or joint venture’s financial statements (after adjusting for consolidation and equity accounting adjustments and
for the effects of the business combination in which the entity acquired the subsidiary).
Designation of previously recognised financial instruments
The Group has designated equity instruments held as at 1 April 2011 as available-for-sale investments.
Exceptions the group has not applied retrospectively:
Estimates
The estimates are consistent with those made for the same dates in accordance with SLASs (after adjustments to reflect any differences
in accounting policies).
De-recognition of financial assets and financial liabilities
The Group has not recognized financial assets and financial liabilities which were previously de-recognised under SLAS as a result of a
transaction that occurred before 1 April 2011.
Hedge Accounting
Transactions entered into before the date of transition to SLFRS have not been retrospectively designated as hedges. Further, the
application of hedge accounting has been discontinued if an instrument is designated as a hedge before the date of transition, but does
not meet the conditions for hedge accounting in LKAS 39.
Non-controlling interests
Hemas Holdings PLC- Interim Report 3rd Quarter 2012-2013
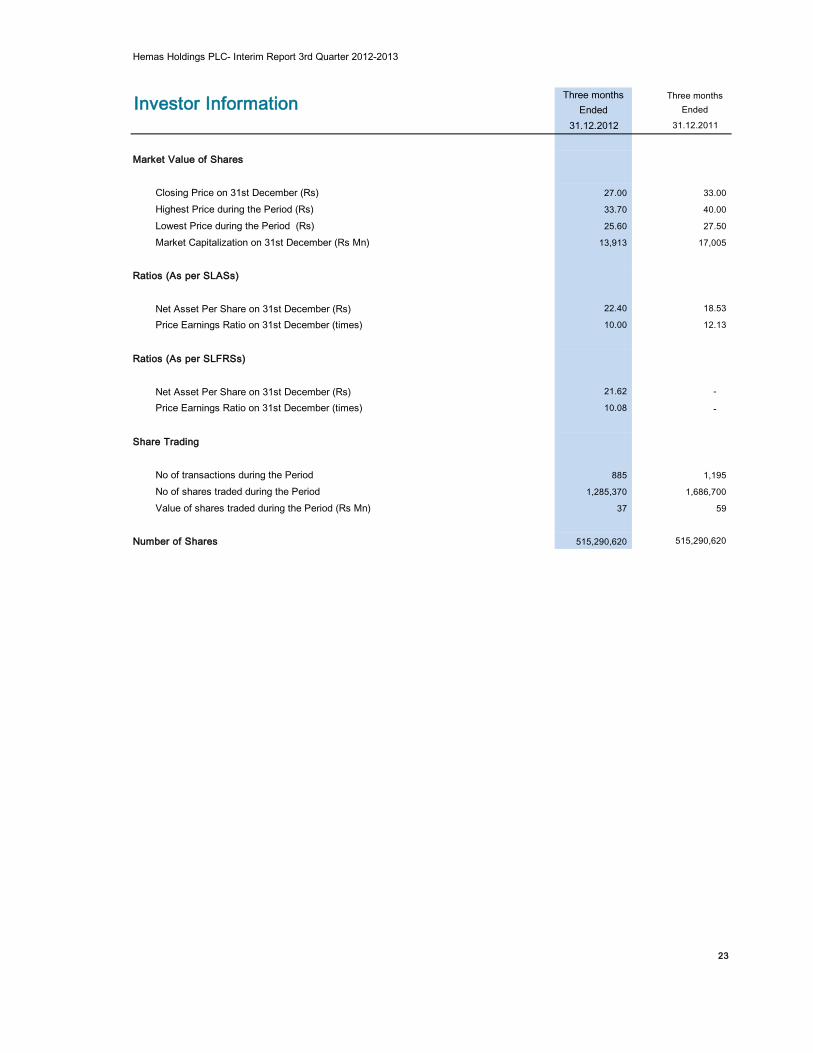
Investor InformationThree months
Ended
Three months
Ended
31.12.2012 31.12.2011
Market Value of Shares
Closing Price on 31st December (Rs) 27.00 33.00
Highest Price during the Period (Rs) 33.70 40.00
Lowest Price during the Period (Rs) 25.60 27.50
Market Capitalization on 31st December (Rs Mn) 13,913 17,005
Ratios (As per SLASs)
Net Asset Per Share on 31st December (Rs) 22.40 18.53
Price Earnings Ratio on 31st December (times) 10.00 12.13
Ratios (As per SLFRSs)
Net Asset Per Share on 31st December (Rs) 21.62 -
Price Earnings Ratio on 31st December (times) 10.08 -
Share Trading
No of transactions during the Period 885 1,195
No of shares traded during the Period 1,285,370 1,686,700
Value of shares traded during the Period (Rs Mn) 37 59
Number of Shares 515,290,620 515,290,620
23
Hemas Holdings PLC- Interim Report 3rd Quarter 2012-2013
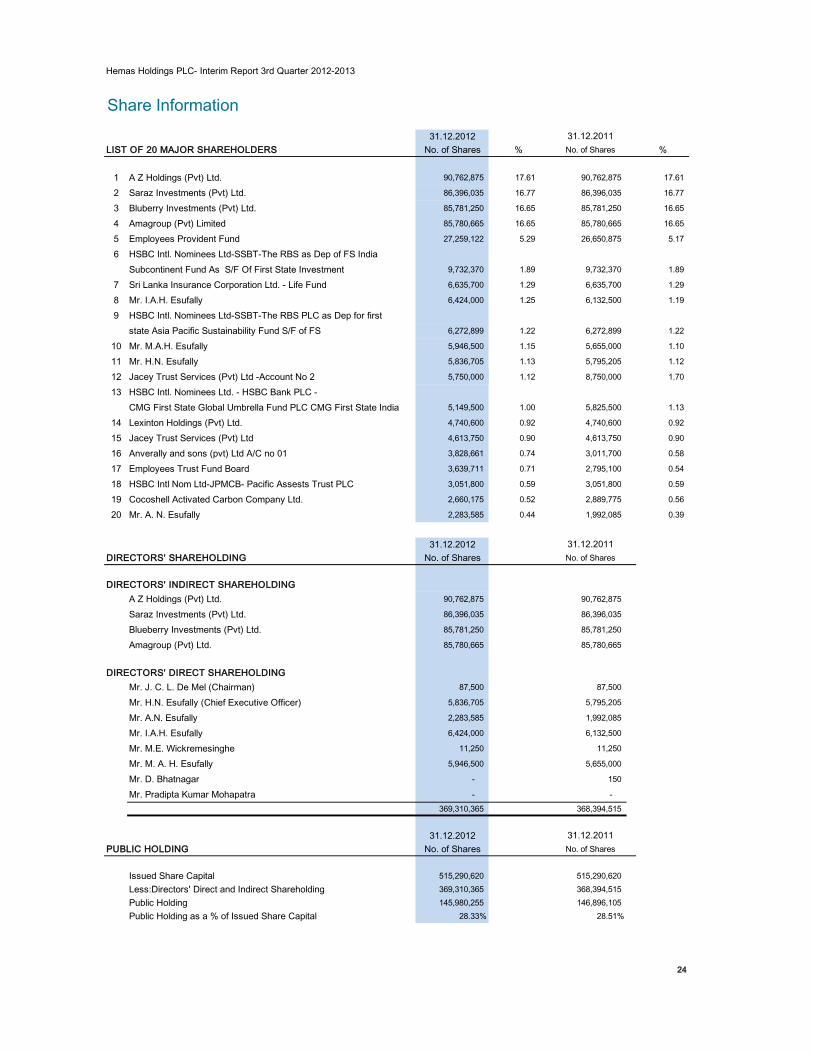
Share Information
31.12.2012 31.12.2011
LIST OF 20 MAJOR SHAREHOLDERS No. of Shares % No. of Shares %
1 A Z Holdings (Pvt) Ltd. 90,762,875 17.61 90,762,875 17.61
2 Saraz Investments (Pvt) Ltd. 86,396,035 16.77 86,396,035 16.77
3 Bluberry Investments (Pvt) Ltd. 85,781,250 16.65 85,781,250 16.65
4 Amagroup (Pvt) Limited 85,780,665 16.65 85,780,665 16.65
5 Employees Provident Fund 27,259,122 5.29 26,650,875 5.17
6 HSBC Intl. Nominees Ltd-SSBT-The RBS as Dep of FS India
Subcontinent Fund As S/F Of First State Investment 9,732,370 1.89 9,732,370 1.89
7 Sri Lanka Insurance Corporation Ltd. - Life Fund 6,635,700 1.29 6,635,700 1.29
8 Mr. I.A.H. Esufally 6,424,000 1.25 6,132,500 1.19
9 HSBC Intl. Nominees Ltd-SSBT-The RBS PLC as Dep for first
state Asia Pacific Sustainability Fund S/F of FS 6,272,899 1.22 6,272,899 1.22
10 Mr. M.A.H. Esufally 5,946,500 1.15 5,655,000 1.10
11 Mr. H.N. Esufally 5,836,705 1.13 5,795,205 1.12
12 Jacey Trust Services (Pvt) Ltd -Account No 2 5,750,000 1.12 8,750,000 1.70
13 HSBC Intl. Nominees Ltd. - HSBC Bank PLC -
CMG First State Global Umbrella Fund PLC CMG First State India 5,149,500 1.00 5,825,500 1.13
14 Lexinton Holdings (Pvt) Ltd. 4,740,600 0.92 4,740,600 0.92
15 Jacey Trust Services (Pvt) Ltd 4,613,750 0.90 4,613,750 0.90
16 Anverally and sons (pvt) Ltd A/C no 01 3,828,661 0.74 3,011,700 0.58
17 Employees Trust Fund Board 3,639,711 0.71 2,795,100 0.54
18 HSBC Intl Nom Ltd-JPMCB- Pacific Assests Trust PLC 3,051,800 0.59 3,051,800 0.59
19 Cocoshell Activated Carbon Company Ltd. 2,660,175 0.52 2,889,775 0.56
20 Mr. A. N. Esufally 2,283,585 0.44 1,992,085 0.39
31.12.2012 31.12.2011
DIRECTORS' SHAREHOLDING No. of Shares No. of Shares
DIRECTORS' INDIRECT SHAREHOLDING
A Z Holdings (Pvt) Ltd. 90,762,875 90,762,875
Saraz Investments (Pvt) Ltd. 86,396,035 86,396,035
Blueberry Investments (Pvt) Ltd. 85,781,250 85,781,250
Amagroup (Pvt) Ltd. 85,780,665 85,780,665
DIRECTORS' DIRECT SHAREHOLDING
Mr. J. C. L. De Mel (Chairman) 87,500 87,500
Mr. H.N. Esufally (Chief Executive Officer) 5,836,705 5,795,205
Mr. A.N. Esufally 2,283,585 1,992,085
Mr. I.A.H. Esufally 6,424,000 6,132,500
Mr. M.E. Wickremesinghe 11,250 11,250
Mr. M. A. H. Esufally 5,946,500 5,655,000
Mr. D. Bhatnagar - 150
Mr. Pradipta Kumar Mohapatra - -
369,310,365 368,394,515
31.12.2012 31.12.2011
PUBLIC HOLDING No. of Shares No. of Shares
Issued Share Capital 515,290,620 515,290,620
Less:Directors' Direct and Indirect Shareholding 369,310,365 368,394,515
Public Holding 145,980,255 146,896,105
Public Holding as a % of Issued Share Capital 28.33% 28.51%
24
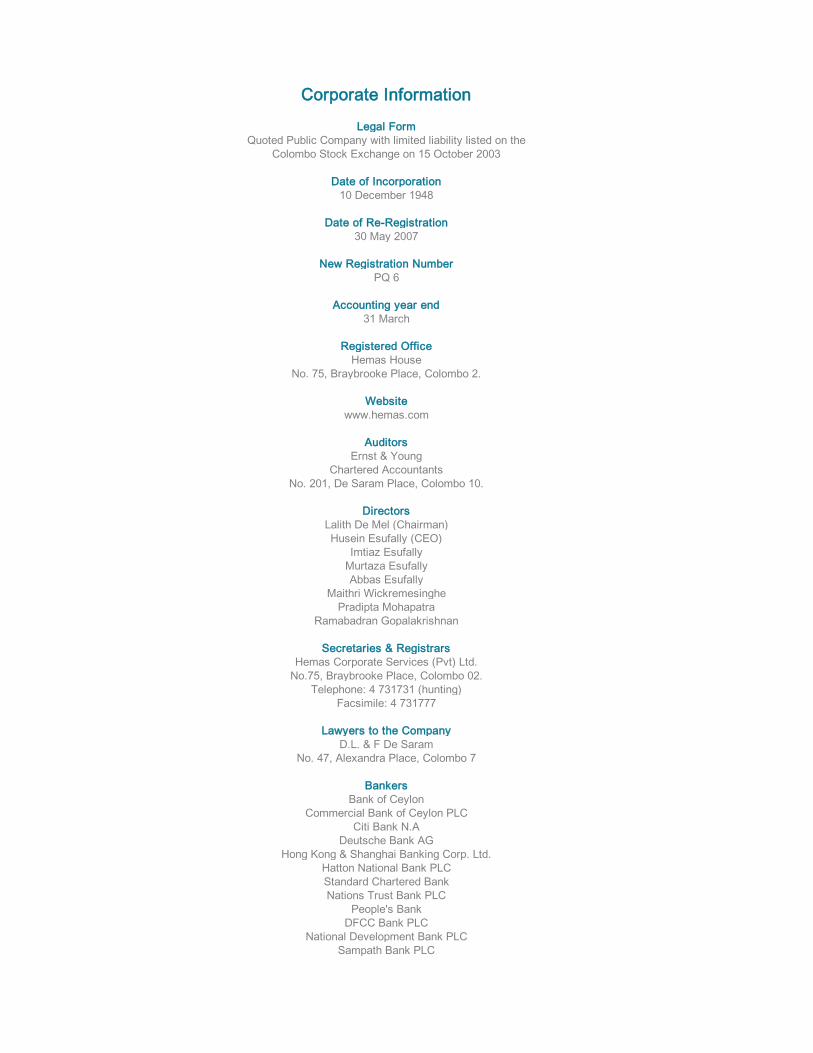
Corporate Information
Legal Form
Quoted Public Company with limited liability listed on the
Colombo Stock Exchange on 15 October 2003
Date of Incorporation
10 December 1948
Date of Re-Registration
30 May 2007
New Registration Number
PQ 6
Accounting year end
31 March
Registered Office
Hemas House
No. 75, Braybrooke Place, Colombo 2.
Website
www.hemas.com
Auditors
Ernst & Young
Chartered Accountants
No. 201, De Saram Place, Colombo 10.
Directors
Lalith De Mel (Chairman)
Husein Esufally (CEO)
Imtiaz Esufally
Murtaza Esufally
Abbas Esufally
Maithri Wickremesinghe
Pradipta Mohapatra
Ramabadran Gopalakrishnan
Secretaries & Registrars
Hemas Corporate Services (Pvt) Ltd.
No.75, Braybrooke Place, Colombo 02.
Telephone: 4 731731 (hunting)
Facsimile: 4 731777
Lawyers to the Company
D.L. & F De Saram
No. 47, Alexandra Place, Colombo 7
Bankers
Bank of Ceylon
Commercial Bank of Ceylon PLC
Citi Bank N.A
Deutsche Bank AG
Hong Kong & Shanghai Banking Corp. Ltd.
Hatton National Bank PLC
Standard Chartered Bank
Nations Trust Bank PLC
People's Bank
DFCC Bank PLC
National Development Bank PLC
Sampath Bank PLC