hazard and climate vulnerability assessment - … and climate vulnerability assessment prepared by:...
TRANSCRIPT

Hazard and Climate
March 2014
Vulnerability Assessment

www.livabilitylane.org/toolkit
For additional tools and resources related to this andother topics and projects supported by the Lane LivabilityConsortium, visit the Livability Lane Toolkit webpage:

HazardandClimateVulnerabilityAssessment
Prepared by:Oregon Partnership for Disaster Resilience
A Program of the Community Service Center
Prepared for: The City of Eugene Office of Sustainability
The City of Springfield


Acknowledgments This report, funded by the City of Eugene, the Federal Emergency Management Agency Hazard Mitigation Grant Program and the U.S. Department of Housing and Urban Development Office of Sustainable Housing and Communities Grant Program, presents a summary for each of the sectors evaluated. The project would not have been possible without the vision and leadership of Matt McRae and Babe O’Sullivan at the City of Eugene and Ken Vogeney with the City of Springfield. Results of this project will inform the 2015 update to the Eugene/Springfield Natural Hazard Mitigation Plan in addition to other local planning activities. This project utilized additional support provided by the University of Oregon’s Community Service Center.
ProjectSteeringCommittee: Matt McRae, City of Eugene
Babe O’Sullivan, City of Eugene
Ken Vogeney, City of Springfield
Felicity Fahy, Eugene Water and Electric Board
Josh Foster, Oregon Climate Change Research Institute
Steve Adams, Institute for Sustainable Communities
Jeff Weber, Oregon Department of Land Conservation and Development
Myrnie Daut, City of Eugene
Stacy Burr, City of Eugene
Dr. Patrick Luedtke, Lane County Public Health
Forrest Chambers, City of Eugene
ProjectManager: Matt McRae, City of Eugene
CommunityServiceCenterStaff: Josh Bruce, Interim Director, Oregon Partnership for Disaster Resilience
Mike Howard, Program Specialist, Oregon Partnership for Disaster Resilience
Casey Hagerman, Research Associate
Nick Metzler, Research Associate
Adams “AJ” Bernhardt, Student Intern
HazardandClimateVulnerabilityAssessmentParticipants:The project team would like to thank the following people who shared their expertise in their sector to support the development of the Eugene Springfield Hazard and Climate Vulnerability Assessment:
Name Organization Title
Communications Sector
Josh Halbrook Comcast Manager local/federal compliance
Tim Reed Comcast CT 5 Fiber/Line Technician
Patricia Scarci City of Eugene IT Technical Operations Manager
Bill Stuart City of Eugene Radio Communications Tech
Rodney Lathrop City of Springfield IT Director
Marcy Parker City of Springfield Operations Supervisor
Bill Lundun Bicoastal Media Program Director
Robin O’Kelly Bicoastal Media Director of Engineering

Name Organization Title
Thomas Germaine Lane County ARES/Ham Radio operations Emergency Coordinator
Tom Serio Verizon Wireless Manager, Business Continuity
Dave Kinder Verizon Wireless Government Account Executive
Drinking Water Sector
Brad Taylor Eugene Water and Electric Board Water Operations Manager
Joe Moll McKenzie River Trust Executive Director
Amy Chinitz Springfield Utility Board Drinking Water Source Protection Coordinator
Karl Morgenstern Eugene Water and Electric Board Source Protection and Property Supervisor
Steve Ewing Eugene Water and Electric Board Water Distribution Management Technician
Ray Leopold Eugene Water and Electric Board Water Treatment and Supply Supervisor
Steve Fassio Eugene Water and Electric Board Control Systems Administrator
Kevin McCarthy Eugene Water and Electric Board Operations Support Services Supervisor
Ken Vogeney City of Springfield City Engineer
Bob DenOuden Eugene Water and Electric Board Business Support Analyst
Forrest Chambers City of Eugene Interim Emergency Manager
Kevin Fahey Eugene Water and Electric Board Business Continuity and IT Disaster Recovery Planner
Food Sector
Abe Zitterkopf Albertsons District Manager: S. Oregon
Nils Stark Cornucopia restaurants Owner
Tom Lively Organically Grown Co. Senior Sales Representative
Jeff Loyd Market of Choice Store Manager
Megan Kemple Willamette Farm and Food Coalition Farm to School Program Director
Sarah Means Mizejewski
Lane County Community Economic Development
Economic Development Officer
Jason Lafferty SnowTemp Cold Storage General Manager
Lynne Fessenden Willamette Farm and Food Coalition Executive Director
Marc Carlson Safeway Store Manager: 18th Ave.
Housing Sector
Ed McMahon Home Builder’s Association Director
Susan Ban Shelter Care Executive Director
Stuart Ramsing City of Eugene Building Official
Trevor Covington American Red Cross Regional Disaster Program Manager
Stephanie Jennings
City of Eugene Grants Manager
Kaarin Knudson Rowell Brokaw Architects Project Designer, Planning Specialist
Michael Wisth City of Eugene Community Programs Analyst
Jim Wilcox Housing and Community Services Agency of Lane County
Energy Educator
Cece Newell Oregon Insurance Division Property and Casualty Analyst
Electricity Sector
David Pruitt Bonneville Power Administration Chief Substation Operator
Tony Toncray Lane Electric Cooperative Manager Construction and Maintenance
Jaime Cranmer Emerald People’s Utility District Communications and Customer Service Manager

Name Organization Title
Ron Dubbs Emerald People’s Utility District Engineering and Operations
Joe Jarvis Blachly Lane General Manager
Sanjeev King Springfield Utility Board Electric Engineering Manager
Michael Warren Springfield Utility Board Safety Environmental Manager
Felicity Fahy Eugene Water and Electric Board Sustainability Coordinator
Health Sector
Mark Walker McKenzie‐Willamette Medical Center Emergency Management Coordinator
Tracy DePew PeaceHealth Oregon Director Emergency Management and Security Services
Selene Jaramillo Lane County Health and Human Services Preparedness Coordinator
Rick Hammel Community Health Centers of Lane County Systems Manager
Deleesa Meashintubby
Volunteers In Medicine Clinic Executive Director
Tom Hambly PacifcSource Health Plans (Insurance) Wellness Consultant
Shannon Conley Trillium Community Health Plan Chief Administrative Officer
Joanna Kamppi Eugene Fire and Emergency Medical Services EMS Chief
Transportation Sector
David Warren Oregon Department of Transportation Region 2 District Manager
Frannie Brindle Oregon Department of Transportation Area 5 Manager
Chuck Mueller City of Eugene Engineering Associate
Steven Nicholas City of Eugene Terminal Maintenance Manager
Barnett Brian City of Springfield Traffic Engineer
Sarah Wilkinson Lane County Planner
DisclaimerThe work that provided the basis for this publication was supported by funding under an award with the U.S. Department of Housing and Urban Development. The substance and findings of the work are dedicated to the public. The author and publisher are solely responsible for the accuracy of the statements and interpretations contained in this publication. Such interpretations do not necessarily reflect the views of the Government.

AbouttheLaneLivabilityConsortium The Vulnerability Assessment information summarized in this report was prepared at the request of a coalition of local public, nonprofit, and educational agencies and organizations called the Lane Livability Consortium. These entities are working together through the Lane Livability Consortium to find new ways to advance community growth and prosperity in the Eugene‐Springfield metropolitan area. The Lane Livability Consortium was established in 2010 in order to apply for and receive a Sustainable Communities Regional Planning Grant from the U.S. Department of Housing and Urban Development. The Consortium’s efforts are funded through the Regional Planning Grant and with leveraged resources contributed by local partner agencies. Work through the Consortium commenced in 2011 and will conclude in 2014. Partner agencies include City of Eugene, City of Springfield, Lane County, Eugene Water and Electric Board, Housing and Community Services Agency of Lane County, Lane Council of Governments, Central Lane Metropolitan Planning Organization, Lane Transit District, Oregon Department of Transportation, St. Vincent de Paul Society of Lane County, University of Oregon Sustainable Cities Initiative, and the University of Oregon Community Planning Workshop. The primary focus of the Consortium is to identify opportunities for greater impacts and linkages among our region’s core plans and investments related to land use, transportation, housing, and economic development. Other Consortium initiatives include work on public engagement, scenario planning, use of data for decision‐making, regional investments, organizational capacity building, and catalytic projects. This report on the Eugene‐Springfield Hazard and Climate Vulnerability Assessment and the Phase II work was completed under the Sustainable Communities grant. The pilot phase (Phase I) was completed under separate funding, prior to inclusion in the Lane Livability Consortium work plan as Task 6.1.
TableofContentsSummary ....................................................................................................................................................... 1
Background ................................................................................................................................................... 1
Project Approach .......................................................................................................................................... 1
Process and tools ...................................................................................................................................... 1
Steering committee review ....................................................................................................................... 2
Deliverables ................................................................................................................................................... 3
Next steps ..................................................................................................................................................... 3
AppendicesAppendix A: Hazard and Climate Vulnerability Assessment Tool Appendix B: Hazard and Climate Vulnerability Assessment Tool: User Guide Appendix C: Sector summaries

Hazard and Climate Vulnerability Assessment Page 1
SummaryThe purpose of the project was to develop and apply a method for assessing the vulnerability of community‐wide sectors to climate change, rising energy prices, and the natural hazards (earthquake, flood, wildfire, etc.) contained in the Eugene/Springfield Natural Hazards Mitigation Plan. This vulnerability assessment was applied to multiple sectors including transportation, water, energy, health, housing, food, and others. The findings will be used to inform the update of the Natural Hazards Mitigation Plan and to inform other planning, risk management, and investment decisions.
BackgroundThe City of Eugene hired Oregon Partnership for Disaster Resilience (OPDR) in the late summer 2012 to assist with developing the assessment tool and to run a pilot assessment looking at two sectors: drinking water and public health. In fall, 2012 a steering group comprised of staff from City of Eugene, City of Springfield, EWEB, Lane County, Oregon Department of Land Conservation and Development, Oregon State University, and the Institute for Sustainable Communities was convened to develop the assessment methodology and tools. An assessment of the drinking water and public health sectors was completed by June 30, 2013 under the contract with OPDR. Funds were secured through the Lane Livability Consortium in summer 2013 to conduct assessments of additional sectors with the goal to complete the assessment of all sectors at the conclusion of the grant. Primary partners in the project included: City of Eugene, City of Springfield, Lane County, Eugene Water and Electric Board, Oregon State University, Oregon Department of Land Conservation and Development and the University of Oregon (Oregon Partnership for Disaster Resilience). Some of the additional partners included Metropolitan Wastewater Management Commission, Oregon Department of Transportation, Northwest Natural Gas, Springfield Utility Board, Lane Transit District, St. Vincent de Paul, Lane Council of Governments, Food for Lane County, Willamette Farm and Food Coalition, and others.
ProjectApproachThis work began with a pilot project to develop and test a methodology in the assessment of the drinking water and public health sectors. That pilot phase was completed in June 2013. The next phase of work, which ran through February 2014, focused on completing the assessment of additional sectors including transportation, electricity, waste water, food, communication, and housing.
ProcessandToolsThe sector assessments were conducted as group discussions of 8‐12 expert system managers, facilitated by OPDR staff and using the assessment tool that had been developed and refined through the pilot phase of the project. Typically, each sector required 4‐6 hours of discussion, with OPDR staff recording the results in a database. These results were captured in narrative or qualitative form and accompanied by numeric scoring of key dimensions of risk, vulnerability and adaptive capacity. Natural hazard scenarios were presented for discussion, typically involving flood and earthquake. In some cases additional hazards were assessed, where relevant to the particular sector (e.g. winter storm hazard for the electricity sector). Climate change was included as an expansion of the hazard scenarios, as the

Hazard and Climate Vulnerability Assessment Page 2
impacts of many natural hazards are expected to be exacerbated by the increased drought, heat and storm intensity expected with climate change. Once the facilitated panel discussions were concluded, City of Eugene and OPDR staff completed the scoring process included in the assessment tool and captured important qualitative considerations in sector summaries. The assessment tool and the sector summaries are included as attachments to this report. Figure 1.1 contains a flow chart depicting the assessment process for each sector.
Figure 1.1: Sector Assessment Flow Chart
SteeringCommitteeReviewThe project steering committee, which included representatives from the primary project partners, met at key points throughout the project to review, discuss and refine the process and tools used in the sector assessments. During Phase II, the steering committee provided direction on the scoring methodology and interpretation, along with other guidance.

Hazard and Climate Vulnerability Assessment Page 3
DeliverablesThe following products are included with this report:
1. Hazard and Climate Vulnerability Assessment Tool (see Appendix A)‐ includes the revised assessment tool with discussion questions and scoring prompts to assess adaptive capacity and hazard vulnerability for an individual system or sector.
2. Hazard and Climate Vulnerability Assessment Tool: User Guide (see Appendix B)– provides detailed guidance on the process of convening and consulting with system experts, utilizing the tool, applying the scoring methodology and capturing and interpreting the results.
3. Sector summaries (see Appendix C) ‐ conclusions and critical information about each of the following sectors:
Drinking water
Public Health
Electricity
Transportation
Food
Housing
Communication
NextStepsThe tool and process developed for this project reflect a new, innovative strategy for conducting a multi‐hazard risk assessment. As such, there has been considerable interest expressed from peers in other US and Canadian cities as well as staff from the Institute for Sustainable Communities, C40 Cities Climate Leadership Group, National League of Cities and the Urban Sustainability Director’s Network. The City of Eugene expects to disseminate the work products to these networks and others to help inform the practice of natural hazard and climate preparedness. Closer to home, the project has produced surprisingly rich and informative results about the vulnerabilities of individual sectors as well as the dependency and inter‐connectedness of virtually all of the systems studied. The City and its project partners plan to convene a meeting of all the participating system experts to explore these relationships in greater depth. Finally, the results of this project will be used to inform the update of the region’s Natural Hazard Mitigation Plan in 2014. This should lead to a more robust, comprehensive and realistic assessment of needed hazard mitigation actions and one that reflects the inherent synergies between natural hazards, climate change and energy insecurity.

Appendix A: Hazard and Climate Vulnerability Assessment Tool


Hazard and Climate Vulnerability Assessment 1
HazardandClimateVulnerabilityAssessmentTool
Acity‐systemsapproachtoassessinghazardandclimatechangeimpacts
Prepared by Oregon Partnership for Disaster Resilience
In partnership with City of Eugene and City of Springfield, Oregon

2 Hazard and Climate Vulnerability Assessment
IntroductionThe City of Eugene Hazard‐Climate‐Energy Vulnerability Assessment Tool (‘the Tool’), is a new way of assessing city sectors such as water, energy,
and food, for vulnerabilities not only from from natural hazards, but also climate change impacts, and energy and fuel price instability. The Tool
seeks to assess an individual system’s current adaptive capacity, sensitivity and risk to these potential impacts, and compare interdependencies
between systems. This assessment and comparison will assist the City of Eugene in prioritizing mitigation and adaptation strategies and projects,
as well as increase overall adaptive capacity across sectors.
This Tool was piloted and refined using input from the public and private sectors, and the results will be shared across sectors. This Tool uses
both quantitative and narrative lines of questioning in order to encourage conversation amongst stakeholders, and to increase the overall shared
learning between systems. The answers to the questions are scored and used to develop overall system vulnerability scores that can be cross‐
compared in a number of ways. This exercise is intended to be repeated every 5 years (?) in order to reassess advances in adaptive capacities,
and the effectiveness of ongoing system planning, mitigations and adaptations.
The first step in the Tool is the system assessment. This step is composed of Part 1: Adaptive Capacity, and Part 2: Sensitivity and Impacts. The
second step in the Tool is to analyze the answers to the questions in order to produce Vulnerability, Risk, and Hazard scores for the system. The
third step involves developing an overall system planning score, which, along with the narratives, can be mapped along with other systems for
cross‐comparison. Figure 1 illustrates the process involved in the Tool.

Hazard and Climate Vulnerability Assessment 3
Figure 1: Assessment Tool Diagram

4 Hazard and Climate Vulnerability Assessment
Part1:AdaptiveCapacityAssessment
SystemAssessed:
PurposeThe purpose of this section is to assess your system’s adaptive capacity. This assessment takes a snapshot of current system components, business activities and operations. The assessment is intended to provide a “base case” against which the system’s adaptive capacity can be measured should a shock, emergency or long‐term environmental change (e.g. natural, social, economic, etc.) occur.
Instructionstosystemmanagers:In answering the following questions, please discuss your assumptions, how you arrived at answers, what narratives inform your answers, what cross‐system conversations you may have, and what specific future scenarios you may entertain to arrive at your answers. If answers are related to system specific data please ensure the source of the data is included in your answer. Please provide a description of the system, including its uses and users, its physical boundaries (for example, the water system will extend from the upper watershed to the wetlands), its legal and contractual obligations to provide service, its ownership, and its primary and secondary infrastructure components. This system description is intended to provide additional context for your answers. Some questions have ranked answers, while narrative questions do not. You will have the opportunity to score your system’s adaptive capacity for each section as well as overall. For the Part 1 Adaptive Capacity questions, a low (1) factors into very low adaptive capacity, while a high score (5) factors into a highly adaptive system.

Hazard and Climate Vulnerability Assessment 5
AdaptiveCapacityA natural, built, or human system’s ability to accommodate a new or changing environment, exploit beneficial opportunities and/or moderate negative effects. Adaptive Capacity is assessed independently of hazard or climate change considerations.
1. Current and Future Demand + Supply In order to determine how adaptive a system will be to future scenarios, a baseline of how the system operates and the current demands on the system will be necessary.
1.1. What is the average daily demand in respect to current capacity of the system?
1. Very High 2. High 3. Medium 4. Low 5. Very Low
1.2. What is the peak demand in respect to current capacity of the system?
1. Very High 2. High 3. Medium 4. Low 5. Very Low
1.3. Given projected demand, when would the current system reach 100% capacity?
1. < 5 years 2. 5‐10 years 3. 10‐25 years 4. 25‐50 years 5. > 50 years

6 Hazard and Climate Vulnerability Assessment
1.4. What are the supply or service issues you foresee in the long term (20‐50 years)? Also, consider issues in the mid‐term (5‐20 years).
1.5. What are the known thresholds of failure on the system? Under what circumstances are these thresholds predicted to be reached?
1.6. What question didn't we ask that we should have?
1.7. Based on the discussion in this section, how would you rank the system overall in respect to Current and Future Supply and Demand?
1. Very Low 2. Low 3. Medium 4. High 5. Very High
2. Planning + Upgrades A system with strategic and comprehensive planning processes, that uses consistent maintenance schedules, that uses the latest technology, and that plans upgrades and retrofits will likely be more adaptive.
2.1. Considering your system’s sector worldwide, how rapidly does the sector undergo change (in technology, management practices, etc.)?
1. < 5 years 2. 5‐10 years 3. 10‐25 years 4. 25‐50 years 5. > 50 years

Hazard and Climate Vulnerability Assessment 7
2.2. How responsive is the local system to worldwide sector advances (in technology, etc.)?
1. >10 Years (The majority of system components are antiquated or based on technology no longer utilized.) 2. 5‐10 Years 3. 3‐5 Years 4. 1‐3 Years 5. <1 Year (System employs the most advanced, cutting edge technology in the field.)
2.3. To what degree are the standards and expectations of the community being met by the current system?
2.4. To what extent is the system insured against catastrophic loss or failure? Also, explain how it is insured. What type?(self‐insured negligence, impact, liability, federal)
2.5. What level of demand increase are you planning for?
2.6. Given a catastrophic failure of the system how much would it cost to replace the system now? Consider primary infrastructure.
2.7. How easy is it to replace parts and/or repair the system?
2.8. What question didn't we ask that we should have?
2.9. Based on the discussion in this section, how would you rank the system overall in respect to Planning and Upgrades?
1. Very Low 2. Low 3. Medium 4. High 5. Very High

8 Hazard and Climate Vulnerability Assessment
3. Limiting Factors + Needs
A system may be affected and/or limited by multiple factors outside the function and operation of the system. Limiting factors include, but are not limited to: politics, budgeting, energy costs, policies, laws, regulations, administrative and management, workforce availability and training, socio‐economics, etc. 3.1. Describe the limiting factors of the system? (ex: politics, budgets, access to capital, regulations, energy costs, decision making apparatus,
social systems, etc.)
3.2. Are there operational parameters or standards that, if not met, will directly or indirectly affect the system as a whole? (example: wastewater treatment must remove contaminants by X ppm, and if it does not do this, will it affect the service provided by the system?)
3.3. To what degree are system needs met? (System needs may include resource allocation, personnel, public/private assistance, etc. Please specify system needs).
3.4. What question didn't we ask that we should have?
3.5. Based on the discussion in this section, how would you rank the system overall in respect to Limiting Factors and Needs?
1. Very Low 2. Low 3. Medium 4. High 5. Very High

Hazard and Climate Vulnerability Assessment 9
4. System Interdependencies
It is important to understand if this system is directly and/or indirectly affected by other systems. In order to maintain a holistic approach to the community, it is important to understand which systems will be directly or indirectly affected by an adverse change in one system, and vice versa. In considering system interdependencies please list any systems that are fundamentally reliant on another system to operate. Also, note reliance on systems for only part of a given system’s operations. 4.1. Which other systems or subsystems does this system fundamentally rely on? (Please check all that apply) Please explain how and why for
each.
Business/Industry
Governance
Nonprofits
Communication
o Telephone
o Television
o Radio
Drinking water
Storm water
Transportation
o Transit
o Freight
o Highway
o Non‐motorized
Housing
o Single‐Family
o High‐Density
o Temporary
Energy
o Electricity
o Hydroelectricity
o Transmission/distribution
o Natural Gas
o Gas/Diesel
o Biofuels
Food
o Agriculture
o Processing
o Distribution/Storage
o Wholesale/Retail
Health
Sanitary sewer
Natural systems
o Watershed
o Forest
o Wetlands
o Parks and Open Space
Public Safety
o Fire/EMS
o Police

10
Hazard and Climate Vulnerability Assessment
4.2. How many other systems rely on this system to operate effectively? (Please check all that apply) Please explain how and why for each.
Business/Industry
Governance
Nonprofits
Communication
o Telephone
o Television
o Radio
Drinking water
Storm water
Transportation
o Transit
o Freight
o Highway
o Non‐motorized
Housing
o Single‐Family
o High‐Density
o Temporary
o Hydroelectricity
Energy
o Electricity
o Transmission/distribution
o Natural Gas
o Gas/Diesel
o Biofuels
Food
o Agriculture
o Processing
o Distribution/Storage
o Wholesale/Retail
Health
Sanitary sewer
Natural systems
o Watershed
o Forest
o Wetlands
o Parks and Open Space
Public Safety
o Fire/EMS
o Police
4.3. What parts of the system have redundancies or backups (infrastructure, stockpiles, etc)? Please list.

Hazard and Climate Vulnerability Assessment 11
4.4. What is the capacity of the redundant system? How long can it last, how many does it serve?
4.5. Are there interagency mutual aid agreements? If so, what do they entail?
4.6. What question didn't we ask that we should have?
4.7. Based on the discussion in this section, how would you rank the system overall in respect to System Interdependencies?
1. Very Low 2. Low 3. Medium 4. High 5. Very High
5. Capacity Opportunities
Within the current operations and planning processes, potential opportunities may have already been identified by a given system’s stakeholders.
5.1. What capacity building opportunities have already been identified by system management? (i.e. technological, organizational, personnel/training, regulatory) (List all)
5.2. What question didn't we ask that we should have?

12
Hazard and Climate Vulnerability Assessment
5.3. Based on the discussion in this section, how would you rank the system overall in respect to Capacity Opportunities?
1. Very Low 2. Low 3. Medium 4. High 5. Very High
6. Adaptation + Mitigation
If a given system currently integrates hazard and/or climate change mitigation/adaptation within the system’s operations and planning, the system will be more adaptive.
6.1. Does the system currently employ a hazard/disaster plan/climate change adaptation plan? What are the important aspects?
6.2. Does the system employ ecological restoration as a mitigation strategy? What are they?
6.3. Does system offset carbon emissions in any way? By how much?
6.4. What question didn't we ask that we should have?
6.5. Based on the discussion in this section, how would you rank the system overall in respect to Adaptation and Mitigation?
1. Very Low 2. Low 3. Medium 4. High 5. Very High

Hazard and Climate Vulnerability Assessment 13
7. Other Information
7.1. Is there other information that we need?
7.2. What keeps you awake at night?
7.3. Based on the overall discussion and assessment of adaptive capacity, how would rate the overall adaptive capacity of your system?
1. Very Low 2. Low 3. Medium 4. High 5. Very High

14
Hazard and Climate Vulnerability Assessment
Part2:SensitivityandImpactAssessment
SystemAssessed:
HazardConsidered:[earthquake][flood][wildfire]Instructionstosystemmanagers:In discussing and answering the following questions, please document and record your assumptions, how you arrived at answers, narratives that inform answers, cross‐system conversations you may have, and specific future scenarios you may entertain to arrive at answers. If answers are related to system specific data please ensure the source of the data is included in your answer.
A. Hazard Sensitivity Hazard sensitivity is defined as the degree to which a natural, built, or human system is affected (either adversely or beneficially) by direct or indirect exposures to climate change conditions or hazards. Consider sensitivity in relation to the hazard or climate change impact(s) outlined in the scenario. Ranked answers will be averaged based on the number of questions answered. A low average ranking indicates low sensitivity; a high average ranking indicates high sensitivity. For the Part 2 Hazard Sensitivity and Impact questions, a low score (1) factors into a low sensitivity, and a high score (5) factors into a high sensitivity. A1. Lead Off Questions
A1.1 How would you rank your system’s overall sensitivity to this hazard? Why? 1. Extremely insensitive: A major hazard event will have no impacts to the system. 2. Mostly Insensitive: A major hazard event will have only minor impacts to the system. 3. Unknown sensitivity: A major hazard event will have unknown impacts to the system. 4. Somewhat sensitive: A major hazard event will have mostly minor, but maybe major impacts to the system. 5. Extremely sensitive: A minor hazard event will have major impacts to the system.
A1.2 Are there any other hazards not being assessed here that are a major concern for your system? (Drought, winter storm,
terrorism, tsunami, etc.) Why?

Hazard and Climate Vulnerability Assessment 15
A2. Primary Infrastructure The infrastructure absolutely necessary to operate or maintain a system at its most basic capacity. Example: for drinking water system, primary infrastructure includes source intake, filtration and main distribution components.
A2.1 Please describe the components of your primary infrastructure and its basic capacity. A2.2 What amount of the primary infrastructure is in the hazard‐affected zone?
1. None 2. Very Little 3. Some 4. Quite a bit 5. All
A2.3 Considering all of the system components, including critical and essential components, what amount of the primary infrastructure would have to be impacted to trigger a catastrophic system failure?
1. Very High 2. High 3. Medium 4. Low 5. Very Low
A2.4 What question didn't we ask that we should have?
A3. Secondary Infrastructure The infrastructure used to extend or improve a system’s services and/or operations. The secondary infrastructure, in theory, is more easily replaceable than the primary infrastructure. Secondary infrastructure failure would result in minor to moderate capacity loss, but not result in entire system failure. Example: for drinking water system, secondary infrastructure includes secondary distribution components, meters, and hydrants.
A3.1 Please describe the components of your secondary infrastructure.

16
Hazard and Climate Vulnerability Assessment
A3.2 How much of the secondary infrastructure and/or subsystems of the given system is in the hazard‐affected area?
1. None 2. Very Little 3. Some 4. Quite a bit 5. All
A3.3 What percentage of the secondary infrastructure would have to fail in order to impact the primary infrastructure?
1. Very High 2. High 3. Medium 4. Low 5. Very Low
A3.4 What question didn't we ask that we should have?
A4. Capacity If affected by climate change conditions or a hazard it will be important to know and understand how long a system (in its current state) could continue to operate under adverse conditions.
A4.1 On average, what percentage of the system would likely be disrupted if this hazard occurred?
1. <5% 2. 5% or 25% 3. 25% or 50% 4. 50% to 75% 5. 75% to 100%

Hazard and Climate Vulnerability Assessment 17
A4.2 Will the hazard result in system demands that will likely exceed system supply and/or service delivery capacity? By how much?
1. No 2. Maybe 3. For a limited duration 4. Yes 5. Don’t know
A4.3 How long can the current system operate if affected by this hazard? Consider question in relation to primary infrastructure.
1. Months or years 2. Weeks 3. Days 4. Hours 5. Minutes
A4.4 What question didn't we ask that we should have?

18
Hazard and Climate Vulnerability Assessment
A5. System Interdependencies As systems do not operate independently or in a vacuum, connections between systems are important aspects to identify potential pinch points, service delivery interruptions, or other aspects that affect system sensitivity.
A5.1 Which outside systems or sectors, if themselves affected by hazards or climate events, would affect your system’s operations? How and to what degree?
Business/Industry
Governance
Nonprofits
Communication o Telephone o Television o Radio
Drinking water
Storm water
Transportation o Transit o Freight o Highway o Non‐motorized
Housing o Single‐Family o High‐Density o Temporary o Hydroelectricity
Energy o Electricity
o Transmission/distribution o Natural Gas o Gas/Diesel o Biofuels
Food o Agriculture o Processing o Distribution/Storage o Wholesale/Retail
Health
Sanitary sewer
Natural systems o Watershed o Forest o Wetlands o Parks and Open Space
Public Safety o Fire/EMS o Police

Hazard and Climate Vulnerability Assessment 19
A5.2 Which outside systems or sectors are affected by your operations and adaptation activities? Describe those affects. A5.3 What question didn't we ask that we should have? A5.4 Based on the overall discussion and assessment of this hazard, how would rate the overall sensitivity of your system to this hazard?
1. Very Low 2. Low 3. Medium 4. High 5. Very High
B. Hazard Impacts The degree of chronic stresses and major or catastrophic impacts from hazards on a natural, built, or human system.
B1. Lead Off Questions
B1.1 What are the expected chronic stresses to this system should this hazard occur?
B1.2 What are the expected major or catastrophic impacts to this system should this hazard occur?

20
Hazard and Climate Vulnerability Assessment
B2. Population Affected Percentage of the population that would be adversely affected by a given scenario. Does not refer to injury or death.
B2.1 What percentage of local population would be adversely affected if the hazard occurred today? (Does not refer to injuries or deaths)
1. Very Low 2. Low 3. Medium 4. High 5. Very High
B2.2 If this hazard occurs, what are the potential impacts to the workforce of your system. Or: Given a sudden 20% decrease in workforce, what are the stresses and impacts expected?
B3. Economic Disruption
Determine the economic impact of a given scenario. Determination would include monetary value being lost and over what extent of time.
B3.1 If this event occurred in your (region, county, city, facility) and had a direct impact on your system that interrupted service or supply, estimate the duration of interruption to major businesses and industry.
1. Hours 2. Days 3. Weeks 4. Months 5. 1 Year or longer
Hazard and Climate Vulnerability Assessment 21
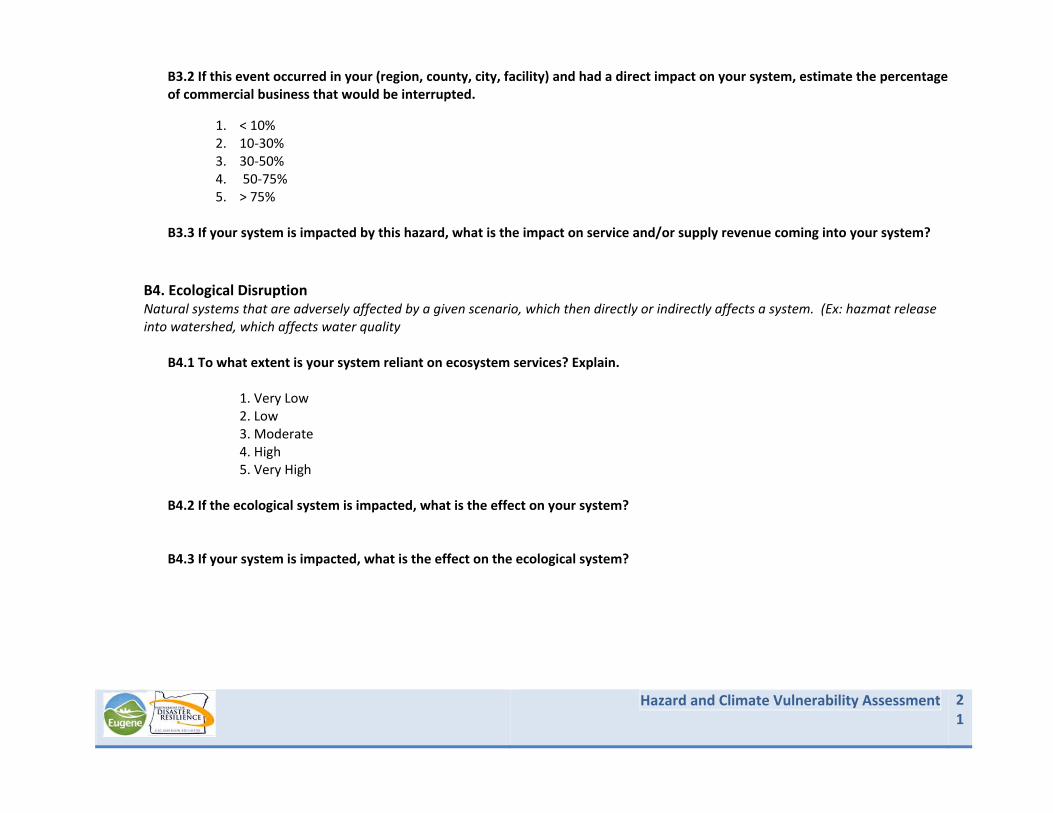
B3.2 If this event occurred in your (region, county, city, facility) and had a direct impact on your system, estimate the percentage of commercial business that would be interrupted.
1. < 10% 2. 10‐30% 3. 30‐50% 4. 50‐75% 5. > 75%
B3.3 If your system is impacted by this hazard, what is the impact on service and/or supply revenue coming into your system?
B4. Ecological Disruption Natural systems that are adversely affected by a given scenario, which then directly or indirectly affects a system. (Ex: hazmat release into watershed, which affects water quality
B4.1 To what extent is your system reliant on ecosystem services? Explain. 1. Very Low 2. Low 3. Moderate 4. High 5. Very High B4.2 If the ecological system is impacted, what is the effect on your system? B4.3 If your system is impacted, what is the effect on the ecological system?

22
Hazard and Climate Vulnerability Assessment
B5. Overall Stresses and Impacts
B5.1 How would you rank this hazard’s overall impact on your system? 1. Very Low 2. Low 3. Medium 4. High 5. Very High B5.2 Compared to other hazards, how would you rank this hazard’s impacts as a matter of planning importance? 1. Very Low 2. Low 3. Medium 4. High 5. Very High
B5.3 What question didn't we ask that we should have?
C. Climate Change Impacts
Climate change can create additional or compounding stresses and impacts for systems. A system that considers climate change as part of its planning can reduce its overall sensitivity/vulnerability and create a more adaptive system overall.
C1. 2050 Climate Change Climate change scenarios for 2050 include:
average annual temperature increase by 2‐4 degrees F
Decrease in spring, summer and fall precipitation
60% snowpack decline
increase in extreme heat events
increase in wildfire frequency and intensity

Hazard and Climate Vulnerability Assessment 23
C1.1 How would you rank your system’s overall sensitivity to the climate scenario forecasts for 2050? 1. Very Low 2. Low 3. Medium 4. High 5. Very High C1.2 Do any of the climate scenario factors exacerbate your sensitivity to this hazard? How? 1. No 2. Maybe 3. For a limited duration 4. Yes 5. Don’t know C1.3 Describe the predicted stresses and impacts to climate scenarios of 2050? Which factors will impact the system the most? C1.4 What adaptations are your system considering or performing to address climate scenarios of 2050?
D. Fuel Price Impacts The cost of petroleum affects many systems and should represent a major consideration for planning and operations. Please consider the following questions in respect to fossil fuels and products derived from fossil fuels that your system heavily relies on.
D1.1 How much is this system reliant on fossil fuels and products derived from fossil fuels? Please list.
1. Not at all reliant 2. Very little reliance 3. Somewhat reliant 4. Heavily reliant 5. Completely reliant
D1.2 What kind of effect has recent fuel price volatility had on this system’s operations?

24
Hazard and Climate Vulnerability Assessment
D1.3 What kind of impact would $10/gallon fuel have on this system’s operations?
D1.4 What question didn't we ask that we should have?

Appendix B: Hazard and Climate Vulnerability Assessment Tool:
User Guide


Hazard and Climate Vulnerability
Assessment Tool: User Guide
January 2014 Final Report
Prepared for:The City of Eugene Office of Sustainability
Prepared by:Oregon Partnership for Disaster Resilience
A Program of the Community Service Center

Hazard and Climate Vulnerability Assessment Tool: User Guide January 2014 Page | i

Page | ii Oregon Partnership for Disaster Resilience
SPECIAL THANKS & ACKNOWLEDGEMENTS
This report, funded by the City of Eugene, the Federal Emergency Management Agency Hazard Mitigation Grant Program and the U.S. Department of Housing and Urban Development Office of Sustainable Housing and Communities Grant Program, outlines how to implement the City of Eugene hazard and climate vulnerability assessment tool. The project would not have been possible without the vision and leadership of Matt McRae and Babe O’Sullivan at the City of Eugene and Ken Vogeney with the City of Springfield. Results of this project will inform the 2015 update to the Eugene/Springfield Natural Hazard Mitigation Plan in addition to other local planning activities. This project utilized additional support provided by the University of Oregon’s Community Service Center.
Project Steering Committee:
Matt McRae, City of Eugene
Babe O’Sullivan, City of Eugene
Ken Vogeney, City of Springfield
Felicity Fahy, Eugene Water and Electric Board
Josh Foster, Oregon Climate Change Research Institute
Steve Adams, Institute for Sustainable Communities
Jeff Weber, Oregon Department of Land Conservation and Development
Myrnie Daut, City of Eugene
Stacy Burr, City of Eugene
Dr. Patrick Luedtke, Lane County Public Health
Forrest Chambers, City of Eugene
Project Manager:
Matt McRae, City of Eugene
Community Service Center Staff:
Josh Bruce, Interim Director, Oregon Partnership for Disaster Resilience
Mike Howard, Program Specialist, Oregon Partnership for Disaster Resilience
Jack Heide, Research Associate
Casey Hagerman, Research Associate
Sarah Alison, Student Intern

Hazard and Climate Vulnerability Assessment Tool: User Guide January 2014 Page | iii
About the Community Service Center
The Community Service Center (CSC), a research center affiliated with the Department of Planning, Public Policy, and Management at the University of Oregon, is an interdisciplinary organization that assists Oregon communities by providing planning and technical assistance to help solve local issues and improve the quality of life for Oregon residents. The role of the CSC is to link the skills, expertise, and innovation of higher education with the transportation, economic development, and environmental needs of communities and regions in the State of Oregon, thereby providing service to Oregon and learning opportunities to the students involved.
About the Oregon Partnership for Disaster Resilience
The Oregon Partnership for Disaster Resilience (OPDR) is a coalition of public, private, and professional organizations working collectively toward the mission of creating a disaster‐resilient and sustainable state. Developed and coordinated by the Community Service Center at the University of Oregon, the OPDR employs a service‐learning model to increase community capacity and enhance disaster safety and resilience statewide.

Page | iv Oregon Partnership for Disaster Resilience
CLIMATE VULNERABILITY ASSESSMENT PILOT REVIEW PROCESS
Table of Contents
Tool Overview
Purpose .......................................................................................................................................................... 1
How Does the Tool Work? ...................................................................................................................... 1
Assessment Method in Brief
Part I: Sector Assessment .......................................................................................................................... 3
Part II: Sector Analysis ................................................................................................................................ 4
Assessment Method in Detail
Get the Right People to the Table .......................................................................................................... 7
Ask Tough Questions .............................................................................................................................. 10
Record the Answers ................................................................................................................................ 12
Scoring Spreadsheets ............................................................................................................................... 16
Final Assessment Summary .................................................................................................................... 16

Hazard and Climate Vulnerability Assessment Tool: User Guide January 2014 Page | v
This page left intentionally blank.

Hazard and Climate Vulnerability Assessment Tool: User Guide January 2014 Page | 1
TOOL OVERVIEW
Purpose
The Cities of Eugene and Springfield developed this Community Vulnerability and Adaptive Capacity Assessment Tool (‘the tool’). The purpose of the tool is to allow infrastructure managers, city planners, emergency management personnel, policy makers and others to assess and rate the vulnerability of critical sectors to natural hazards and other uncertainties.
A unique aspect of the tool is its utility in assessing city‐level infrastructure and service sectors both individually and as an overall system. The conversations and assessment scores that result from applying the tool help to paint a more detailed picture of community vulnerabilities and interdependencies.
In addition to providing a narrative of the health of a community’s vital infrastructure and services, the assessment offers insights that suggest strategies to increase resilience across sectors. The results can be used to prioritize infrastructure improvements, hazard mitigation strategies or climate adaptation strategies. Ultimately, the results should help establish a course towards adaptive local and regional networks, and a more resilient community as a whole.
How Does the Tool Work?
This section briefly outlines the key steps in the process.
1. Choose the right sectors
The first step is to choose which sectors to assess. Sectors include key goods and services used by the people who live and work in the city. These include public infrastructure systems (transportation, drinking water, electricity, etc.) and other service categories (food, housing, health).
2. Get the right people to the table
The next step is to invite a range of stakeholders from each sector to participate. Consider inviting individuals from all levels of the sector, from operators and technicians to managers, policy makers and administrators. In some cases, you will need to consider inviting personnel from multiple agencies, particularly where those agencies provide the same service. Strive for vertical and horizontal stakeholder representation.
3. Ask tough questions and start a conversation
The tool includes questions intended to be used with a variety of sectors. The questions are designed to assess how sectors will perform in situations of chronic or catastrophic stress. The questions can apply to both known and unknown threats. Answers to the questions should indicate how the sector will respond and recover from a range of threats. Use local scenarios to provide probability, and adjust the line of questioning to fit the sector. Carefully record what gets said, and ask follow‐up questions to delve deeper.

Page | 2 Oregon Partnership for Disaster Resilience
4. Score the answers and compare results
The CVA includes quasi‐objective and subjective scoring methods. Assessment scoring is intended to allow comparisons and rankings across both sectors and hazards. In addition, the scores allow for a simplified visual representation of the complex issues discussed during the assessment. Users are encouraged to use the scores to track narratives across sectors and communicate the immediate and long‐term needs.
5. Present the results
Once the information is collected and scored, the results are compiled for presentation. Short, three‐ to four‐page sector assessment summaries present the results in an accessible format. The intent of the summaries is to present the information in a way that can be understood by both lay and technically proficient professional audiences. The summaries include high level information such as scores, major vulnerabilities, and interdependencies. In addition, the summaries include a more detailed synthesis of the narratives from each section, including thresholds, adaptations and mitigation opportunities.
6. Apply the results
The last step is to apply the results. Once the assessments are complete and the information is summarized, system managers, administrators and operators should discuss priority vulnerabilities and methods to improve the resilience of those sectors. This may take the form of infrastructure improvements, changes in operations, or alternative policy or funding strategies. Identifying appropriate regulatory and non‐regulatory strategies will take additional time and effort. Commitment on the part of decision makers is vital to success at this stage.
Hazard and Climate Vulnerability Assessment Tool: User Guide January 2014 Page | 3
ASSESSMENT METHOD IN BRIEF
Part I: Sector Assessment
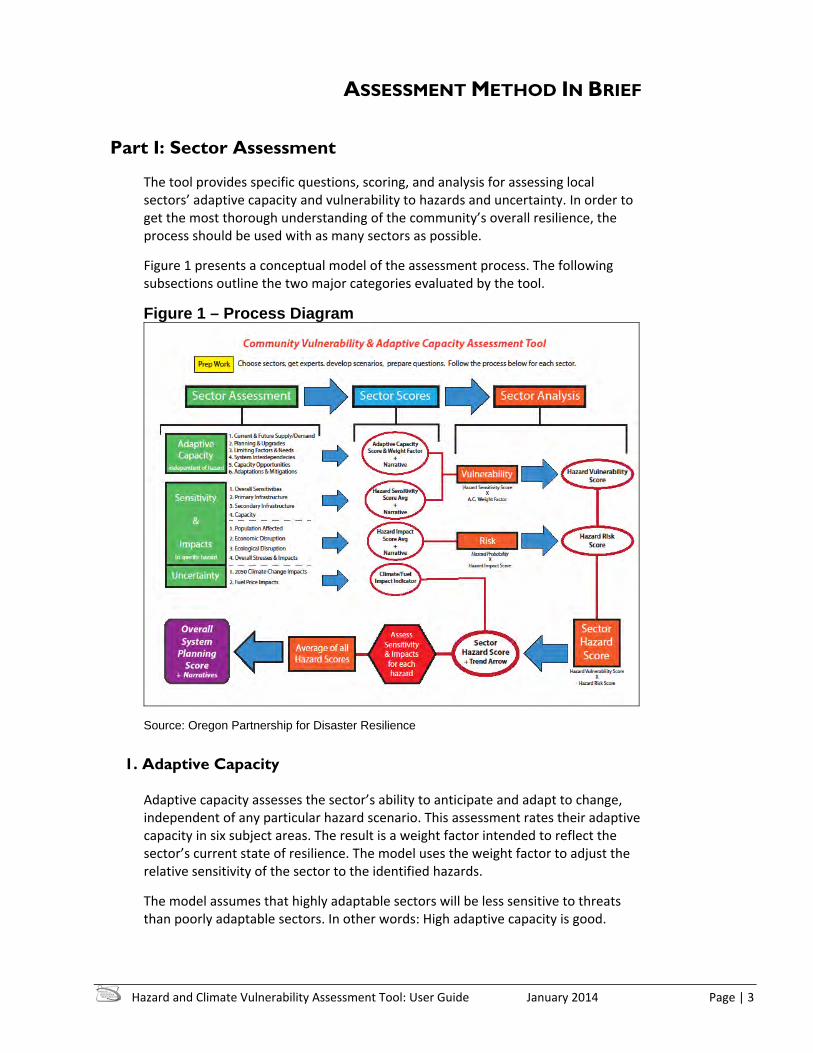
The tool provides specific questions, scoring, and analysis for assessing local sectors’ adaptive capacity and vulnerability to hazards and uncertainty. In order to get the most thorough understanding of the community’s overall resilience, the process should be used with as many sectors as possible.
Figure 1 presents a conceptual model of the assessment process. The following subsections outline the two major categories evaluated by the tool.
Figure 1 – Process Diagram
Source: Oregon Partnership for Disaster Resilience
1. Adaptive Capacity
Adaptive capacity assesses the sector’s ability to anticipate and adapt to change, independent of any particular hazard scenario. This assessment rates their adaptive capacity in six subject areas. The result is a weight factor intended to reflect the sector’s current state of resilience. The model uses the weight factor to adjust the relative sensitivity of the sector to the identified hazards.
The model assumes that highly adaptable sectors will be less sensitive to threats than poorly adaptable sectors. In other words: High adaptive capacity is good.

Page | 4 Oregon Partnership for Disaster Resilience
2. Sensitivity and Impacts
Sensitivity and impacts assesses the sector’s performance when challenged by a range of hazard, climate or fuel price impacts. These assessments use specific hazard scenarios as background for questions across eight subject areas. The results of the sensitivity and impact assessments factor into the vulnerability and risk scores for each sector. In addition, questions regarding 2050 Climate scenarios and future fuel price increases produce a future‐looking “trend” that helps in long‐range planning considerations.
The model assumes that sectors with low sensitivity to or impacts from identified stressors will perform better than sectors with high sensitivity and impact scores. In other words: Low sensitivity and impact scores are good.
Part II: Sector Analysis
The CVA tool uses the scores gathered from the Sector Assessment and produces scores for four different variables:
1. Vulnerability Score
Sector Vulnerability to Hazard = Hazard Sensitivity Score X Adaptive Capacity Weight Factor
Each hazard assessed provides a hazard sensitivity score. That score is multiplied by the weight factor to get an adjusted score for that sector’s vulnerability to that particular hazard. This is repeated for each hazard assessed. Scores are put onto the sector’s Sensitivity excel worksheet. The lower vulnerability scores the better.
2. Risk Score
Sector Risk to Hazard = Hazard Impact Score X Hazard Probability
Each hazard assessed has a local probability of occurrence. This probability factor is multiplied by the sector’s impact score for that particular hazard. This is repeated for each hazard assessed. Scores are put into the sector’s Sensitivity excel worksheet. The lower risk scores the better.
3. Hazard Score
Hazard Score = Risk Score X Vulnerability Score
Each hazard has an overall score that reflects the sector’s overall susceptibility to the hazard assessed. This score can be used across sectors to analyze what sectors are at greatest or least risk of disruption due to this hazard.
4. Overall Sector Planning Score
Sector Planning Score = Average score of all Hazard Scores
Each sector may assess a different number or types of hazards according to their perceived threats. In order to compare overall scores across sectors, the Sector Planning Score is the average for all Hazard Scores for a given sector. This provides

Hazard and Climate Vulnerability Assessment Tool: User Guide January 2014 Page | 5
a comparable number to analyze overall sector health against other sectors. The lower the Overall score the better.
5. Climate and Fuel Price Indicator
This additional analysis takes the scores from the climate change and fuel price impacts questions and translates the average into a type of weight factor. This “Trending Indicator”, represented by a simple up, down or neutral arrow, reflects a systems potential vulnerabilities to events and impacts that are more or less uncertain. This simplified indicator is meant to provide a general sense of need when doing long range planning.
6. Sector Narratives
The final sector analysis, presented in neat and tidy numerical form, would not be complete without a well‐represented narrative account. The details of the systems, their particular threats, plans, and known vulnerabilities, are all contained in the notes and recordings from the sector meetings. While the narratives in many cases drove the scoring itself, the narratives will help elucidate the scoring for those policy makers who use the numbers, as well as for those on the ground planning mitigations and adaptations.

Page | 6 Oregon Partnership for Disaster Resilience

Hazard and Climate Vulnerability Assessment Tool: User Guide January 2014 Page | 7
ASSESSMENT METHOD IN DETAIL
1. Get the right people to the table
Sector Selection
The first step in the process is to identify which sectors the community would like to assess. Ideally, all critical sectors will be included as part of the assessment, so that interdependencies can get fully investigated. However, as time and funding are often limited, priority should be given to your area’s most fundamental services first. These usually include electricity, drinking water, wastewater, transportation and health. However, the specific list of priority sectors may differ according to your particular situation. Other important sectors to consider include food, housing, communications, stormwater, fossil fuels, natural systems and public safety.
Stakeholder Identification
In order to assess vulnerabilities across multiple community sectors and systems, it is vital to invite a range of experts and stakeholders to participate. All participants should have the knowledge and experience to address the questions of vulnerability of their given sector.
Identifying and inviting a team stakeholders may be one of the more difficult and time consuming tasks for the assessment. Some sectors will be easier than others. In general, sectors that are comprised of a limited number of organizations will be the easiest to invite to the process (e.g., often only one or two companies provide drinking water within a community). Sectors with a wider range of service categories or providers may present more challenges in identifying and engaging stakeholders (i.e., the health sector, which includes some of the following: hospitals, clinics, public health, mental health, pharmacies, EMS, long‐term care facilities, etc.).
Identifying representatives from multiple organizations to represent one sector will be necessary to assess the sector to the fullest. If needed, identify primary stakeholders who can assist in getting the right people to the table. Personal contacts are crucial, with cold colds being less effective than calls to acquaintances or references.
To facilitate scheduling, we recommend identifying multiple community representatives, staff or consultants who can facilitate the assessment meetings. This will increase the number of available dates/times for conducting meetings. In our experience, eight to 12 participants is a good target for a meeting – too many participants can result in rushed conversation. Be satisfied with a smaller turnout, and focus on getting participation from those individuals or organizations who would benefit or contribute most from the discussion.
The ideal stakeholder will have:
Strong working knowledge of their business or organization including supply chains, personnel management, and organizational strengths and weaknesses.

Page | 8 Oregon Partnership for Disaster Resilience
Solid sense of their sector as a whole – not solely focused on how their own business works.
Willingness to share insights and opinions, but who doesn’t tend to dominate discussions.
Experience working in the sector for some time (though not necessarily at the same organization).
Experience working locally for some time
For those sectors that are particularly difficult to convene:
Use both personal contacts and cold calls in order to increase the number of contacts
Call multiple branches of the same business (i.e. multiple store managers from a single grocery chain – it’s hard to predict who will be supportive)
When someone declines an invitation, ask them to suggest others in the sector that might be willing and interested.
Convene the sector that you have, not the sector you want to have – for example: interviewing local food producers and non‐profits may feel good, but rarely does local food production account for more than 5% – 10% of food consumed locally. Therefore, it’s important to invite representatives from the large grocery stores and businesses that are currently feeding the majority of your community.
Consider providing an incentive (payment for time or public recognition) to increase levels of participation.
The invitation should highlight several points:
This is a community project aimed at enhancing community resilience and business continuity in the event of a natural hazard.
Invitees are asked about their knowledge of the sector generally, not specific business details.
Staff can split the time –it’s not absolutely essential that the same person attend both meetings.
Invitees can attend one meeting but not the other.
Stakeholder Discussion
There is significant value in the information shared among participants during the meeting – regardless of printed summaries and other products. Stakeholders invited to the assessment meeting must be capable of covering a diverse range of topics as a representative of their sector.
The general and specialized knowledge required to realistically assess a given sector may require recruiting individuals from management as well as the line works of a sector. Opening the process to multiple levels of involvement will benefit the final assessment of a given sector and create a more robust CVA process.
An understanding of the following topics is important to the CVA process:
Organizational and management structures
Regulations, policies, politics, and budgets governing the sector

Hazard and Climate Vulnerability Assessment Tool: User Guide January 2014 Page | 9
Location of primary and secondary infrastructure
Known vulnerabilities within the sector at all levels
Current practices and future plans
Capacity and thresholds of the sector
Interdependences with other sectors
Projected growth and community needs
Scheduling
Scheduling the individual sector assessment meetings can be time consuming. In order to gain useful information, we found it necessary to hold a minimum of two three‐hour assessment meetings with all of the stakeholders at the table. Importantly, we do not recommend holding separate meetings for different stakeholders in the same sector for the following reasons. First, it adds time to the assessment process. Second, it eliminates the opportunity for information sharing among stakeholders.
Therefore, a key challenge will be finding a common time for multiple sector stakeholders, possibly from multiple organizations, to meet on the same day, at the same time. Note that scheduling the meetings may take a month or more advance notice to find common dates that work for invited stakeholders. Online scheduling tools such as “Doodle Poll” can be very helpful.
Meeting Materials
Assessment meetings will be more fluid and successful if background materials are provided to stakeholders before and during the assessment meetings. Materials can include agendas, maps, hazard scenarios and a copy of the questions included in the tool.
Maps
Maps can play an integral part of understanding where vulnerability is within the community. Although maps are not mandatory for the purposes of the vulnerability assessment, hazard and/or system infrastructure maps can provide a level of detail not captured elsewhere. In addition, maps can provide an easier format for conceptualization of hazards and a given system’s infrastructure locations throughout the community. If possible, ask a given sector’s representatives to provide maps of the specific details on the location of system components, which can be over‐laid with hazard maps to further understand and discuss sector‐specific vulnerabilities.
Scenarios
Developing hazard scenarios for the hazards being addressed is important for painting the picture of what could happen in an area. Scenarios will help sector experts conceptualize the possible effects of any given hazard or disaster. Even a scenario with little specific detail will help sector experts understand the potential impacts from a given hazard.
To develop the scenarios, first choose which hazards you want to assess based on your area’s threats, from chronic to catastrophic, and based on how much time you

Page | 10 Oregon Partnership for Disaster Resilience
have to run the assessment (One three‐hour meeting will typically get through 2‐3 hazards). Hazards to consider include earthquake, flood, wildfire, winter storm, and drought. For a full list of potential hazards, review your community Natural Hazard Mitigation Plan.
Climate change impact and fuel price fluctuation scenarios may also be desired. These scenarios should address weather patterns and delivery of services in the future (e.g. year 2050). The following provides a list of information to include within the hazard scenario:
Severity of hazard
Duration of hazard
Specific areas within the community that the hazard will impact (housing, business, etc.)
Impacts from hazards to the region that may affect community (transportation, etc.)
Death and injury predictions
How long it may take before outside help can arrive
Possible disruptions within other systems inside and outside community (cascading effects)
Scenarios are typically well‐written narratives about a paragraph long that describe the event and its impacts on your community. Include as many details as possible. Provide these scenarios before the meeting, and then read them aloud at the meeting to set the stage before assessing the sensitivity and impacts that hazard may have on the sector.
Vulnerability Assessment Tool
Finally, the assessment tool should be provided to stakeholders prior to the assessment meetings. Providing the questions in advance will allow stakeholders and system’s experts the opportunity to familiarize themselves with the questions and process. Stakeholders will be able to prepare much needed information in advance. Any advance information that can be provided to stakeholders will help ensure a more fluid and successful meeting process.
2. Ask tough questions and start a conversation
The tool is based on sets of questions that are asked of identified stakeholders in order to discover their sector’s particular strengths and weaknesses, and to compare them with other sectors. The Tool is divided into two major sections: ‘Adaptive Capacity’ and ‘Sensitivity and Impacts’. Each section needs a dedicated meeting to get through the questions, have a robust discussion, and ask any follow up questions.
Adaptive Capacity
The first section of the Tool will assess a sector’s Adaptive Capacity. Adaptive Capacity is a sector’s ability to predict and adapt to circumstances both within and beyond their control. Adaptive Capacity implies a sector’s resilience, or how quickly it can recover from an event, and in what form. The tool takes a snapshot of

Hazard and Climate Vulnerability Assessment Tool: User Guide January 2014 Page | 11
current system components, business activities and operations. The assessment is intended to provide a “base case” against which the sector is then “tested” against hazards, disasters, climate and fuel issues. The question sections and results of the Adaptive Capacity portion of the tool are as follows:
In order to get clear and complete answers to the Adaptive Capacity questions, ask follow up questions to discuss stakeholder assumptions, how they arrived at answers, what narratives inform their answers, what cross‐system conversations they may have, and what specific future scenarios they may be entertaining to arrive at their answers. If answers are related to specific data please ensure the source of the data is included in the answer. It is important to capture a description of the sector, including its uses and users, its physical boundaries (for example, the water system will extend from the upper watershed to the wetlands), its legal and contractual obligations to provide service, its ownership, and its primary and secondary infrastructure components. This sector description is intended to provide additional context for the answers.
Sensitivity & Impacts
The Sensitivity & Impacts section covers hazard sensitivity, hazard impacts, climate change impacts, and fuel price impacts. Hazard sensitivity is defined as the degree to which a natural, built, or human system is affected (either adversely or beneficially) by direct or indirect exposures to climate change conditions or hazards. Consider sensitivity in relation to the specific hazard or climate change impacts described in the scenarios. It is recommended to begin by using the non‐catastrophic hazards first, such as chronic but manageable ones, and move toward the catastrophic, worst‐case scenarios. You may ask the questions for each hazard, or ask the question once and consider each hazard successively.
Hazard impacts measure the degree of disruption due to a particular hazard that a sector may expect. These impacts are measured in terms of human, economic and physical disruption.

Page | 12 Oregon Partnership for Disaster Resilience
The last part of the Sensitivity and Impacts section address the uncertainties of climate change (estimates for the year 2050), and fuel price fluctuations ($10/gallon gas). Climate change can create additional or compounding stresses and impacts for systems.
A system that considers climate change as part of its planning can reduce its overall sensitivity/ vulnerability and create a more adaptive system overall. The cost of petroleum affects many systems and should represent a major consideration for planning and operations. Please consider the fuel questions in respect to fossil fuels and products derived from fossil fuels on which a sector may heavily rely. The average score for the Climate and Fuel section will be used as an “indicator”, expressing the trending impact these issues have on a sector. The uncertainties inherent in climate and fuel predictions forces these scores to be indicative only.
In discussing and answering the Sensitivity and Impact questions, document and record stakeholder assumptions, how stakeholders arrived at answers, narratives that inform answers, cross‐sector conversations stakeholders may have, and specific future scenarios stakeholders may entertain to arrive at answers. If answers are related to system specific data please ensure the source of the data is included in the answer.
Sector by Sector Differences
The tool questions for Sensitivity and Impacts were created to work across sectors (i.e. as well for the health sector as for the transportation sector). However, depending on which sectors are assessed, nuances will appear which emphasizes the differences between sectors. Because of this, some questions may not get answered by some sectors, or the experts find them inappropriate. It should be noted this only applies to the sensitivity and impact section. The adaptive capacity section has enough generality for all sectors to answer all the questions. Overall section scores will be averaged based on the number of questions answered in the section.
3. Record the answers and score results
Overview
In order to assess the results of a sector’s vulnerability assessment and make meaning out of the information the assessment, results need to be summarized and scored. For each sector assessment, an online survey form can be used to record comments, narrative and scores for each question. This project utilized the on‐live survey vendor Qualtrics to collect and catalogue data. We highly recommend using multiple note takers to simultaneously record scores and dialogue. Different note takers hear and record different information and the redundancy allows recorders to take a short break without disrupting the group

Hazard and Climate Vulnerability Assessment Tool: User Guide January 2014 Page | 13
conversation. The project team then compiled and compared the information. Finally, we applied individual scores to all of the questions asked in the assessment.
Scoring allows the user of the assessment tool to produce comparable metrics across sectors. We anticipate these data being used primarily by emergency managers and system technicians. However, the scores may also be useful in justifying mitigation measures to community officials and organizational managers after the assessment is complete.
General Steps in the Scoring Process:
1. Score all appropriate questions. 2. Complete sector‐specific spreadsheet for averaged scores. 3. Add sector averaged scores to master spreadsheet to get overall scores. 4. Use master spreadsheet to compare scores across sectors and hazards.
Assessment scores are intended to be informed by the collected narratives. Once scoring is complete, the scores can be analyzed and sectors, or hazards, prioritized. Results can include the least and most affected sectors for the following categories:
Overall Adaptability
Overall Vulnerability
Hazard‐specific vulnerability
Hazard‐specific risk
Interdependencies Across Sectors
Hazard‐specific climate or fuel impact trend
The following sections illustrate in detail how to score the different question types and reach end scores for the various categories. Use the methodology below for all sections within the assessment tool.
Scored Questions
Certain questions in the tool have answers that are ranked and scored during the assessment meeting itself. Stakeholders will have answered on a scale from 1 to 5 for each scored question, in both the Adaptive Capacity and in the Sensitivity & Impacts sections.
For Adaptive Capacity, 1 represents Low Adaptive Capacity, 5 represents High Adaptive Capacity. The higher the overall score the more adaptive the sector is presumed to be. High scores are considered “better” with respect to adaptive capacity.
The Sensitivity and Impacts section use a similar scoring approach where 1 represents Low Sensitivity/Impact and 5 represents High Sensitivity/Impact. However here, low scores indicate less sensitivity or impacts from the various hazards. In this case, low scores are considered “better” with respect to sensitivity and impacts.
These recorded scores are usually taken at face value and recorded directly into the sector‐specific spreadsheet. Occasionally note taker’s scores may conflict, or no

Page | 14 Oregon Partnership for Disaster Resilience
score was recorded during the meeting. If narrative information is available, the scoring methodology described below can be used to derive a score instead.
Narrative Questions
Scoring narrative questions will require more analytical thought and consideration. It is important to note that scoring the narratives involves multiple layers of subjectivity. Before scoring each narrative question it is important to compile the narratives from everyone who took notes during the assessment meeting. Using online survey tools will help facilitate this. Different individuals will capture and/or place greater importance on the topics discussed by the stakeholders. Having as much information as possible for each question will help form a more reliable score for each narrative question.
Multiple scorers should work together to score narrative questions in one session (approximately 45 minutes for each sector). It will be important to gain consensus amongst the scorers to determine the most accurate score. Each narrative answer should be discussed, and scorers should assign a score on a scale of 1‐5. Following this, a third (or fourth) assessor should review the scores for quality control and general appropriateness.
Once narrative scoring is complete it will also be important to have stakeholders themselves review the results of the assessment for agreement. The main objective of narrative questions is not to merely capture scores, but capture critical information, vulnerabilities, and interdependencies that may otherwise be lost if one is to only use scores from the assessment. Question narrative answers are highly important for the final summary assessment of each system and for the final community wide assessment.
Scoring Interdependencies
Adaptive capacity questions 5.2 and 5.3 ask sectors about their relationship or dependencies with other sectors. To score these questions, count the number of checked PRIMARY SYSTEMS ONLY, and use that total to record a 1 to 5 score according to the following scale:
# of primary systems checked
Relative score
11‐12 18‐10 25‐7 32‐4 40‐1 5
Adaptive Capacity Weight Factors
Once the Adaptive Capacity assessment is scored, both scored and narrative questions, a final Adaptive Capacity Score will be calculated with the sector‐specific spreadsheet (see below). The average score is determined by adding the total

Hazard and Climate Vulnerability Assessment Tool: User Guide January 2014 Page | 15
points for all questions and dividing by the number of questions answered. Note, the two final questions in each section are not included when calculating the average: “Are there any other questions we didn’t ask,” and “Based on our discussion, what do you feel is the adaptive capacity of this section?”
The final Adaptive Capacity Score will be on a scale between 1 and 5, with a low score indicating low adaptive capacity, and a high score indicating high adaptive capacity. The score will result in a corresponding adaptive capacity rating and weight factor. This weight factor will be used to “adjust” a sector’s overall vulnerability to a hazard up or down. For example, while a system like electricity may be very vulnerable to an earthquake, they may have adaptable systems to recover more quickly, and so their overall vulnerability will be lowered. This should be reflected in the weight factor, which will be 1 or lower, and so shift the overall vulnerability score down when multiplied. The table below illustrates the Adaptive Capacity weight factor:
Adaptive Capacity Value Scale Adaptive
Capacity Score Adaptive Capacity
Rating AC Weight Factor
1‐1.99 Very Low 1.50
2‐2.99 Low 1.25
3‐3.99 Medium 1
4‐4.99 High 0.50
5 Very High 0.25
Climate and Fuel Uncertainty Trend
The resulting scores from the climate change and fuel price questions are to be used in a unique way: as a trend. Because climate data and scenarios are constantly being updated, and because the market has such wide fluctuations for commodity prices, the most honest way to use results from this section is to show a general trend in sensitivity against particular hazards. For instance, climate and fuel uncertainty should not have any noticeable effect on the probability for earthquakes, so the trend arrow is neutral. For a sector that is vulnerable to wildfires, and climate change is predicted to increase likelihood of wildfires, that Hazard Score will be coupled with an upward trend arrow. This indicates that for this hazard and this sector, climate and/or fuel will increase their vulnerability in the long term. This information should help plan for future uncertainties sooner, and remain flexible as science refines its predictions.
Trend Arrows for Climate & Fuel Sensitivity:
Increasing Neutral Decreasing

Page | 16 Oregon Partnership for Disaster Resilience
4. Scoring Spreadsheets
OPDR designed several Excel spreadsheets to capture all the scores and generate average and total scores. All scores from the assessment sections are input into a sector‐specific Excel scoring template. Each sector’s Excel workbook has one sheet for adaptive capacity, and one sheet for sensitivity and impacts, with rows for each question number and the scored point values. One can also record any comments related to the reasoning for that score in the column provided. The excel template will then average each section score and compare the averaged value with the focus group’s overall assessment of that section (the last question in each section, which is not scored).
Once the sector scoring is complete the final averaged scores can be input into the Master Spreadsheet in their appropriate tabs and cells. Inputting the appropriate scores will populate the Analysis tab on the spreadsheet and provide final scores instantly. These scores can then be compared across hazards, sectors, or overall to help prioritize planning and funding projects. Scores should be shared with sectors and across sectors, checking in with experts and stakeholders to see if the scores and narratives make sense and are properly represented. If there are major differences between the average scores for each section and the estimated scores given by sector experts for the last question of each section, then sectors should continue the discussion to discover why the difference exists, or if there may be some error in the scoring.
5. Final Assessment Summary
The final step of the assessment process for each system will be to compile a summary sheet of scoring results and essential information learned from the assessment meetings. How the community chooses to formalize the final results and compile all systems’ results for the entire community will be based on the needs and desires of the community. We recommend short summaries of 2‐5 pages that include high level information and scores quickly accessible by policy makers and the public, as well as detailed analysis of the narratives for each section. Documenting critical system thresholds, interdependencies and potential mitigation or adaptations will help planners and sector experts use the information more substantially.

Appendix C: Sector summaries


Hazard and Climate Vulnerability
Assessment: Sector Summaries
March 2014
Final Report
Prepared for: The City of Eugene Office of Sustainability
The City of Springfield
Prepared by: Oregon Partnership for Disaster Resilience
A Program of the
Community Service Center

Climate Vulnerability Sector Summaries March 2014 Page | i

Page | ii Oregon Partnership for Disaster Resilience
SPECIAL THANKS
& ACKNOWLEDGEMENTS
This report, funded by the City of Eugene, the Federal Emergency Management Agency Hazard Mitigation Grant Program and the U.S. Department of Housing and Urban Development Office of Sustainable Housing and Communities Grant Program, presents a summary for each of the sectors evaluated. The project would not have been possible without the vision and leadership of Matt McRae and Babe O’Sullivan at the City of Eugene and Ken Vogeney with the City of Springfield. Results of this project will inform the 2015 update to the Eugene/Springfield Natural Hazard Mitigation Plan in addition to other local planning activities. This project utilized additional support provided by the University of Oregon’s Community Service Center.
Project Steering Committee:
Matt McRae, City of Eugene
Babe O’Sullivan, City of Eugene
Ken Vogeney, City of Springfield
Felicity Fahy, Eugene Water and Electric Board
Josh Foster, Oregon Climate Change Research Institute
Steve Adams, Institute for Sustainable Communities
Jeff Weber, Oregon Department of Land Conservation and Development
Myrnie Daut, City of Eugene
Stacy Burr, City of Eugene
Dr. Patrick Luedtke, Lane County Public Health
Forrest Chambers, City of Eugene
Project Manager:
Matt McRae, City of Eugene
Community Service Center Staff:
Josh Bruce, Interim Director, Oregon Partnership for Disaster Resilience
Mike Howard, Program Specialist, Oregon Partnership for Disaster Resilience
Casey Hagerman, Research Associate
Nick Metzler, Research Associate
Adams “AJ” Bernhardt, Student Intern

Climate Vulnerability Sector Summaries March 2014 Page | iii
About the Community Service Center
The Community Service Center (CSC), a research center affiliated with the Department of Planning, Public Policy, and Management at the University of Oregon, is an interdisciplinary organization that assists Oregon communities by providing planning and technical assistance to help solve local issues and improve the quality of life for Oregon residents. The role of the CSC is to link the skills, expertise, and innovation of higher education with the transportation, economic development, and environmental needs of communities and regions in the State of Oregon, thereby providing service to Oregon and learning opportunities to the students involved.
About the Oregon Partnership for Disaster Resilience
The Oregon Partnership for Disaster Resilience (OPDR) is a coalition of public, private, and professional organizations working collectively toward the mission of creating a disaster-resilient and sustainable state. Developed and coordinated by the Community Service Center at the University of Oregon, the OPDR employs a service-learning model to increase community capacity and enhance disaster safety and resilience statewide.
Hazard and Climate Vulnerability Assessment Participants:
The project team would like to thank the following people who shared their expertise in their sector to support the development of the Eugene Springfield Hazard and Climate Vulnerability Assessment:
Name Organization Title
Communications Sector
Josh Halbrook Comcast Manager local/federal compliance
Tim Reed Comcast CT 5 Fiber/Line Technician
Patricia Scarci City of Eugene IT Technical Operations Manager
Bill Stuart City of Eugene Radio Communications Tech
Rodney Lathrop City of Springfield IT Director
Marcy Parker City of Springfield Operations Supervisor
Bill Lundun Bicoastal Media Program Director
Robin O’Kelly Bicoastal Media Director of Engineering
Thomas Germaine Lane County ARES/Ham Radio operations
Emergency Coordinator
Tom Serio Verizon Wireless Manager, Business Continuity
Dave Kinder Verizon Wireless Government Account Executive
Drinking Water Sector
Brad Taylor Eugene Water and Electric Board Water Operations Manager
Joe Moll McKenzie River Trust Executive Director
Amy Chinitz Springfield Utility Board Drinking Water Source Protection Coordinator
Karl Morgenstern Eugene Water and Electric Board Source Protection and Property Supervisor

Page | iv Oregon Partnership for Disaster Resilience
Name Organization Title
Steve Ewing Eugene Water and Electric Board Water Distribution Management Technician
Ray Leopold Eugene Water and Electric Board Water Treatment and Supply Supervisor
Steve Fassio Eugene Water and Electric Board Control Systems Administrator
Kevin McCarthy Eugene Water and Electric Board Operations Support Services Supervisor
Ken Vogeney City of Springfield City Engineer
Bob DenOuden Eugene Water and Electric Board Business Support Analyst
Forrest Chambers City of Eugene Interim Emergency Manager
Kevin Fahey Eugene Water and Electric Board Business Continuity and IT Disaster Recovery Planner
Food Sector
Abe Zitterkopf Albertsons District Manager: S. Oregon
Nils Stark Cornucopia restaurants Owner
Tom Lively Organically Grown Co. Senior Sales Representative
Jeff Loyd Market of Choice Store Manager
Megan Kemple Willamette Farm and Food Coalition
Farm to School Program Director
Sarah Means Mizejewski
Lane County Community Economic Development
Economic Development Officer
Jason Lafferty SnowTemp Cold Storage General Manager
Lynne Fessenden Willamette Farm and Food Coalition
Executive Director
Marc Carlson Safeway Store Manager: 18th Ave.
Housing Sector
Ed McMahon Home Builder’s Association Director
Susan Ban Shelter Care Executive Director
Stuart Ramsing City of Eugene Building Official
Trevor Covington American Red Cross Regional Disaster Program Manager
Stephanie Jennings City of Eugene Grants Manager
Kaarin Knudson Rowell Brokaw Architects Project Designer, Planning Specialist
Michael Wisth City of Eugene Community Programs Analyst
Jim Wilcox Housing and Community Services Agency of Lane County
Energy Educator
Cece Newell Oregon Insurance Division Property and Casualty Analyst
Electricity Sector
David Pruitt Bonneville Power Administration Chief Substation Operator
Tony Toncray Lane Electric Cooperative Manager Construction and Maintenance
Jaime Cranmer Emerald People’s Utility District Communications and Customer Service Manager
Ron Dubbs Emerald People’s Utility District Engineering and Operations
Joe Jarvis Blachly Lane General Manager

Climate Vulnerability Sector Summaries March 2014 Page | v
Name Organization Title
Sanjeev King Springfield Utility Board Electric Engineering Manager
Michael Warren Springfield Utility Board Safety Environmental Manager
Felicity Fahy Eugene Water and Electric Board Sustainability Coordinator
Health Sector
Mark Walker McKenzie-Willamette Medical Center
Emergency Management Coordinator
Tracy DePew PeaceHealth Oregon Director Emergency Management and Security Services
Selene Jaramillo Lane County Health and Human Services
Preparedness Coordinator
Rick Hammel Community Health Centers of Lane County
Systems Manager
Deleesa Meashintubby
Volunteers In Medicine Clinic Executive Director
Tom Hambly PacifcSource Health Plans (Insurance)
Wellness Consultant
Shannon Conley Trillium Community Health Plan Chief Administrative Officer
Joanna Kamppi Eugene Fire and Emergency Medical Services
EMS Chief
Transportation Sector
David Warren Oregon Department of Transportation
Region 2 District Manager
Frannie Brindle Oregon Department of Transportation
Area 5 Manager
Chuck Mueller City of Eugene Engineering Associate
Steven Nicholas City of Eugene Terminal Maintenance Manager
Barnett Brian City of Springfield Traffic Engineer
Sarah Wilkinson Lane County Planner

Climate Vulnerability Sector Summaries March 2014 Page | i
TABLE OF CONTENTS
Sector Summaries ....................................................... 1
Drinking Water ........................................................... 3
Public Health ............................................................... 8
Electricity .................................................................. 13
Transportation .......................................................... 18
Food .......................................................................... 23
Housing ..................................................................... 28
Communication ......................................................... 34
Sources: ..................................................................... 41

Page | ii Oregon Partnership for Disaster Resilience
This page left intentionally blank.

Climate Vulnerability Sector Summaries March 2014 Page | 1
SECTOR SUMMARIES
This report contains short, three- to four-page sector assessment summaries for the following sectors within the Eugene/Springfield metro area:
Drinking water
Public Health
Electricity
Transportation
Food
Housing
Communication
Though not included in this summary, the following sectors will also be assessed:
Stormwater
Wastewater
Natural Systems
Fossil Fuels (Natural gas, gasoline, diesel)
Public Safety
The geographic boundary for this assessment is the area within the Eugene urban growth boundary and Springfield urban growth boundary. Due to the regional nature of some systems and hazards, areas outside of this boundary are discussed within some of the summaries.
The purpose of this document is to summarize the information collected during the hazard and climate vulnerability assessment process. These summaries include high level information including sector descriptions, an assessment of adaptive capacity, critical vulnerabilities, hazard specific sensitivities and key sector interdependencies.
The information summarized herein reflects information provided by key sector stakeholders during the assessment process. All raw notes from each meeting are available from the City of Eugene.

Page | 2 Oregon Partnership for Disaster Resilience
Figure 1 – Process Diagram
Source: Oregon Partnership for Disaster Resilience

Climate Vulnerability Sector Summaries March 2014 Page | 3
DRINKING WATER
System Summary
The Drinking Water Sector in Eugene/Springfield consists of two primary public utility providers: Eugene Water and Electric Board (EWEB) and Springfield Utility Board (SUB). Rainbow Water District also contributes to drinking water services in the Eugene/Springfield area. Some residents in the area also rely on privately owned wells but these sources are not covered in this assessment
This summary applies to the Eugene Water and Electric Board drinking water system. Other providers, including Springfield Utility Board, will be assessed in the future if resources allow.
EWEB Drinking Water Summary Table
Critical Interdependencies:
Systems of all types are dependent on other systems in order to function. In order to operate, this sector is particularly dependent on:
Energy
Transportation
Communications
Natural systems
Crucial Vulnerabilities:
Each sector has a number of vulnerabilities. For this sector, the following are particularly notable:
Single source for water
Treatment and filtration plant
Transmission lines
Aging infrastructure
Single regional source for chlorine (Washington)
Major Findings:
The EWEB drinking water system has relatively low short-term adaptive capacity. Planned long-term changes will mitigate some of the existing vulnerabilities and increase adaptive capacity over time.
An earthquake will have catastrophic impacts to the system. Other hazards are of much lower concern.

Page | 4 Oregon Partnership for Disaster Resilience
Primary Agencies & Organizations
Eugene Water and Electric Board
System Description
EWEB provides treated drinking water to residential, commercial, industrial, and public sector customers in the City of Eugene. The utility maintains a senior water right to collect water from a single source on the McKenzie River. EWEB has recently received another water right on the Willamette and is exploring options for improving a second water source using that right.
Water is collected via a dual intake pump located at Hayden Bridge in Springfield and delivered to a nearby treatment plant. The water treatment plant pre-treats, filters and treats the raw water for consumption. Two large transmission lines co-located in a single, seven-mile long trench deliver water to the Eugene City limit.
From there, primary, secondary and tertiary distribution pipes deliver water to customers. The distribution network contains approximately 800 miles of pipe (of various types) located throughout Eugene. EWEB maintains three primary reservoirs to store water, and a number of smaller reservoirs. Pressure to deliver the water is controlled largely from the filtration plant which is capable of serving approximately 85% of EWEB consumers. A system of pumps and reservoirs serve EWEB’s remaining consumers.
The physical system is supported by planners, engineers, operators and technicians. Revenue to operate, maintain and improve the system is generated through user fees and other public funding mechanisms. An elected board sets policy and governs decisions made by the utility.
Adaptive Capacity
Adaptive Capacity is a natural, built, or human system’s ability to accommodate a new or changing environment, exploit beneficial opportunities and/or moderate negative effects.
Overall, the EWEB drinking water system has low short-term adaptive capacity. Primary contributing factors include:
Single water source
Single filter plant
Lengthy transmission distance (seven-miles)
Collocated transmission lines
Aging infrastructure, in particular 800-miles of aging, expensive, in-ground infrastructure (pipes)
A large portion of the drinking water system infrastructure is aging in place. Technological advancements are difficult to implement due to overall cost of infrastructure replacement. System components are not easily replaced because they are underground and most often located within transportation rights-of-way.

Climate Vulnerability Sector Summaries March 2014 Page | 5
In addition, many of the major components of the system require custom design and manufacture.
The drinking water system is highly dependent on the natural systems (river and watershed) and energy in order to operate. Failure or impacts to either of these systems compromise EWEB’s ability to deliver water.
Long-term planning and management strategies are being considered to increase the resilience of the EWEB drinking water system. The utility is planning for increased population, including options for improving a second water source. Capacity maintenance planning activities are backed by a $250-million budget.
In addition, the utility is exploring options to expand the water system interties between the EWEB (Eugene) and SUB (Springfield) systems. Seismic upgrades to the water treatment plan and transmission capacity increases are also being discussed. All of these considerations will need to be balanced against the ability of the community to bear the costs associated with the improvements.
Vulnerability and Risk
Flood
Risks to the EWEB drinking water system from a major flood event are low. No catastrophic impacts to the EWEB drinking water are anticipated with a major flood event.
Most of EWEB’s critical drinking water infrastructure is located outside the 500-year flood zone or is already designed for and located in the river. The primary flood vulnerability identified by EWEB is the main pump at the Hayden Bridge intake. If flood water levels rose above Hayden Bridge (requiring a 500-year or larger event), flood waters could damage or destroy the pump, thereby eliminating EWEB’s ability to obtain water from the McKenzie. This scenario is considered extremely unlikely.
To a lesser extent, flood related debris in the McKenzie River could cause a temporary problem at the intake. However, EWEB is aware of this possibility and is prepared to respond quickly if it occurred. System stakeholders also indicated that flood impacts to transportation infrastructure could limit their ability to access drinking water infrastructure.
Lastly, a significant flood event could have minor, temporary impacts on the filtration process due to increased water turbidity. However, such impacts would be internal and would not influence the delivery of water to customers.
Wildfire
Risks to the EWEB drinking water system from a wildfire event are low to moderate. No catastrophic impacts to the EWEB drinking water are anticipated with a major wildfire event.
The EWEB drinking water system has a low to medium sensitivity to wildfire. Stakeholders cited some concerns related to water turbidity. These concerns stem

Page | 6 Oregon Partnership for Disaster Resilience
primarily from ash contaminating the water and clogging filtration and treatment systems during a wildfire event or longer-term turbidity impacts associated with post fire erosion. However, stakeholders indicated that these concerns are minor.
The system stakeholders also raised concerns associated with wildfire suppression efforts. The use of fire retardants and other chemical suppressants could contaminate the river. In addition, firefighting efforts rely heavily on potable water to suppress fires within the urban growth boundary. The need for potable water could potentially impact water availability (primarily reservoir served areas in the south hills) during a wildfire event occurring in or near the city.
Lastly, stakeholders indicated that wildfire related interruptions to the electricity grid could have major impacts. The water system is a major consumer of power for pumping and treatment. If power supply was compromised, EWEB’s ability to treat and deliver water would be impacted.
Earthquake
Sensitivity of the EWEB drinking water system to an M9.0 Cascadia earthquake is very high. A major earthquake would have catastrophic impacts to the drinking water system.
The EWEB drinking water system is highly sensitive to an earthquake hazard. The system’s entire primary and secondary infrastructure is within the hazard zone. Because much of the system is constructed of relatively inflexible material (concrete, metal and plastic), and requires undisrupted connectivity to function, it is highly vulnerable to ground motion, shaking and soil liquefaction.
System stakeholders anticipate potentially major damage to the treatment plant that is currently not constructed to modern seismic standards. In addition, between 400 and 500 miles of the 800 miles of pipe will be damaged or destroyed. EWEB’s main water transmission pipes are of critical concern. Replacement of critical parts and infrastructure could take up to a year to replace due to the customized nature of parts and a spike in regional demand caused by a regional earthquake event.
When this event occurs, curtailment plans will go into effect providing drinking water to only vital systems (e.g. fire suppression) and critical facilities (e.g. hospitals). Significant damage to the Hayden Bridge intake, the filter plant or the main transmission lines will cripple the entire EWEB system until repairs can be made. Damage to the electrical grid would also render the drinking water system inoperable.
Climate Change & Fuel Price Impacts
Climate Change impacts have the potential to exacerbate the impacts of flooding and wildfire on the Drinking Water system. Although flooding will still pose little threat to the Drinking Water system, wildfire sensitivities and impacts will increase, placing further strain on the system during wildfire events. Climate change will most likely mean less available water, especially during summer months due to reduced snowpack. However, water availability is not a critical concern, even with climate change, because of the unique geology of the McKenzie River watershed

Climate Vulnerability Sector Summaries March 2014 Page | 7
that stores water underground and maintains relatively constant flow. Low summer flow will impact fish populations and that may influence water availability. Predicted rising temperatures will also result in greater demand for water for agricultural irrigation.
Fuel price increases will likely translate to higher costs for operations and maintenance, which in turn translate into higher consumer rates. Rate hikes are usually met with apprehension and protest from the general consumer.


Page | 8 Oregon Partnership for Disaster Resilience
PUBLIC HEALTH
Sector Summary
The health sector is tasked with providing health services throughout the Eugene/Springfield metropolitan area through multiple agencies and service providers (e.g. hospitals, pharmacies, clinics, etc.) This sector also includes public health programs, typically managed at the state and county level that oversee prevention programs, monitoring, and disease management at the regional level. The system is complex, consisting of multiple layers of public and private service providers.
Health Summary Table
Critical Interdependencies:
Systems of all types are dependent on other systems in order to function. In order to operate, this sector is particularly dependent on:
Transportation
Waste Water
Wholesale/Retail Medical Supply Sector
Energy
Drinking Water
Communication
Public Safety
Crucial Vulnerabilities:
Each sector has a number of vulnerabilities. For this sector, the following are particularly notable:
Reliance on highly skilled human labor
Dependence on specialized equipment and access to laboratory and pharmaceutical services
Demand for service currently at or exceeding available supply
Highly regulated sector experiencing major regulatory transition
Primary care physicians are actively leaving the Lane County area.
Major Findings:
The health system maintains strong collaborative partnerships across service providers, both public and private. Hospitals and emergency care providers are designed to be very adaptable to short-term and some medium-term emergency (surge) situations. Redundancies are built into the system with the ability to scale up additional temporary capacity as needed. Federally Qualified Health Centers (i.e. Public Health Centers) are consistently maintaining high volumes with overflow going to emergency rooms or urgent care.
The health system is heavily reliant on highly skilled personnel (including specialized, primary and secondary caregivers) as well as specialized laboratory, diagnostic, and imagining equipment.
The sector is heavily regulated at the local, state, and federal level. Implementation of the Affordable Care Act nationally and Oregon Health Plan in Oregon is bringing a lot of immediate challenges but should result in greater certainty, once implemented.
The public health sector expects significant changes in both demand for and provision of care. For example, more residents will have access to health care with commensurate increases in demand. However, how this is balanced between the public and private sector care providers is unknown.
Climate change will increase the presence of and introduce new communicable and exotic diseases. The entire health system requires revenue from permit fees and insurance payouts to operate. The system is constantly changing and, as a result, is accustomed to dealing with new and emerging issues. Most residents feel their health
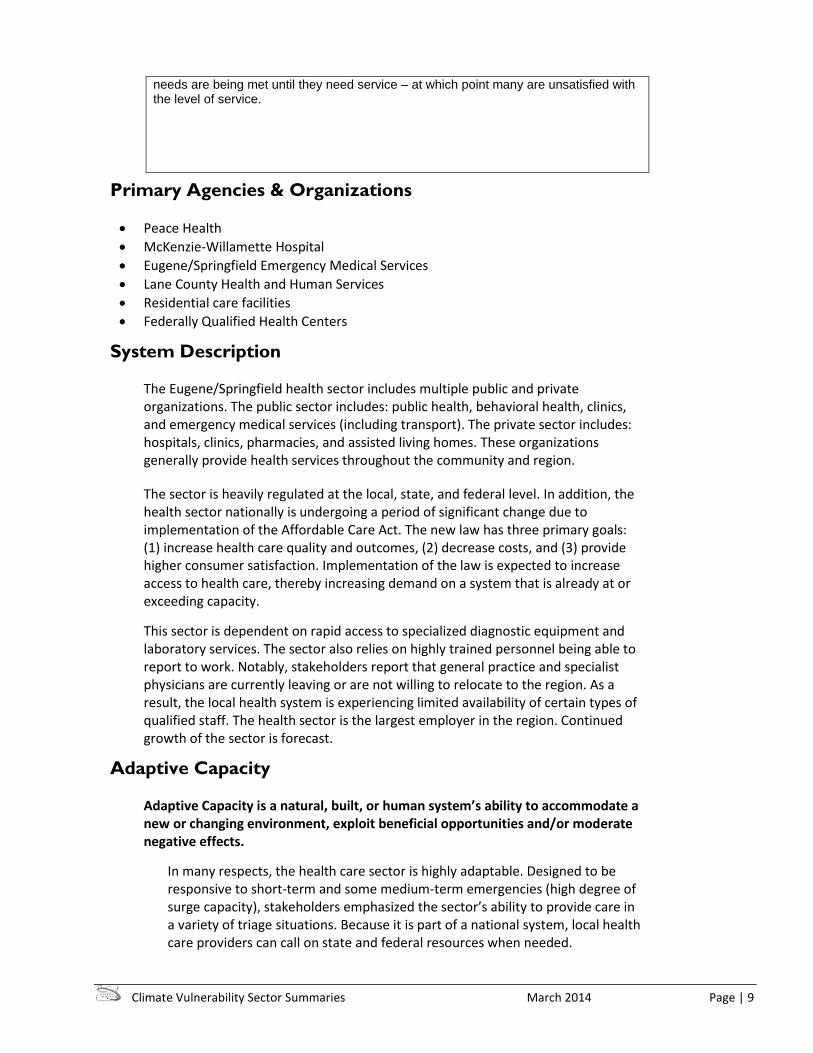
Climate Vulnerability Sector Summaries March 2014 Page | 9
needs are being met until they need service – at which point many are unsatisfied with the level of service.
Primary Agencies & Organizations
Peace Health
McKenzie-Willamette Hospital
Eugene/Springfield Emergency Medical Services
Lane County Health and Human Services
Residential care facilities
Federally Qualified Health Centers
System Description
The Eugene/Springfield health sector includes multiple public and private organizations. The public sector includes: public health, behavioral health, clinics, and emergency medical services (including transport). The private sector includes: hospitals, clinics, pharmacies, and assisted living homes. These organizations generally provide health services throughout the community and region.
The sector is heavily regulated at the local, state, and federal level. In addition, the health sector nationally is undergoing a period of significant change due to implementation of the Affordable Care Act. The new law has three primary goals: (1) increase health care quality and outcomes, (2) decrease costs, and (3) provide higher consumer satisfaction. Implementation of the law is expected to increase access to health care, thereby increasing demand on a system that is already at or exceeding capacity.
This sector is dependent on rapid access to specialized diagnostic equipment and laboratory services. The sector also relies on highly trained personnel being able to report to work. Notably, stakeholders report that general practice and specialist physicians are currently leaving or are not willing to relocate to the region. As a result, the local health system is experiencing limited availability of certain types of qualified staff. The health sector is the largest employer in the region. Continued growth of the sector is forecast.
Adaptive Capacity
Adaptive Capacity is a natural, built, or human system’s ability to accommodate a new or changing environment, exploit beneficial opportunities and/or moderate negative effects.
In many respects, the health care sector is highly adaptable. Designed to be responsive to short-term and some medium-term emergencies (high degree of surge capacity), stakeholders emphasized the sector’s ability to provide care in a variety of triage situations. Because it is part of a national system, local health care providers can call on state and federal resources when needed.

Page | 10 Oregon Partnership for Disaster Resilience
Stakeholders cited reports of improved health outcomes, a high degree of local collaboration and a system built on a triage/emergency response model to support their assessment that the system is adaptable. Stakeholders also emphasized that responding to climate change is pushing adaptation strategies throughout the sector. Adaptive capacity is strong with regards to:
Collaborative partnerships forged between both private and public service providers. These relationships are instrumental in providing quality health care services and responding to emergency events.
However, due to the size and complexity of the sector, local health care providers are limited in their ability to make local changes. For example, the sector is heavily regulated and providers must comply with minimum “standards of care” established at the state and federal level.1 Likewise, government reimbursements for care (Medicare and Medicaid) are often below the cost of providing care. These un-recouped costs are spread throughout the system, driving the price of care up for non-subsidized consumers and private insurance providers. Current demand on the sector locally is at or exceeding capacity. Universal health care and how services are paid for is a long-term issue. In the future, payments will likely be tied to patient outcomes.
Supply and waste stream functionality also limit the sector’s ability to adapt. The health system is a heavy user of the electricity, water, wastewater and transportation systems. It is also dependent on a wide variety of medical supplies provided by the private sector. While designed to continue functioning for 48 to 96 hours if one or more of those systems is not available, the standard of care rapidly deteriorates if access to primary support services cannot be re-established. As an example, the sector relies heavily on “just in time” delivery of medicines and pharmaceuticals. There are no local pharmaceutical stockpiles and strategic national stockpiles of critical pharmaceuticals are three to 24 hours away. The strategic stockpiles do not include supplies of standard prescription drugs available through the network of local pharmacies.
Key adaptation constraints include:
The health system heavily relies on revenue generated from services provided in both the public and private health sectors. Emergency events strain these revenue sources, hampering the ability for service providers to collect revenues from individuals and insurance companies.
Healthcare supplies and medications are consolidating under fewer and fewer companies, creating singular supply chains. Reliance on these supply chains is compromised in emergency events, making it difficult to receive
1 The “quality of care” standard is a regulatory measure set by federal and state agencies. It
determines the level of health care services a health care entity is required to provide to patients with a given illness or injury. While the regulation helps standardize the treatment process, adherence to the measure is compromised when the system is overwhelmed in a disaster. Given the expectation of limited staffing and supplies, compliance with the “quality of care” standard becomes difficult.

Climate Vulnerability Sector Summaries March 2014 Page | 11
critical supplies and medications. Facilities maintain a limited stockpile of medication that may last only 24-48hrs in an emergency event.
Maintaining and recruiting qualified health care professionals remains a challenge to both private and public entities as described above.
Vulnerability and Risk
Flood
Risks to the health sector from a major flood event are low. No catastrophic impacts to the health care sector are anticipated with a major flood event.
Transportation access (ingress and egress) is the primary flood concern for the health sector. With major flooding, access to the region’s hospitals could be limited. Localized flooding could also limit emergency responder access to certain parts of town. Impacts include limited ability to: receive and treat patients at area hospitals and clinics; maintain supplies and medications; and ensure medical staff can get to work.
The Peace Health River Bend Hospital lies very near the McKenzie river and may experience restricted access and may lose complete access to their Annex building (it was flooded in the 1996 flood). The annex houses Peace Health’s laboratory, supplies, and medical records. Limited access to the Annex would be a significant detriment to providing essential services and “quality of care.”
McKenzie Willamette hospital is well outside the flood zone. However, its backup generators for electricity are located in the basement. This is a concern for any localized flooding or stormwater system failure near the hospital.
Other potential flood sensitivities and impacts identified by the sector stakeholders include:
Sheltering of displaced populations,
Post flood health concerns (e.g. water borne disease, mold, toxic material abatement, etc.),
Access to drugs through pharmacies could be impacted if there are supply chain disruptions or limits on access to the pharmacies themselves, and
Potential short-term impacts to other on-demand medical supply chains.
Earthquake
Risks to the health sector from a M9.0 Cascadia earthquake are very high. A major earthquake would have catastrophic impacts on multiple parts of the health care sector.
The Health system is highly sensitive to impacts associated with a M9.0 Cascadia earthquake. Planning for this event is a high priority for the sector; the sector uses the M9.0 scenario as its worst case scenario.

Page | 12 Oregon Partnership for Disaster Resilience
An earthquake event would significantly impact the health system’s staffing, supply chain of critical supplies, and essential equipment. A surge of patients is expected to overwhelm the local system, forcing existing staff to work long and continuous shifts. Staff reductions beyond 20% are not sustainable long-term, particularly in certain skill positions. The need to bring in medical staff from outside the region following this event is almost certain.
With crippled transportation systems, the availability of medications, medical supplies, and equipment and lab services will be compromised. As noted above, the sector also relies heavily on the sanitary sewer and solid waste hauling. If wastewater and medical waste pickup is not available, the ability of the hospitals to function is severely compromised.
Finally, stakeholders expect that essential equipment for imaging and diagnosis could be damaged or destroyed, limiting both the functionality of labs and ability to meet a minimum standard of care. These losses are primarily related to the loss of secondary (non-structural) systems within the hospital. For example, the pharmacy uses a giant robotics system and runs 24-hours a day, seven days a week. Earthquake shaking is expected to damage that system. Numerous other examples of equipment losses, either from damage or needed recalibration, are expected. Some highly specialized equipment (e.g. the Gamma Knife) may take years to replace due to cost. Insurance claims and payees ability to provide revenue into the system may be suspended to provide immediate care and these costs may never be recovered. Patient tracking and billing systems are off site, so communication infrastructure becomes a critical vulnerability. Local communication is also a key vulnerability because a small number of calls can overwhelm the 911 system.
Climate Change & Fuel Price Impacts
Climate adaptation strategies are driving planning and system changes across the health sector. As temperatures increases, the health sector anticipates increases in disease and illness across the region. The region may also begin to see exotic and foreign diseases not previously seen in the Pacific Northwest. Physicians may or may not be prepared or familiar with these emergent diseases. In addition, increasing temperatures will increase the frequency of heat related illnesses and injuries. Increased incidents of wildfire in the region will decrease air quality and cause respiratory challenges, particularly for those who already suffer from respiratory ailments.
Fuel price increases will have an adverse effect on emergency medical services and transportation costs. Rising fuel costs are accounted for in annual budgets and will translate into higher costs for supplies and equipment, particularly those made of plastics and steel.

Climate Vulnerability Sector Summaries March 2014 Page | 13
ELECTRICITY
System Summary
The electric sector in the greater Eugene-Springfield area is comprised of five local utilities and one federal agency. Key components of the region’s infrastructure include power generation (e.g. dams), high-voltage transmission lines, substations, distribution lines, transformers, breakers, poles and meters.
Electric Summary Table
Critical Interdependencies:
Systems of all types are dependent on other systems in order to function. In order to operate, this sector is particularly dependent on:
Transportation
Natural Systems
Residential and business customers
Communication
Crucial Vulnerabilities:
Each sector has a number of vulnerabilities. For this sector, the following are particularly notable:
Aging infrastructure
Dependence on BPA for power
Lead time on ordering critical equipment (e.g. high-voltage transformers)
Lack of skilled labor
Major Findings:
The vast majority of electricity generation for the area is provided by the Bonneville Power Administration (BPA), with some local generation capacity through the Eugene Water and Electric Board (EWEB). As a result, the electric system is made up of a relatively small number of local companies with power supply largely provided by a single regional entity. Demand is low relative to current sector supply and capacity. However, the ability to add new hydropower generation is limited. The distribution system is highly interconnected resulting in system redundancy through power re-routing strategies.
The electricity sector is heavily reliant on highly skilled personnel (engineers, line workers, etc.). Due to retirements and a lack of trained people entering the field, workforce availability is a growing concern.
Earthquake is of major catastrophic concern for the sector. Wildfire and flood could both have minor impacts on the system, but are not a high concern overall. Notably, stakeholders indicated that wind storms and severe winter storms are a major chronic hazard concern for the sector. This is primarily associated with damage to overhead power lines and the resulting local power losses. The assessment did not address wind or winter storms specifically due to lack of time.
Climate change could impact both supply of and demand for power. Decreases in river volumes, whether due to drought or low snow pack, will limit hydropower availability in the region, particularly on the Columbia River, a primary source of hydropower. Similarly, heat events will drive up demand for electricity to operate air conditioning.
Fuel price increases will be passed on to the consumer. Power pricing is hard to forecast due to the complex nature of how power is used and for what purpose.
Stakeholders also noted that consumer’s view of electricity as a right, not a commodity, has changed how the utilities do business, i.e. customers have higher expectations while wanting a decrease in rates.

Page | 14 Oregon Partnership for Disaster Resilience
Primary Agencies & Organizations
Eugene Water and Electric Board
Springfield Utility District
Emerald People’s Utility District
Lane Electric Cooperative
Blachly-Lane County Cooperative Electric Association
Bonneville Power Administration
System Description
The electric sector in the greater Eugene-Springfield area is comprised of five local utilities and one federal agency. The local agencies are primarily responsible for the distribution of electricity to residential, commercial, industrial and institutional customers. Electric facility construction and maintenance is a key component of this sector’s responsibility. The vast majority of electricity generation for the area is provided by the Bonneville Power Administration (BPA), with some local generation capacity through the Eugene Water and Electric Board (EWEB).
EWEB primarily serves the City of Eugene, with some extended distribution to approximately 3,000 customers up the McKenzie River valley. The area’s largest electricity provider with approximately 91,000 customers, EWEB maintains 40 substations and an average load of 300 megawatts (MW). EWEB has capacity to deliver roughly one-million MW of power.
Springfield Utility Board (SUB) is the Springfield counterpart to EWEB. They serve approximately 32,000 customers and maintain nine substations. Three rural utilities make up the remaining service area in Eugene-Springfield Metro and surrounding areas of Lane County. Lane Electric Coop (LEC), Emerald People’s Utility District (EPUD), and Blachly-Lane (B-L) all are distributers of electricity. These rural providers maintain fewer substations, but more miles of transmission line. In general, capacity to supply power far exceeds current demand. The notable exception is B-L’s biggest substation, which is currently near capacity. However, they are already moving forward with plans to construct a new substation.
With the exception of EWEB, none of the local electricity providers generate their own power. Therefore, almost all local power is purchased from the Bonneville Power Administration (BPA). BPA operates 31 hydroelectric projects and one nuclear power plant. Operating as a branch of the Department of Energy, BPA is a federal non-profit funded by ratepayers. EWEB buys the majority (80-percent) of its power from BPA; remaining power is generated by hydro and other renewable energy projects owned by the utility.
Adaptive Capacity
Adaptive Capacity is a natural, built, or human system’s ability to accommodate a new or changing environment, exploit beneficial opportunities and/or moderate negative effects.

Climate Vulnerability Sector Summaries March 2014 Page | 15
The majority of the electric sector has a medium to high adaptive capacity due to the highly networked nature of the system and large amount of generation and distribution capacity. However, a few critical vulnerabilities limit the overall adaptability of the sector at a regional scale. In other words, the entire system can be taken down if certain critical and essential components are taken off-line.
Similar to the transportation sector, the average daily demand is drastically less than the maximum capacity. Additional capacity is based on 20-year population projections, so planning is done well in advance of increased consumer demand. EWEB’s system is run completely in parallel, meaning if there is damage along one line, or at one substation, the power can be re-routed via other lines. In addition, EWEB serves as a secondary system to both SUB, as well as the smaller, more rural utilities.
The electric sector is very responsive to customer needs. This is both a benefit and detriment to their adaptive capacity. While customer’s power needs encourage power reliability, regular upgrades, and quick repairs, the desire to keep rates down challenges the implementation of long-term plans that could increase resilience.
In the Northwest, electricity is primarily generated by hydroelectric power, which consists of 12 large dams on the Columbia River. While this provides low-cost, clean, renewable energy to the region, the lack of generation diversity is a potential vulnerability. Eighty percent of EWEB’s power, and all of the other utilities power, is generated by BPA via hydroelectric power. Therefore, regulatory, environmental or physical constraints that impact the Columbia River could have significant impacts on power generation in the region.
Finally, the electric sector is experiencing a labor shortage, particularly in high-skill positions. As with many other trades, the majority of electric line workers are due to retire in the next five years. These are highly skilled technical positions. This, in combination with limited numbers of young people pursuing secondary education and training in the electrical trades, is resulting in low availability of new line workers. Due to the extensive training required, the sector expressed a great deal of concern as line workers are the backbone of their operations.
Vulnerability and Risk
Flood
Sensitivity of the electric sector to a major flood event is low. No catastrophic impacts to the electric sector are anticipated with a major flood event.
The electric sector has a low sensitivity to floods. Inherently, electric transmission and distribution infrastructure is well protected, either buried underground or on overhead power lines. Nearly all of the substations for the five local utilities are out of the floodplain and therefore would not be compromised. For some of the utility companies operating in rural areas, access to their substations could become a problem if landslides are triggered by heavy rains. While this illustrates a critical interdependence with the transportation sector, flood sensitivity remains low.

Page | 16 Oregon Partnership for Disaster Resilience
Wildfire
Sensitivity of the electric sector to a large wildfire is low. A major wildfire event is not expected to have major impacts on the electric sector.
Similar to flooding, the electric sector has a low sensitivity to wildfire. The primary concern related to this hazard is power lines (transmission or distribution) that cross areas of forest. This makes the sector slightly more sensitive to wildfire than flooding. However, the utility companies are proactive in trimming and maintaining appropriate buffers.
Sensitivity to the wildfire hazard is largely based on the location of critical infrastructure. Only a small percentage of the system needs to be damaged before the entire sector is affected. However EWEB’s system is redundant in that if there is damage to one area, power can be rerouted through other lines. In this sense, EWEB also acts as a redundant system to the other four utilities, which do not have similar parallel systems.
Earthquake
Sensitivity of the electric sector to a M9.0 Cascadia earthquake is high. A major earthquake could have catastrophic impacts on multiple parts of the electric sector, especially if the event impacts critical components (e.g. high-voltage transformers, dams, major percentage of distribution, etc.).
The electric sector is sensitive to earthquakes. A major earthquake event would likely impact major parts of the generation, transmission and distribution systems. Stakeholders expressed particular concern for substations, underground lines and other physical infrastructure (e.g. poles). Should a small number of utility poles fail, they will tend to pull others down with them, creating a cascading impact. Impacts to the transportation network would limit access to infrastructure, further hampering repairs. It is assumed that BPA could be off-line for months.
The extent of damage to critical infrastructure will dictate how long it takes to bring the sector back on line. There are no stockpiles of major equipment locally, since equipment is expensive and largely made to order. Much of the specialty equipment takes months to manufacture and would be in high demand across the entire region following a regional earthquake of this magnitude.
The dependency of other sectors on the electric grid (energy, public health, communications) makes it even more sensitive. For example, with no electricity, fuel cannot be pumped into emergency vehicles, work trucks or equipment needed for recovery. This situation is further exacerbated by the Northwest’s reliance on hydroelectric power. If one or more dams on the Columbia River were to fail, the resulting effects are unknown. There is currently no written plan for recovery.
Climate Change & Fuel Price Impacts
Power generation is a primary concern related to climate change. Because BPA is so heavily reliant on hydropower generation across the Columbia River basin, any climate related reductions in river water volumes could reduce power availability,

Climate Vulnerability Sector Summaries March 2014 Page | 17
increase price or both.2 Climate related impacts include: low snow pack or low rain years, changes in the Endangered Species Act for aquatic species, and increases in the number of wildfires.
Stakeholders also noted that while there is a significant amount of additional capacity to meet new demand, capacity to actually increase power generation is much lower. The interplay between the cost of power across primary types (e.g. hydro, gas, coal, nuclear) could also be impacted significantly as a result of climate change. Hydro-power is worth more as the price of fossil fuels increase. Conversely, higher prices could impact usage and demand.
Temperature increases specifically can directly impact transmission line ratings and capacity. This is an issue currently. Climate change could intensify the incidence and duration of these issues. In addition, higher temperatures will result in increased system load related to air conditioning. All of that is carried by the electric grid (as opposed to winter when gas, wood and other heating options can offset the demand for power during cold spells).
Fuel price increases will impact the cost to maintain and repair the system. The electricity industry relies on trucks and heavy equipment to service infrastructure. With revenue generated by rate-payers and ever-increasing pressure to keep rates down, the increase cost of fuel puts a strain on operating budgets. Cost increases will get passed on to the consumer.
Fuel price increases will also increase the number of electric cars. As a result, electricity demand will go up. Higher energy prices across the board may stimulate an increase in distributed generation. Notably, a more distributed electricity system will result in higher adaptive capacity and more resilience overall.
2 In contrast, Eugene’s water system is relatively unaffected by reduced snowpack because of
the unique geology that occurs in the upper reaches of the McKenzie River watershed that results in underground storage and slow release of water.

Page | 18 Oregon Partnership for Disaster Resilience
TRANSPORTATION
System Summary
The transportation sector within Eugene-Springfield is comprised of the road and bridge network, public transit network including buses and long distance trains, and the Eugene airport. These assets are operated and maintained primarily by public entities, with the exception of the freight and passenger rail network. The road and bridge network, in addition to the local bus network, comprise the majority of the transportation sector within the area. Agencies responsible for maintaining and operating these facilities are public and include the Oregon Department of Transportation (ODOT), Lane County Public Works, Eugene Public Works, Springfield Public Works, and the Lane Transit District (LTD). While most of the road and bridge network is automobile centric, these agencies are also responsible for constructing and maintaining the bike and pedestrian infrastructure in the region.
Transportation Sector Summary Table
Critical Interdependencies:
Systems of all types are dependent on other systems in order to function. In order to operate, this sector is particularly dependent on:
Business and Industry
Energy/Fuel
Communications
Housing
Crucial Vulnerabilities:
Each sector has a number of vulnerabilities. For this sector, the following are particularly notable:
The automobile transportation system relies heavily on gas tax revenue to fund maintenance. This creates a financial risk to the system as automobile traffic decreases and as vehicles become more efficient and people shift to alternate modes of travel.
Large scale, expensive infrastructure is very slow to change or adapt to new needs or demands.
The system relies exclusively on fossil fuels for construction, operation, and maintenance activities.
Hwy 99 provides a key backup route for N/S traffic on I-5 but could only service a fraction of the traffic moving on I-5.
There are few redundancies for E/W auto traffic using Hwy 126.
Major Findings:
The built system relies heavily on institutional standards for guidance, causing delayed implementation of new design or construction practices.
The adaptive ability of the transportation system arises from using different vehicles on the same road system – but vehicles are privately owned and adoption of new technologies is unpredictable. Road designs influence the diversity of vehicles being used.
There is a widespread need for well-considered evacuation plans for a variety of hazards.

Climate Vulnerability Sector Summaries March 2014 Page | 19
Primary Agencies & Organizations
Oregon Department of Transportation
City of Eugene
City of Springfield
Lane County
Lane Transit District
System Description
The transportation sector within Eugene-Springfield includes air transportation (passenger and freight), rail transportation (passenger and freight), roads for light vehicles, freight vehicles, buses and bicycles, and sidewalks for pedestrian traffic.
Roads are classified into four categories based on the number of average daily trips. The Appropriate Level of Service (ALS) is determined for roads and intersections. All roads in the region currently meet the pre-determined ALS except for Beltline Highway at Coburg Rd.
Multi-use paths serve non-motorized transportation modes. Much of the bicycle network consists of on-street bicycle lanes.
Lane Transit District operates conventional bus routes, a Bus Rapid Transit system that operates on fixed routes, and a Dial a Ride program for alter-abled customers.
The traffic management systems in both cities use controllers on the street that automate operation but do not adapt to changing traffic conditions. The system also connects to a central facility that uses a central server, software, and staff to manage traffic.
Adaptive Capacity
Adaptive Capacity is a natural, built, or human system’s ability to accommodate a new or changing environment, exploit beneficial opportunities and/or moderate negative effects.
Overall, the transportation sector has a low level of adaptive capacity. Primary factors reducing adaptive capacity include:
The automobile transportation system relies heavily on gas tax revenue to fund maintenance. This creates a financial risk to the system as automobile traffic decreases and as vehicles become more efficient and people shift to alternate modes of travel.
Hwy 99 provides a key backup route for N/S traffic on I-5 but could only service a fraction of the traffic moving on I-5. Many conditions that would cause traffic problems on I-5, such as flood, earthquake, and winter storm, would also affect road conditions on Hwy 99. However Hwy 99 would provide a good back up for isolated problems like toxic chemical spills or auto accidents.

Page | 20 Oregon Partnership for Disaster Resilience
There are few redundancies for regional East - West auto traffic using Hwy 126.
Large scale, expensive infrastructure is very slow to change or adapt to new needs or demands.
Large road and bridge construction projects are constrained in a number of ways:
Rising fossil fuel prices are increasing the material, equipment, and labor costs, pushing up on construction cost of already expensive projects.
Projects are highly dependent on federal funds that are becoming increasingly unreliable.
Project planning and construction is highly technical and reliant on specially trained staff and specialized equipment.
Projects require exceptionally long planning lead times.
In many cases, the lack of available public right of way creates a significant design constraint.
State and local governments rely heavily on federal funding to make repairs following a natural disaster. The distribution of funds for recovery and reconstruction is decreasing, increasingly politically charged, and will not cover the full replacement value of the asset.
Some local transit routes reach capacity during peak times – but this can be remedied by adding buses on these routes if funds are available.
Vulnerability and Risk
Flood
The transportation system overall is not especially vulnerable to flood. This is due in part to the localized nature of flooding resulting in just a portion of the system being directly impacted.
Those portions of the road network more vulnerable to flood are rural highways, local streets with chronic flooding conditions, local streets in the 500 year flood plain, and several off-street bike and pedestrian routes.
If I-5 were compromised, freight traffic would be interrupted as there are significant capacity limits on the primary alternate route, 99W, where it crosses the Willamette River at Harrisburg.
A number of transportation participants questioned the accuracy of the flood maps provided.
Winter Storm
The airport, local streets and highways are extremely sensitive to winter storms, particularly those that bring snow and ice. Because impacts are widespread across the region – and usually include surrounding agencies, the number of qualified staff available for response can be limited.

Climate Vulnerability Sector Summaries March 2014 Page | 21
Winter storms resulting in heavy winds can result in fallen trees and downed power lines, causing closure to that portion of the system until power lines are removed. Downed power lines can also bring power outages that shut down fuel pumps.
Earthquake
The transportation system is extremely sensitive to a M9.0 Cascadia earthquake. Earthquake recovery times for roadways would be weeks to months or even years, depending on the road in question.
Primary concerns include:
Bridge collapse o The post-earthquake serviceability of bridges built prior to the
1990s is questionable. The newly constructed I-5 bridge over the Willamette may be the only usable bridge in the area.
Landslides
Liquefaction
Rockfalls, and
Road blockage due to debris and fallen utility poles.
An earthquake of this magnitude would affect all communities in the region and all systems in the region, meaning that there is likely to be an extremely limited number of qualified personnel and materials available for response and recovery operations. Availability of staff for response and recovery is likely to be exacerbated due to staff tending to the needs of their own families.
Operational tolerances for railroads are very small so minor misalignments in tracks make rails unusable. Similarly, operational tolerances for runways are very small and cracks in runway surfaces limits landing for fixed wing aircraft.
The secondary impacts of broken pipes (under the roads) and downed power lines will substantially slow both the response and recovery.
Climate Change & Fuel Price Impacts
Extreme heat can cause worker safety risks and long term heat events can reduce the durability of asphalt road surfaces. Reduced snowpack will reduce the need for plowing on high elevation roads. Heavy downpours create a backup in the stormwater system that causes localized flooding over roads. If regulations are increased to protect species (fish for example) this creates more regulatory hurdles and associated design and operational constraints.
The system relies exclusively on fossil fuels for construction, operation, and maintenance activities. Increasing oil prices increases the cost of asphalt and reduces the ability to do basic maintenance. At the same time, higher fuel prices

Page | 22 Oregon Partnership for Disaster Resilience
will likely reduce the amount of driving people do, reducing gas tax revenues currently used for maintenance.
Higher fuel prices will likely shift some freight traffic to rail because it is more fuel efficient. For the same reason, it may also spur additional interest in developing high speed rail from Eugene to Vancouver. The speed of increase in fossil fuel price is a big variable and a big unknown. If prices increase over a longer period of time, systems and practices can adjust, however sharp increases in price over short time periods can be extremely disruptive.


Climate Vulnerability Sector Summaries March 2014 Page | 23
FOOD
System Summary
The food sector includes local Grocery stores, food processors, local and regional wholesalers and distributors, food storage in the Portland area, local food growers, and local restaurants. Not included in this assessment are the hundreds of out-of-region growers and processors that are responsible for producing and processing the majority of the food that is consumed locally.
Food Sector Summary Table
Critical Interdependencies:
Systems of all types are dependent on other systems in order to function. In order to operate, this sector is particularly dependent on:
Electricity
Transportation
Fossil Fuel
Natural systems
Crucial Vulnerabilities:
Each sector has a number of vulnerabilities. For this sector, the following are particularly notable:
The majority of food consumed in Eugene/Springfield is stored in Portland and travels down I-5 by truck and trailer.
Grocery stores stock only a three day supply of food
External influences on agriculture and transportation sector have an undue influence on the price and availability of food in Eugene/Springfield
Major Findings:
Local growers are impacted by flooding but flood is not a significant concern to the local food sector as a whole.
With the potential impact on electricity supply and the critical dependence on tractor trailers to distribute food from Portland to Eugene, winter storms can have a significant impact on the local food system.
An earthquake will have catastrophic impacts to the system. Other hazards are of much lower concern.

Page | 24 Oregon Partnership for Disaster Resilience
Primary Agencies & Organizations
Grocery stores
Food processors
Food storage and logistics companies
Regional food distributors
Local and regional growers
System Description
The local food sector is comprised of multiple private players typically categorized into sub-groups including: food producers (crops and livestock), food processors, food storage (cold storage, warehouses), food distribution, and retail food sales (dozens of grocers, more than 100 restaurants, and three school districts).
While the Eugene/Springfield area is known as a leader in the local food movement, the vast majority of the food consumed locally is grown elsewhere. It is harvested and either shipped to a processor or a storage facility. Large amounts of storage crops are stored near the area where they were grown. Large amounts of staples are stored in centralized distribution facilities, including Portland and the San Francisco Bay Area. Food is shipped to grocery stores and restaurants primarily by truck and trailer, where it is sold to individuals.
Adaptive Capacity
Adaptive Capacity is a natural, built, or human system’s ability to accommodate a new or changing environment, exploit beneficial opportunities and/or moderate negative effects.
Overall, the food sector has a moderate level of adaptive capacity.
Primary factors supporting adaptive capacity include:
Diversified food producers covering huge geographic area relying on a well- established distribution network.
Local ethic of information sharing among local actors in the food sector.
Primary factors reducing adaptive capacity include:
Extensive reliance on I-5 to bring in food from the north and south.
Limited stores of food in local grocery stores (three day supply).
A high rate of hunger locally, indicating food supply is not equitably distributed.
External influences on agriculture and transportation sector have an undue influence on the availability of food in Eugene/Springfield.
Heavy reliance on aging transportation infrastructure.
System reliance on fossil fuels and exposure to increasing fuel prices,

Climate Vulnerability Sector Summaries March 2014 Page | 25
The majority of the food consumed locally is grown, processed, and stored out of the area, but only a small percentage of the food consumed locally is produced overseas.
While most grocery stores use “just in time” delivery and hold only a three-day supply of food, most have additional capacity to store more food (up to six days supply) if provided with advanced notice.
In order to keep food fresh, restaurants similarly keep no more than 4 days of food on hand at any one time.
The region is well supplied with food, but it is not distributed equitably. Currently, 39% of people living in Lane County are eligible for food boxes.
Technology is allowing, and the Federal government is requiring improved tracking of food from farm to table that will enhance the ability to identify sources of food poisoning. The cost of implementing this technology will affect businesses and will be passed onto the consumer.
Within the recent economic downturn, the food sector remained the strongest economic sector in Lane Co. The Eugene/Springfield area hosts a number of national brand food processors including processors of non-dairy foods that are responding to dietary preferences and demand for allergen-free foods.
The Eugene/Springfield area has a notable ethic of information sharing within the food and agriculture sector. According to one participant, “In many other parts of the country, this [vulnerability assessment] meeting would never happen.”
For growers, maintaining access to non-patented seed is a growing concern.
Eugene/Springfield is fortunate to be located along a primary transportation corridor between California and Washington, both of which are significant food producing states.
Vulnerability and Risk
Flood
The food sector as a whole is mostly insensitive to flooding. Grocers, processors, restaurants, storage are primarily located outside the flood plain.
Because the best soils occur near the river, however, many local growers are extremely sensitive to flooding, particularly if they are growing winter crops. During wet years, growers may have to plant crops late in the season and growers risk losing topsoil, crops, livestock, and equipment in the flood zone. However, because most of the food consumed locally is imported, this flood risk does not translate into significant risk to the food system in Eugene and Springfield.

Page | 26 Oregon Partnership for Disaster Resilience
Winter Storm
The food sector as a whole is very sensitive to winter storms, particularly those storms that bring snow and ice.
Growers can lose infrastructure (greenhouses for example), crops, and livestock, particularly during extreme cold.
Grocery stores and restaurants rely heavily on food shipped in on Interstate 5. In the case of a closure of I-5, alternate routes can only handle a small portion of the traffic and alternates are similarly affected by winter storms. Winter driving conditions slow highway traffic, causing truck drivers to attain their legal maximum hours of driving (10 hours driving in a 24 hour period) before products arrive at their destination. This slows movement of all goods shipped by truck and trailer, including food destined for grocer’s shelves.
During winter storms, more residents travel to nearby grocery stores by foot. This favors those residents who live within walking distance of a grocery store and can compound challenges for those who do not.
Earthquake
Sensitivity of the food sector to a M9.0 Cascadia earthquake is very high. A major earthquake would have catastrophic impacts to the food sector.
The loss of electricity, availability of diesel fuel, and damaged transportation infrastructure are the primary concerns for grocers. Existing grocery stores are mostly new and should remain standing; however shelving is not typically bolted down. Broken food containers and defrosting foods are likely to result in spoilage of significant amounts of stock. This loss of product, coupled with disrupted distribution and expected runs on food suggest grocery stores will likely be out of food within a day or two of a major earthquake.
Like all sectors, grocery stores will likely experience limited availability of trained staff, as employees will be tending to their families first and foremost.
Local growers may have relatively little impact from a significant earthquake and, depending on the season, could be a source of food for some residents if coordination and transportation were worked out.
If an earthquake occurred during the summer, damage to critical irrigation systems and the potential for hazardous materials spills into open waterways would be a concern.
Climate Change & Fuel Price Impacts
The crops grown locally are already changing due to climate change and will continue to do so in the future. The uncertainty about the timing and degree of change creates increased risk for growers. Local growers will be impacted by changes in plant and animal pests and diseases and intensification of storms.

Climate Vulnerability Sector Summaries March 2014 Page | 27
Increased drought in Oregon and in other parts of the country will have a significant impact on agricultural productivity and food prices. This upward pressure on prices will be the primary climate impact to grocers.
Transportation of food relies exclusively on fossil fuels. Food production relies heavily on fossil fuel to operate equipment, for manufacture of conventional fertilizers and pesticides, and to produce feed for livestock.
Fuel surcharges are already being added to food invoices and these costs are passed on to the consumer. As prices increase, consumer preferences are likely to shift toward home food preparation and lower-cost foods.


Page | 28 Oregon Partnership for Disaster Resilience
HOUSING
Sector Summary
The housing sector includes owned and rental homes, both single family and multi-family structures, manufactured homes, assisted care facilities, and transitional and temporary housing. For sheltering purposes, this sector also includes hotels and other temporary accommodations.
Banking and financial institutions were unable to attend the assessment meetings.
Communications Sector Summary Table
Critical Interdependencies:
Systems of all types are dependent on other systems in order to function. In order to operate, this sector is particularly dependent on:
Electricity
Transportation
Drinking water
Sanitary sewer
Crucial Vulnerabilities:
Each sector has a number of vulnerabilities. For this sector, the following are particularly notable:
Most residents lack the savings and/or insurance required to weather significant economic challenges.
Economic shocks due to natural hazards, unexpected health expenses, or national economic conditions, can very quickly translate into housing instability and foreclosure.
There is currently very little, if any, excess housing stock in the Eugene/Springfield area.
Major Findings:
Housing not only provides shelter but acts as the delivery mechanism to access other primary services including water, electricity, and sanitation.
After a disaster many of those displaced will shelter by staying with family and friends, meaning social structures and relationships are an important factor in providing access to emergency shelter.
All natural hazards will disproportionately affect vulnerable populations such as seniors, lower income populations, those with limited access to an automobile, and those with limited English skills.
Primary Agencies & Organizations
Home Builders’ Association
Realtors
HACSA
St Vincent DePaul
City of Eugene
City of Springfield
Insurance providers
Lending institutions

Climate Vulnerability Sector Summaries March 2014 Page | 29
Sector Description
The Eugene/Springfield area consists of approximately 90,000 housing units, approximately two-thirds of which were built before 1980. For homeowners, a significant portion of a family's net worth is tied to their home meaning housing is both shelter and a significant source of financial stability. Unlike other sectors, housing is widely dispersed, privately owned, and highly individualized.
Adaptive Capacity
Adaptive Capacity is a natural, built, or human system’s ability to accommodate a new or changing environment, exploit beneficial opportunities and/or moderate negative effects.
Overall, the housing sector has a low level of adaptive capacity.
Primary factors reducing adaptive capacity include:
Housing design and construction is a process that typically takes a year or more to complete – and is not very flexible.
Home construction is an increasingly complex process with a high degree of regulation and requiring specialized skills. The current system does not make Do It Yourself construction feasible for most households.
Because housing is long-lasting, the overall local housing stock does not undergo significant change except in the realm of new construction.
Builders want to stick with the materials and techniques that they are familiar with, meaning there is slow adoption of new technologies.
Changes in trends of sizes, types, styles of houses occur very slowly.
Affordability: State and federal regulations have a huge influence on the cost of building, insurance, and overall affordability of housing. In the Eugene/Springfield area, affordable housing is full, with long waiting lists. This is influenced by several factors:
Construction costs alone (the price of materials and utility infrastructure, but leaving out the cost of land) are above people's ability to pay;
Incomes in the area are lower than average and poverty rates have doubled in the last 40 years and remain high;
The median household income in the region does not match the median housing cost, resulting in 50% of renters and 25% of owners in the area paying more than 30% of their income for housing – defined as “housing burdened”. This results in compromising on cost of food, health care, transportation, and other necessities.
Long standing federal subsidies for affordable housing have recently diminished.
Energy costs for home heating are increasing.

Page | 30 Oregon Partnership for Disaster Resilience
Construction: Due to changes in construction techniques and technology, the seasonal nature of construction has been reduced over the last few decades. Construction now goes on year-round. The exception is earth-moving and excavation, which typically cannot be done from about November to April due to sticky, saturated soils.
When people seek an energy efficient home or a home with new technologies, rather than conducting retrofits, they tend to sell their existing home and build new. This results in fewer homes receiving the necessary energy efficiency upgrades. Oregon land use law limits the amount of new land available for home sites and other uses, yet redevelopment is more expensive than building on “green fields” that haven’t been developed. This results in somewhat higher costs for housing. There is currently very little, if any excess housing stock in the area. The UO student population (and enrollment rates) have a huge influence on the availability and affordability of rental housing and, due to UO calendar, the rental market peaks during the school year and slows substantially during the summer. Some who work in Eugene/Springfield seek less expensive housing in outlying communities including Coburg, Cottage Grove, and Veneta. Eugene has a complaint-driven rental housing code that requires property owners to meet basic standards of health and safety.
Insurance: Flood and earthquake are the largest areas of exposure, due to residents who are uninsured for catastrophic loss. In the case of home owners, the level of insurance coverage is typically driven by lenders. A very low proportion of renters maintain renter’s insurance.
Post-disaster recovery: Post-disaster recovery commonly creates a spike in demand for building permits. In communities undergoing post-disaster recovery, contractors will commonly move in from out of the area and an uncommonly large percentage of contractors will build without the necessary permits, particularly if the permitting system is unable to accommodate requests, and if enforcement is lax. Price gouging by unscrupulous contractors is a related concern that could be addressed by setting standards in advance of a large hazard event.
The cost of repairing or reconstructing a home after a disaster typically far exceeds the current assessed value. This is due to limited availability of materials and skilled workers after a disaster and because homes are required to be rebuilt to the newest state code, typically entailing increased expense.
Shelters: The capacity of organizations (Red Cross and others) to shelter the population will be exceeded if greater than one-quarter of the population needs to be sheltered. After a disaster, residents access shelter through mass shelters or by staying with

Climate Vulnerability Sector Summaries March 2014 Page | 31
family and friends. For this reason, social structures and relationships are an important factor in providing access to emergency shelter.
Vulnerability and Risk
Flood
Sensitivity of the housing sector to flood is relatively low. A significant flood would have significant localized affects but impacts would not be widespread.
The housing sector has a relatively low risk. There is a relatively small proportion of the Eugene/Springfield population that lives in the flood zone. Those residents in the flood zone could experience extreme financial hardship, while those residents outside the flood zone would be minimally affected.
Statewide about 1 in 6 people who live in the mapped floodplain actually have flood insurance. Existing FEMA flood maps are the regulatory driver for flood insurance – but do not reflect the real risk for any one owner. For those who are in the flood zone, flood insurance rates are expected to increase substantially in the near term due to changes in the National Flood Insurance Program (NFIP). The NFIP exempts mobile home parks from being insured in floodways. Mobile homes are considered "portable" and in Oregon are registered as vehicles, not homes.
Wildfire
Sensitivity of the housing sector to wildfire is relatively low. A wildfire in the fire-prone portions of town would have catastrophic localized affects but impacts would not be widespread.
Most home insurance policies cover damage due to a wildfire and there is a relatively small proportion of the population who live in areas that are highly susceptible to wildfire. Of those who do live in a highly susceptible area, only a small portion is likely to lose homes because those areas will experience extensive fire suppression.
Earthquake
Sensitivity of the housing sector to a M9.0 Cascadia earthquake is very high. A major earthquake would have catastrophic impacts to the food sector.
The Eugene/Springfield metro area experiences earthquakes so infrequently that the community is ill-prepared for the impacts – in contrast to areas of California that experience significant earthquakes frequently, resulting in a high degree of awareness and preparedness.
Following a significant Cascadia earthquake, very little of the housing stock is likely to be serviceable or declared habitable after a large earthquake. Roughly two-thirds of the local housing stock was built before 1980 - before builders and regulators were aware of the local seismic risk, so most homes do not have reinforcements to hold the building together or hardware to hold the building to its

Page | 32 Oregon Partnership for Disaster Resilience
foundation. On the positive side, the majority of homes in Eugene/Springfield are relatively small and wood framed – qualities that make them better able to withstand a seismic event.
Population Displacement: Approximately 20% of households in Eugene have earthquake insurance, yet nearly every home will be affected by a Cascadia earthquake. It is unclear how many people will continue to pay the mortgage on a home if they are unemployed and their home uninhabitable. For those who have earthquake insurance, if it is inadequate to bridge this significant financial gap, the insurance may provide only an illusion of security. The long-term economic disruption caused by earthquake could cause large scale displacement of families seeking work and more stable living conditions.
Recovery: Earthquake impacts will be experienced across the region and including the entire Willamette Valley and the Oregon coast. This will result in long recovery times and scarcity of materials, resources and skilled tradespeople to support recovery.
Business continuity plans for local businesses and continuity of operations plans for major area institutions (governments, schools, utilities) are essential to reducing the length of economic disruption caused by a large earthquake. Rapid access to cash, loans, credit, and insurance disbursement will be essential to increase the speed of recovery. Residents in the region are making repairs and renovations to their homes without permits today. The proportion of people who would do un-permitted structural repair following an earthquake could be significant.
Post-disaster debris removal would likely have a negative impact on air and water quality. Separating toxic materials (asbestos, lead, and others) would be nearly impossible during the response and recovery phases.
Shelters: There are very few large structures (hotels, churches, or event centers) in the Eugene/Springfield area that are built to be inhabitable after a large earthquake. Before being used as shelters, buildings will need to be inspected by trained inspectors. The time of year when the earthquake hits will have a significant impact on the effects to residents. Many may be able to “camp out” in their homes or yards if the earthquake occurs in July. In January, the options would be substantially limited.
Climate Change & Fuel Price Impacts
Increased heat events are the primary concern, as the majority of homes in the Eugene/Springfield area do not have air conditioning. Low income families, seniors, and other vulnerable populations disproportionately occupy housing that is not equipped to provide cooling and, even if it is available, air conditioning is energy intensive and adds significant costs to monthly utility bills.

Climate Vulnerability Sector Summaries March 2014 Page | 33
Recent increases in energy prices appear to have encouraged energy conservation and seem to be influencing more energy efficient home designs. At the same time, the increase in transportation costs is already resulting in homes on the periphery losing value.
Lower income households spend a disproportionately high percentage of their income on home heating, electricity bills, and transportation costs. These households are extremely susceptible to financial disruption caused by rising energy prices and are unable to afford the new appliances, weatherization, and fuel efficient vehicles that can buffer the impacts.
Energy efficiency upgrades do not tend to be implemented on rental properties and most low income families are renting. The lowered utility costs do not tend to accrue to property owners so owners don’t tend to pursue incentives and upgrades. Renters who would benefit from lower utility costs are not in a position to implement energy efficiency measures. This is often referred to as the renter’s paradox.

Page | 34 Oregon Partnership for Disaster Resilience
COMMUNICATION
Sector Summary
The communication sector includes broadcast television and radio, telephone, cellular phone, cable, internet, two-way radio, and Ham (or amateur) radio.
Broadcast television representatives were unavailable for this assessment but according to broadcast radio representatives, the two technologies are similar in their capacities and vulnerabilities. Conventional telephone representatives did not participate. Telephone infrastructure is very similar to cable infrastructure and would be expected to respond similarly to natural hazards.
Communications Sector Summary Table
Critical Interdependencies:
Systems of all types are dependent on other systems in order to function. In order to operate, this sector is particularly dependent on:
Electricity
Transportation
Crucial Vulnerabilities:
Each sector has a number of vulnerabilities. For this sector, the following are particularly notable:
While the broadcast radio system itself is very resilient, studio staff rely on cellular communications, phone, and internet to receive important information from officials to broadcast during and after a hazard event
All systems rely on electricity for operation and maintain generators for backup power. Generators rely on fossil fuels to operate leading to questions about what systems and services would be prioritized for fuel use if there were a disruption to fuel supply.
All systems rely on infrastructure (towers, antennae) spread across large areas – and often in remote locations. Road access to repair equipment is a primary concern.
Major Findings:
Communications technologies cannot be lumped together. There are a number of significant differences. For example, broadcast radio relies on a small number of owners of very old technology using relatively inexpensive equipment, producing one-way communication that can be accessed by anyone. Cellular phone technology is comparatively expensive, relies on thousands of private individuals to own equipment, changes annually (or more frequently), and provides two-way communication but is only accessible to those who can afford access.
There is a local broadcast radio station that, using federal funds, has been hardened to survive substantial earthquake and electromagnetic pulse.

Climate Vulnerability Sector Summaries March 2014 Page | 35
Primary Agencies & Organizations
Television stations (KVAL, KMTR, etc.)
Radio stations (KUGN, KLCC, etc.)
Cellular communications providers (Verizon, AT&T, etc.)
Municipal two-way radio communications (Cities of Springfield, Eugene)
Cable service providers (Comcast, CenturyLink, etc.)
Ham operators
Telephone service providers
Adaptive Capacity
Adaptive Capacity is a natural, built, or human system’s ability to accommodate a new or changing environment, exploit beneficial opportunities and/or moderate negative effects.
Overall, the communications sector has a high level of adaptive capacity. Primary factors supporting adaptive capacity include:
Numerous systems utilizing a variety of technologies together create redundancy.
All communications systems have some form of backup power to provide electricity in the event of a power outage.
Wireless (cellular) communications systems have portable cellular towers to provide temporary service restoration in the event of an emergency.
There is a local broadcast radio station that, using federal funds, has been hardened to survive substantial earthquake and electromagnetic pulse.
ODOT maintains a Strategic Technology Reserve trailer locally that includes two-way radio and satellite communications equipment.
The communication systems described here are a lynchpin for effective emergency management operations.
Broadcast radio and publicly operated two-way radio communications are both financially constrained – whereas cellular phone and cable companies have the necessary resources to operate and upgrade systems.
Cellular communications: All cellular communications towers are connected to data centers that transfer information from wireless to a ground-based (cable) network. Therefore, the loss of cable network translates into a loss of cellular service.
The vast majority of cellular communications towers have backup power systems designed to operate for 4 to 8 hours and cellular systems can have quick recovery through use of portable, self-contained Cellular on Wheels and Cellular on Light Trucks. In addition national cellular service providers have nationwide systems and staff who can be called in to assist in recovery following a disaster.
Because cellular technology is constantly being upgraded, it can evolve quickly to incorporate new technology
Page | 36 Oregon Partnership for Disaster Resilience
Broadcast Radio:
The broadcast system operates with few staff on very old technology using relatively inexpensive equipment and is resilient to many natural hazards. It can serve 1 person or thousands with no change in operation. However, while the broadcast radio system itself is very resilient, studio staff relies on cellular communications, phone, and internet to receive important information from officials to broadcast during and after a hazard event.
KPNW infrastructure in the region has been hardened by FEMA to survive a substantial earthquake and substantial electromagnetic pulse. While the station infrastructure is hardened, there are fewer than 5 technicians in the county and 12 in the state who have the necessary skills and experience to make repairs to the broadcast radio system. There are fewer still who have keys to access buildings to make repairs in an emergency. Finally, accessing transmitters and receivers in remote locations, commonly on exposed ridge tops, can be very difficult following a disaster.
Municipal Two-way radio:
LRIG, the Lane Regional Interoperability Group, provides two way communications extending from the Pacific all the way east to the cascade foothills and services most regional emergency response teams except for Springfield Public Works. Springfield Public Works’ two-way communication system is limited by the number of radios in City vehicles and is not interoperable with other local government systems, including Springfield Police Department. Federal funding is available for upgrading two-way communications for public safety including fire/ems and police, but other first responders including Public Works are specifically written out of these granting opportunities.
Most of the LRIG system is hosted on Comcast or other privately owned cable lines. In fact, municipal communications systems are increasingly relying on private systems, including internet and cellular technologies. Springfield, Eugene, Lane County, and school districts operate on a shared IP based phone system.
Ham radio:
The Ham radio system is operated primarily by volunteers with volunteer owned equipment. These unpaid and knowledgeable operators are the critical link in the system that serves as a backup communication network for the worst-case scenario natural hazards. The Ham radio system is very resilient, has a long range, and can operate with minimal equipment and minimal electric power. The system relies on numerous repeaters, including several stationed in county buildings.
Cable/Internet:
Cable service providers depend on hundreds of miles of cable strung on utility poles primarily owned by EWEB. At three different sites in the metro area, cable information is transitioned to fiber optic cable running through two parallel redundant fiber optic cables that extend from Seattle, WA to San Jose, CA. On the University of Oregon campus there is a central hub servicing internet to
Climate Vulnerability Sector Summaries March 2014 Page | 37
government and schools. If this hub is damaged, it would limit internet service for these users.
Like cellular communications, many cable providers are national corporations with staff across the country who can be called in to assist in recovery following a disaster.
Vulnerability and Risk
Flood
The communications sector is not very sensitive to flood and, while the City of Eugene police department is located in a flood zone, there are special protocols in place to handle flood conditions.
Winter Storm
Communications systems are sensitive to winter storms – particularly wind or ice events that impact power and cable lines and snow and ice that limit access to remote infrastructure, slowing repairs.
Earthquake
Sensitivity of the communications sector to a M9.0 Cascadia earthquake is very high. A major earthquake would have catastrophic impacts to the communications sector.
Not only would long term power outages be a big challenge for all systems, limited road access to infrastructure would be a primary constraint slowing response and recovery The City of Eugene has data (required for public safety operations) backed up, but all back up storage is within the Willamette Valley making the backed up data susceptible in an earthquake. While Springfield’s primary communications center is not expected to survive a large earthquake, the City of Eugene’s primary communications center is seismically sound. If one utility pole goes down due to an earthquake, it tends to pull others over with it. If utility poles fail then Comcast and telephone are lost, and there is likely a loss of power for all systems. If damaged, utility poles and power lines would also create blockage of roadways, slowing response and recovery times for communications and all other systems. Public systems and broadcast radio lack plans to care for staff and their families in the event of an earthquake or other catastrophic disaster. Staff may not be available to support response and recovery efforts if they are tending to the needs of their families. National companies that provide cellular communications and cable service could access technicians from other parts of the country.

Page | 38 Oregon Partnership for Disaster Resilience
Climate Change & Fuel Price Impacts
Extreme heat events are the biggest climate-related concern as most equipment requires cooling of some kind. Power loss during a heat event could become a liability, and, while most service providers have backup generators, operating air conditioning units draws a lot of power.
The systems described here rely to varying degrees on fossil fuels for daily operation, primarily for moving personnel and maintenance equipment.


Climate Vulnerability Sector Summaries March 2014 Page | 39
Hazard/Threat Scenarios
The following scenarios have been used to inform the assessment of system specific vulnerabilities, risks and capability to adapt. These scenarios were provided to assessment participants to provide a basis for discussion of specific hazards.
Earthquake:
A major Cascadia event (9+ on Richter scale) causes significant shaking and structural damage to multiple critical facilities across the Eugene/Springfield Metro area. The event results in more than 100 fatalities locally (the majority in a single building collapse) and many more injured. Base utility outages (electric, sewer, water) affect all parts of the city and aren’t expected to recover for weeks; earthquake triggered landslides and soil liquefaction have damaged underground infrastructure throughout the metro region. The I-5 corridor is damaged with several bridges out both North and South limiting access to Salem and Portland; locally, bridge and roadway damage limits transportation access throughout the metro region. Given the extensive damage to communities throughout Oregon, Washington, northern California and British Columbia, basic materials, equipment and labor needed to commence infrastructure recovery are in short supply with priority being given to larger cities and metropolitan areas. Social and economic systems are severely impaired.
Flood:
Major flooding occurs along the McKenzie and Willamette Rivers over the course of a week. In some areas floodwaters greatly exceed the mapped 100-year flood zone. Evacuation orders are in place for multiple neighborhoods.
Wildfire:
In late September, several large wildfires are burning on a mix of public and private lands in the McKenzie and Willamette River watersheds west of Eugene-Springfield. In addition, a local wildfire is burning just south of the Eugene city limit within the UGB; the fire has burned several homes and is threatening two subdivisions in the south hills. Mandatory evacuation orders are in place for large portions of south Eugene; Springfield is on high alert. Smoke is impacting the entire metro area. The fires are precipitated by dry winter conditions the previous two years and above average summer temperatures. Extreme heat (100+) is occurring and forecast for the next seven to ten days impacting vulnerable populations and beginning to strain local medical services.
Landslide:
Several prolonged periods of intense rainfall falling on already saturated winter soils have caused multiple small landslides throughout the metro region in areas of steep slopes; primary impacts are to roadways. A larger, slow moving rotational slide is also impacting a residential area; the slide has destroyed or severely damaged several homes and is impacting a collector street. Several additional

Page | 40 Oregon Partnership for Disaster Resilience
residences are threatened. Rapidly moving landslides have also occurred in adjacent counties resulting in several deaths.
Winter Storm:
A cold front has created several days of low temperatures with daytime highs below the freezing point. In just two days 12 inches of snow have fallen and are capped with ½ inch of freezing rain. The weight has caused roofs on some older structures in town to collapse. Auto accidents in town have caused snarled traffic and placed high demand on public safety resources. Cold weather persists for a week and snow has exceeded the capacity of local governments to clear roads of snow and ice. Traffic on I-5 is slow and fraught with accidents. Power outages are occurring across town due to trees failing and downed power lines.
Upper Willamette Valley Climate Change Scenarios
2050: expected climate impacts
Average annual temperature increase by 3-6 F ⁵
Reduced precipitation in summer ⁵
Snowpack decline by 60% ¹
Storm events increase in intensity with more flooding ¹
Increased summer water shortages ²
Reduced summertime hydroelectric power ¹
Increase in extreme heat events ²
Increase in wildfire frequency and intensity ²
Shift in growing season duration and timing ¹
Earlier stream flow peaks ³
Increase in insects and plant pests ²
2050: Population and energy cost scenario
Fuel prices doubled ⁴
Commodity, food and materials prices doubled ⁴
Increased city population density ⁴

Climate Vulnerability Sector Summaries March 2014 Page | 41
SOURCES:
1. Preparing for climate change in the Upper Willamette River Basin, 2009. Climate Leadership Initiative.
http://www.theresourceinnovationgroup.org/storage/willamette_report3.1
1FINAL.pdf
2. Likelihood of climate risks for Oregon, from 2010 Oregon Climate Adaptation Framework.
http://www.oregon.gov/LCD/docs/ClimateChange/Framework_Final.pdf
3. Impacts of natural climate vulnerability on Pacific Northwest Climate, Climate Impacts Group, University of Washington.
http://www.ef.org/westcoastclimate/D_PNW%20impacts.pdf
4. Forecast based on extrapolation of current trends (last 15 years)
5. Oregon Climate Assessment Report, Oregon Climate Change Research Institute (2010), K.D. Dello and P.W. Mote (eds). College of Oceanic and Atmospheric Sciences, Oregon State University, Corvallis, OR available at:
www.occri.net/OCAR