climate & health vulnerability assessment€¦ · climate & health vulnerability assessment...
TRANSCRIPT

OREGON HEALTH AUTHORITY | CLIMATE AND HEALTH PROGRAM OHA (10.15)
Introduction
Climate & Health Vulnerability Assessment
PURPOSEThis vulnerability assessment is intended to inform public health professionals and community partners engaged in climate change adaptation and resilience planning. It focuses specifically on social vulnerability as a way to integrate the concepts of social determinants of health and environmental justice into climate change planning.
PROCESSThe Climate and Health Program developed this assessment in consultation with other grantees of the CDC’s Climate Ready States and Cities Initiative. The assessment is based on associations identified in research literature, which are summarized in the 2014 Oregon Climate and Health Profile Report.
The Climate and Health Program envisions this assessment being updated and expanded as our knowledge grows and conditions change. This first edition, published in Fall 2015, is limited to measures of population sensitivity. In the future, we anticipate adding measures of hazard exposure such as extreme heat, and adaptive capacity, such as access to air conditioning. Additionally, we hope to expand the composite vulnerability index in subsequent assessments to incorporate more measures of vulnerability, and we hope to add context by analyzing the key drivers in each community.
We acknowledge that maps of social and demographic characteristics do not tell the whole story. For example, there may be strengths that enable some communities to readily overcome vulnerabilities. This assessment is just one of many pieces of information that can help Oregon’s public health system prepare for the impacts of climate change.
FOR MORE INFORMATION
Contact:Climate and Health [email protected](971) 673-0335
Or visit:healthoregon.org/climate

OREGON HEALTH AUTHORITY | CLIMATE AND HEALTH PROGRAM OHA (10.15)
Population sensitivitySocial vulnerability
ABOUT THIS INDICATORThis index is a combination eleven indicators of social vulnerability including measures of demographics, socioeconomic status, and health. The indicators are drawn from US Census data and health statistics from the Oregon Health Authority. Each indicator is equally weighted, and the index is relative to other census tracts in the state. Census tracts shaded dark blue represent areas with higher social vulnerability. These tracts are distributed in many parts of the state, and largely overlap with broad indicators of socioeconomic status such as educational attainment.
HOW THIS INDICATOR IS RELATED TO CLIMATE VULNERABILITYIndexes such as this one are based on the work of Susan Cutter (1), which established associations between natural hazards and indicators of social vulnerability. They are used to help understand vulnerability to climate impacts in many jurisdictions (2, 3).
DATA SOURCESOregon Climate & Health Program, Public Health Division, Oregon Health Authority. July 2015.
See bibliography for references.
For more information, visit healthoregon.org/climate
Composite vulnerability indexCensus Tracts
Low
Medium
High
County borders
0 50 10025Miles

OREGON HEALTH AUTHORITY | CLIMATE AND HEALTH PROGRAM OHA (10.15)
Population sensitivityBirth outcomes
ABOUT THIS INDICATORThe percentage of births that are pre-term is an indicator of risks for infants calculated from birth certificate records. While darker blue represents a larger percent of preterm births, counties are mostly similar on this metric, varying between about 6% and 11%.
HOW THIS INDICATOR IS RELATED TO CLIMATE VULNERABILITYPreterm births are associated with extreme heat (1) and air pollution (2). Moreover, adverse birth outcomes like preterm birth or low birth weight are associated with problems during early childhood (3) as well as long term health effects including risk of cardiovascular disease (4). Existing illness such as those linked to adverse birth outcomes result in greater vulnerability to negative health impacts of climate change.
DATA SOURCESBirth Risk Factors: Oregon Birth Certificates, Center for Health Statistics, Center for Public Health Practice, Public Health Divsion, Oregon Health Authority.
See bibliography for references.
For more information, visit healthoregon.org/climate
Percent of infants born <36 weeks of pregnancy
Counties6.2% - 7.4%
7.5% - 8.1%
8.2% - 10.5%
County borders
0 50 10025Miles

OREGON HEALTH AUTHORITY | CLIMATE AND HEALTH PROGRAM OHA (10.15)
Population sensitivityChildren
ABOUT THIS INDICATORThe population of the youngest Oregon residents is unevenly distributed, as reflected in the above map showing the percent of the population within under age 18. Darker blue tracts indicate higher concentrations of children. Statewide, 22% of the population is under 18 years of age.
HOW THIS INDICATOR IS RELATED TO CLIMATE VULNERABILITYInfants and children are vulnerable to multiple climate impacts. Young children are more susceptible to extreme heat (1). Children are more vulnerable to environmental toxins of all types, since the same dose given to an adult is lower in proportion to body size (2). This makes children more sensitive to contaminated food, water, and air resulting from impacts of climate change. One study estimated that 88% of the additional burden of disease due to climate change falls upon children (3).
DATA SOURCES2009-2013 American Community Survey 5-year estimates. US Census Bureau.
See bibliography for references.
For more information, visit healthoregon.org/climate
Percent of population aged less than 18 years
Census tracts0% - 19.2%
19.3% - 24.2%
24.3% - 38.1%
County borders
0 50 10025Miles
OREGON HEALTH AUTHORITY | CLIMATE AND HEALTH PROGRAM OHA (10.15)
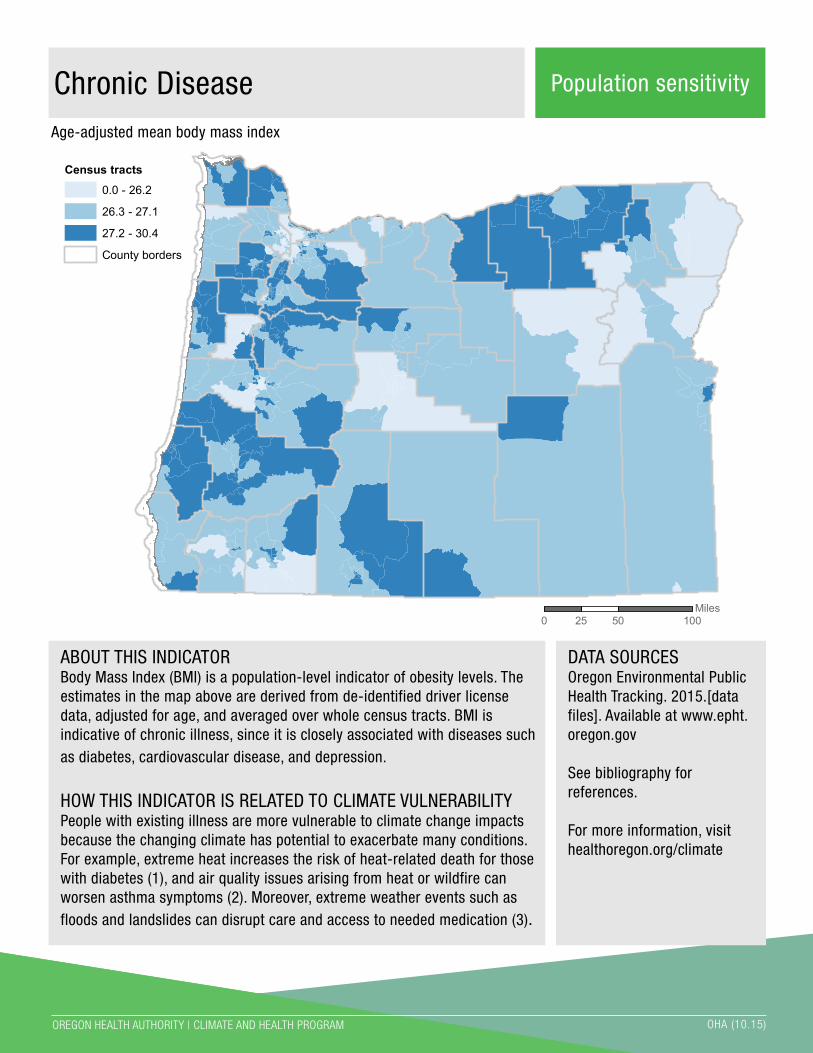
Population sensitivityChronic Disease
ABOUT THIS INDICATORBody Mass Index (BMI) is a population-level indicator of obesity levels. The estimates in the map above are derived from de-identified driver license data, adjusted for age, and averaged over whole census tracts. BMI is indicative of chronic illness, since it is closely associated with diseases such as diabetes, cardiovascular disease, and depression.
HOW THIS INDICATOR IS RELATED TO CLIMATE VULNERABILITYPeople with existing illness are more vulnerable to climate change impacts because the changing climate has potential to exacerbate many conditions. For example, extreme heat increases the risk of heat-related death for those with diabetes (1), and air quality issues arising from heat or wildfire can worsen asthma symptoms (2). Moreover, extreme weather events such as floods and landslides can disrupt care and access to needed medication (3).
DATA SOURCESOregon Environmental Public Health Tracking. 2015.[data files]. Available at www.epht.oregon.gov
See bibliography for references.
For more information, visit healthoregon.org/climate
Census tracts0.0 - 26.2
26.3 - 27.1
27.2 - 30.4
County borders
0 50 10025Miles
Age-adjusted mean body mass index
OREGON HEALTH AUTHORITY | CLIMATE AND HEALTH PROGRAM OHA (10.15)
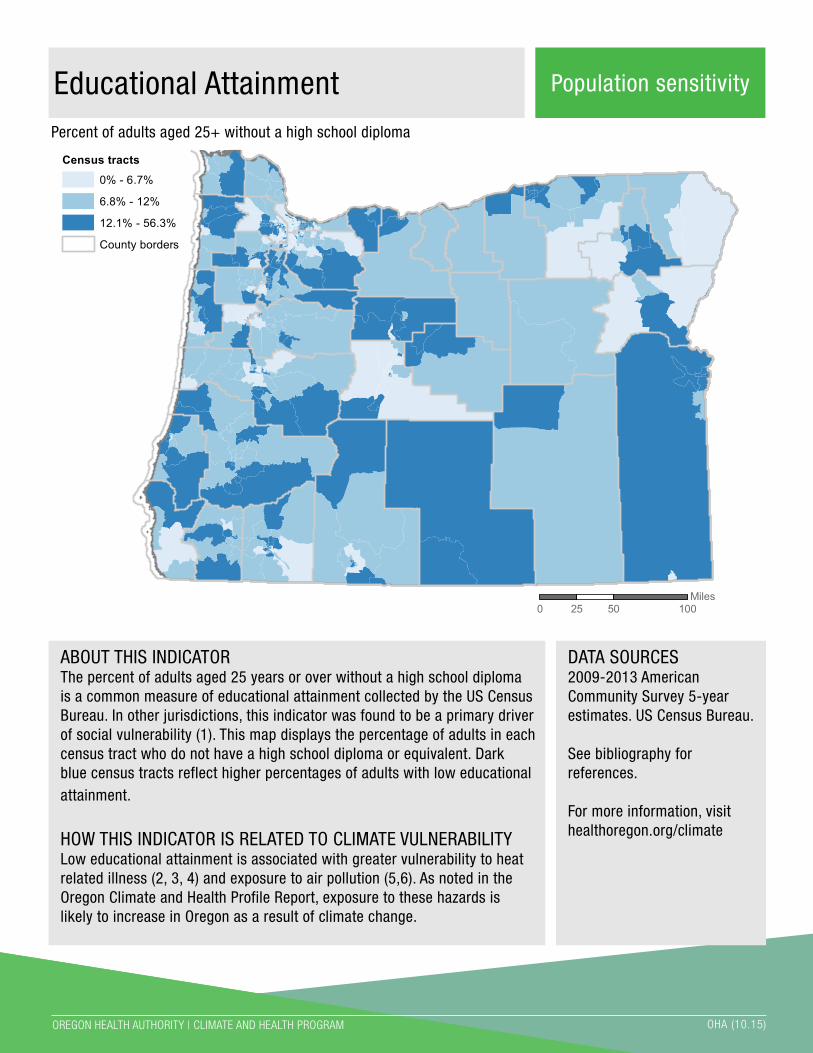
Population sensitivityEducational Attainment
ABOUT THIS INDICATORThe percent of adults aged 25 years or over without a high school diploma is a common measure of educational attainment collected by the US Census Bureau. In other jurisdictions, this indicator was found to be a primary driver of social vulnerability (1). This map displays the percentage of adults in each census tract who do not have a high school diploma or equivalent. Dark blue census tracts reflect higher percentages of adults with low educational attainment.
HOW THIS INDICATOR IS RELATED TO CLIMATE VULNERABILITYLow educational attainment is associated with greater vulnerability to heat related illness (2, 3, 4) and exposure to air pollution (5,6). As noted in the Oregon Climate and Health Profile Report, exposure to these hazards is likely to increase in Oregon as a result of climate change.
DATA SOURCES2009-2013 American Community Survey 5-year estimates. US Census Bureau.
See bibliography for references.
For more information, visit healthoregon.org/climate
Percent of adults aged 25+ without a high school diploma
Census tracts
0% - 6.7%
6.8% - 12%
12.1% - 56.3%
County borders
0 50 10025Miles
OREGON HEALTH AUTHORITY | CLIMATE AND HEALTH PROGRAM OHA (10.15)
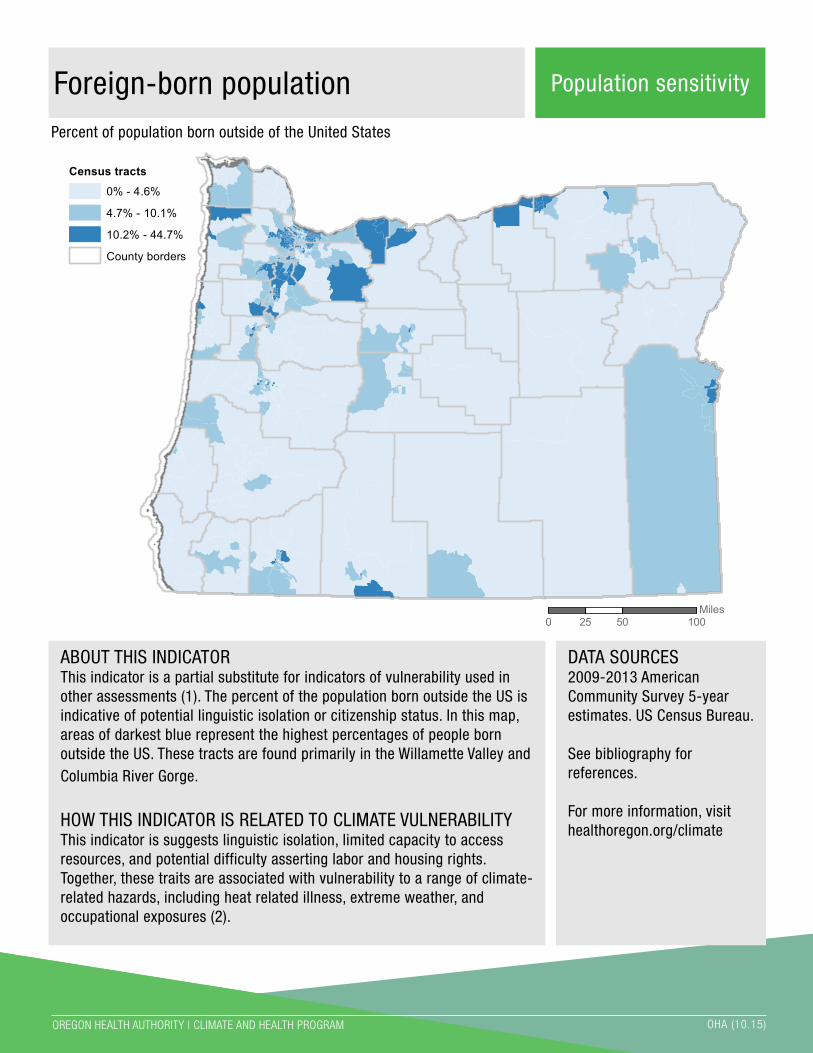
Population sensitivityForeign-born population
ABOUT THIS INDICATORThis indicator is a partial substitute for indicators of vulnerability used in other assessments (1). The percent of the population born outside the US is indicative of potential linguistic isolation or citizenship status. In this map, areas of darkest blue represent the highest percentages of people born outside the US. These tracts are found primarily in the Willamette Valley and Columbia River Gorge.
HOW THIS INDICATOR IS RELATED TO CLIMATE VULNERABILITYThis indicator is suggests linguistic isolation, limited capacity to access resources, and potential difficulty asserting labor and housing rights. Together, these traits are associated with vulnerability to a range of climate-related hazards, including heat related illness, extreme weather, and occupational exposures (2).
DATA SOURCES2009-2013 American Community Survey 5-year estimates. US Census Bureau.
See bibliography for references.
For more information, visit healthoregon.org/climate
Percent of population born outside of the United States
Census tracts
0% - 4.6%
4.7% - 10.1%
10.2% - 44.7%
County borders
0 50 10025Miles

OREGON HEALTH AUTHORITY | CLIMATE AND HEALTH PROGRAM OHA (10.15)
Population sensitivityIsolated older adults
ABOUT THIS INDICATORThe percent of households that are single-person aged 65 years or older indicates the co-occurrence of two types of vulnerability: advanced age and social isolation. Social isolation can take many forms, but this indicator from the census is among the most readily available. The map above shows high percentages of single-person older adult households in dark blue. Unlike the percent of adults aged 65 or older, the percentage of single-person older householders shows a less distinct spatial pattern.
HOW THIS INDICATOR IS RELATED TO CLIMATE VULNERABILITYSocial isolation can result in a lack of supportive contact networks that can be relied upon in extreme conditions. This indicator is associated with greater vulnerability to extreme heat (1, 2).
DATA SOURCES2009-2013 American Community Survey 5-year estimates. US Census Bureau.
See bibliography for references.
For more information, visit healthoregon.org/climate
Percent of households that are single-person aged 65 years or older
Census tracts0% - 7%
7.1% - 11.1%
11.2% - 40.3%
County borders
0 50 10025Miles
OREGON HEALTH AUTHORITY | CLIMATE AND HEALTH PROGRAM OHA (10.15)
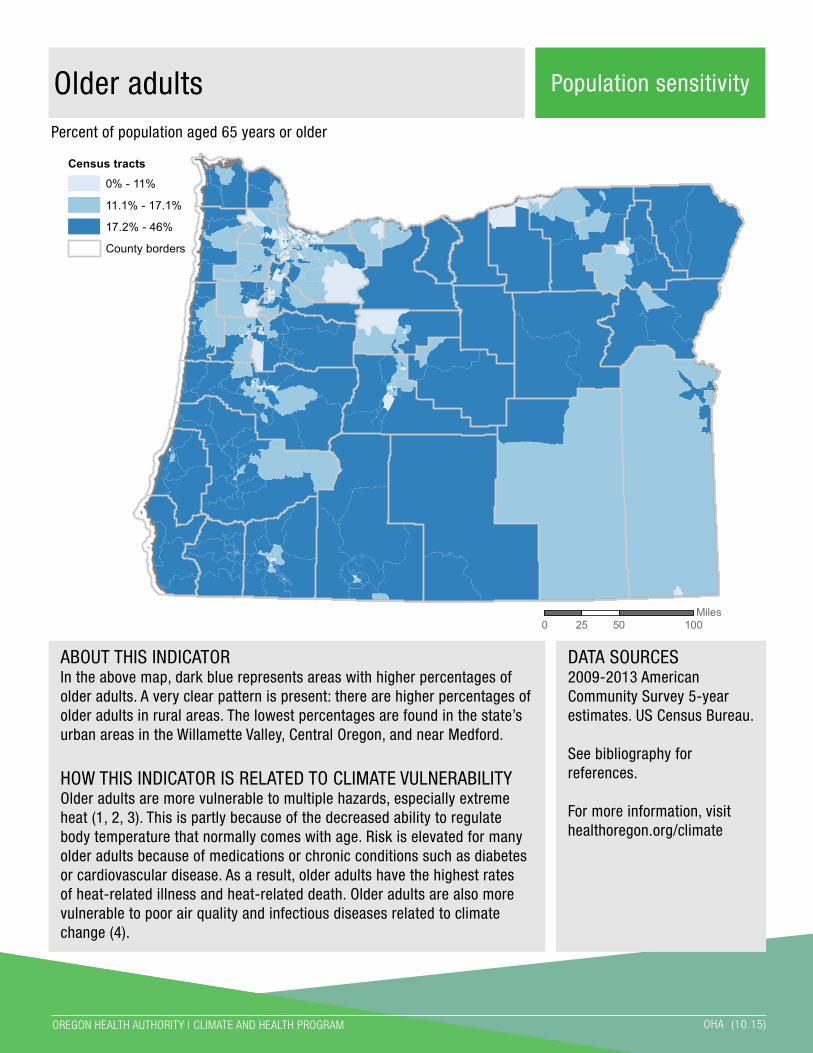
Population sensitivityOlder adults
ABOUT THIS INDICATORIn the above map, dark blue represents areas with higher percentages of older adults. A very clear pattern is present: there are higher percentages of older adults in rural areas. The lowest percentages are found in the state’s urban areas in the Willamette Valley, Central Oregon, and near Medford.
HOW THIS INDICATOR IS RELATED TO CLIMATE VULNERABILITYOlder adults are more vulnerable to multiple hazards, especially extreme heat (1, 2, 3). This is partly because of the decreased ability to regulate body temperature that normally comes with age. Risk is elevated for many older adults because of medications or chronic conditions such as diabetes or cardiovascular disease. As a result, older adults have the highest rates of heat-related illness and heat-related death. Older adults are also more vulnerable to poor air quality and infectious diseases related to climate change (4).
DATA SOURCES2009-2013 American Community Survey 5-year estimates. US Census Bureau.
See bibliography for references.
For more information, visit healthoregon.org/climate
Percent of population aged 65 years or older
Census tracts0% - 11%
11.1% - 17.1%
17.2% - 46%
County borders
0 50 10025Miles
OREGON HEALTH AUTHORITY | CLIMATE AND HEALTH PROGRAM OHA (10.15)
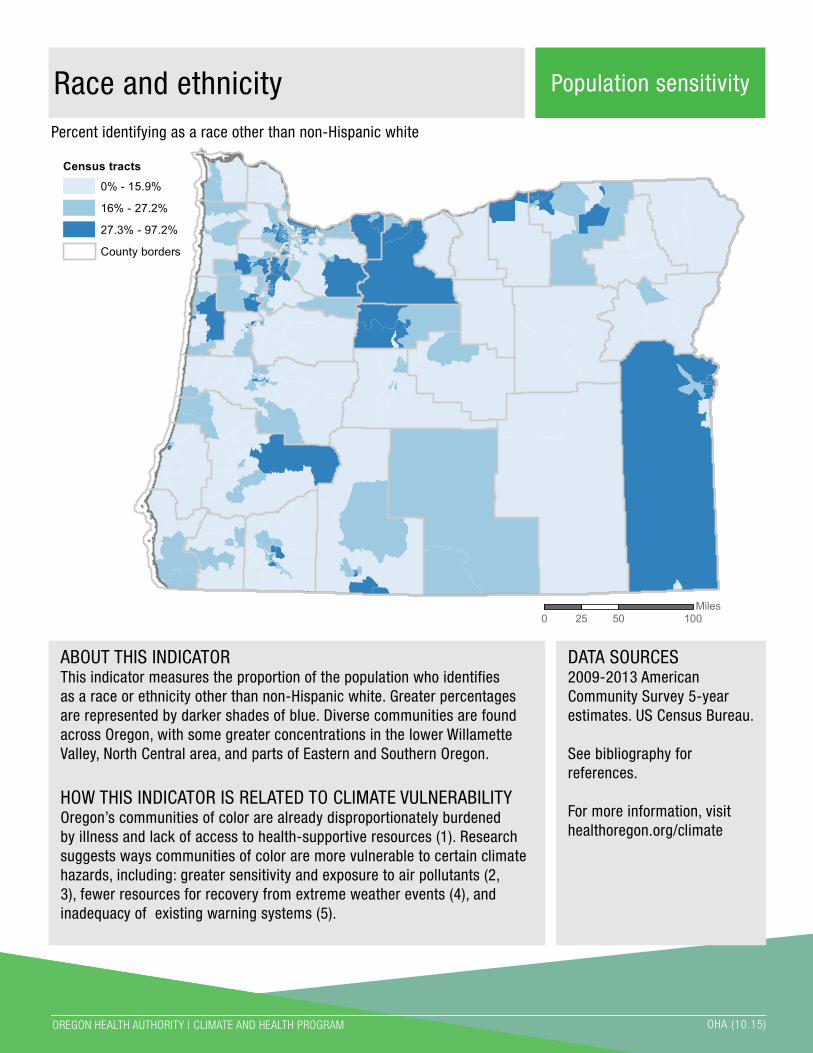
Population sensitivityRace and ethnicity
ABOUT THIS INDICATORThis indicator measures the proportion of the population who identifies as a race or ethnicity other than non-Hispanic white. Greater percentages are represented by darker shades of blue. Diverse communities are found across Oregon, with some greater concentrations in the lower Willamette Valley, North Central area, and parts of Eastern and Southern Oregon.
HOW THIS INDICATOR IS RELATED TO CLIMATE VULNERABILITYOregon’s communities of color are already disproportionately burdened by illness and lack of access to health-supportive resources (1). Research suggests ways communities of color are more vulnerable to certain climate hazards, including: greater sensitivity and exposure to air pollutants (2, 3), fewer resources for recovery from extreme weather events (4), and inadequacy of existing warning systems (5).
DATA SOURCES2009-2013 American Community Survey 5-year estimates. US Census Bureau.
See bibliography for references.
For more information, visit healthoregon.org/climate
Percent identifying as a race other than non-Hispanic white
Census tracts
0% - 15.9%
16% - 27.2%
27.3% - 97.2%
County borders
0 50 10025Miles

OREGON HEALTH AUTHORITY | CLIMATE AND HEALTH PROGRAM OHA (10.15)
Population sensitivitySocioeconomic status
ABOUT THIS INDICATORThe percent of households earning less than 200% of the federal poverty level is an indicator of socioeconomic status at the census tract level. In 2015, the poverty level for a family of 4 was about $24,000. Low-income households are part of communities throughout Oregon.
HOW THIS INDICATOR IS RELATED TO CLIMATE VULNERABILITYLow-income households have few resources to cope with climate-related health impacts. Compared to wealthier households, disasters have a greater impact on low-income populations as a result of geographic isolation, type of residence and social exclusion (1). Lower income households are more likely to live in urban heat islands, have higher exposure to air pollutants, and are less likely to be able to afford protective measures like air conditioning (2, 3, 4).
DATA SOURCES2009-2013 American Community Survey 5-year estimates. US Census Bureau.
See bibliography for references.
For more information, visit healthoregon.org/climate
Percent of households with incomes <200% of Federal Poverty Level
Census tracts0% - 29.1%
29.2% - 42.2%
42.3% - 91.7%
County borders
0 50 10025Miles

OREGON HEALTH AUTHORITY | CLIMATE AND HEALTH PROGRAM OHA (10.15)
Population sensitivityTenure
ABOUT THIS INDICATORThe US Census Bureau provides estimates of the proportion of occupied housing units that are occupied by renters. In this map, dark blue tracts represent areas with a high proportion of renters. While it may appear to be a small number of tracts, they are overwhelmingly concentrated in urban areas with greater density. The dark blue tracts represent 1/3 of Oregon’s population.
HOW THIS INDICATOR IS RELATED TO CLIMATE VULNERABILITYRenters are less able to mitigate climate threats by investing time, labor, and equipment in protective measures. This is attributed to financial barriers and lack of incentive to engage in protective maintenance (e.g. removing trees that elevate fire risk) (1).
DATA SOURCES2009-2013 American Community Survey 5-year estimates. US Census Bureau.
See bibliography for references.
For more information, visit healthoregon.org/climate
Percent of housing occupants occupied by renters
Census tracts
0% - 27.2%
27.3% - 42%
42.1% - 100%
County borders
0 50 10025Miles

OREGON HEALTH AUTHORITY | CLIMATE AND HEALTH PROGRAM OHA (10.15)
Population sensitivityUnemployment
ABOUT THIS INDICATOREmployment status is commonly included in measures of vulnerability (1). The American Community Survey provides estimates of the percent of the population age 16 years or older who are unemployed. On the above map, darker shades of blue represent greater unemployment rates. Tracts with high unemployment are distributed throughout the state.
HOW THIS INDICATOR IS RELATED TO CLIMATE VULNERABILITYLike other indicators of socioeconomic status, the percentage of adults who are unemployed helps to illustrate peoples’ capacity to cope with climate stressors. This indicator also provides a baseline by which we can judge whether changes to the economy resulting from climate instability are affecting workers. Additionally, there is evidence that employment status shapes migration patterns (2).
DATA SOURCES2009-2013 American Community Survey 5-year estimates. US Census Bureau.
See bibliography for references.
For more information, visit healthoregon.org/climate
Percent of population aged 16 years or older who are unemployed
Census tracts0% - 9%
9.1% - 12.8%
12.9% - 32.6%
County borders
0 50 10025Miles
OREGON HEALTH AUTHORITY | CLIMATE AND HEALTH PROGRAM OHA (10.15)
Bibliography
BIRTH OUTCOMES1. Basu R., Malig B., Ostro B. (2010) High Ambient Temperature and the Risk of Preterm Delivery. American Journal of Epidemiology,172:1108–172. Fleischer, N.L., Merialdi, M., van Donkelaar, A., Vadillo-Ortega, F., Martin, R.V., Betran, A. P., & Souza, J. P. (2014). Outdoor air pollution, preterm birth, and low birth weight: analysis of the world health organization global survey on maternal and perinatal health. Environmental Health Perspectives, 122(4), 425.3. Kramer, M.S., Demissie, K., Yang, H., Platt, R.W., Sauvé, R., & Liston, R. (2000). The contribution of mild and moderate preterm birth to infant mortality. Journal of the American Medical Association, 284(7), 843-849.4. Rogers, L. K., & Velten, M. (2011). Maternal inflammation, growth retardation, and preterm birth: insights into adult cardiovascular disease. Life Sciences,89(13), 417-421.
CHILDREN1. Sheffield P.E., Knowlton K., Carr J.L., Kinney P.L. (2011). Modeling of regional climate change effects on ground-level ozone and childhood asthma. American Journal of Preventive Medicine, 41:251–72. Basu, R. (2009). High ambient temperature and mortality: a review of epidemiologic studies from 2001 to 2008. Environmental Health, 8(1), 40.3. U.S. Environmental Protection Agency. America’s Children and the Environment [Internet]. (2000). Available from: http://yosemite.epa.gov/ochp/ochpweb.nsf/content/ACE-Report.htm/$File/ ACE-Report.pdf
CHRONIC DISEASE1. Reid, C.E., O’Neill, M.S., Gronlund, C.J., Brines, S.J., Diez-Roux, A.V., Brown, D.G., & Schwartz, J.D. (2009). Mapping community determinants of heat vulnerability. Environmental Health Perspectives, 117(11):1730-1736 2. Gent J.F., Triche E.W., Holford T.R., Belanger K., Bracken M.B., Beckett W.S., et al. Association of low-level ozone and fine particles with respiratory symptoms in children with asthma. Journal of the American Medical Association. 2003;290:1859– 67.3. Kessler R.C. (2007).Hurricane Katrina’s impact on the care of survivors with chronic medical conditions. Journal of General Internal Medicine, 22:1225–30.
EDUCATIONAL ATTAINMENT1. Cooley, H., & Pacifica Institute. (2012). Social vulnerability to climate change in California. California Energy Commission.2. O’Neill, M. S., Zanobetti, A., & Schwartz, J. (2003). Modifiers of the temperature and mortality association in seven US cities. American Journal of Epidemiology, 157(12), 1074-1082.3. Basu, R. (2009). High ambient temperature and mortality: a review of epidemiologic studies from 2001 to 2008. Environmental Health, 8(1), 40.4. Reid, C.E., O’Neill, M.S., Gronlund, C.J., Brines, S.J., Diez-Roux, A.V., Brown, D.G., & Schwartz, J.D. (2009). Mapping community determinants of heat vulnerability. Environmental Health Perspectives, 117(11):1730-
1736 5. Krewski, D., R. T. Burnett, et al. (2000). Reanalysis of the Harvard Six Cities Study and the American Cancer Society Study of Particulate Air Pollution and Mortality. Boston, Massachusetts: Health Effects Institute.6. Pope III, C. A., & Dockery, D. W. (2006). Health effects of fine particulate air pollution: lines that connect. Journal of the Air & Waste Management Association, 56(6), 709-742
FOREIGN-BORN POPULATION1. Cooley, H., & Pacifica Institute. (2012). Social vulnerability to climate change in California. California Energy Commission.2. Shonkoff, S. B., Morello-Frosch, R., Pastor, M., & Sadd, J. (2011). The climate gap: environmental health and equity implications of climate change and mitigation policies in California—a review of the literature. Climatic Change,109(1), 485-503.
ISOLATED OLDER ADULTS1. McGeehin, M. A., & Mirabelli, M. (2001). The potential impacts of climate variability and change on temperature-related morbidity and mortality in the United States. Environmental health perspectives, 109(Suppl 2), 185.2. English, P. B., Sinclair, A. H., Ross, Z., Anderson, H., Boothe, V., Davis, C., Ebi, K., Kagey, B., Malecki, K., Shultz, R.m & Simms, E. (2009). Environmental health indicators of climate change for the United States: findings from the State Environmental Health Indicator Collaborative. Environmental Health Perspectives, 117(11), 1673-81.
OLDER ADULTS1. Knowlton, K., Rotkin-Ellman, M., King, G., Margolis, H.G., Smith, D., Solomon, G., Trent R., & English, P. (2009). The 2006 California heat wave: impacts on hospitalizations and emergency department visits. Environmental Health Perspectives,117(1), 61-67.2. Basu, R., & Ostro, B. D. (2008). A multicounty analysis identifying the populations vulnerable to mortality associated with high ambient temperature in California. American Journal of Epidemiology, 168(6), 632-637.3. Reid, C.E., O’Neill, M.S., Gronlund, C.J., Brines, S.J., Diez-Roux, A.V., Brown, D.G., & Schwartz, J.D. (2009). Mapping community determinants of heat vulnerability. Environmental Health Perspectives, 117(11):1730-1736 4. Gamble, J. L., Hurley, B. J., Schultz, P. A., Jaglom, W. S., Krishnan, N., & Harris, M. (2013). Climate change and older Americans: state of the science. Environmental Health Perspectives, 121(1), 15-22.

OREGON HEALTH AUTHORITY | CLIMATE AND HEALTH PROGRAM OHA (10.15)
Bibliography - continued
RACE AND ETHNICITY1. Oregon Health Authority. State of Equity Report [Internet]. 2013. Available from: http://www.oregon.gov/ oha/oei/Pages/soe.aspx2. Gwynn R.C., Thurston G.D. (2001). The burden of air pollution: impacts among racial minorities. Environmental Health Perspectives,109 Suppl 501–6.3. Medina-Ramón M., Schwartz J. (2008). Who is more vulnerable to die from ozone air pollution? Epidemiology,19:672–9.4. Toldson I.A., Ray K., Hatcher S.S., Louis L.S. (2011). Examining the long-term racial disparities in health and economic conditions among Hurricane Katrina survivors: Policy implications for Gulf Coast recovery. Journal of Black Studies, 42:360–78.5. Hayden M.H., Drobot S., Radil S., Benight C., Gruntfest E.C., Barnes L.R. (2007). Information sources for flash flood warnings in Denver, CO and Austin, TX. Environmental Hazards, 7:211
SOCIAL VULNERABILITY1. Cutter, S.L., Boruff, B.J., & Shirley, W.L. (2003). Social vulnerability to environmental hazards. Social Science Quarterly, 84(2), 242-261.2. Cooley, H., & Pacifica Institute. (2012). Social vulnerability to climate change in California. California Energy Commission.3. Minnesota Department of Health. 2014. Minnesota Climate Change Vulnerability Assessment 2014. October 2014, Saint Paul, MN
SOCIOECONOMIC STATUS1. Fothergill A, Peek LA. (2004). Poverty and Disasters in the United States: A Review of Recent Sociological Findings. Natural Hazards, 32:89–1102. Reid, C.E., O’Neill, M.S., Gronlund, C.J., Brines, S.J., Diez-Roux, A.V., Brown, D.G., & Schwartz, J.D. (2009). Mapping community determinants of heat vulnerability. Environmental Health Perspectives, 117(11):1730-1736 3. Basu, R., & Ostro, B.D. (2008). A multicounty analysis identifying the populations vulnerable to mortality associated with high ambient temperature in California. American Journal of Epidemiology, 168(6), 632-637.4. Harlan S.L., Brazel A.J., Prashad L., Stefanov W.L., Larsen L. (2006). Neighborhood microclimates and vulnerability to heat stress. Social Science and Medicine, 63:2847–63.
TENURE1.Collins, Timothy W., & Bolin, B. (2009). Situating hazard vulnerability: people’s negotiations with wildfire environments in the US Southwest. Environmental Management, 44.3: 441-455.
UNEMPLOYMENT1. Cutter, S.L., Boruff, B.J., & Shirley, W L. (2003). Social vulnerability to environmental hazards. Social Science Quarterly, 84(2), 242-261.2. Reuveny, R. (2007). Climate change-induced migration and violent conflict. Political Geography, 26(6), 656-673.