hate crime in the wake of terror attacks: evidence from 7 ...personal.lse.ac.uk/machin/pdf/hanes...
TRANSCRIPT

0
Not to be quoted without authors’ permission
Hate Crime in the Wake of Terror Attacks: Evidence From 7/7 and 9/11
Emma Hanes* and Stephen Machin**
September 2013 * Department of Economics, University College London ** Department of Economics, University College London and Centre for Economic
Performance, London School of Economics Abstract This paper asks what happened to racially motivated hate crimes in the wake of the 7/7 terror attack that hit London in July 2005 and the 9/11 terror attack that hit the US in September 2001. There is anecdotal and statistical evidence of an increase in bias-motivated crimes since the 9/11 terrorist attacks in the US, but little quantitative research on the issue. This study offers empirical evidence on the effects of 7/7 and 9/11 on hate crime using rich data from four police force areas in England with sizable Asian/Arab populations. We find significant increases in hate crimes against Asians and Arabs that occurred almost immediately in the wake of both terror attacks, which subsequently decayed, but remained at higher than pre-attack levels a year later. We argue that this demonstrates a significant link between terror attacks and increases in hate crime and hypothesise that attitudinal changes resulting from media coverage may act as an underlying driver. JEL Classifications: K42. Keywords: Hate crimes; Terror attacks. Acknowledgements We acknowledge helpful comments and suggestions from Mirko Draca, Edwin Leuven, Kalle Moene, Steve Pischke and other participants in seminars at CEP and Oslo, the 2012 NBER Summer Workshop Economics of Crime session, the EALE annual conference in Bonn and at the 4th Annual IZA Meeting on the Economics of Risky Behaviors in Istanbul.

1
1. Introduction A growing literature has studied empirical issues surrounding the economic and social
effects of terrorism. Attempts have been made to quantify the effects of terrorism on a
number of outcomes, including GDP (Abadie and Gardeazabal, 2003; Bloom, 2009),
financial markets (Chen and Siems, 2004), social attitudes or well-being (Bozzoli and
Mueller, 2009; Frey, Luechinger and Stutzer, 2004), birth weight (Eskenazi, et al, 2007;
Lauderdale, 2006; Smits et al., 2006) and mental health (Metcalfe, Powdthavee and
Dolan, 2011). Perhaps surprisingly, the evidence seems to suggest that the total effect
on GDP and financial markets of a single terrorist incident is relatively short-lived,
while the effects on well-being and health outcomes are large and persistent.
In this paper, we explore a different question, asking what happened to racially
motivated hate crimes in the wake of the 7/7 terror attack that hit London in July 2005
and the 9/11 terror attack that hit the US in September 2001. This is an interesting
outcome to study if, for whatever reason, terror attacks alter individuals' perceptions of
other groups in society. The paper empirically models the impact of terror attacks on
hate crimes, in a setting with a credible research design where focus is placed on the
impact on a particular sub-group of society. To do so, we investigate what happened to
hate crime against Asians and Arabs in four regions of England after the 9/11 attack in
the US in 2001 and the 7/7 attacks that hit London in 2005.
Whilst there is anecdotal and descriptive evidence of an increase in hate crimes
against Muslims since the 9/11 terrorist attacks (which we review below), we are not
aware of much quantitative research that tries to accurately pin down the impact of
terror attacks on the incidence of hate crimes.1 This is what we offer in this paper, where
1 There is a small amount of related work in sociology. Disha, Cavenish and King (2011) look at FBI data on hate crime in the US before and after 9/11. Deloughery, King and Asal (2012) study the direction of

2
we analyse rich monthly administrative data before and after the terror attacks in four
English police force areas with a significantly sized Asian/Arab (predominantly
Muslim) population.
We quantify the increased number of hate crimes against UK Muslims that
occurred as a result of both the 9/11 attacks and the 7/7 bombings, using data that sub-
divides hate crimes by victim ethnicity. Thus, we can study hate crimes against Asians
and Arabs before and after the attacks, and generate credible estimates by using hate
crimes against Blacks and Whites as a control group.
One clear advantage of studying hate crimes as recorded by the English police is
that they are explicitly defined and quantifiable. This therefore facilitates accurate study
of time trends in a way which is not possible with the kind of opinion survey attitudinal,
self-reported well-being or newspaper coverage data that have been more commonly
studied in the terrorism literature. Moreover, actual hate crimes have greater
implications – there is a direct cost to the victim, which may not be the case with
attitudinal changes.
To preview our main findings, we report sizable increases in hate crimes against
Asians and Arabs - of the order of 25 to 30 percent - that occurred almost immediately
in the wake of the two terror attacks. Moreover, whilst subsequently the increase did not
stay as high as the initial impact, in both cases it persisted and was still significantly
higher some time after the terrorist events occurred. In the case of the 7/7 attacks in
Britain, where we have better data to estimate duration effects, cumulative increases
remained significantly higher a year after the attacks.
causation between hate crime offences and terrorism, arguing strongly that hate crimes occur in response to terror attacks, but no evidence of causation working in the opposite direction where hate crimes would act as a precursor to terrorist activity.

3
The structure of the rest of the paper is as follows. In Section 2, we consider
some theoretical background motivation of our questions of interest and discuss relevant
existing evidence. In Section 3, we describe the data we use and offer some initial
descriptive analysis. Section 4 explains the modelling approach and presents statistical
estimates of the impact of the 9/11 and 7/7 terror attacks on hate crime. Section 5
concludes.
2. Theoretical Background and Existing Evidence
Hate Crimes in the Economics of Crime
Becker's seminal (1968) paper was the first to consider crime in an economic
framework of rational behaviour. According to his theory, agents maximise utility by
comparing the benefits of crime with the costs, where costs are the time and effort
required plus the expected cost of deterrence efforts (i.e. cost of a police fine or
incarceration multiplied by the probability of detection and prosecution). Thus, crime
becomes a simple cost-benefit choice, and the model generates clear empirical
predictions about incentive and deterrence effects on crime.
In the original Becker model, harm or loss to the individual is considered an
externality, essentially an unintentional side effect of the offender's actions. In the case
of a hate crime, however, it has been suggested that loss to the victim is the intention of
the crime (Gale, Heath, and Ressler, 2002; Craig, 2002). As well as causing harm to the
victim, a hate crime is often intended to convey a message to the wider group to which
the victim belongs (or is perceived to belong).
Gale et al. (2002) thus extend the individual economics of crime model to a
setting where a person’s utility function can contain a function of another person’s

4
utility. They argue that one can understand racist acts and racial bigotry using this
model. An individual sorts the world into groups of people, choosing to ‘like’ and
‘dislike’ these groups according to various characteristics. Thus, we can imagine that
the individual may choose to commit a hate crime in the case where the utility gained
from seeing the ‘disliked’ person hurt outweighs the cost of effort plus expected loss
from being caught and punished.2
An alternative, related, model of hate crime has been developed by Medoff
(1999). His model proposes that an individual gains utility from two sources; hate
crimes and all other goods. The crucial assumption is that, while other goods can be
purchased on the market, hate crimes must be 'created' using personal time and
resources, and are therefore a more time-intensive consumption activity. As a result, an
event which causes the individual to value his or her time more highly (for example, an
increase in wages) results in substitution away from hate crime activities and towards
market goods.
In both of these approaches, hate crimes can be viewed as a consumption good
that generates utility, but at the same time incurs some kind of cost. In this setting, hate
crimes could be driven by factors that alter preferences, for example if the propensity to
commit hate crimes is affected by some kind of shock. One can ask what kinds of
shocks may occur that could make an individual choose to dislike a hated group more or
less at different times. At the micro level, this may be about personal experiences,
education, culture and environmental changes. At the macro level, however, we might
expect the biggest driver to be current affairs. So in the specific context of the hate
crimes we study, namely those targeting Muslims, news events which some individuals 2 This, of course, bears similarities to another area of Becker's (1957) work, namely that on tastes for discrimination. In this sense, as with the case of employers, workers or consumers having a taste for discrimination, one could think of individuals having a taste for hate crimes.

5
may interpret as showing Muslims in an unfavourable light could be expected to
increase the incidence of hate crime. We could plausibly consider the 9/11 and 7/7
terrorist attacks we study as featuring an extreme form of this media exposure.
Hate Crimes in a Behavioural Approach
So far, we discussed hate crimes within the economist's rational decision-making
framework. When an individual decides to commit a hate crime, they do so because the
expected utility from the action is positive. An alternative view is offered by
contributions from behavioural economics. Particularly relevant are those areas which
try to understand why agents make seemingly irrational decisions, even once factors
such as limited information and limited decision-making time have been taken into
account. It seems reasonable to think of hate crimes in this context in that, whilst the
prospective gains from acquisitive crime are self-evident, the potential 'gains' from
committing a pure act of violence against others are less clear (unless people have a
taste for discrimination of this sort, though ultimately this is a theoretical proposition
that is hard to test in practice). An alternative perspective might consider a hate crime to
be an action of passion or emotion – where feelings of anger and rage dominate the
individual's rational decision-making process. This is the assertion of Gordon and Arian
(2001) who claim that “when one feels very threatened, the decision-making process is
dominated by emotion rather than logic or rational considerations” (Gordon and Arion,
2001, page 197).3
Indeed, unlike other types of violent crime, hate crimes tend to be committed by
groups of people rather than individuals (see Craig, 2002). This suggests there may be
some element of group interaction, such as peer pressure or removal of social barriers, 3 Gordon and Arion (2001) try to demonstrate this point using opinion poll data from Israel and America. The basic finding from the Israeli survey is that the more threatened by Palestinians the respondents feel, the less likely they are to support the establishment of a Palestinian state.

6
which causes individuals to commit hate crimes only when in groups. The concept of
'herding' is well known to economists, in particular in relation to financial markets. For
example, economists explain the formation of stock market bubbles as being caused by
investors valuing assets according to how they believe others to value assets rather than
based on private valuations. This kind of group behaviour can lead to seemingly
irrational choices and can cause instability in financial markets (Baddeley, 2010). In the
context of hate crime, we can imagine that group mentality has the power to overcome
social taboos or persuade individuals to commit acts they would not otherwise have
considered in order to impress the group. Escalation may occur when group members
second guess the value that other members place on committing hate crimes.
How do these notions connect to terror attacks? It is evident that a terrorist
attack can trigger sharp changes in behaviour, which may not be rational responses (see
Viscusi and Zeckhauser, 2003, or Sunstein, 2003). However, the supposedly irrational
'certainty premia' phenomenon is accounted for in a rational framework developed by
Becker and Rubinstein (2009). They argue that, when considering shock mass-fear type
events, the standard state-dependent utility model is not sufficient. In fact the model
they develop assumes that a negative utility shock occurs only in a 'bad' state (like when
the terrorist attack occurs), and not in good states.
Thus, there are both rational and behavioural arguments that have been proposed
to explain why hate crimes occur.4 In terms of empirical analysis, testing the distinction
between the rational and behavioural arguments is not within the scope of this study
4 There is also a small body of work on connections between hate crime and economic variables that is indirectly relevant to this paper. This includes the empirical tests of their theories attempted by Gale at al (2002) and Medoff (1999), together with research that studies economic responses to hate crimes (Gould and Klor, 2012, look at the notion that immigrant assimilation slowed down in responses to 9/11) and the work on hate crimes and extremism in post-unification Germany (see, for example, Krueger and Pischke, 1997, Falk et al, 2011, or Siedler, 2006).

7
(and it is indeed difficult to even start to begin thinking how this might be done).
Instead, the focus in what follows will be on empirically pinning down the magnitudes
and durations of the effect of the 9/11 and 7/7 attacks on subsequent patterns of hate
crime incidence.
Existing Evidence Linking Hate Crimes and Terrorist Attacks
Quite a lot of descriptive evidence exists on whether terror attacks induce
increases in hate crime. In the US it seems that the 9/11 terrorist attack caused an
increase in the number of hate crimes against Muslims, Arabs, and those perceived to be
Middle Eastern.5 Consider the FBI annual statistics on hate crimes reported in Table 1
for the period 1997 to 2008. Prior to 2001, incidents of anti-Islamic crime were in the
magnitude of 20-30 incidents per annum. This figure jumps from 28 incidents in 2000
to 481 in 2001, and then remains steady in the 100-150 range per annum thereafter. The
total number of hate crimes committed (including racial, ethnic, sexual orientation and
disability bias motivated crimes) remained approximately static during these ten years.
Meanwhile, anti-Islamic crimes as a proportion of all hate crimes dramatically increased
over this period.
These FBI numbers convey the magnitude of the backlash against Muslims, but
do not give any idea of the time-scale of the crimes within the year 2001 (as the figures
are published annually). Since 9/11 occurred three quarters of the way through 2001,
and the number of anti-Muslim hate crimes in the following year was significantly
lower, it seems likely that the three months after the attacks were times of intense anti-
Muslim violence.
5 There is also some evidence that Sikhs were targeted, since the wearing of the turban was confused with the Arab headdress worn by Osama-bin-Laden and members of Al-Qaeda (Sheridan and Gillett, 2005).

8
Other sources confirm this impression. Firstly, a report by the ADC (American-
Arab Anti-Discrimination Committee) counts 700 violent attacks on US Muslims in the
nine weeks following 9/11; they report that “the intensity of the backlash, especially in
terms of hate crimes and discrimination, was at its peak in the first six months following
the attacks, and particularly during the first nine weeks” (Ibish and Stewart, 2003, page
15). Secondly, Swahn, Mahendra, and Paulozzi (2003) conducted a survey of
newspaper reports during the period 1st September 2001 - 11th October 2001. They
found evidence of 100 incidents of hate crimes against Middle Easterners in the United
States, of which just one occurred in the ten days between 1st September and 11th
September (the “baseline”). Of the remaining 99, 77 occurred in the period ten days
after 9/11. Incident types ranged from assault and intimidation to murder and attempted
murder. Although this survey is not a rigorous scientific study (the baseline period is so
short, and may be subject to seasonal variation), it does support the hypothesis of a
relatively short and intense 'shock period'. What is more, this study gives direct
evidence that the perpetrators of these hate crimes were motivated by the terrorist event:
“the perpetrators in at least 30 of the incidents specifically mentioned the September 11
terrorist attacks, or accused the victims of being terrorists” (Swahn, Mahendra, and
Paulozzi, 2003, page 188).
Furthermore, there is some evidence to suggest that the effects of the 9/11 terrorist
attacks was not limited to the United States. Surveys of Muslims in both the UK and
Australia find a significant increase in experiences of hate crime post 9/11. In the UK,
Sheridan and Gillett (2005) surveyed 398 respondents from various religious groups in
Leicester and Stoke-on-Trent during the period October to December 2001. They
estimate regressions to predict an aggregated 'change score' (showing change in

9
experience of hate crimes since 9/11) and find that both Muslims and Hindus report
increases post 9/11 (with a much larger effect for Muslims), while the other religious
groups report small decreases. A similar, but smaller scale, study conducted in 2003
surveyed 186 Australian Muslims and Christians (Poynting and Noble, 2004) and found
similar results, with Muslims being far more likely to report an increase in experiences
of racism since September 11th than Christians.
Thus there is survey evidence that the 9/11 terrorist attacks were immediately
followed by a dramatic rise in the incidence of hate crimes against American Muslims,
with a peak lasting for around 2-3 months, and with the effects persisting for perhaps
years afterwards. Other than the survey evidence already discussed, there exists little
evidence of the experiences of British Muslims following 9/11. Even scarcer is evidence
on the effect of 7/7, which we would presume likely to have caused similar effects to
9/11. Our empirical work will study the impact of both attacks.
3. Data and Descriptive Analysis
Data
Data requirements to study the impact of terror attacks on hate crimes are stringent and
adequate data to study the subject is hard to come by. This is for a number of reasons.
First of all, we need data on hate crimes measured in a consistent and accurate manner.
Second, we also need information on the ethnicity or religiosity of hate crime victims.
Fortunately, for our purposes, data collected on hate crimes and on the victims of hate
crimes by police forces in England is of very good quality owing to stringent
definitional guidelines that police forces need to follow (see the Appendix on the nature

10
of crime recording practices in England).6 Third, hate crime data at a high frequency (at
least monthly) is required to carry out our empirical analysis of what happens to hate
crimes before and after the 9/11 and 7/7 terror attacks.
Data on monthly numbers of hate crimes broken down by ethnicity of victim is
not publicly available. We therefore obtained such data by direct application to police
forces through a freedom of information (FOI) request.7 We submitted FOI requests to
four police force areas (PFAs) in England - the Metropolitan Police Services (MPS) in
London, the West Midlands, Leicestershire and West Yorkshire. These were chosen for
two main reasons. Firstly, because all four have a sizeable Muslim population, and thus
hate crimes against Muslims are likely to occur relatively frequently, and secondly
because the 7/7 attacks occurred in London, and so a comparison of London versus non-
London areas was sought (the MPS covers all of central London, with the exception of
City of London; the other three areas are independent of London (although, of course,
the 7/7 bombers were from West Yorkshire).
We obtained monthly data from all four police forces, with information being
supplied to us on the major offence category and ethnicity for both victims and
offenders of all crimes listed as racially motivated.8 For Leicestershire, London and the
6 The classification of hate crimes we use in data obtained from police forces in England seems to be collected on a much more systematic basis than the US data used in the research of Disha, Cavenish and King (2011), Deloughery, King and Asal (2012) and Gould and Klor (2012). 7 In the UK, a freedom of information request can be undertaken under the auspices of the 2001 Freedom of Information act. This gives individuals the right to ask any public body for all the information they have on a particular subject and, unless there is a good reason not to, the organization is required to supply the requested information. 8 Several caveats were attached to the data, describing recording changes, relevant events and sources of inaccuracy. Indeed, it is important to bear in mind that the data used in this study was not collected with our research purpose in mind, as expressed in the following words from West Midlands police force: “Every effort is made to ensure that the figures presented are accurate and complete. However, it is important to note that these data have been extracted from large disparate administrative data systems used by forces for police purposes. The detail collected to respond specifically to your request is subject to the inaccuracies inherent in any large scale recording system. As a consequence, care should be taken to ensure data collection processes and their inevitable limitations are taken into account when interpreting those data.”

11
West Midlands we have data before and after both 9/11 and 7/7, and for West Yorkshire
only for before and after 7/7.
Significant crime recording changes occurred in April 2002 (see the Appendix
for more detail) and this constrains us in our ability to look at before/after changes in
hate crime associated with the two terror attacks. In fact, it means the feasible time
series we can study differ around the window of the two attacks. We can do a much
better job on having consistent data before and after 7/7 and so our main focus is placed
on studying what happened to hate crimes in response to this terror attack. We thus
study the 7/7 attacks first and then look at 9/11 effects using a shorter time series that
stops when the recording changes occurred in April 2002. The actual periods we use in
our analysis are as follows: 7/7 attack – January 2003 to December 2007; 9/11 attack –
February 2000 to March 2002.
Hate Crimes by Victim Ethnicity
There is a distinction between racial and religious discrimination, although often
the two co-occur. While it is clear that the 9/11 and 7/7 terrorist attacks triggered
animosity towards Western Muslims, research from the US (discussed previously) has
found that it is not just Muslims who were targeted – hate crimes were also carried out
on Middle Easterners and Arabs who were not practising Muslims, and Sikhs, who were
mistaken for Muslims.
The vast majority of Britain's Muslim population are South Asian, most of whom
originate from Pakistan, Bangladesh and India. The Pakistani and Bangladeshi
populations are almost entirely Muslim, while the Indian population sub-divides into
Hindus, Muslims and Sikhs. Thus the UK Muslim population is almost entirely
contained within the ethnic category 'South Asian'. People in this category may be the

12
victim of either racial or religious discrimination. In some cases, religious
discrimination may be misplaced – individuals may be discriminated against because
they are mistaken for being Muslims, or because of some kind of statistical profiling
(i.e. discriminators target South Asians because they are the ethnic group most likely to
contain Muslims).
Since religious data was unavailable, we use ethnicity to define our main groups
of interest. Ethnicity categories used in crime statistics differ from one police force to
the next, and so some aggregation was required in order to standardise the figures from
the different sources. The following six broad categories were created: Asian/Arab,
White, Black, Oriental, Unknown, Other. The latter three contain very small numbers
and so are dismissed from the analysis. We thus consider the impact of the terror attacks
on Asian/Arab hate crimes and use hate crimes against Whites and Blacks as a control
group in a difference-in-difference setting when we formulate our statistical models.
Descriptive Analysis
The vast majority of hate crimes involve violence against the person. Table 2
shows the major offence categories (excluding sexual offences) of all hate crimes
against Asians/Arabs between January 1998 and March 2010 from our FOI request to
the Metropolitan Police Service. Over three quarters (77 percent) were classified as
violence against the person, and a further 18 percent involved criminal damage.
Figure 1 plots the monthly time series of hate crimes by ethnic group and police
force area for the time window for which we study the 7/7 attacks (January 2003 to
December 2007). Hate crimes where the victim was Asian or Arab are shown by the
dark solid line, and hate crimes where the victim was White or Black are the two dashed
lighter lines. There are several interesting features of the overall patterns. First, whilst

13
the monthly time series do jump around to an extent, all four graphs show a discernible
spike up in the Asian/Arab victim hate crime series in the month of July 2005,
suggesting an immediate impact. Second, eyeballing the graphs is suggestive of the
notion that the time series patterns of hate crimes before the 7/7 bombings for all three
ethnic groups look similar (this is considered formally in more detail below).
There are also two police force area specific observations that are relevant:
i) In the West Midlands there is a large spike caused by the Birmingham race riots that
occurred in October 2005. The riots were sparked by the alleged rape of a Black girl by
a group of South Asian men. This event seems to have been completely unrelated to the
terrorist attacks that occurred three months previously.
ii) The pre-recording change data for West Yorkshire was not good enough to study the
9/11 attacks for this police force area. Also, they introduced a True Vision third party
recording scheme was launched in June 2005, just one month before 7/7.
We deal with these two data issues in our empirical models below by including specific
variables to control for any data jumps unrelated to our interest that result from these.
An analogous set of charts for a shorter time window around the 9/11 attacks
(February 2000 to March 2002) is given in Figure 2. The chart this time covers only
three police force areas excluding West Yorkshire. Whilst the length of the post-attack
time period is constrained by the recording changes of April 2002, the Figure does seem
to show a blip up in hate crimes against Asians/Arab 9/11 and higher relative levels
(despite subsequent falls) compared to the White and Black hate crimes. We scrutinise
these patterns in more detail by means of the statistical models described in the next
Section of the paper.

14
4. Modelling Approach and Statistical Results
Basic Approach
We begin the statistical analysis by developing and empirical model that permits us to
study the question of how the 7/7 and 9/11 terror attacks impacted upon hate crime. We
ask what happened to hate crime against Asians and Arabs before and after the terror
attacks relative to hate crime against two other ethnic groups (Blacks and Whites).
Because crime is seasonally highly persistent9, and our time units cover monthly
data across years, we express our model in twelve month differences (thereby
differencing out area and month fixed effects from a levels model). We operationalise
our estimator in terms of the following difference-in-difference (D-i-D) equation (with
∆12 being a twelve month differencing operator) determining twelve month changes in
hate crimes for ethnic group e in area j in time period t:
12 ejt t e t e jt t 12 ejt∆ H = α + βT + θ(AA x T ) + γAA + λX + τ + ∆ ε (1)
where H denotes hate crimes, AA is a dummy variable indicating the Asian/Arab ethnic
group (relative to Whites and Blacks), T is a dummy variable equal to one in months
where the terror attack occurred (or for a window comprising several post-attack months
- see below), X is the control variables for the data issues specific to particular police
forces discussed above, τ is a time variable (see below) and ε an error term.
This equation enables us to ascertain the impact of terror attacks on hate crimes
against the Asian and Arab group relative to the White and Black groups via the
difference-in-difference estimate of θ. Estimates of θ reveal whether Asian/Arab hate
crimes differentially increased when the terror attacks occurred and, when the attack
9 See Hird and Ruparel (2007) on the seasonality of crime or Draca, Machin and Witt (2011) who difference weekly crime data across years, among others.

15
indicator At is defined to cover a longer post-attack duration, how they evolved
subsequently in the wake of terror attacks.
Basic Differences-in-Differences
Table 3 reports descriptive statistics showing the basic differences-in-differences
for the 7/7 and 9/11 terror attacks, that is comparing what happened to hate crimes
against Asians and Arabs relative to hate crimes against Whites and Blacks in the month
of the terror attack as compared to before. The upper panel of the Table shows a pre-
attack time period of all months between January 2003 and June 2005 for 7/7 and
between February 2000 and August 2001 for 9/11. The lower panel uses a pre-attack
period of the same month in the previous years, thus corresponding more closely to the
seasonal difference approach we use to control for unobservables in our econometric
analysis that follows.
Considering first the 7/7 attacks, it is clear from the Table that the number of
hate crimes against Asians and Arabs rose faster in July 2005 as compared to the control
group of Whites and Blacks. In Panel A, they rose by 96 crimes, going up to 367 from
an average of 271 per month in the two and a half years before. Hate crimes against
Whites and Blacks also went up, but not by anywhere near as much and so the
difference-in-difference of 43 hate crimes, or 0.15 log points, shown in the Table is
strongly significant in statistical terms.
That there is a seasonal, monthly, aspect to this is revealed in the lower pane of
Table 3. In the same-month comparison presented there, hate crimes against Asians and
Arabs rise from 311 to 367, whereas those against Whites and Blacks fall a little,
resulting in a difference-in-difference estimate of 56 hate crimes, corresponding to a
0.20 log point change.

16
For the 9/11 analysis, a strong and significant difference-in-difference estimate
also emerges. The estimates shown in the last column of the Table show a sharp
increase in hate crimes against Asians and Arabs as compared to Whites and Blacks of
171 (when compared to all pre-attack months) or 176 (when compared to the previous
September), or 0.28 to 0.37 log points.
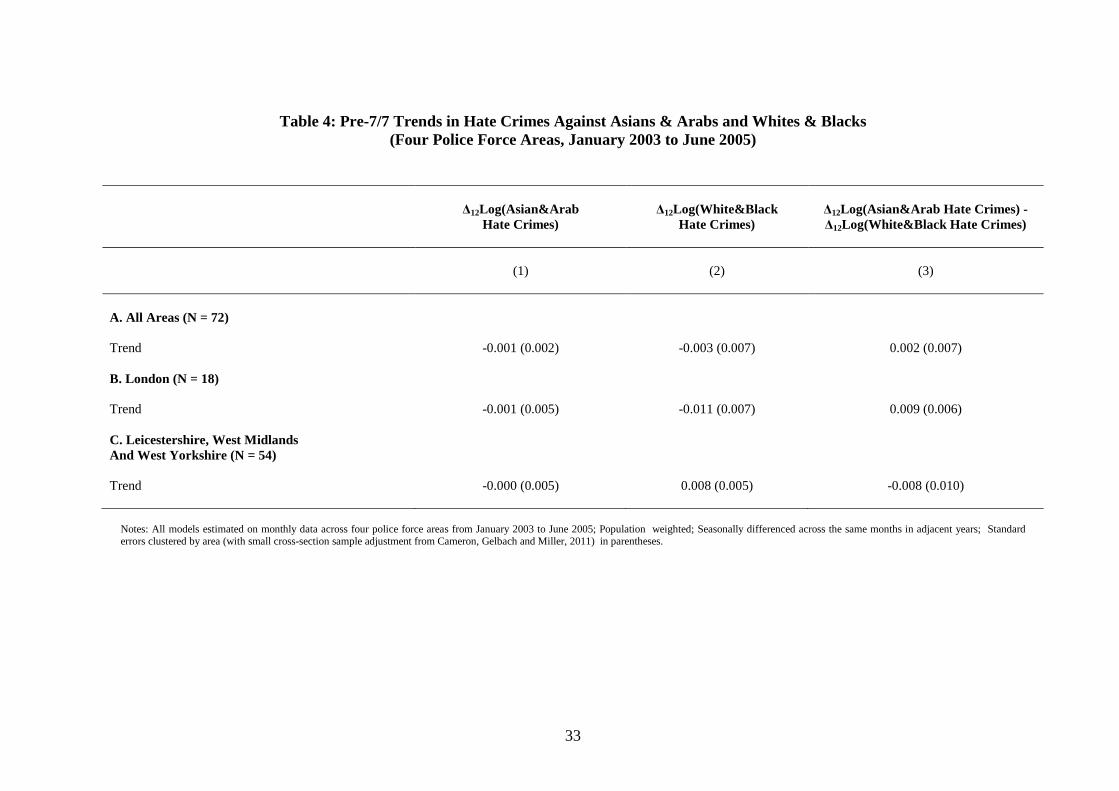
Pre-Attack Trends
Whilst the results of Table 3 show there to be a significant increase in hate
crimes against Asians and Arabs relative to the control group immediately after the
terror attacks, it remains the case that a prerequisite for our research approach to yield
unbiased estimates is that pre-attack trends of hate crimes against the treatment group
(Asians/Arabs) are no different to trends in hate crimes against the comparison groups
(Whites and Blacks). A glance back to Figures 1 and 2 makes it graphically clear how
this operates in practice, as the Asian/Arab, White and Black hate crime trends do seem
to show similar temporal evolution in the pre-attack periods.
This is tested more formally in statistical terms for the 7/7 attacks in Table 4.
The results in the Table show estimated coefficients for pre-attack trends in twelve
month differenced hate crimes hate crimes against Asians/Arabs in specification (1), for
Whites and Blacks in specification (2) and for the gap between the two in specification
(3). The upper panel shows results for all four areas pooled together, and the next two
separately for London and the other three police force areas.
In all cases, the estimated coefficients on the trend variables show there to be no
differential pre-attack trends between Asian/Arab hate crimes and those against Whites
and Blacks. Thus, the common trends assumption required for our estimator to be valid
appears to be upheld by the data.

17
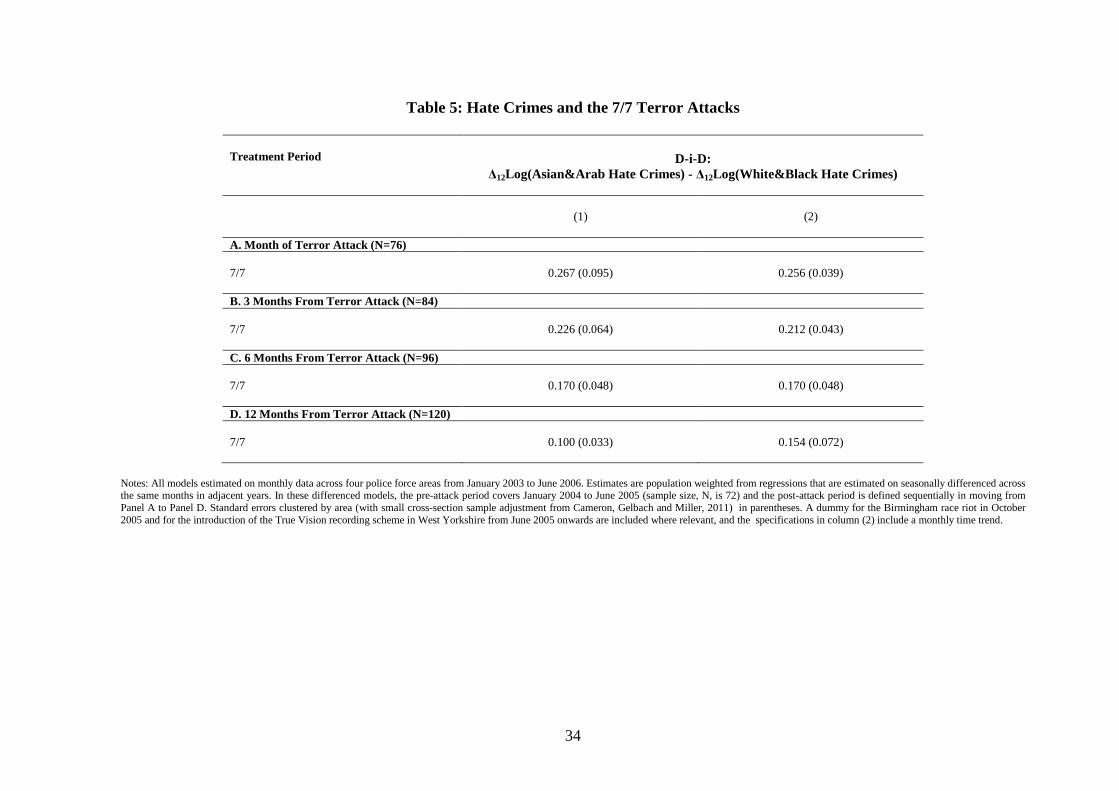
Statistical Estimates of the 7/7 Impact
Table 5 shows D-i-D estimates for the case of the 7/7 attacks. There are four
Panels in the Table, where each gives a 7/7 impact over different durations. Panel A
shows the immediate impact via a dummy variable defined for the 7/7 month only.
Panels B to D further refine the dummy variable definition to cover a wider post-attack
window (Panels B, C and D respectively refine the dummy variables to cover three, six
and twelve months post-attack).
Results from two specifications are included in each Panel. The first includes
only the 7/7 dummy in the twelve month differenced model. The second models
common aggregate effects through inclusion of a monthly time trend.10 All the
specifications are population weighted and report standard errors clustered by police
force area (adopting the small cross-section sample adjustment from Cameron, Gelbach
and Miller, 2011).
Consider first the immediate impact results in Panel A of Table 4. Specification
(1) produces a 0.27 coefficient on the 7/7 dummy, showing a 27 percent significant
spike up in hate crimes against Asians/Arabs in the attack month. Specification (2)
shows a very similar estimated coefficient of 0.26 that remains strongly significant. This
analysis based on the seasonally differenced data very much confirms the earlier, more
descriptive analysis.11
Panel B considers impact in the three months following the terror attacks. The
estimated impact comes down, but remains strong and significant at 0.21 to 0.23,
10 Our seasonal differencing controls for month effects on the level of hate crime, but as our attack dummy is a month dummy one cannot put a full set of month dummies into the seasonally differenced equation. Inclusion of year dummies for the pre-attack years did not change the nature of the results throughout the analysis (results available on request from the authors). 11 We also considered a ‘placebo’ experiment by imagining an attack occurred in the previous July and carrying out the same analysis using July 2004 as the treatment month. Reassuringly, the estimated coefficient (of -0.036 with an associated standard error of 0.084) was insignificantly different from zero.

18
depending on specification. The window is further widened in Panels C and D where
the effects again fall but remain strongly significant. Six months on from the 7/7
attacks, the magnitude of the hate crime increase is around 17 percent and still around
10 to 15 percent after a year.
The results of Table 4 show a strong impact of 7/7 on hate crimes against Asians
and Arabs. The immediate impact is largest, followed by subsequent decay, but the
cumulative effect persists even twelve months after the attack occurred. Four specific
estimates were chosen to be reported. We can, however, estimate an impact for every
month sequentially to study the duration of impact in more detail. Estimated coefficients
(and associated 95 percent confidence intervals) from carrying out this sequential
modelling exercise are given in Figure 3, which reports estimates for the year after the
7/7 attacks.
The estimates reproduce the large immediate impact at 27 percent in July 2005,
which falls to 20 percent if the window is defined as four months after the attack. After
that it stabilises in a range that stays over 10 percent higher. All of the individual
estimates are significantly different from zero, as the lower confidence interval bars all
lie above the zero line.
The results in Table 4 and Figure 3 are very supportive of the idea that 7/7
caused a strong immediate increase in hate crimes against Asians and Arabs, and that
whilst the scale of the increase tempered off in the following months, it remained
around 10 percent higher than the pre-attack levels. We are reluctant to extend the
window much beyond a year, since other factors that could affect the relative hate
crimes variable are likely to come into play and so confound the picture, but it does

19
seem that the increase hate crimes against Asians and Arabs that occurred in the wake
of the 7/7 bombings did persist for some time.
Separate Estimates by Police Force Area
In Table 6 we report separate estimates of the 7/7 impact, at the different chosen
post-attack durations, by police force area. More specifically we consider London alone
and the other three areas together. There are at least two reasons for doing this. First, as
highlighted above, there are certain police force area specific data issues of relevance.
Second, we wish to explore possible heterogeneities in the magnitude and duration of
impact across areas.
The Table confirms there to be some variation. In terms of immediate impact, it
is higher at 0.32 in London, as compared to 0.18 in Leicestershire, the West Midlands
and West Yorkshire. The rate of decay of the effects, however, is seen to differ by area
with, interestingly, there being no impact remaining in London twelve months after the
terror attacks, but the effects still persisting strongly in the other three police force areas.
One possible interpretation of the more heightened persistence outside of London is the
presence of historically more entrenched race issues that have engendered deeper seated
issues of anger and resentment in communities in the other areas.12 The capital city has
also been characterised by much more rapid population movements through migration
over this time period as well, suggesting a more dynamic environment where perhaps
faster adjustment can take place.13
12 For example, there were race riots in Bradford (West Yorkshire) in 2001 and in Birmingham (West Midlands) in 2005 which may well have generated attitudes that lie behind such entrenchment. For a description of these riots, see Bagguley and Hussain (2008). 13 See Jaitman and Machin (2013) for study of changing immigration patterns which are particularly marked in London during the 2000s. Despite the scale of change, they report no significant correlation between crime and immigration.

20
Statistical Estimates of the 9/11 Impact
We have also estimated variants of equation (1) for the impact of 9/11.
However, we should say that this analysis is more limited than for the study of the 7/7
impact. There are several dimensions to this. First, as noted above, we only have
usable data for three police force areas. Second, we are not able to define a symmetric
time series window around the attack as we did with the 7/7 analysis. This is because
we have to stop due to the recording practice change that occurred in April 2002. One
consequence of this is we can only look as far as six months following the terror attack.
Third, because we only have two years’ data, our ability to difference across months in
the years is more limited.
The results are reported in Table 7. The Table is structured in a comparable way
to the 7/7 results, though we can only look at shorter duration effects. The column (1)
results show a strong immediate impact effect from 9/11. Hate crimes against Asians
and Arabs rose by 28 percent in September 2001. This effect dampens down by three
months after the attacks to 22 percent, and falls further to 11 percent after six months,
but remaining statistically different from zero.
Figure 4 shows estimates for every month of the post-attack duration as with the
earlier 7/7 analysis. Whilst it is only possible to study a shorter duration, a rather similar
pattern emerges, with a strong positive initial impact which then dies down somewhat
and appears to settle at a higher level than the pre-attack period.
5. Conclusions
Despite the importance of the subject, credible statistical evidence on the impact of
terror attacks on hate crime is sparse and hard to come by. In this paper, we look at the

21
impact of the 7/7 and 9/11 terrorist attacks on hate crimes against Asians and Arabs in
four police force areas of the UK. We estimate a strong immediate impact on
Asian/Arab hate crimes from both terror attacks, and find that whilst the effects do fall
back again, they remain significantly higher than post-attack levels at least six months
(in the case of 9/11) or a year later (in the case of 7/7). The highly similar pattern of
results from the separate study of the respective impacts of 7/7 and 9/11 on hate crime
in four areas with sizable Asian/Arab populations is highly suggestive that we can
attribute a causal interpretation of the impact of terror attacks on hate crime from the
empirical approach implemented in the paper.
The findings add to the literature on the economic and social effects of terror
attacks. They show that, in line with some of the theoretical discussion in the early part
of the paper, for individuals the cost of terror attacks is not just limited to the victims of
the attacks. That hate crimes perpetrated against Asians and Arabs significantly rose in
the wake of 9/11 and 7/7 points to an additional social cost of terrorist activity.
Moreover, if attitudes towards groups like British Muslims are altered by attacks
and by media coverage of attacks then these findings fit with the proposition of
'attitudinal shocks', where a driver of hate crimes is the level of hatred or bigotry about a
particular group in society, which may well be influenced by media coverage of attacks.
In this setting, such shifts in underlying bigotry from attitudinal change following
events like terrorist attacks seem to be potentially important determinants of hate crime
incidence.
Thus, the determinants of hate crimes may be different from, or certainly more
complex than, the kind of incentive effects or deterrence effects that emerge as crime
determinants in the standard economics of crime model. Of course, to more firmly

22
establish whether this is the case, continued work on the causes of hate crime and on the
behavioural motives that individuals have to engage in crime against different ethnic or
religious groups forms an important future research agenda.
23
References
Abadie, A. and J. Gardeazabal (2003) The Economic Costs of Conflict: A Case Study of the Basque Country, American Economic Review, 93, 113-132.
Baddeley, M. (2010) Herding, Social Influence and Economic Decision-Making: Socio-
Psychological and Neuroscientific Analyses, Philosophical Transactions of the Royal Society of London. Series B, Biological Sciences, 365, 281-290.
Bagguley, P. and Hussain, Y. (2008) Riotous Citizens: Ethnic Conflict in Multicultural
Britain, Aldershot: Ashgate. Becker, G. (1957) The Economics of Discrimination (2nd ed., 1.), Chicago: Univ.
Chicago Press. Becker, G. (1968) Crime and Punishment: An Economic Approach, The Journal of
Political Economy, 76, 169-217. Becker, G., and Y. Rubinstein (2009) Fear and the Response to Terrorism: An
Economic Analysis, mimeo. Berman, G. (2008) Changes in Crime Recording Practices, Technical report, Library of
the House of Commons, Standard Note SN/SG/2607. Bloom, N. (2009) The Impact of Uncertainty Shocks, Econometrica, 77, 623-685. Bozzoli, C. and C. Mueller (2009). Perceptions and Attitudes to a Terrorist Shock:
Evidence from the UK, Economics of Security Working Paper 13. Cameron, A., J. Gelbach and D. Miller (2011) Robust Inferene With Multi-way
Clustering, Journal of Business and Economic Statistics, 29, 238-49. Chen, A. And T. Siems (2004) The Effects of Terrorism on Global Capital Markets,
European Journal of Political Economy, 20, 349-366. Craig, K. (2002) Examining Hate-Motivated Aggression: A Review of the Social
Psychological Literature on Hate Crimes as a Distinct Form of Aggression, Aggression and Violent Behaviour, 7, 85-101.
Deloughery, K., R. King and V. Asal (2012) Close Cousins or Distant Relatives? The
Relationship Between Terrorism and Hate Crime, Crime and Delinquency, forthcoming.
Disha, I., J. Cavendish and R. King (2011) Historical Events and Spaces of Hate: Hate
Crimes Against Arabs and Muslims in Post 9/11 America, Social Problems, 58, 21-46.
Draca, M., S. Machin and R. Witt (2011) Panic on the Streets of London: Crime, Police
and the July 2005 Terror Attacks, American Economic Review, 101, 2157-81.

24
Eskenazi, B., A. Marks, R. Catalano, T. Bruckner and P. Toniolo (2007) Low
Birthweight in New York City and Upstate New York Following the Events of September 11th, Human Reproduction, 22, 3013-3020.
Falk, A., A. Kuhn and J. Zweimuller (2011) Unemployment and Right Wing Extremist
Crime, Scandinavian Journal of Economics, 113, 260-85. Frey, B., S. Luechinger and A. Stutzer (2004) Valuing Public Goods: The Life
Satisfaction Approach, CESifo Working Paper Series. Gale, L., W. Heath and R. Ressler (2002) An Economic Analysis of Hate Crime,
Eastern Economic Journal, 28, 203-216. Gould, E. And E. Klor (2012) The Long-Run Effect of 9/11: Terrorism, Backlash, and
the Assimilation of Muslim Immigrants in the West, CEPR Discussion Paper 8797.
Gordon, C. and A. Arian (2001) Threat and Decision Making, Journal of Conflict
Resolution, 45, 196-215. Hird, C. And C. Ruparel (2007) Seasonality in Recorded Crime: Preliminary Findings,
Home Office Online Report 02/07. Ibish, H. and A. Stewart (2003) Report on Hate Crimes and Discrimination Against
Arab Americans, October, retrieved from http://www.adc.org/PDF/hcr02.pdf. Jaitman, L. and S. Machin (2013) Crime and Immigration: New Evidence From
England and Wales, IZA Journal of Migration, forthcoming. Krueger, A. and S. Pischke (1997) A Statistical Analysis of Crime Against Foreigners
in Unified Germany, The Journal of Human Resources, 32, 182-209. Lauderdale, D. (2006) Birth Outcomes for Arabic-Named Women in California Before
and After September 11, Demography, 43, 185-201. Medoff, M. (1999) Allocation of Time and Hateful Behavior : A Theoretical Analysis
of Hate and Hate Crimes, American Journal of Economics and Sociology, 58, 959-973.
Metcalfe, R., N. Powdthavee and P. Dolan (2011) Destruction and Distress: Using a
Quasi-Experiment to Show the Effects of the September 11 Attacks on Mental Well-Being in the United Kingdom, Economic Journal, 121, F81-103.
Poynting, S. And G. Noble (2004) Living with Racism: The Experience and Reporting
by Arab and Muslim Australians of Discrimination, Abuse and Violence Since 11 September 2001, Sydney Human Rights and Equal Opportunities Commission.

25
Sheridan, L. And R. Gillett (2005) Major World Events and Discrimination, Asian Journal of Psychology, 8, 191-197.
Siedler, T. (2006) Family and Politics: Does Parental Unemployment Cause Right Wing
Extremism, IZA Discussion Paper 2411. Simmons, J., C. Legg and R. Hosking (2003) National Crime Recording Standards
(NCRS): An Analysis of the Impact on Recorded Crime; Part Two: Impact on Individual Police Forces, Home Office Online report 32/03.
Smits, L., L. Krabbendam, R. de Bie, G. Essed, and J. van Os (2006) Lower Birth
Weight of Dutch Neonates who were in Utero at the Time of the 9/11 Attacks, Journal of Psychosomatic Research, 61, 715-717.
Sunstein, C. (2003) Terrorism and Probability Neglect, Journal of Risk and Uncertainty,
26, 121-136. Swahn, M., R. Mahendra and L. Paulozzi (2003) Violent Attacks on Middle Easterners
in the United States During the Month Following the September 11, 2001 Terrorist Attacks, Injury Prevention, 9, 187-189.
Viscusi, K. And R. Zeckhauser (2003) Sacrificing Civil Liberties to Reduce Terrorism
Risks, Journal of Risk and Uncertainty, 26, 99-120.

26
Figure 1: Trends in Hate Crimes by Ethnicity of Victim, Four Police Force Areas, January 2003 to December 2007
100
200
300
400
500
600
700
800
Hat
e C
rimes
Jan-03 7/7 Dec-07Month
Asian/Arab WhiteBlack
London
010
02
0030
0H
ate
Crim
es
Jan-03 7/7 Dec-07Month
Asian/Arab WhiteBlack
West Midlands
010
0H
ate
Crim
es
Jan-03 7/7 Dec-07Month
Asian/Arab WhiteBlack
Leicestershire
010
020
0H
ate
Crim
esJan-03 7/7 Dec-07
Month
Asian/Arab WhiteBlack
West Yorkshire

27
Figure 2: Trends in Hate Crimes by Ethnicity of Victim, Three Police Force Areas, February 2000 to March 2002
100
200
300
400
500
600
700
800
Hat
e C
rimes
Feb-00 9/11 Mar-02Month
Asian/Arab WhiteBlack
London
010
02
0030
0H
ate
Crim
es
Feb-00 9/11 Mar-02Month
Asian/Arab WhiteBlack
West Midlands
0
100
Hat
e C
rimes
Feb-00 9/11 Mar-02Month
Asian/Arab WhiteBlack
Leicestershire

28
Figure 3: 7/7 Impact - Time Varying Coefficients In The Following Twelve Months
-.1
0.1
.2.3
.4.5
Est
imat
ed C
oeffi
cien
t and
95%
CI
1 2 3 4 5 6 7 8 9 10 11 12Months After 7/7 (July 2005 = 1)
Notes: Estimated coefficient and 95% confidence interval from the column (1) specification in Table 5.

29
Figure 4:
9/11 Impact - Time Varying Coefficients In The Following Six Months
-.1
0.1
.2.3
.4.5
.6E
stim
ated
Coe
ffici
ent a
nd 9
5% C
I
1 2 3 4 5 6Months After 9/11 (September 2001 = 1)
Notes: Estimated coefficient and 95% confidence interval from the specification in Table 7.

30
Table 1: US Hate Crime Statistics
Year Total Hate Crimes Reported Offenders' Reported Motivations Religious Bias Anti-Islamic 1997 8049 1385 28 1998 7755 1390 21 1999 7876 1411 32 2000 8063 1472 28 2001 9730 1828 481 2002 7462 1426 155 2003 7489 1343 149 2004 7649 1374 156 2005 7163 1227 128 2006 7722 1462 156 2007 7624 1400 115 2008 7783 1519 105
Notes: From the Anti-Defamation League's Washington Office based upon FBI information (www.adl.org).

31
Table 2: Major Offence Categories For Hate Crimes Committed Against Asians and Arabs in London
(January 1998 to March 2010)
Offence Category Total Hate Crimes Reported Percentage Violence against the person 45078 76.9 Criminal damage 10605 18.1 Robbery 908 1.5 Theft and handling 872 1.5 Other notifiable offences 821 1.4 Burglary 240 0.4 Fraud or forgery 66 0.1 Sexual offences censored censored Total 58590 100
Notes: From Metropolitan Police Service records supplied in freedom of information request.

32
Table 3: Numbers of Hate Crimes in Pre-Attack and Attack Months
7/7
9/11
A. All Pre-Attack Months
January 2003 to
June 2005
July 2005
Gap and Difference-in-
Difference
February 2000 to
August 2001
September 2001
Gap and Difference-
in-Difference Asian&Arab Hate Crimes 271 367 96 (17) 435 532 97 (22) White&Black Hate Crimes 428 482 53 (5) 709 635 -74 (50)
Levels DiD: 43 (13)
Levels DiD: 171 (71) Logs DiD: 0.15 (0.04) Logs DiD: 0.28 (0.04) B. Same Pre-Attack Months July 2003 and
July 2004 July 2005 Gap and Difference-in-
Difference September 2000 September 2001 Gap and Difference-
in-Difference Asian&Arab Hate Crimes 311 367 56 (10) 420 532 112 (34) White&Black Hate Crimes 512 482 -30 (43) 699 635 -64 (38)
Levels DiD: 87 (39)
Levels DiD: 176 (72) Logs DiD: 0.20 (0.08) Logs DiD: 0.37 (0.05) Notes: Population weighted; standard errors clustered by area (with small cross-section sample adjustment from Cameron, Gelbach and Miller, 2011) in parentheses.
33
Table 4: Pre-7/7 Trends in Hate Crimes Against Asians & Arabs and Whites & Blacks (Four Police Force Areas, January 2003 to June 2005)
∆12Log(Asian&Arab
Hate Crimes)
∆12Log(White&Black
Hate Crimes)
∆12Log(Asian&Arab Hate Crimes) -∆12Log(White&Black Hate Crimes)
(1)
(2)
(3)
A. All Areas (N = 72) Trend -0.001 (0.002) -0.003 (0.007) 0.002 (0.007) B. London (N = 18) Trend -0.001 (0.005) -0.011 (0.007) 0.009 (0.006) C. Leicestershire, West Midlands And West Yorkshire (N = 54)
Trend -0.000 (0.005) 0.008 (0.005) -0.008 (0.010)
Notes: All models estimated on monthly data across four police force areas from January 2003 to June 2005; Population weighted; Seasonally differenced across the same months in adjacent years; Standard errors clustered by area (with small cross-section sample adjustment from Cameron, Gelbach and Miller, 2011) in parentheses.
34
Table 5: Hate Crimes and the 7/7 Terror Attacks
Treatment Period
D-i-D:
∆12Log(Asian&Arab Hate Crimes) - ∆12Log(White&Black Hate Crimes)
(1)
(2)
A. Month of Terror Attack (N=76) 7/7 0.267 (0.095) 0.256 (0.039) B. 3 Months From Terror Attack (N=84) 7/7 0.226 (0.064) 0.212 (0.043) C. 6 Months From Terror Attack (N=96) 7/7 0.170 (0.048) 0.170 (0.048) D. 12 Months From Terror Attack (N=120) 7/7 0.100 (0.033) 0.154 (0.072)
Notes: All models estimated on monthly data across four police force areas from January 2003 to June 2006. Estimates are population weighted from regressions that are estimated on seasonally differenced across the same months in adjacent years. In these differenced models, the pre-attack period covers January 2004 to June 2005 (sample size, N, is 72) and the post-attack period is defined sequentially in moving from Panel A to Panel D. Standard errors clustered by area (with small cross-section sample adjustment from Cameron, Gelbach and Miller, 2011) in parentheses. A dummy for the Birmingham race riot in October 2005 and for the introduction of the True Vision recording scheme in West Yorkshire from June 2005 onwards are included where relevant, and the specifications in column (2) include a monthly time trend.

35
Table 6: Separate 7/7 Impact Estimates by Police Force Area
Treatment Period
D-i-D:
∆12Log(Asian&Arab Hate Crimes) – ∆12Log(White&Black Hate Crimes)
London
Leicestershire, West Midlands
and West Yorkshire
A. Month of Terror Attack (N=76) 7/7 0.322 (0.049) 0.181 (0.075) N 19 57 B. 3 Months From Terror Attack (N=84) 7/7 0.244 (0.049) 0.193 (0.059) N 21 63 C. 6 Months From Terror Attack (N=96) 7/7 0.162 (0.051) 0.186 (0.082) N 24 72 D. 12 Months From Terror Attack (N=120) 7/7 0.073 (0.050) 0.156 (0.055) N 30 90
Notes: As for the specifications in column (1) of Table 5.

36
Table 7: Hate Crimes Against Asians/Arabs and the 9/11 Terror Attacks
D-i-D:
∆12Log(Asian&Arab Hate Crimes) – ∆12Log(White&Black Hate Crimes)
(1) (2) (3) Month of Terror Attack
(N = 24) 3 Months From Terror Attack
(N = 30) 6 Months From Terror Attack
(N = 39) 9/11 0.280 (0.082) 0.223 (0.066) 0.109 (0.070)
Notes: Estimates from monthly data across three police force areas from February 2000 to March 2002. Estimates are population weighted from regressions that are estimated on seasonally differenced across the same months in adjacent years. In these differenced models, the pre-attack period covers February 2001 to August 2001 (sample size, N, is 21) and the post-attack period is defined sequentially in moving across the specifications in column (1) through (3) in the Table. Standard errors clustered by area (with small cross-section sample adjustment from Cameron, Gelbach and Miller, 2011) in parentheses.
37
Appendix National Changes in Recording Practices The crime data we obtained from four police force areas in a Freedom of Information request sent in the Summer of 2010 are potentially subject to various recording changes that occurred both locally and nationally. There were two important national changes in crime recording during the time period of study (Berman, 2008). These affect the start and end dates of our study periods and mean that we carry out our 9/11 and 7/7 analyses for different time periods. The two changes are: i) The first was a change to Home Office counting rules which occurred in 1998/1999. New crime types were recorded in crime statistics for the first time; minor criminal damage was recorded where before it had not been, and there was a shift towards counting one crime per victim, rather than per offender. The result was a significant increase in the number of crimes recorded. The change affected different crime types and areas differently. Drug offences and violent crime saw the greatest increases as a result of the new counting rules. All of the police forces, with the exception of the MPS, warned that data prior to February 2000 either lacked accuracy or was different due to changes in Home Office counting rules. For this reason, we begin any potential analysis in February 2000. ii) The second major change was this introduction of the National Crime Recording Standard (NCRS) in April 2002. The purpose of this was to standardise crime recording practices across police forces to allow between-force comparisons and to generate a better estimate of the national crime level. The purpose of the NCRS was also to move towards victim-focused crime recording, with 'victimless crimes' not being recorded under the new guidelines. The total impact of the NCRS is estimated to be approximately a 10% increase in crime in 2002/3 over the pre-NCRS level. However, different offence categories were affected differently – the greatest increase was in violence against the person, which is estimated to have increased by 23% nationally after introduction of the NCRS (Berman, 2008). The majority of hate crime falls into this category (as shown in Tables 2 of the paper - 77% of hate crimes are 'violence against the person', compared with 19% of all crime), and so the effects of the NCRS on hate crime are likely to be significant. Analysis of the effects of the NCRS on individual police-forces can be found in Simmons, Legg and Hosking (2003). Leicestershire adopted the NCRS in April 2002, but also adopted a Centralised Crime Recording Bureau in August 2002. An increase in the number of crimes recorded, especially violent crimes, has been noted since the introduction of the NCRS, but the size of the effect cannot be untangled from the effect of the recording change which occurred several months later. The MPS also adopted the NCRS in April 2002. It estimates the effect on all crime for the financial year 2002/3 to be approximately 12%, and 20% for violence against the person. The West Midlands adopted the NCRS in January 1999, along with the revised Home Office counting rules and so there is no change in trend for 2002/3. Owing to the introduction of the NCRS we stop our analysis of 9/11 in March 2002. Our 7/7 analysis runs from January 2003 to December 2007 and so is unaffected.

38
Local Changes in Recording Practices In terms of local changes in recording practices, West Yorkshire adopted the NCRS in February 2002 and experienced the largest effect, with an estimated 47% NCRS impact on violence against the person for the year 2002/3. In addition, to the national recording changes, West Yorkshire also implemented some regional recording and reporting changes during the period studied. These were documented in the FOI response as follows:
1) 1999: The MacPherson Report introduced a new definition of what constituted a racist crime/incident.
2) 2000: policing divisions in West Yorkshire appointed hate crime co-ordinators 3) December 2003: Introduction of a Vulnerable & Intimidated Victim Database
(VIVID) to record and monitor incidents of domestic violence, hate and child abuse 4) June 2005: West Yorkshire Police signed up to the True Vision third party recording
scheme for hate crimes. As a result we excluded West Yorkshire from the 9/11 analysis study period.