guidebook on the methods to estimate non-motorized travel · needs, assumptions) of each method...
TRANSCRIPT
Guidebook on Methods to Estimate Non-Motorized Travel:Overview of MethodsPUBLICATION NO. FHWA-RD-98-165JULY 1999
U.S. Department of TransportationFederal Highway Administration
Research, Development, and TechnologyTurner-Fairbank Highway Research Center6300 Georgetown PikeMcLean, VA 22101-2296
U.S. Dept. of Transportation's Federal Highway Administration - Research, Development, & Technology
Guidebook on Methods to Estimate Non-Motorized Travel: Overview of Methods (July 1999)
Table of Contents
Title Page
Foreword
Technical Documentation Page
1.0 Introduction
1.1 Purpose of Guidebook1.2 The Importance of Forecasting Demand1.3 How to Use This Guidebook
2.0 Introduction to Non-Motorized Travel Forecasting
2.1 Dimensions of Travel Behavior2.2 Perspectives on Modeling Travel Behavior2.3 The Four-Step Urban Transportation Planning Process2.4 Factors Specifically Influencing Bicycling and Walking2.5 Differences in Forecasting Bicycle vs. Pedestrian Travel
3.0 Guide to Available Methods
3.1 Overview of Methods
Demand Estimation Comparison StudiesAggregate Behavior StudiesSketch Plan MethodsDiscrete Choice ModelsRegional Travel ModelsRelative Demand Potential Market AnalysisFacility Demand PotentialSupply Quality Analysis Bicycle and Pedestrian Compatibility MeasuresEnvironment FactorsSupporting Tools and Techniques Geographic Information SystemsPreference Surveys
3.2 Key Characteristics and Uses of Each Method
4.0 Conclusions and Future Needs
4.1 Conclusions

4.2 Future Needs Development of a Manual for Bicycle and Pedestrian Sketch-Planning
Research on Factors Influencing Non-Motorized Travel BehaviorIntegration of Bicycle and Pedestrian Considerations into MainstreamTransportation Models and Planning
U.S. Dept. of Transportation's Federal Highway Administration - Research, Development, & Technology
Guidebook on Methods to Estimate Non-Motorized Travel: Overview of Methods (July 1999)
FOREWORD
This two-volume guidebook describes and compares the various methods and tools that can beused to forecast non-motorized travel demand or that otherwise support the prioritization andanalyses of bicycle and pedestrian facilities. The guidebook is intended to be used by bicycle andpedestrian planners, technical staff, researchers, advocates, and others who may wish to estimatebicycle and pedestrian travel demand or to prioritize bicycle and pedestrian projects.
This first volume, Overview of Methods, provides a concise overview for each available methodand tool, including some typical applications, pros and cons, and a quick reference guide on easeof use, data requirements, sensitivity to design factors and whether widely used. It discussesgeneral issues for consideration in forecasting non-motorized travel demand, such as thedimensions of travel behavior and factors influencing bicycling and walking, and identifiesfuture needs in this arena. The other volume, Supporting Documentation, provides the details onthe methods as well as real world examples.
NOTICE
This document is disseminated under the sponsorship of the Department of Transportation in theinterest of information exchange. The United States Government assumes no liability for itscontents or use thereof. This report does not constitute a standard, specification, or regulation.
The United States Government does not endorse products or manufacturers. Trade andmanufacturers' names appear in this report only because they are considered essential to theobject of the document.
U.S. Dept. of Transportation's Federal Highway Administration - Research, Development, & Technology
Guidebook on Methods to Estimate Non-Motorized Travel: Overview of Methods (July 1999)
1.0 Introduction1.1 Purpose of GuidebookThe need for improved conditions for bicyclists and pedestrians has received increasing attentionin recent years in transportation planning circles. Planners are recognizing a growing popularinterest in bicycling and walking for health and recreation, the desire to promote alternatives toautomobile travel for environmental reasons, and the need to provide safe and convenient traveloptions for the entire population. At the same time, the question of how many people willactually use new or improved bicycle and pedestrian facilities is gaining attention andimportance. Planners and policy makers need to be convinced that the benefits of improvementsare worth the costs. Furthermore, they want to know where to spend limited resources to get themost "bang for the buck" as measured by benefits to users.
This guidebook was developed in response to the need to predict bicycle and pedestrian or "non-motorized" travel. The guidebook is intended to provide a means of addressing the followingrelated questions:
• If we build a new bicycle or pedestrian facility, how many people will use it?
• If we improve an existing facility or network, how many additional people will choose towalk or bicycle?
• What types and combinations of improvements will have the greatest impact onincreasing non-motorized travel?
• How will improvements to non-motorized travel conditions affect motor vehicle use?
The guidebook describes and compares the various methods that have been developed to predictfuture levels of bicycle and pedestrian travel, i.e., "travel demand." The guidebook also discussesother quantitative methods that support demand forecasting but do not actually predict futuredemand. These include (1) analyses of the potential market for bicycling and walking; (2) "levelof service" measures and "environment factors" which describe the quality of the supply ofbicycle and pedestrian facilities; and (3) supporting tools and techniques such as GeographicInformation Systems (GIS) and preference

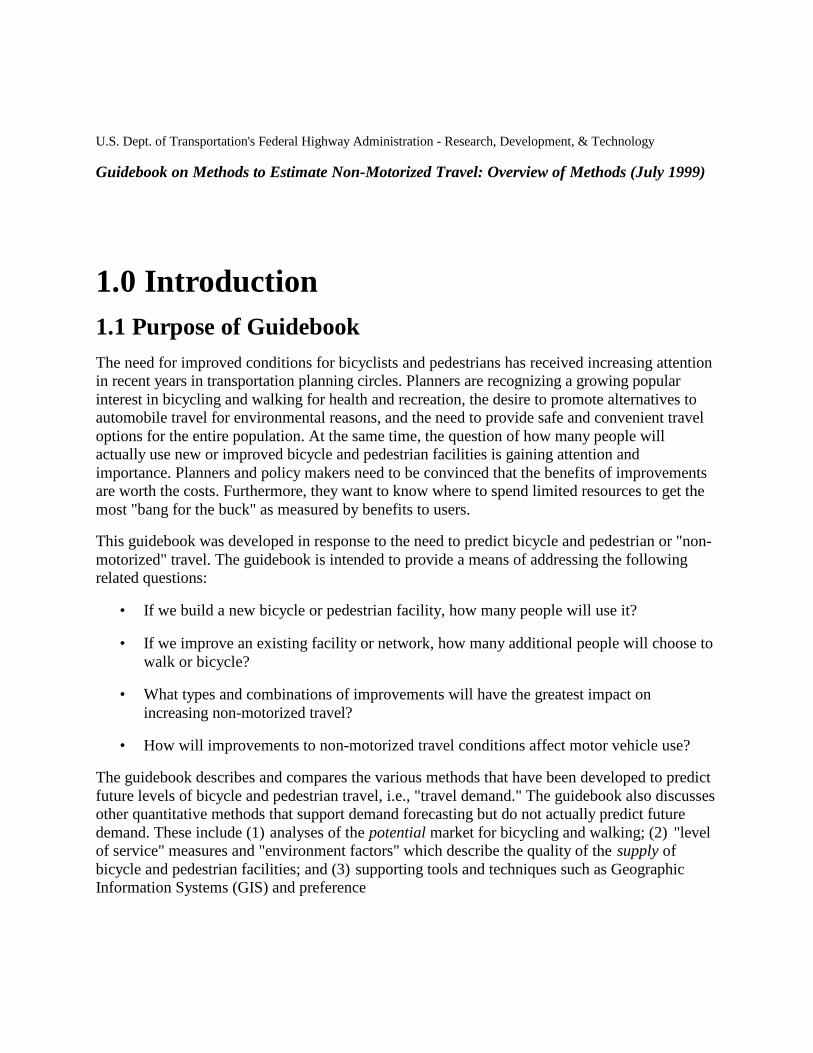
Figure 1.1 If We Build a New Bicycle or Pedestrian Facility,How Many People Will Use It?
surveys. The guidebook is intended to be used by bicycle and pedestrian planners, technical staff,researchers, advocates, and others who may wish to apply these methods to estimate bicycle andpedestrian travel demand and/or to prioritize bicycle and pedestrian projects.
While all of these methods focus on non-motorized travel, some important distinctions in scopecan be identified. Some methods are directed specifically at either bicycle or pedestrian travel,while others are generally relevant to both. Some methods focus on demand for a specificfacility, such as a bicycle lane or shared-use trail, while others focus on travel over an entire area,such as a city or census tract. Finally, the methods differ in the extent to which they considertrips made for recreational, as opposed to utilitarian, purposes(2).
The guidebook is based on an extensive international review of both published and unpublishedsources. Most of the methods were developed in the United States and Europe, but examples arealso included from Japan, Australia, and South America. While it is doubtless that some relevantsources and methodologies have been overlooked, the guidebook should serve as a reasonablycomplete review of methods currently available to the bicycle and pedestrian planner.
1.2 The Importance of Forecasting DemandThere are many compelling reasons both to apply existing methods of forecasting bicycle andpedestrian travel and to advance the state-of-the-practice in this area. If properly done, demandforecasting has a variety of uses including:
• Estimating the benefits of a proposed project, such as number of users served, reductionsin automobile emissions and energy consumption, or time and cost savings to travelers;
• Prioritizing projects based on the greatest benefit to existing users or on the greatestpayoff in attracting new bicyclists or walkers;
• Planning bicycle or pedestrian networks and identifying and correcting deficiencies inexisting networks, based on desired travel patterns and facility characteristics; and
• Planning for bicycle and pedestrian safety by developing exposure information forcrash/safety models. In the United States in particular, two recent developmentsunderscore the importance of quantifying demand:
• The 1994 U.S. Supreme Court Dolan vs. Tigard decision. This decision mandates thatlocal jurisdictions quantify proposed bicycle project benefits when the project involvesprivate land dedications under master plans.
• The 1998 passage of the Transportation Equity Act for the 21 st Century (TEA-21). TEA-21 continues and expands provisions of its predecessor, the Intermodal SurfaceTransportation Efficiency Act of 1991 (ISTEA), to improve facilities and safety forbicycles and pedestrians. TEA-21 places an emphasis on quantifying the air quality andcongestion alleviation benefits of projects, including bicycle and pedestrian projects toreceive funding under the Congestion Mitigation and Air Quality (CMAQ) program(3).TEA-21 also adds "bicycle transportation and pedestrian walkways" to the list of eligibleprojects for National Highway System Funds and expands eligibility for funding underother programs(4). Estimates of the benefits of bicycle and pedestrian projects will beuseful in competing for funding under these programs.
All of these reasons underscore the need to apply available demand forecasting methods and tocontinually advance these methods. Forecasts of demand provide a much needed complement toother considerations, such as improvements to safety and convenience for existing users, inplanning bicycle and pedestrian facilities.
Nevertheless, many people in the bicycle and pedestrian planning and advocacy communities areskeptical of demand forecasting, and raise valid points about its limitations. Skeptics argue thatthe factors influencing non-motorized travel are largely attitudinal and cannot be easily describedor quantified in models. They further believe that comprehensive efforts to improve facilities,policies, and social attitudes toward bicycling and walking are required, and that such measureswould result in significant mode shifts that would not be predicted by existing models. Otherstake the philosophical viewpoint that conditions for bicyclists and pedestrians should beimproved simply as a matter of fairness to existing users, regardless of whether new users wouldbe attracted. Still others are concerned that a focus on predicting demand will divert muchneeded energy away from the actual implementation of bicycle and pedestrian improvements.
These arguments, although valid, should not detract from the usefulness of forecasting bicycleand pedestrian travel demand. A simple "if you build it, they will come" attitude is not sufficientgiven that resources for implementing projects are limited. Existing forecasting methods, evengiven their limitations, can help allocate resources toward the most beneficial projects and canhelp determine which improvements will attract the most new users. Furthermore, futuredevelopments have the potential to greatly increase the accuracy and usefulness of thesemethods. While qualitative assessment based on experience and judgment will continue to play akey role in identifying projects with the greatest benefits, quantitative methods can becomeincreasingly useful in providing information for planning and decision making.
1.3 How to Use This GuidebookThis guidebook consists of two parts: Overview of Methods and Supporting Documentation.
Overview of Methods provides a concise overview of the available methods and of general issuesfor consideration in forecasting demand for non-motorized travel. Supporting Documentationprovides substantially more detail on the methods described in the guidebook and identifiessources and real-world applications for the methods.
The contents of Overview of Methods include:
• Section 2.0- An introduction to non-motorized travel demand forecasting, including waysin which travel behavior can change, general approaches to travel demand forecasting,factors specifically influencing bicycle and pedestrian travel, and differences inforecasting bicycle vs. pedestrian travel.
• Section 3.0 - An introduction to 11 classes of methods, and a one-page overview of eachwhich includes a description, typical applications, advantages, and disadvantages.Section 3.0 also contains a summary of key characteristics and uses of each method aswell as a guide to choosing an appropriate method for a specific purpose.
• Section 4.0 - A summary of this guidebook and a discussion of the limitations of existingforecasting methods and future research needs for improving non-motorized demandforecasting.
Supporting Documentation includes:
• Section 1.0 - A description of the research methodology and a categorization of themethods according to their major purposes.
• Section 2.0 - An in-depth, structured description (e.g., purpose, structure, inputs/dataneeds, assumptions) of each method along with evaluative criteria. Multiple variations onsome methods are included, as well as specific examples and real-world applications.
• Section 3.0 - An annotated bibliography of references on demand forecasting methods,supporting tools and techniques, and factors influencing the choice to walk or bicycle.
• Section 4.0 - A list of individuals and organizations contacted in developing thisguidebook.
1Bicycling and walking are the most common forms of non-motorized travel in most countries and the term "non-motorized" is used herein to refer collectively to bicycle and pedestrian travel. Nevertheless, the term "non-motorized" could also refer to many other forms of travel such as in-line skating, skateboarding, or horseback riding.The methods discussed in this document may be applicable to these other forms of non-motorized travel althoughspecific applications have not been identified.2A significant weakness of existing methods is that none differentiate explicitly between utilitarian and recreationaltravelers. The two travel markets have very different characteristics and needs, and a greater focus on thesedistinctions would help improve the accuracy and usefulness of travel forecasting methods in the future.3Title I, Sections 1110.4Title I, Sections 1106 and 1202.
U.S. Dept. of Transportation's Federal Highway Administration - Research, Development, & Technology
Guidebook on Methods to Estimate Non-Motorized Travel: Overview of Methods (July 1999)
2.0 Introduction to Non-Motorized TravelForecasting2.1 Dimensions of Travel BehaviorThe objective of travel demand forecasting is to predict changes in travel behavior andtransportation conditions as a result of proposed transportation projects, policies, and futurechanges in socioeconomic and land use patterns. For non-motorized forecasting in particular, theobjective is generally to predict the change in the number or characteristics of bicycle,pedestrian, or vehicle-trips as a result of facility improvements or policy changes which aredesigned to make bicycling or walking more attractive. In addition to affecting overall levels ofnon-motorized travel, changes in non-motorized travel conditions may affect travel behavior in avariety of ways:
• Trip making. A high-quality walking and bicycling environment is likely to increasetotal person travel, while a poor quality environment may lead some people to choose notto travel.
• Trip location. A high-quality pedestrian and bicycling environment may cause changesin the choice of destinations, e.g., diverting travel from more distant automobile-accessible areas to closer-by pedestrian-oriented locations.
• Mode choice. Changes in the quality of the travel environment may spur changes notonly in the number of people who walk and bicycle, but also decrease the propensity touse public transportation, rideshare, or to drive an automobile.
• Route choice. Changes in the quality of the travel environment may spur changes in theuse of various routes by pedestrians and bicyclists.
• Trip scheduling. The quality of the travel environment may vary by time-of-day (e.g.,with changes in on-street parking regulations or non-peak-period traffic restrictions) andmay also affect trip scheduling of motorized travel. For example, bicyclists may chooseto make trips when there is less motor vehicle traffic.
• Land use. Changes in the travel environment may spur changes in land use over a periodof several years or more, with some locations becoming more or less desirable for certaintypes of uses. For example, pedestrian-friendly urban environments may be moreattractive, thus increasing development in these areas.

• Distribution of effects. Changes in the pedestrian and bicycling environment are likelyto have widely varying effects on different segments of the population. For example,some types of improvements will primarily benefit recreational users while others willbenefit those for whom bicycling or walking is the primary means of transportation.
Figure 2.1 A High-Quality Walking Environment MayCause Changes in the Choice of Destinations
2.2 Perspectives on Modeling Travel BehaviorA variety of forecasting methods has been developed to predict changes in travel behavior.Forecasting methods are generally founded on theoretical models and then verified by empiricalstudies, which describe how people change their behavior in response to changes in the majorfactors which influence this behavior.
Travel behavior, including non-motorized behavior, may be studied or modeled from twoperspectives:
The aggregate perspective. Aggregate studies look at travel from an areawide perspective. Theyattempt to relate characteristics of an area (e.g., population, employment, or average income) totravel characteristics of that area (e.g., average number of trips per household, or the number orpercent of trips made by foot or bicycle). In the context of non-motorized travel, these studiesmay also look at characteristics of specific facilities (e.g., roadway and sidewalk width or type)in conjunction with characteristics of the surrounding area (e.g., population density, or number ofstudents) to predict the number of people using the facility.
The disaggregate or individual perspective. Disaggregate studies look at travel decisions fromthe perspective of the individual. The individual's personal characteristics (e.g., age, gender,attitudes, beliefs) interact with the travel options available to them (e.g., time, cost, comfort ofcompeting modes). To predict overall demand, models of individual behavior are applied across
a population with known characteristics.
Each approach has its advantages and disadvantages. Aggregate-level methods tend to berelatively easy to apply, with readily available data sources and computational methods, and canbe useful for sketch-planning purposes. Disaggregate-level methods are more complicated todevelop but can be much more effective at predicting behavior changes. This is because theyexplain individual choices rather than making generalizations based on overall populationcharacteristics.
2.3 The Four-Step Urban Transportation Planning ProcessVariations on both the aggregate and disaggregate approaches can be developed and applied asstand-alone travel demand forecasting methods, appropriate for specific purposes. Alternatively,a set of methods can be applied in conjunction with each other to create a larger modelingframework. The four-step Urban Transportation Planning Process (UTPP) (Weiner, 1997), firstdeveloped in the 1950s to forecast automobile travel and now applied in urban areas throughoutthe world, is an example of such a framework. To predict how travel patterns will change as aresult of future changes in land use patterns and the transportation system, this frameworkintegrates models of various aspects of travel behavior (e.g., trip-making or mode choice) withspatial information on land use patterns and the transportation network.
The UTPP is important to understand because it is widely used in transportation planning andbecause of its potential for integrating bicycle and pedestrian with automobile and transit travelforecasting. The basis for UTPP models is the division of the urban area into traffic analysiszones (TAZs), which may correspond to census tracts, and the definition of a network oftransportation facilities connecting the zones (figure 2.1). The network is described by the timeand cost of travel, for each mode, between each pair of zones. Inputs include proposed futuretransportation networks and forecast population and employment characteristics by zone. A four-step process is then used to forecast travel:
1. Trip generation - Total trips generated by persons that start and end in each zone arepredicted, based on the population, employment, household characteristics, etc., of the zone;
2. Trip distribution - The trips are distributed among pairs of zones, usually based on a gravitymodel which distributes trips in inverse proportion to the distance between zones;
3. Mode choice - The trips are allocated among the available travel modes, based on relativecharacteristics (usually time and cost) of the modes; and
4. Network assignment - The trips are assigned to specific links (road segments) in thetransportation network, generally based on the shortest time path between two zones.
The different stages of the process may include both aggregate and disaggregate behaviormodels. In addition, these models have sometimes been modified to incorporate additional travelbehavior factors, such as feedback from later steps to earlier steps (e.g., congestion influencingtrip generation and mode choice) or variations in travel by time of day.
The UTPP framework has primarily been applied to automobiles and transit but is increasinglybeing modified to include bicycles and pedestrians. Non-motorized modes can be incorporated in
the models in various ways. For example, a bicycle or pedestrian network can be defined.Bicycling and walking can be included as modes in the mode choice model. The advantages andlimitations of this framework for modeling non-motorized travel are discussed more fully underthe specific entries on "Regional Travel Models" in Section 3.0 and in the SupportingDocumentation.
2.4 Factors Specifically Influencing Bicycling and WalkingStandard travel demand modeling procedures generally predict total trip-making and modechoice based on a limited number of variables, such as household characteristics and the timeand cost of competing modes. These factors, however, only partially explain the decision tobicycle or walk. Development of non-motorized travel forecasting methods requiresconsideration of a range of factors specific to non-motorized modes. From an individualperspective, personal factors, environmental factors, and trip characteristics interact to determinewhether a trip is made by bicycle, foot, or other mode. The specific factors which are importantvary depending on whether the mode being discussed is bicycling or walking.
If behavior studies are performed from an aggregate-level perspective, factors must be identifiedwhich proxy for the personal and environmental factors seen from the individual's perspective.For example, median income of an area may represent household income, or average vehicletravel speeds and parking costs in a city may serve as a proxy for the time and cost of travel byautomobile for a particular trip. Figure 2.2 presents a framework for how a general set of factors,including facility design factors, interact to affect non-motorized travel levels, both overall andfor specific facilities (links) in a network. These factors are described in table 2.1.
Regardless of whether models are developed at the disaggregate or aggregate level, it isimportant to remember that decision making ultimately occurs at the individual level and that aforecasting procedure should approximate the individual decision-making process as closely aspossible.

Figure 2.2 Structure of Regional Travel Model
Figure 2.3 Relationship of Factors Influencing Non-Motorized Travel
Table 2.1 Description of Factors Influencing Non-Motorized Travel.
B Variable Description

ox
A.LinkCharacteristics
Measurable characteristics of a link in a road or path network (e.g., traffic volume, lane width, orpavement quality).
B. Link"Friendliness"
The overall acceptability of a link as a bicycle or pedestrian route - a function of linkcharacteristics. Also varies by user characteristics (e.g., experienced vs. novice bicyclist).
C. NetworkCharacteristics
Characteristics of a network of links (e.g., connectivity) which determine its overall acceptabilityor "friendliness" to the user.
D.Network"Friendliness" A general measure of how acceptable the local road/path network is for bicycling or walking.
E. SupportingPolicies
Other programs, policies, facilities, etc., which affect the acceptability of bicycling or walking(e.g., bicycle parking, showers/lockers, and educational programs).
F. PopulationCharacteristics
Characteristics of the local population which relate to likelihood of bicycling or walking (e.g.,socioeconomic characteristics, or attitudes).
G.Climate/Weather
General propensity to walk or bicycle, as a function of climate/weather. This might be considereda constant for a given area/region.
H.Characteristicsof OtherModes
Relative travel times and costs of bicycling or walking vs. other modes, as well as safety,comfort, or other factors which influence choice of mode. Policy variables might include parkingpricing, transit service improvements, etc.
I. Land Use Density and distribution characteristics of population, employment, shopping, and other activitieswhich affect where people travel, how many trips are generated, trip length, etc.
J.Total Non-MotorizedTrip Making
Overall level of non-motorized trip making in an area as a result of the above factors.
K.Link-LevelTrips
Non-motorized trips on a specific facility or link as a function of local trip generation/distributioncharacteristics and route choice based on link "friendliness."
Finally, it should be kept in mind that the factors shown in table 2.1 may influence anindividual's travel behavior decisions at a variety of stages, not just on a trip-by-trip basis. For
example, the individual must first decide to even consider bicycling or walking as a viable traveloption. Only when this is done does the question of whether to bicycle or walk for a particular
trip become relevant.
2.5 Differences in Forecasting Bicycle vs. Pedestrian TravelBicycle and pedestrian travel are collectively referred to throughout this guidebook as non-motorized travel, and each class of forecasting methods discussed is generically applicable toboth. Nevertheless, significant differences exist between the two modes, both in terms of travelcharacteristics and factors influencing the decision process. These differences are apparent in thespecific examples of the methods, most of which were developed for either bicycles orpedestrians, as discussed in the supporting documentation of this guidebook. Some of the mostsignificant differences include:
Pedestrian trips are generally shorter than bicycle trips. This is important because
appropriate analysis methods may depend on the spatial scale of analysis. For example, ananalysis of pedestrian conditions may consider every block in a small area, while an analysis ofbicycle conditions may focus on through bicycle routes.
A large percentage of pedestrian trips are actually trips to access other modes , including theautomobile or transit. Bicycle trips, in contrast, are primarily stand-alone trips (although bicycleaccess to transit is an important type of non-motorized travel). Therefore, local pedestrian travelwill largely result from automobile and transit trips rather than replacing these trips, andmodeling transit vs. auto mode choice will be relevant to predicting pedestrian travel.Conversely, pedestrian access factors will be important in predicting transit vs. auto modechoice, since the quality of the environment for walking may influence the decision to usetransit.
Perhaps most significantly, the decision to ride a bicycle involves a greater conceptual leapthan the decision to walk. Everyone is a pedestrian, but not everyone is a bicyclist. Insightsfrom the public health and social marketing fields suggest that the decision to even considerriding a bicycle is a multi-staged process involving a variety of interacting personal, social, andenvironmental factors. The choice to bicycle for a particular trip depends not only on the specificcharacteristics of that trip but on the individual's attitude toward and willingness to bicycle.While attitudinal research gives important insights into pedestrian and transit travel choices aswell, its implications are perhaps most significant for bicycle travel.
U.S. Dept. of Transportation's Federal Highway Administration - Research, Development, & Technology
Guidebook on Methods to Estimate Non-Motorized Travel: Overview of Methods (July 1999)
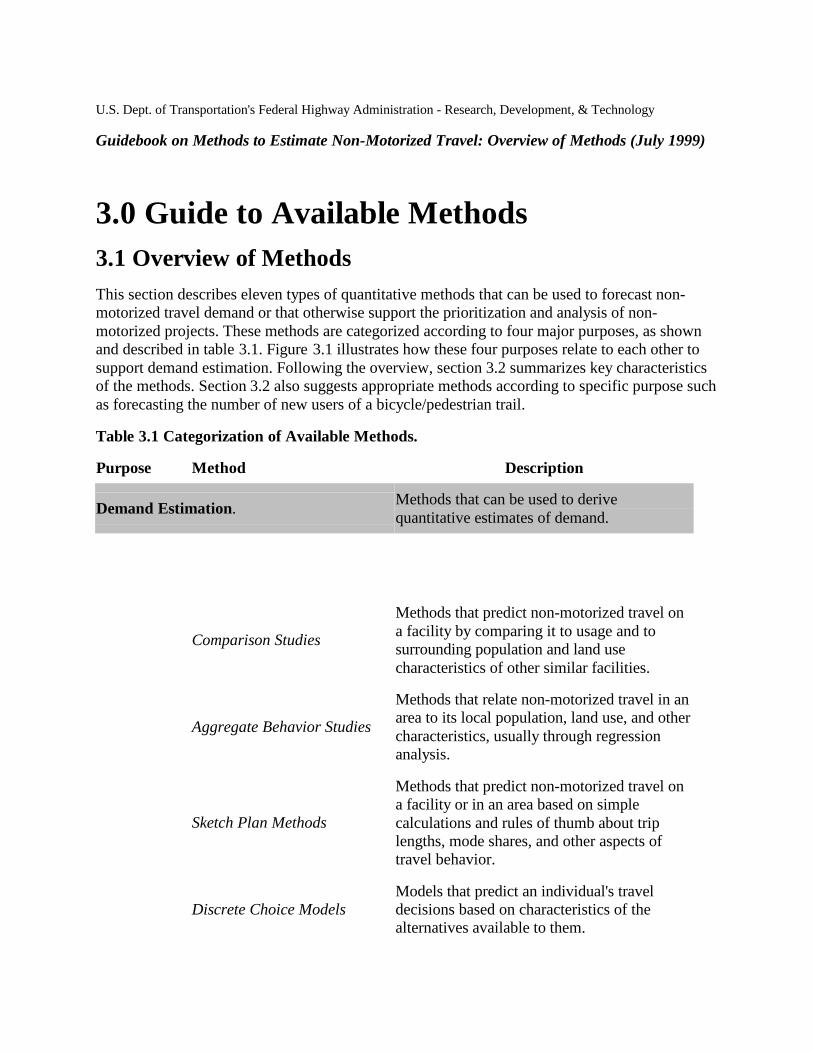
3.0 Guide to Available Methods3.1 Overview of MethodsThis section describes eleven types of quantitative methods that can be used to forecast non-motorized travel demand or that otherwise support the prioritization and analysis of non-motorized projects. These methods are categorized according to four major purposes, as shownand described in table 3.1. Figure 3.1 illustrates how these four purposes relate to each other tosupport demand estimation. Following the overview, section 3.2 summarizes key characteristicsof the methods. Section 3.2 also suggests appropriate methods according to specific purpose suchas forecasting the number of new users of a bicycle/pedestrian trail.
Table 3.1 Categorization of Available Methods.
Purpose Method Description
Demand Estimation. Methods that can be used to derivequantitative estimates of demand.
Comparison Studies
Methods that predict non-motorized travel ona facility by comparing it to usage and tosurrounding population and land usecharacteristics of other similar facilities.
Aggregate Behavior Studies
Methods that relate non-motorized travel in anarea to its local population, land use, and othercharacteristics, usually through regressionanalysis.
Sketch Plan Methods
Methods that predict non-motorized travel ona facility or in an area based on simplecalculations and rules of thumb about triplengths, mode shares, and other aspects oftravel behavior.
Discrete Choice ModelsModels that predict an individual's traveldecisions based on characteristics of thealternatives available to them.

Regional Travel Models
Models that predict total trips by trip purpose,mode, and origin/destination and distributethese trips across a network of transportationfacilities, based on land use characteristicssuch as population and employment and oncharacteristics of the transportation network.
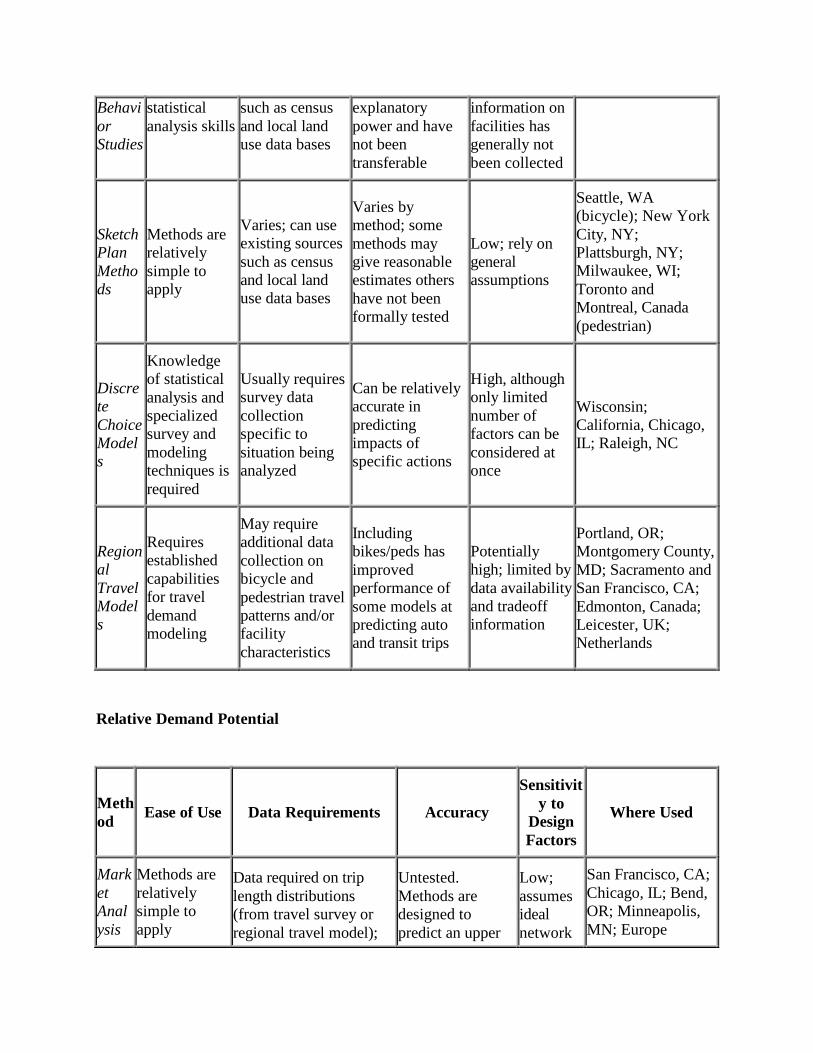
Table 3.1 Categorization of Available Methods (continued)
Purpose Method Description
Relative DemandPotential
Methods that do not predict actual demand levels, but which canbe used to assess potential demand for or relative levels of non-motorized travel.
MarketAnalysis
Methods that identify a likely or maximum number of bicycle orpedestrian trips that may be expected given an ideal network offacilities.
FacilityDemandPotential
Methods that use local population and land use characteristics toprioritize projects based on their relative potential for use.
Supply Quality Analysis
Methods that describe the quality of non-motorized facilities(supply) rather than the demand for such facilities. These may beuseful for estimating demand if demand can be related to thequality of available facilities.
Bicycle andPedestrianCompatibilityMeasures
Measures that relate characteristics of a specific facility such assafety to its overall attractiveness for bicycling or walking.
EnvironmentFactors
Measures of facility and environment characteristics at the arealevel that describe how attractive the area is to bicycling orwalking.
Supporting Tools andTechniques Analytical methods to support demand forecasting.

GeographicInformationSystems
Emerging information management tools, with graphic orpictorial display capabilities, that can be used in many ways toevaluate both potential demand and supply quality.
PreferenceSurveys
Survey techniques that can be used on their own to determinefactors that influence demand, and that also serve as thefoundation for quantitative forecasting methods such as discretechoice modeling.
Figure 3.1 Relationship of Methods Supporting Demand Estimation
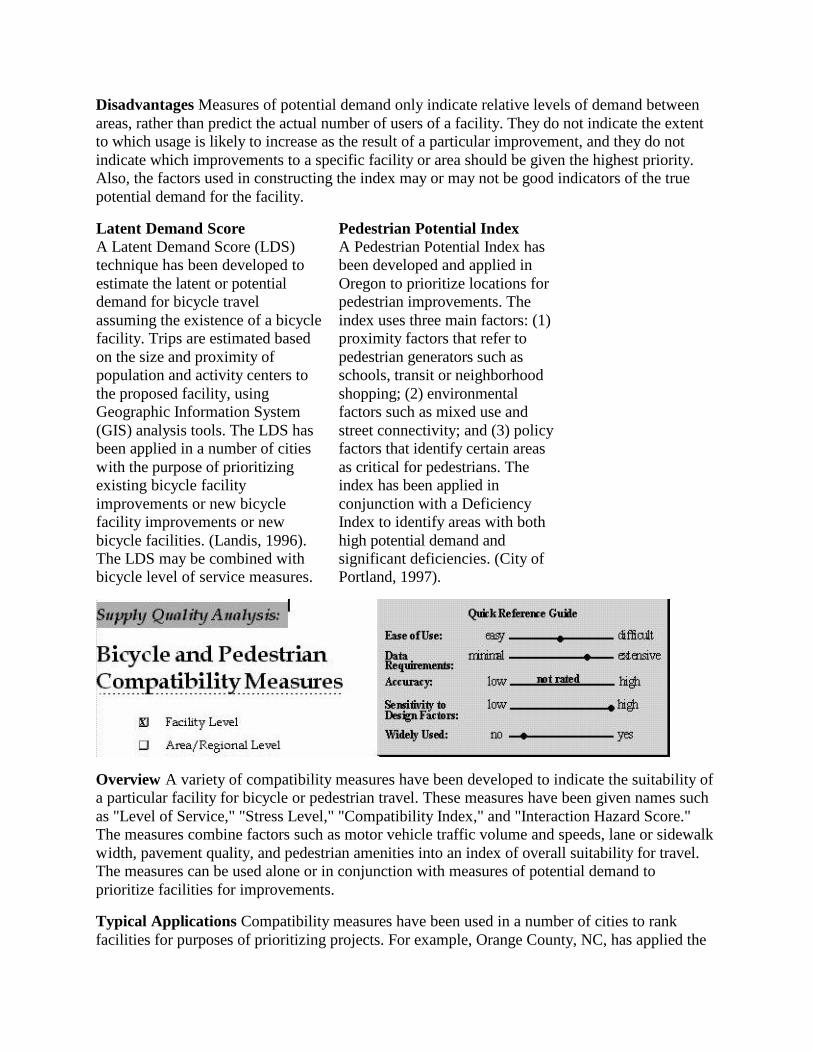
For each of the 11 methods, a one-page summary is provided which includes an overview of themethod, typical applications, advantages and disadvantages, and one or two real-world examples.Each summary also includes a quick reference guide, which provides a subjective rating of themethod for five factors as described below. The ratings are provided only as a generalassessment of the method's capabilities, and the quality of specific applications of each of thesemethods may vary. More detail on the specific ratings for each method is given in table 3.2,which follows the individual method overviews.
The five factors and criteria used to rate the factors are as follows:
• Ease of Use - "Easy" if the method could be applied by a layperson with basic research

and data analysis capabilities; "difficult" if the method requires extensive specializedtraining to understand and apply.
• Data Requirements - "Minimal" if the method primarily uses existing data that caneasily be collected and evaluated; "extensive" if it requires significant new data collectionefforts.
• Accuracy - "Low" if forecasts have not corresponded well to observations; "high" ifforecasts have been found to closely reflect actual demand.
• Sensitivity to Design Factors - "Low" if the method cannot assess the impacts ofspecific design factors on demand; "high" if the method can assess the impacts ofmultiple factors and the interactive effects of these factors.
• Widely Used - "No" if only a few applications have been identified; "yes" if the methodhas been widely used in practice.
Finally, the overview page indicates whether the method can be used to predict demand at thefacility level, area/regional level, or both. Facility-level methods predict the number of users of aspecific facility such as a non-motorized trail, bicycle lane, or pedestrian bridge. Area-levelmethods predict total bicycle or pedestrian trips for an entire area such as a city, census tract, orother geographic area.
Section 2.0 of Supporting Documentation presents a more indepth, structured description of eachmethod as well as specific variations and applications of the method. Section 3.0 containsbibliographic references for the real-world examples highlighted in this section. Section 4.0identifies useful contacts, including individuals and organizations, in the area of non-motorizedtravel estimation.
Overview
The simplest form of demand forecasting, comparison studies compare usage levelsbefore and after a change (such as a facility improvement), or compare travel levelsacross facilities with similar characteristics. The results of a comparison study canbe used to predict the impacts on non-motorized travel of a similar improvement inanother situation, assuming that all other influencing factors are roughly the samebetween the two situations.
TypicalApplications
Before-and-after studies have been widely used in Europe to assess the mode choiceimpacts of programs to improve bicycle and pedestrian facilities. Some studies havefocused on the change in mode split for an urban area as a whole, after a city-wide
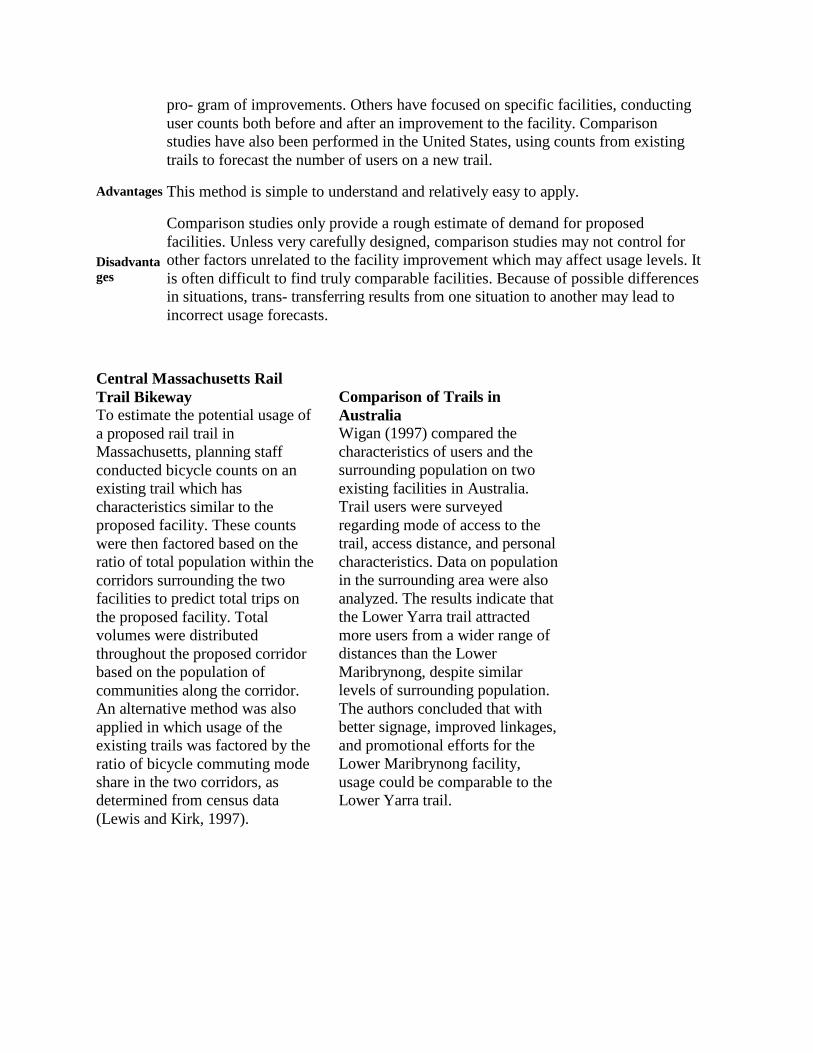
pro- gram of improvements. Others have focused on specific facilities, conductinguser counts both before and after an improvement to the facility. Comparisonstudies have also been performed in the United States, using counts from existingtrails to forecast the number of users on a new trail.
Advantages This method is simple to understand and relatively easy to apply.
Disadvantages
Comparison studies only provide a rough estimate of demand for proposedfacilities. Unless very carefully designed, comparison studies may not control forother factors unrelated to the facility improvement which may affect usage levels. Itis often difficult to find truly comparable facilities. Because of possible differencesin situations, trans- transferring results from one situation to another may lead toincorrect usage forecasts.
Central Massachusetts RailTrail BikewayTo estimate the potential usage ofa proposed rail trail inMassachusetts, planning staffconducted bicycle counts on anexisting trail which hascharacteristics similar to theproposed facility. These countswere then factored based on theratio of total population within thecorridors surrounding the twofacilities to predict total trips onthe proposed facility. Totalvolumes were distributedthroughout the proposed corridorbased on the population ofcommunities along the corridor.An alternative method was alsoapplied in which usage of theexisting trails was factored by theratio of bicycle commuting modeshare in the two corridors, asdetermined from census data(Lewis and Kirk, 1997).
Comparison of Trails inAustraliaWigan (1997) compared thecharacteristics of users and thesurrounding population on twoexisting facilities in Australia.Trail users were surveyedregarding mode of access to thetrail, access distance, and personalcharacteristics. Data on populationin the surrounding area were alsoanalyzed. The results indicate thatthe Lower Yarra trail attractedmore users from a wider range ofdistances than the LowerMaribrynong, despite similarlevels of surrounding population.The authors concluded that withbetter signage, improved linkages,and promotional efforts for theLower Maribrynong facility,usage could be comparable to theLower Yarra trail.
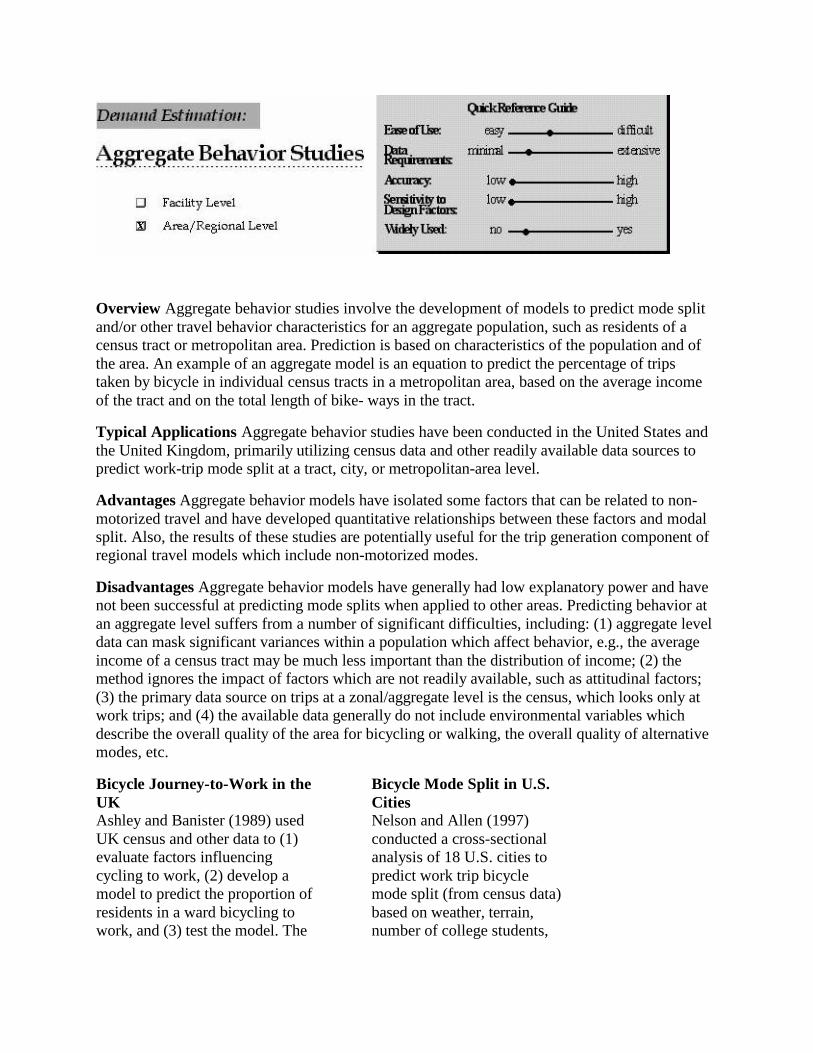
Overview Aggregate behavior studies involve the development of models to predict mode splitand/or other travel behavior characteristics for an aggregate population, such as residents of acensus tract or metropolitan area. Prediction is based on characteristics of the population and ofthe area. An example of an aggregate model is an equation to predict the percentage of tripstaken by bicycle in individual census tracts in a metropolitan area, based on the average incomeof the tract and on the total length of bike- ways in the tract.
Typical Applications Aggregate behavior studies have been conducted in the United States andthe United Kingdom, primarily utilizing census data and other readily available data sources topredict work-trip mode split at a tract, city, or metropolitan-area level.
Advantages Aggregate behavior models have isolated some factors that can be related to non-motorized travel and have developed quantitative relationships between these factors and modalsplit. Also, the results of these studies are potentially useful for the trip generation component ofregional travel models which include non-motorized modes.
Disadvantages Aggregate behavior models have generally had low explanatory power and havenot been successful at predicting mode splits when applied to other areas. Predicting behavior atan aggregate level suffers from a number of significant difficulties, including: (1) aggregate leveldata can mask significant variances within a population which affect behavior, e.g., the averageincome of a census tract may be much less important than the distribution of income; (2) themethod ignores the impact of factors which are not readily available, such as attitudinal factors;(3) the primary data source on trips at a zonal/aggregate level is the census, which looks only atwork trips; and (4) the available data generally do not include environmental variables whichdescribe the overall quality of the area for bicycling or walking, the overall quality of alternativemodes, etc.
Bicycle Journey-to-Work in theUKAshley and Banister (1989) usedUK census and other data to (1)evaluate factors influencingcycling to work, (2) develop amodel to predict the proportion ofresidents in a ward bicycling towork, and (3) test the model. The
Bicycle Mode Split in U.S.CitiesNelson and Allen (1997)conducted a cross-sectionalanalysis of 18 U.S. cities topredict work trip bicyclemode split (from census data)based on weather, terrain,number of college students,
authors used regression analysis totest the effects of various factorson the proportion of ward residentscycling to work. Factors testedincluded personal characteristics,trip distance, avail- ability ofcycling facilities, avail- ability ofother modes, modes, traffic levels,and local climate and topography.
and per capita miles ofbikeway facilities. A positiveassociation was foundbetween the presence ofbikeway facilities and bicyclework trip mode split.
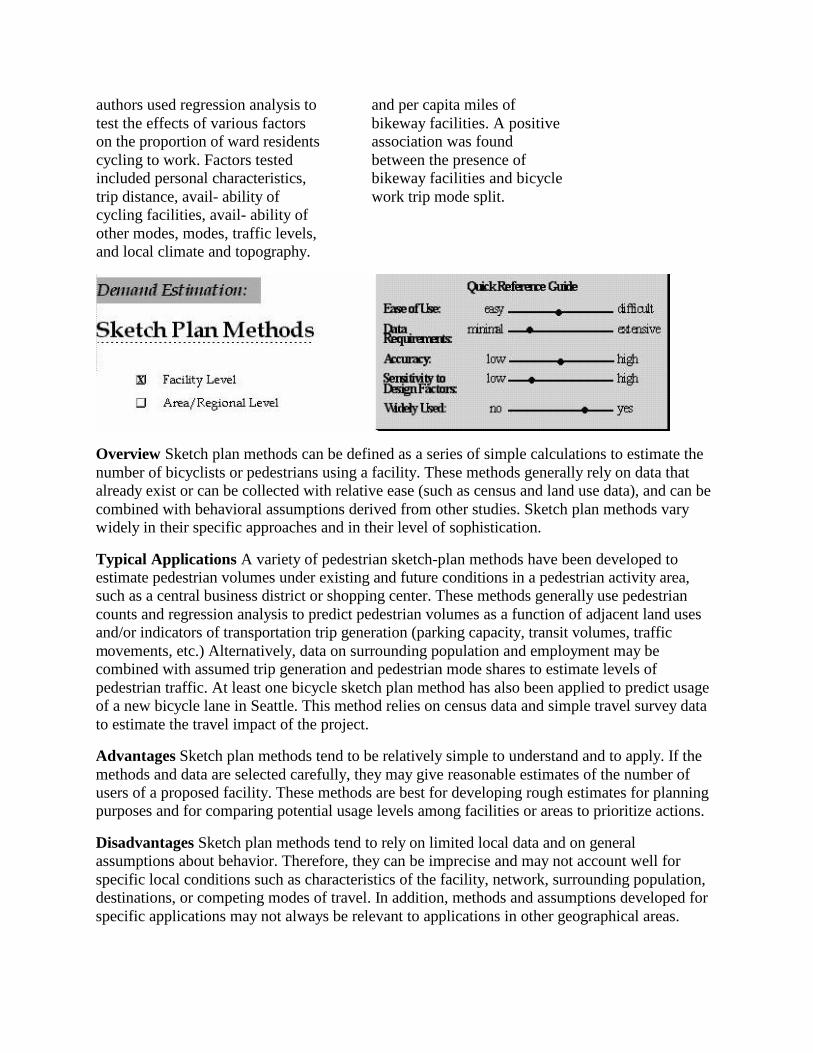
Overview Sketch plan methods can be defined as a series of simple calculations to estimate thenumber of bicyclists or pedestrians using a facility. These methods generally rely on data thatalready exist or can be collected with relative ease (such as census and land use data), and can becombined with behavioral assumptions derived from other studies. Sketch plan methods varywidely in their specific approaches and in their level of sophistication.
Typical Applications A variety of pedestrian sketch-plan methods have been developed toestimate pedestrian volumes under existing and future conditions in a pedestrian activity area,such as a central business district or shopping center. These methods generally use pedestriancounts and regression analysis to predict pedestrian volumes as a function of adjacent land usesand/or indicators of transportation trip generation (parking capacity, transit volumes, trafficmovements, etc.) Alternatively, data on surrounding population and employment may becombined with assumed trip generation and pedestrian mode shares to estimate levels ofpedestrian traffic. At least one bicycle sketch plan method has also been applied to predict usageof a new bicycle lane in Seattle. This method relies on census data and simple travel survey datato estimate the travel impact of the project.
Advantages Sketch plan methods tend to be relatively simple to understand and to apply. If themethods and data are selected carefully, they may give reasonable estimates of the number ofusers of a proposed facility. These methods are best for developing rough estimates for planningpurposes and for comparing potential usage levels among facilities or areas to prioritize actions.
Disadvantages Sketch plan methods tend to rely on limited local data and on generalassumptions about behavior. Therefore, they can be imprecise and may not account well forspecific local conditions such as characteristics of the facility, network, surrounding population,destinations, or competing modes of travel. In addition, methods and assumptions developed forspecific applications may not always be relevant to applications in other geographical areas.
Estimating Pedestrian CorridorActivityMatlick (1996) describes a methodto determine the level of pedestrianactivity in 0.8 km buffer areas inspecific corridors. A variety ofsources was used to estimateactivity within the corridor:population, mode split, and tripcharacteristics from census andNational Personal TransportationSurvey data; land use data fromlocal data bases; and estimates ofschool and transit trips.
Estimating Peak Pedestrians perHourErcolano (1997) describes amethod that determines site,corridor, and subarea pedestrianper hour volumes using localvehicle per hour turningmovements and mode share censusdata (at a minimum). Otherfeatures of this method include theability to estimate sidewalk andintersection trips and the ability toadjust trips based on completenessof pedestrian infrastructure andclimatic conditions.
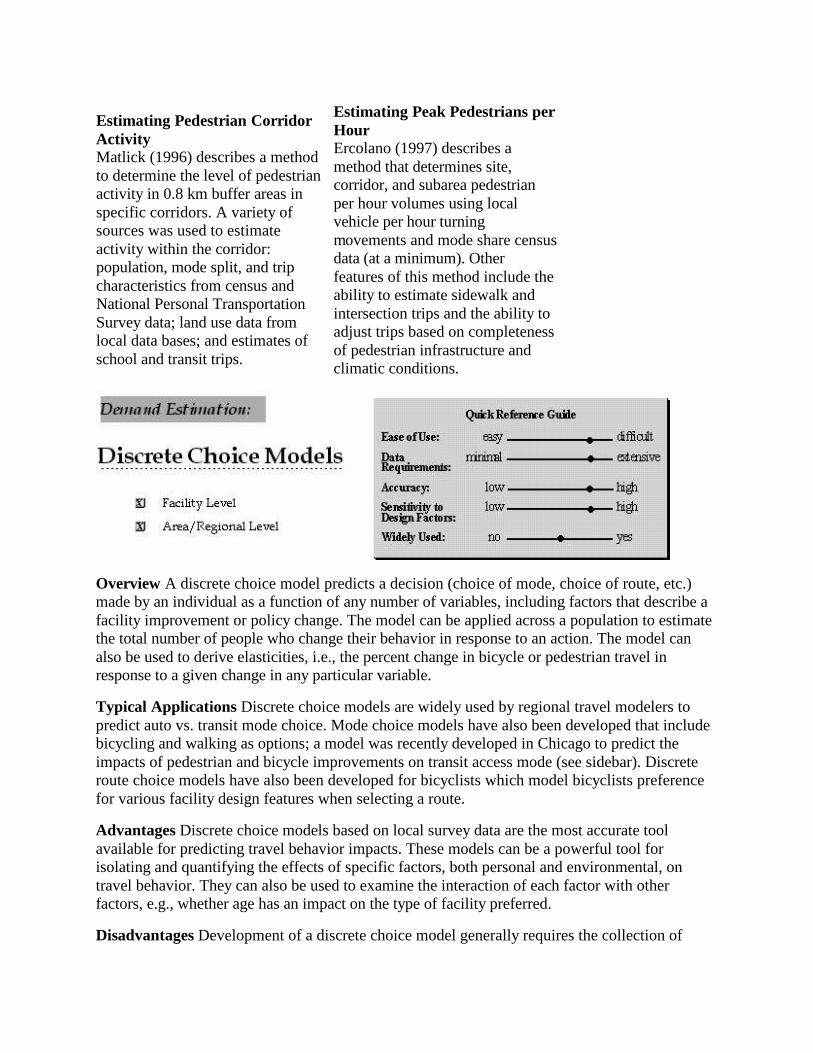
Overview A discrete choice model predicts a decision (choice of mode, choice of route, etc.)made by an individual as a function of any number of variables, including factors that describe afacility improvement or policy change. The model can be applied across a population to estimatethe total number of people who change their behavior in response to an action. The model canalso be used to derive elasticities, i.e., the percent change in bicycle or pedestrian travel inresponse to a given change in any particular variable.
Typical Applications Discrete choice models are widely used by regional travel modelers topredict auto vs. transit mode choice. Mode choice models have also been developed that includebicycling and walking as options; a model was recently developed in Chicago to predict theimpacts of pedestrian and bicycle improvements on transit access mode (see sidebar). Discreteroute choice models have also been developed for bicyclists which model bicyclists preferencefor various facility design features when selecting a route.
Advantages Discrete choice models based on local survey data are the most accurate toolavailable for predicting travel behavior impacts. These models can be a powerful tool forisolating and quantifying the effects of specific factors, both personal and environmental, ontravel behavior. They can also be used to examine the interaction of each factor with otherfactors, e.g., whether age has an impact on the type of facility preferred.
Disadvantages Development of a discrete choice model generally requires the collection of

extensive survey data and requires expertise in discrete choice modeling techniques. Also, sincethe number of factors (facility design, personal, etc.) which can be considered in any particularmodeling exercise is limited, it is not possible to identify or control for all factors which mayinfluence behavior. Furthermore, a model developed for a specific situation may not beapplicable to other situations if important factors not considered in the model differ between thetwo situations.
Transit Access Mode Choice in ChicagoThe Chicago Regional Transit Authority recently developed a set ofdiscrete choice models to predict the impacts on transit access mode ofbicycle and pedestrian improvements to rail station areas in Chicago.Surveys to deter- mine existing commuters mode choice, station accessdistance, and other characteristics were used in conjunction with visualsimulation surveys to estimate whether people would shift to non-motorized access modes as a result of various improvements. Bicycleimprovements tested included removal of debris, provision of parking,slowing of traffic, and development of curb lanes, paths, and bicycleroutes. Pedestrian improvements tested included sidewalks, recreationpaths, slowing of traffic, and various improvements to intersectioncrossings (Wilbur Smith Associates, 1997).
Overview Regional travel models, commonly referred to as four-step travel demand models, useexisting and future land use conditions and transportation network characteristics, in conjunctionwith models of human behavior, to predict future travel patterns. These models are described in
more detail in section 2.4 of this overview and section 2.8 of the supporting documentation.
Typical Applications Traditionally, regional travel models have been oriented toward predictingtrips by automobile and transit. However, a number of models in the United States, Canada, andEurope have recently been modified to estimate non-motorized mode splits based on ratings ofthe pedestrian friendliness or bicycle friendliness of individual zones. Some models have alsobeen modified to include bicycle and/or pedestrian facility networks and to predict the routechoice impacts of improving or adding facilities. Models have also been developed specificallyfor bicycle or pedestrian travel. For example, in the 1970s pedestrian demand models weredeveloped for various commercial business districts in the United States. These models relatedpedestrian trips to land uses at a block level and assigned trips between blocks based oncharacteristics of the pedestrian network.
Advantages Regional travel models have been developed for all major urban areas in the UnitedStates. The regional travel model structure provides an integrated framework for analyzing
travelers choices between modes. Given sufficient data collection and enhancements to themodel structure, regional travel models could serve as a powerful tool for analyzing bicycle andpedestrian travel. Regional travel models can also serve as a source of data, such as total tripsgenerated in an area, which are useful for other bicycle or pedestrian modeling or sketch-planning efforts.
Disadvantages The current generation of regional travel models was developed at a spatial scaleappropriate for automobile rather than bicycle or pedestrian travel. Also, incorporation of non-motorized modes may require significant data collection to create a zone-level "environmentfactor" or develop a network of bicycle and pedestrian facilities. Current regional travel modelsalso do not consider trips made for the sole purpose of recreation. Finally, the development andmodification of travel models require considerable expertise and the use of specialized softwarepackages.
Edmonton Transport Analysis Model (Canada)The Edmonton Transport Analysis Model recently developed for theEdmonton, Canada region includes both walk and bicycle as separatemodes and also includes bicycle network characteristics in determiningmode choice. Links in the network model can be coded in three ways:bicycle path, bicycle lane, or mixed traffic. Bicycle travel time on eachlink is adjusted by a factor representing the relative onerousness ofbicycling by facility type. These factors are derived from a hypotheticalchoice survey of bicyclists in which bicyclists are asked to choosebetween different routes based on distance, facility type, and otherfactors (Hunt, Brownlee, and Doblanko, 1997).
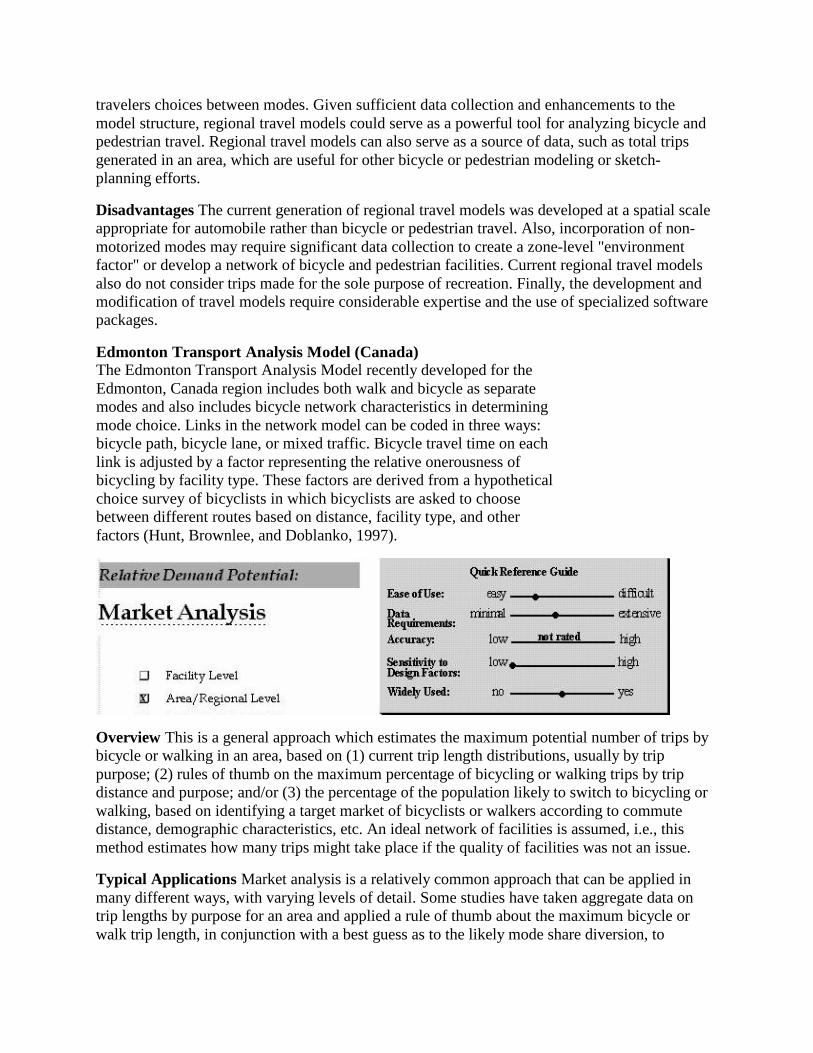
Overview This is a general approach which estimates the maximum potential number of trips bybicycle or walking in an area, based on (1) current trip length distributions, usually by trippurpose; (2) rules of thumb on the maximum percentage of bicycling or walking trips by tripdistance and purpose; and/or (3) the percentage of the population likely to switch to bicycling orwalking, based on identifying a target market of bicyclists or walkers according to commutedistance, demographic characteristics, etc. An ideal network of facilities is assumed, i.e., thismethod estimates how many trips might take place if the quality of facilities was not an issue.
Typical Applications Market analysis is a relatively common approach that can be applied inmany different ways, with varying levels of detail. Some studies have taken aggregate data ontrip lengths by purpose for an area and applied a rule of thumb about the maximum bicycle orwalk trip length, in conjunction with a best guess as to the likely mode share diversion, to

estimate the potential bicycle or walk mode share. Others have focused on defining thedemographic characteristics of people most likely to walk or bicycle, and subsequently usingdemographic information for an area, in conjunction with trip length distributions, to obtain anoverall maximum potential mode split under ideal conditions.
Advantages Market analysis methods generally define an "upper bound" on the number of tripsby cycling or walking and may therefore give municipalities a target to shoot for in developingplans to improve facilities city-wide. This type of analysis can also be helpful in identifying areasof greatest potential demand, as an aid to prioritizing projects.
Disadvantages Market analysis methods are intended only to achieve rough estimates of themaximum number of trips that could be diverted to bicycling or walking. The methods are notuseful for estimating changes in demand in response to an improvement, and they shed little lighton factors affecting the decision to walk or bicycle.
Market for Bicycle Commuting in the San Francisco Bay AreaDeakin (1985) defined a demographic target group for Bay Areacommuter bicycling, based on data from the Bay Area Travel Survey, areview of the literature, and interviews with local and state officials. Hermarket was defined as employed full-time, under 40 years old, travelsless than 11.3 km one-way to work, drives alone during the peak period,and owns a bike suitable for commuting. She used these criteria toestimate a reasonable upper bound on the size of the potential bicyclecommuter market.
Overview Measures of potential demand have been developed for both bicycle and pedestrianfacilities for the purpose of prioritizing facility improvements according to areas of highestpotential demand. Demand potential is measured based on characteristics and levels of the
surrounding population, trip generators, as well as other environmental factors such astopography and the quality of connecting facilities.
Typical Applications Measures for both bicycle and pedestrian facility demand potential havebeen developed and applied to prioritize improvements (see sidebar).
Advantages Measures of potential demand can be a useful aid to prioritizing locations forimprovements, particularly when applied in conjunction with measures of supply or facilityquality to identify areas of both high potential demand and significant deficiencies. In addition,these measures can frequently be constructed from readily available data sources such as thecensus and local land use data bases.
Disadvantages Measures of potential demand only indicate relative levels of demand betweenareas, rather than predict the actual number of users of a facility. They do not indicate the extentto which usage is likely to increase as the result of a particular improvement, and they do notindicate which improvements to a specific facility or area should be given the highest priority.Also, the factors used in constructing the index may or may not be good indicators of the truepotential demand for the facility.
Latent Demand ScoreA Latent Demand Score (LDS)technique has been developed toestimate the latent or potentialdemand for bicycle travelassuming the existence of a bicyclefacility. Trips are estimated basedon the size and proximity ofpopulation and activity centers tothe proposed facility, usingGeographic Information System(GIS) analysis tools. The LDS hasbeen applied in a number of citieswith the purpose of prioritizingexisting bicycle facilityimprovements or new bicyclefacility improvements or newbicycle facilities. (Landis, 1996).The LDS may be combined withbicycle level of service measures.
Pedestrian Potential IndexA Pedestrian Potential Index hasbeen developed and applied inOregon to prioritize locations forpedestrian improvements. Theindex uses three main factors: (1)proximity factors that refer topedestrian generators such asschools, transit or neighborhoodshopping; (2) environmentalfactors such as mixed use andstreet connectivity; and (3) policyfactors that identify certain areasas critical for pedestrians. Theindex has been applied inconjunction with a DeficiencyIndex to identify areas with bothhigh potential demand andsignificant deficiencies. (City ofPortland, 1997).
Overview A variety of compatibility measures have been developed to indicate the suitability ofa particular facility for bicycle or pedestrian travel. These measures have been given names suchas "Level of Service," "Stress Level," "Compatibility Index," and "Interaction Hazard Score."The measures combine factors such as motor vehicle traffic volume and speeds, lane or sidewalkwidth, pavement quality, and pedestrian amenities into an index of overall suitability for travel.The measures can be used alone or in conjunction with measures of potential demand toprioritize facilities for improvements.
Typical Applications Compatibility measures have been used in a number of cities to rankfacilities for purposes of prioritizing projects. For example, Orange County, NC, has applied the

Bicycle Stress Level index to determine the suitability of their planned bicycle routes. Level-of-service measures have also been applied in conjunction with the Latent Demand Score toprioritize projects in various urban areas in Florida. Oregon has developed a Deficiency Indexwhich it uses in conjunction with potential demand indicators to rank and prioritize pedestrianfacilities.
Advantages Compatibility measures can serve as a useful means of prioritizing facilities forimprovement as well as determining which improvements will be most beneficial. Compatibilitymeasures may also become a key component of non-motorized travel demand forecasting, ifrelationships can be developed between the indices and individuals' likelihood of making abicycling or walking trip.
Disadvantages Existing indices primarily rate individual segments rather than describing theoverall compatibility of a route. They cannot account for the effects of intersections and otherdiscontinuities, and they do not sufficiently describe the overall compatibility of a route made upof different segments with different ratings. Also, the indices may not include all relevant factors(or may require significant data collection to do so), and they may not properly reflectperceptions if not validated through surveys. In addition, they do not predict the actual number oftrips on the segment.
Bicycle Compatibility IndexThe Federal Highway Administration has recently developed a bicyclecompatibility index (BCI) to describe the compatibility of a facility forcycling (FHWA, 1998). The BCI uses a formula based on trafficvolume, speed, lane width, and other indicators of bicyclist stress to ranka road segment for compatibility on a scale of 1 to 6, which is thenequated to a level-of-service (LOS) rating. Qualitative adjustmentfactors were developed to consider instances of high volumes of trucksor buses, right-turning vehicles, and vehicles turning into and out ofdriveways. The index was developed using a video survey methodologywhich asked participants to rate their comfort level on variousvideotaped facilities.
Overview Pedestrian and bicycle environment factors describe the friendliness of an area (suchas a city block, census tract, or traffic analysis zone) for walking and/or bicycling. The factorsare quantitative and may be a composite of a number of quantitative descriptors and subjective
factors. Examples of factors considered include lane or sidewalk width, street continuity,topography, and the aesthetic quality of the environment.

Typical Applications Pedestrian and bicycle environment factors have been developed primarilyfor use in regional travel models. A pedestrian environment factor has been developed andapplied to the regional travel model in Portland, OR and modified versions have been applied inSacramento, CA and Washington, DC. Montgomery County, MD, has developed a differentpedestrian/bicycle environment factor for use in its travel model. A transit friendliness factordescribing the quality of pedestrian access to transit has been developed in Washington State.
Advantages Considerable research has been performed recently on factors that make areasinviting to pedestrians, and much of this knowledge has been incorporated in the currentgeneration of environment factors. The factors have been found to enhance the performance oftravel models in Portland, OR and Montgomery County, MD particularly for predicting vehicletrips from an area. These factors may also be useful in prioritizing areas for improvements, basedon the relative ratings of individual areas.
Disadvantages Environment factors are frequently based on subjective ratings and theirperformance at predicting actual variations in travel behavior has not yet been widely validated.Also, separate bicycle environment factors have not been developed; the ability of these or ofcombined pedestrian/bicycle factors to predict bicycle trip activity has not yet been tested. Inaddition, environment factors require considerable field data collection to develop for a specificarea.
Portland, OR, Pedestrian Environment FactorPortland's Pedestrian Environment Factor (PEF), developed for use in itsregional travel model, includes four elements: sidewalk availability, easeof street crossing, connectivity of street/sidewalk system, and terrain.Each traffic analysis zone is ranked for each element on a scale of zeroto three, with higher numbers representing higher quality pedestrianenvironments, so the overall PEF can range from 0 to 12 (1,000 Friendsof Oregon, 1992 - 1997).
Overview Geographic Information Systems (GIS) relate environmental and population data in aspatial framework, using location points, lines (commonly roadway links and corridors),
corridors), and polygons (surface areas and analysis zones). GIS are employed as a mechanismfor the physical inventory of transportation facilities; as a planning tool to relate available
environmental, personal transportation and household characteristics data; as a spatial analysistool for calculating distances and areas; as a network performance monitor; and as a vehicle for
the graphic display of data and analysis in a geographic context.

Typical Applications GIS have been used in non-motorized planning to inventory and evaluatefacilities such as roads and sidewalks; establish spatial relationships between roadway networklinks, features such as activity centers, and area population characteristics; compare and displaycurrent conditions with projected travel and conditions; assess total network performance andidentify optimal routes; produce printed maps; and develop network measures (e.g. street densityand connectivity) and land use measures (e.g., mix of residential, office, and retail) which can berelated to the likelihood of walking or bicycling.
Advantages GIS can greatly increase the ease of analyzing data relevant to non-motorized travelforecasting. For example, a corridor surrounding a facility can be defined and the characteristicsof the population within the corridor easily identified. GIS allows development of spatialmeasures and analysis of data relationships which might otherwise be prohibitively time-consuming or impossible. The display capabilities of GIS are also valuable for conveyinginformation to policymakers and the public.
Disadvantages GIS require considerable user skill as well as specialized software to develop,although future developments will make them more accessible to laypersons. Also, since GIScan only manage and analyze data, the data must still be collected through other means.
Warwick, RI, Bicycle Network StudyA Bicycle Network Study in Warwick, RI, was assisted by GISmethods. Trip generation estimates were calculated as a function ofemployment, school enrollment, and total population for traffic analysiszones adjacent to the bicycle network. Composite trip generation scoreswere then attributed to network segments within the areas of influenceof trip generators. The results of this analysis were compared to theexisting designated bicycle route network. Alternative routedesignations were suggested where an undesignated roadway link'spotential scored higher than a parallel or adjacent designated route(Beltz and Burgess, 1997).
Overview Using survey research techniques, preference surveys (also known as statedpreference surveys) focus on the choices that people would make given discrete alternatives.
Respondents are asked to express an attitude or make a choice as to how they would act undercertain conditions. Two basic types of preference surveys exist. Attitudinal surveys ask
respondents directly how they would respond to various actions (e.g., would they bicycle if bikelanes were available), or ask them to rate their preferences for various improvements.
Hypothetical choice surveys require respondents to make choices between hypotheticalalternatives with varying attributes, and survey results are then used to develop models of
behavior.
Typical Applications Attitudinal surveys have been widely used to estimate the potentialimpacts of bicycle and pedestrian improvements and to determine relative preferences for suchimprovements. Hypothetical choice surveys are generally used to develop discrete choice modelsand to estimate the relative importance of each attribute (time, cost, presence of bike lanes, etc.)in common terms.
Advantages Attitudinal surveys are relatively easy to design and implement. They can also begood tools for evaluating relative preferences and for estimating the maximum possible responseto an action. Hypothetical choice surveys, if carefully designed, can be used to develop relativelyaccurate models of behavior and to give quantitative information on the relative importancewhich people place on various factors.
Disadvantages Attitudinal surveys often significantly overestimate the response to a bicycle orpedestrian improvement, since people tend to be more likely to state that they will change theirbehavior than to actually do so (Goldsmith, 1992). Therefore, they are not well-suited forpredicting actual shifts in travel demand. While hypothetical choice surveys overcome many ofthe limitations of attitudinal surveys, they must be designed carefully and require considerabletime and expertise to implement. Both types of preference surveys suffer from the furtherdrawback that people may not have any real-world experience with the choices they are asked tomake, and may therefore be unable to indicate their preferences or actions with accuracy.
Transit Access Mode Choice in ChicagoThe Chicago Regional Transit Authority (RTA) surveyed transit andauto users to determine reasons why they did not currently walk orbicycle to a transit station. (These surveys were also used to developmodels of individual behavior, as described under Discrete ChoiceModels.) Respondents were asked to identify specific reasons for notbicycling or walking, such as lack of secure parking, dangerous trafficconditions, or inadequate sidewalks or path- ways. Two different surveymethods were employed: an intercept survey in which respondents wereasked directly to rate factors, and an interactive video survey in whichrespondents were asked to make tradeoffs between vari-
3.2 Key Characteristics and Uses of Each Method
This section summarizes key characteristics of the methods and suggests appropriate methodsaccording to specific purpose such as forecasting the number of new users of a bicycle/pedestriantrail. More specifically, table 3.2 summarizes key characteristics of each of the 11 methods,providing more detail on the factors (e.g., ease of use and data requirements) rated in the quickreference guide for each method.
Tables 3.3 through 3.6 are intended as a guide for practitioners who need to choose the mostappropriate method for a specific situation. Each table lists a specific purpose for which non-motorized demand forecasting methods may be applied and suggests which methods are mostappropriate for that purpose. Generally the methods are ordered from simpler to more complex in

Tables 3.3 - 3.5. For each of these methods, the table describes the specific way in which themethod would be applied and identifies major advantages and disadvantages of using the methodfor the given purpose. These purposes include:
Table 3.3 - estimating the number of users of a new facility;
Table 3.4 - estimating the number of new bicycle or pedestrian trips area-wide, as a result offacility or network improvements;
Table 3.5 - prioritizing design features for a specific facility; and
Table 3.6 - prioritizing facilities for improvement.
Figure 3.2 If Sidewalks Were Built Here,How Many People Would Use Them?
How Far Up on the Priority List is This Project?
Table 3.2 Key Characteristics of Available Methods.
Method Ease of Use Data
Requirements Accuracy Sensitivity toDesign Factors Where Used
Demand Estimation
ComparisonStudies
Simple tounderstandand relativelyeasy to apply
Requires facilityuser counts; dataon surroundingpopulation andland uses areoptional
May providerough estimatesof demand iftruly comparablecase studies canbe found.Accuracy has notbeen formallytested.
Relatively low;requiresidentification ofcomparablefacilities withina comparableenvironment
Massachusetts;Netherlands;Germany; Australia
Aggregate
Requiressimple
Varies; can useexisting sources
Models havegenerally had low
Low, sincedetailed
UK; Berkeley, CA
BehaviorStudies
statisticalanalysis skills
such as censusand local landuse data bases
explanatorypower and havenot beentransferable
information onfacilities hasgenerally notbeen collected
SketchPlanMethods
Methods arerelativelysimple toapply
Varies; can useexisting sourcessuch as censusand local landuse data bases
Varies bymethod; somemethods maygive reasonableestimates othershave not beenformally tested
Low; rely ongeneralassumptions
Seattle, WA(bicycle); New YorkCity, NY;Plattsburgh, NY;Milwaukee, WI;Toronto andMontreal, Canada(pedestrian)
DiscreteChoiceModels
Knowledgeof statisticalanalysis andspecializedsurvey andmodelingtechniques isrequired
Usually requiressurvey datacollectionspecific tosituation beinganalyzed
Can be relativelyaccurate inpredictingimpacts ofspecific actions
High, althoughonly limitednumber offactors can beconsidered atonce
Wisconsin;California, Chicago,IL; Raleigh, NC
RegionalTravelModels
Requiresestablishedcapabilitiesfor traveldemandmodeling
May requireadditional datacollection onbicycle andpedestrian travelpatterns and/orfacilitycharacteristics
Includingbikes/peds hasimprovedperformance ofsome models atpredicting autoand transit trips
Potentiallyhigh; limited bydata availabilityand tradeoffinformation
Portland, OR;Montgomery County,MD; Sacramento andSan Francisco, CA;Edmonton, Canada;Leicester, UK;Netherlands
Relative Demand Potential
Method Ease of Use Data Requirements Accuracy
Sensitivity to
DesignFactors
Where Used
MarketAnalysis
Methods arerelativelysimple toapply
Data required on triplength distributions(from travel survey orregional travel model);
Untested.Methods aredesigned topredict an upper
Low;assumesidealnetwork
San Francisco, CA;Chicago, IL; Bend,OR; Minneapolis,MN; Europe
other population datamay be needed
bound under idealconditions
offacilities
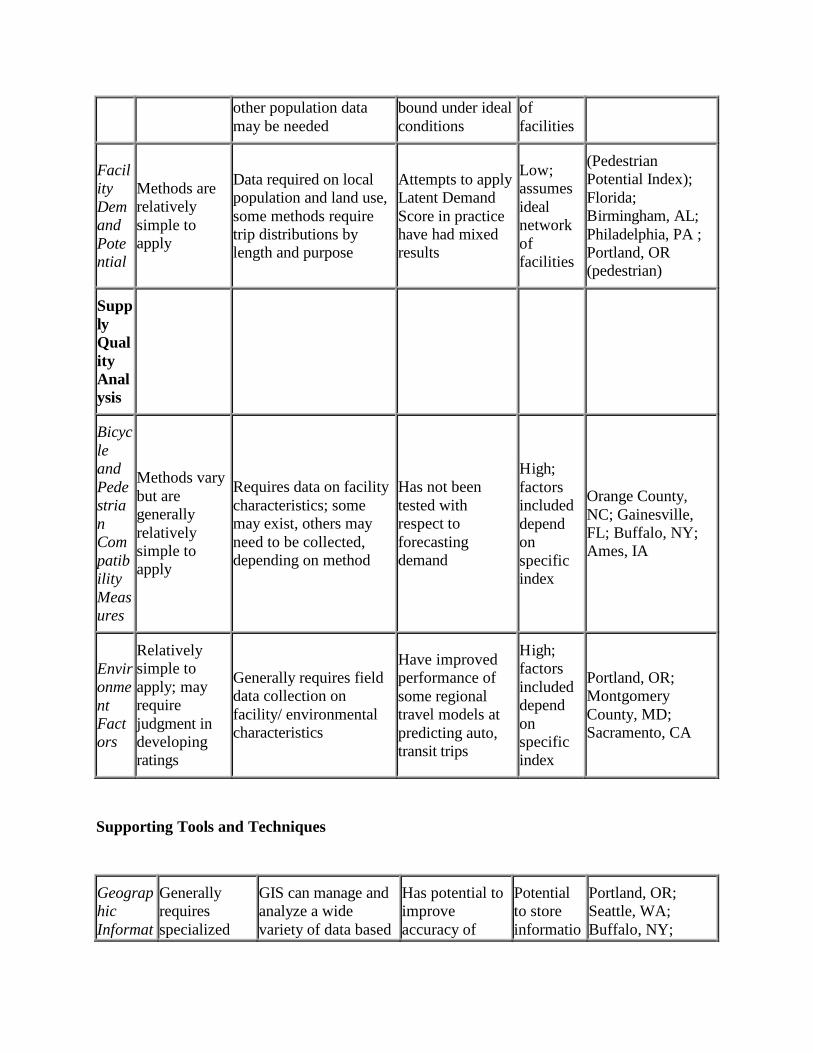
FacilityDemandPotential
Methods arerelativelysimple toapply
Data required on localpopulation and land use,some methods requiretrip distributions bylength and purpose
Attempts to applyLatent DemandScore in practicehave had mixedresults
Low;assumesidealnetworkoffacilities
(PedestrianPotential Index);Florida;Birmingham, AL;Philadelphia, PA ;Portland, OR(pedestrian)
SupplyQualityAnalysis
BicycleandPedestrianCompatibilityMeasures
Methods varybut aregenerallyrelativelysimple toapply
Requires data on facilitycharacteristics; somemay exist, others mayneed to be collected,depending on method
Has not beentested withrespect toforecastingdemand
High;factorsincludeddependonspecificindex
Orange County,NC; Gainesville,FL; Buffalo, NY;Ames, IA
EnvironmentFactors
Relativelysimple toapply; mayrequirejudgment indevelopingratings
Generally requires fielddata collection onfacility/ environmentalcharacteristics
Have improvedperformance ofsome regionaltravel models atpredicting auto,transit trips
High;factorsincludeddependonspecificindex
Portland, OR;MontgomeryCounty, MD;Sacramento, CA
Supporting Tools and Techniques
GeographicInformat
Generallyrequiresspecialized
GIS can manage andanalyze a widevariety of data based
Has potential toimproveaccuracy of
Potentialto storeinformatio
Portland, OR;Seattle, WA;Buffalo, NY;

ionSystems
knowledge ofGIS analysistechniques
on availability andneeds
forecastingmethods
n on avariety offacilitydesignfactors
Warwick, RI;Orange County,CA; Fort Collins,CO; Buffalo, NY;Ames, IA
PreferenceSurveys
Requiresknowledge ofsurveyresearchtechniques;may requirespecializedsurvey designand analysisskills
Requires survey datacollection
Performancedepends onquality of surveydesign andimplementation
Variety ofdesignfactors canbeconsideredin survey
Widespread
Table 3.3 Methods for Estimating the Number of Users of a New Facility.
Method Specific Application Major Advantages or Drawbacks
Comparison Study Look at usage on comparablefacility
May be difficult to find trulycomparable situation
Sketch-Plan Method
Look at local population, tripgenerators, non-motorized worktrip percentages for area aroundfacility to estimate potential trips
Easy way to get a rough estimate ofpotential usage; however, difficult toconsider factors such as non-worktrips, whether facility serves localtravel patterns, existence of supportingfacilities/network, etc.
Preference Survey(Attitudinal)
Survey local residents andcommuters as to whether theywould use the facility
Will give relative indication of interest,but will generally overstate actuallikelihood of using facility
Preference Survey(HypotheticalChoice)and Discrete ChoiceModel
Conduct survey of whether peoplewould use facility under variousscenarios; develop behavior modelto predict usage
A carefully-designed hypotheticalchoice survey may be the mostaccurate method but is also resource-intensive
Regional TravelModel
Modify existing regional travelmodel to include new facility
Requires travel model which alreadyincludes bicycling/walking networks;will not capture recreational travel
Table 3.4 Methods for Estimating the Number of New Bicycle or Pedestrian Trips Area-

wide as a Result of Facility or Network Improvements.
Method Specific Application Major Advantages or Drawbacks
Preference Survey(Attitudinal)
Survey residents to ask if theywould choose to walk or bicyclegiven improvements
Survey results tend to overstatewillingness to change mode of travel
Aggregate BehaviorStudy
Develop relationship betweenlevels of non-motorized trip-making and overallfacility/network characteristics,based on data from othercities/areas
Requires data on many cities or areaswhich includes indicators of non-motorized trip making as well asinformation on existing facilities/networks comparable to theimprovements being considered locally
Preference Survey(HypotheticalChoice)and Discrete ChoiceModel
Conduct survey of whether peoplewould bicycle or walk undervarious city-wide improvementscenarios; develop behavior modelto predict usage
A carefully-designed hypotheticalchoice survey may be relativelyaccurate but is also resource-intensive
Regional TravelModel
Modify pedestrian/bicycleenvironment factors or networklinks in regional travel model
Requires travel model which alreadyincludes bicycling/walkingenvironment factors and/or networks,and that these networks include facilitycharacteristics that are desired to beimproved; models must also be basedon data relating behavior responses todesign improvements
Table 3.5 Methods for Prioritizing Design Features for a Specific Facility.
Method Specific Application Major Advantages or Drawbacks
Supply QualityAnalysis
Compare improvements in qualityrating as a result of various designimprovements
Good for identifying facilitydeficiencies and most effectiveimprovements, but using this techniquealone does not predict benefits in termsof new users
Preference Survey(Attitudinal)
Ask local residents, employees,bicyclists, pedestrians, etc., whichdesign improvements are highestpriority
Responses may vary depending onpopulation surveyed; for example, justsurveying existing users will notindicate number of new users attractedto facility as a result of improvements
Preference Survey Conduct survey to determine Determining who to survey can be a

(HypotheticalChoice)and Discrete ChoiceModel
relative-preference for facilityimprovements, and build model todetermine likely number of newusers
problem; however, can actually predictbenefits of each improvement based onchange in usage as well as benefits toexisting users
Regional TravelModel
Modify facility travel times toreflect proposed new facilities ordesign improvements, to determinetravel-time equivalent benefits toexisting users and number of newusers
Considers most types andorigins/destinations of trips. However,requires that the travel network iscoded with the bicycle or pedestrianfacility design features to be analyzed,and that the valuation of travel time bybicycle or foot has been related tothese design features.
Table 3.6 Methods for Prioritizing Facilities for Improvement.
Method Specific Application Major Advantages or Drawbacks
Supply QualityAnalysis
Rate facilities based on existingbicycle or pedestrian compatibility,environment factors, or deficiencyindicators; prioritize according toratings
Does not look at existing or potentialdemand/usage on facilities
Preference Survey(Attitudinal)
Ask local residents, employees,bicyclists/pedestrians, etc., which are highestpriority facilities to improve
Responses may vary depending onpopulation surveyed; for example, justsurveying existing users will notindicate number of new users attractedto facility; need to survey populationof potential users as well
Facility DemandPotential
Look at potential demand forfacility based on surroundingpopulation, land uses, etc., andprioritize according to highestpotential
Serves as a good basis forprioritization assuming that measuresof potential demand are proportional toactual future demand across projects.
Combination ofFacilityDemand PotentialandSupply QualityAnalysis
Rate facilities both on potentialdemand and existing quality;prioritize facilities with highestpotential and lowest quality
Combines strengths of both methods;however, still does not indicate actualnumber of new users
U.S. Dept. of Transportation's Federal Highway Administration - Research, Development, & Technology
Guidebook on Methods to Estimate Non-Motorized Travel: Overview of Methods (July 1999)
4.0 Conclusions and Future Needs4.1 ConclusionsA bicycle or pedestrian planner wishing to estimate future levels of non-motorized travel has anumber of options. These include comparisons of proposed projects with usage on similarexisting projects, calculations based on census and other available local data and assumptions,aggregate and disaggregate behavior models to predict travel choices, and inclusion of bicycleand pedestrian factors in existing regional travel models. Alternatively, the planner may chooseto look at measures of the potential market for bicycling or walking, rather than explicitlyforecasting demand. The planner may also use these measures in conjunction with measures ofthe quality of facilities supplied to prioritize improvements where they are most needed. Finally,these methods can be enhanced by tools and techniques such as GIS and preference surveys oftravelers.
In addition, planners may develop combinations of existing and new approaches. Bicycle andpedestrian travel demand forecasting is an evolving field, and creative thought is needed by thosewho are confronted with planning needs in the real world. The best approach for any particularsituation will depend on available knowledge, data, financial, and technical resources, as well asthe specific purpose for which the demand forecasts are being developed.
Finally, planners should be aware of the limitations as well as the advantages of existingmethods, and should supplement quantitative forecasts with the judgment of local practitionersand advocates when planning projects. Despite limitations, however, the methods discussed inthis guidebook can provide valuable information, both for estimating the benefits of proposedprojects and for prioritizing projects and improvements to achieve the greatest benefits to users.
4.2 Future NeedsAs a result of developing this guidebook, a number of areas have been identified in whichadditional research and methodological development could be particularly useful. Thesesuggestions are presented so that users of this guidebook can consider the limitations of existingknowledge when developing their own methods, collecting data, and conducting research.Recommended future efforts include:
• Development of a manual for bicycle and pedestrian sketch-planning. In the shortterm, practitioners with neither the resources nor the expertise to conduct an indepthforecasting study need a simple yet effective set of tools and data for estimating futuredemand.
• Further research on factors influencing non-motorized travel behavior. Ongoingresearch into the specific factors that influence decisions to bicycle and walk willimprove the quality of both sketch-planning and more advanced modeling techniques .Research should focus not just on identifying specific factors but on how these factorsinteract and how they can be modeled to assist in forecasting bicycle or pedestrian travelfor specific projects.
• Integration of bicycle and pedestrian considerations into mainstream transportationmodels and planning. Future improvements to regional travel models hold great promiseto improve the quality of non-motorized travel modeling, if these modes are included intravel model development efforts. Inclusion of these modes will also help place bicyclesand pedestrians on a "level playing field" with motorized modes in transportationplanning.
Development of a Manual for Bicycle and Pedestrian Sketch-Planning
In the absence of better methods, practitioners who need to estimate usage on a non-motorizedfacility generally resort to back-of-the-envelope calculations based on readily available data andrules of thumb on travel behavior. These methods are somewhat crude and generally have notbeen tested for accuracy, but nevertheless may be the best that is possible given limitations ondata, resources, and expertise. Development of a sketch-planning manual for bicycle andpedestrian forecasting would improve the state of practice in this area and could be widely usedby bicycle and pedestrian planners. Such a manual would include methods and supporting datafor developing local estimates of demand. Specific elements of the manual might include:
• A summary of available bicycle and pedestrian travel characteristics, including trip lengthdistributions by type of trip, personal and household characteristics of travelers, etc.;
• A summary of studies that have evaluated the effects of various bicycle or pedestrianfacility or policy improvements on non-motorized travel;
• Identification and description of existing data sources, such as the census, travel surveys,and land use data bases, which can support the estimation of non-motorized traveldemand;
• Guidelines for collecting local data, including user counts and surveys of existing andpotential users;
• Applications of new technologies, including GIS methods and Intelligent TransportationSystem (ITS) technologies, for data collection and analysis; and
• A set of back-of-the-envelope procedures for using these various data sources to obtainrough estimates of demand.
The sketch-planning techniques could, at a minimum, draw from techniques that already havebeen developed by practitioners and identified in this guidebook. Ideally, such techniques wouldbe further developed and tested in practice to ensure that they are applicable to a variety of areasand that they give reasonable results.

Additional research useful for this type of guidebook might include further analysis of datasources, such as trail user counts and surveys in conjunction with other trail-related data, to lookfor patterns in facility usage and to provide information useful for the planning of comparablefacilities.
Research on Factors Influencing Non-Motorized Travel Behavior
Along with the short-term documentation of planning methods and data for practitioners, morefundamental research is needed into the factors influencing non-motorized travel behavior andhow these factors can be modeled to support demand forecasting. Particular attention should begiven to identifying factors that are both of significance in predicting non-motorized travelbehavior and that can be collected or created with relative ease from existing data sources orfuture survey efforts. Factors should be investigated that can be useful in a variety of forecastingmethodologies ranging from sketch-planning techniques to travel demand and networkmodeling. Focusing on the individual traveler as the unit of analysis, rather than on aggregate-level studies, will provide richer information that will be useful not only for improvements tocurrent efforts but to future modeling efforts such as activity-based analysis andmicrosimulation.
Facility design characteristics. Significant research has focused on developing quantitativemeasures of the quality or compatibility of facilities for bicyclists and pedestrians. The next stepis to integrate these measures into methods of forecasting travel demand. Research is needed intohow to aggregate facility-level compatibility measures, such as the Bicycle Compatibility Index,into an overall route or network compatibility measure, including facilities of varying quality aswell as intersections and other discontinuities. Ultimately, the overall route or set of routeoptions, rather than just individual facility characteristics, determines whether or not the bicyclistor pedestrian makes the trip.
Environment factors. Area-level environment factors that describe, or act as a proxy for, therelative attractiveness of bicycling or walking at an area/zonal level are potentially useful andshould be further developed and tested. Pedestrian environment factors should be further refinedand tested to verify their predictive capability. (Efforts in this area should build on recentresearch relating neighborhood design factors to levels of walking.) Bicycle environment factorsalso should be developed and tested for predictive capability. Other possibilities include thequality or impedance of alternative modes (traffic speeds, LOS, cost of parking, etc.) and thepotential demand based on trip-end characteristics (population, employment, special generators,etc.). These factors should be useful both in sketch-planning techniques and in regional travelmodels where the scale of resolution is too coarse to model every facility in the network.
Attitudinal and perceptual factors. The relative importance of attitudinal and perceptualfactors in the choice to walk or bicycle, as well as their potential uses in modeling, should beinvestigated. While gathering such data requires additional collection efforts, factors of this typehave been found to be highly significant in determining travel behavior. Research in this areashould focus on (1) which factors are most important; (2) how they can best bedescribed/standardized; (3) what level of resources are required to collect these data on anongoing basis; (4) how the factors may change over time; (5) how they can most effectively beinfluenced; and (6) how they can be integrated into modeling/forecasting techniques to predictthe impacts of various policies. Research in this area can build on behavioral research from the

public health field, as well as on existing studies of attitudes and perceptions regarding bicyclingand walking.
Factors influencing recreational travel. None of the methods discussed in this guidebook makean explicit distinction between recreational and utilitarian travel. Many aggregate-level methodsconsider both types implicitly by looking at overall travel on a facility, while others such asregional travel models consider only utilitarian trip-making. Forecasting recreational travel atthe individual or disaggregate level requires a different analysis framework, involving lifestyleand activity patterns, than is generally used in transportation modeling. Approaches from thepublic health arena that model the decision to exercise as a function of variouspersonal/attitudinal characteristics and social factors should be helpful for incorporatingrecreational travel in transportation modeling.
Figure 4.1 Models Need to be Capable of ModelingBoth Utilitarian and Recreational Travel.
Market research. Marketers in competitive industries have long recognized that marketingsuccess depends on targeting the right customer with the right product. State-of-the-arttechniques from the field of market research can be used to better identify the "market segments"for non-motorized travel, the travel characteristics of each market segment, and the facilitydesign factors that are important in attracting increased usage from each segment. The trip andpersonal characteristics of recreational travelers, for example, should be differentiated from thoseof utilitarian travelers, while utilitarian users may be further distinguished as necessity vs.discretionary, commute vs. non-commute, etc. While some research has been conducted indefining non-motorized market segments, planners have not adequately identified the differencesin techniques required for identifying the needs and predicting the behavior of these variousgroups.
Integration of facility/environment, policy, and personal/attitudinal variables into anoverall modeling framework. Insights from the public health and social marketing fieldssuggest that personal attitudes and beliefs interact strongly with environmental and policyvariables to influence travel behavior and mode choice, particularly for bicycling. Accurateforecasting of bicycle travel will require integrating these variables into a modeling framework

which can include personal/attitudinal variables, and which can account for the fact that theeffects of facility/environmental improvements will depend on (as well as influence) the levels ofthese other variables.
Integration of Bicycle and Pedestrian Considerations intoMainstream Transportation Models and Planning
As a final recommendation, further development of modeling techniques and data sources isneeded to better integrate bicycle and pedestrian travel into mainstream transportation modelsand planning activities. Regional travel models have the unique advantage of representing anintegrated framework for predicting travel decisions, considering all trips and modal options, aswell as personal and household characteristics, within the spatial structure of the surroundingarea. Furthermore, they are widely used and accepted as demand forecasting methods forautomobile and transit planning. Improvements to existing models should significantly increasetheir usefulness for analyzing non-motorized policies and facility improvements. Specific near-term and long-term improvements might include:
Data collection on bicycle and pedestrian travel. A general need for all types of bicycle andpedestrian planning is better data on trip and personal characteristics of travelers. Householdtravel surveys performed for modeling purposes are a potentially effective means of collectingthese data. While data on non-motorized trips are increasingly being collected in these surveys,surveys must be designed carefully to ensure that all non-motorized trips are reported. Also,since there are generally few reported bicycle trips, additional means of collecting data onbicycle trips, such as supplemental stated preference surveys, may be required. The potential fornon-motorized data collection using emerging ITS information technologies should also beinvestigated.
Spatial scales of models. The scale at which travel is modeled should be refined to be morerelevant to the short distances involved in bicycle and pedestrian travel. Improvements incomputational power and in data management tools will make it easier to analyze smaller-scalenetworks of bicycle and pedestrian facilities rather than just major roadways.
Facility design factors. For travel models in which bicycle and pedestrian networks can beaccurately represented, the most important design variables for predicting mode and route choiceshould be identified and included in the network link characteristics in the model. This willrequire quantifying tradeoffs between these variables and link travel time or distance. Traveltime penalties also need to be developed for major intersections or other discontinuities in thenetwork. The validity of aggregating link-level factors across routes and networks to produce anoverall "utility" or "compatibility" should be tested. In addition, the potential for transferringpreferences for facility design from studies conducted in one area to other areas, to avoid theneed for locally-specific surveys, should be investigated.
Environment factors. For regional models in which zones are too large to model local non-motorized networks, further development and testing of zone-level environment factors areneeded to validate the usefulness of these models for analyzing non-motorized travel. Theseefforts can build on the outcomes of basic research into these factors and can also utilize GISdata bases and analysis techniques to develop better factors. In addition, environment factorsshould be developed for bicycles as well as pedestrians.
Other environmental and policy variables critical to non-motorized modeling. Factors suchas the presence of bicycle parking and workplace showers and lockers may be just as importantas facility and network design factors in determining the decision to walk and particularly tobicycle. Methods should be investigated for collecting data on these factors; describing them in away in which they can be included in travel models; and verifying the relationship of theidentified factors with levels of non-motorized travel.
Modeling behavioral change in multiple stages. Methods and data requirements for modelingbicycle use in multiple stages should be investigated. Multi-stage behavior models may improveforecasting efforts because the individual must first decide to even consider bicycling or walkingas a viable travel option. Only when bicycling or walking is regarded as a viable option does thequestion of whether to bicycle or walk for a particular trip become relevant. These methodsshould be tested for improving the sensitivity and predictive power of travel models. The resultsof research into attitudinal and perceptual factors, as well as modeling approaches from thepublic health and market research areas, can inform this process.
Inclusion of recreational travel. To be useful for modeling non-motorized travel particularly onseparate facilities, travel models will need to be capable of modeling recreational as well asutilitarian travel. Advances in activity-based modeling, which looks at personal and householdactivity patterns rather than simply trip-making patterns, may be useful in this effort. Researchand methods from the public health arena are also relevant to modeling recreational travel.