ground-water geochemistry of the near-surface …ground-water geochemistry of the near-surface...
TRANSCRIPT
GROUND-WATER GEOCHEMISTRY OF THE NEAR-SURFACE
WASATCH FORMATION, NORTHERN GREEN RIVER BASIN,
SUBLETTE COUNTY, WYOMING
By Daniel T. Chafin and Briant A. Kimball
U.S. GEOLOGICAL SURVEY
Water-Resources Investigations Report 91-4069
Denver, Colorado 1992
U.S. DEPARTMENT OF THE INTERIOR
MANUEL LUJAN, JR., Secretary
U.S. GEOLOGICAL SURVEY
Dallas L. Peck, Director
For additional information write to:
District Chief U.S. Geological Survey Box 25046, Mail Stop 415 Denver Federal Center Denver, CO 80225-0046
Copies of this report can be purchased from:
U.S. Geological SurveyBooks and Open-File Reports SectionFederal CenterBox 25425Denver, CO 80225
CONTENTS
PageAbstract------- ---------- -- --- _______ _______ _________ ______ jIntroduction------------------ ------------- _-__ _____ __________ _ 2
Purpose and scope------------- ------- _____________ __ ______ 2Geographic setting-- 3Hydrogeologic getting----------------- --------- ______-- _______ 5Well-numbering system--------------- --- _________________________ g
Ground-water geochemistry----- ______------- - -_-_-_______----------- gSampling methods and types of water-quality data collected 8Distribution of dissolved solids and water types----------- ------- 12Simulation of geochemical reactions - - 13
Methods--- 13Results- ----- -- -- - 15
Reaction from recharge water to water at site 1 16Reaction from recharge water to water at site 2----------- 19Reaction from water at site 2 to water at site 5- - 21 Net carbon reaction from recharge water to water at
site 5 23Reaction from water at site 5 to water at site 6---------- 24Reaction from recharge water to water at site 8 26Reaction from water at site 8 to water at site 3- 29 Net carbon reaction from recharge water to water at
site 3- 29Discussion of calculated ages and hydraulic conductivities----- 31
Stable isotope trends - 32Sulfur-34 33Oxygen-18 and deuterium--- 34
Summary and conclusions - - 36References cited---------- - ------- - ------------------------------ 39
PLATES [In pocket]
1. Map showing generalized potentiometric surface of thenear-surface (less than 300 feet deep) Wasatch Formation of the northern Green River Basin, Wyoming, through 1984.
2. Map showing dissolved-solids concentrations and water types of the near-surface (less than 300 feet deep) Wasatch Formation of the northern Green River Basin, Wyoming.
FIGURES
Page Figure 1. Map showing location of the study area in the northern
Green River Basin and major geographic features 4 2. Map showing generalized geology of the study area and
sites where ground-water samples were collected during this study----------- ---------------------------- 6
111
Figure 3. Diagram showing well-numbering system 4. Graph showing relation between concentration of dissolved
sulfate and 6 sulfur-34 for ground water in the Wasatch Formation of the northern Green River Basin-
5. Graph showing relation between 6deuterium for sites 1-7 line
oxygen-18 and 6 and worldwide meteoric water
TABLES
Table 1. Wells from which samples were analyzed for selectedwater-quality constituents and isotopes-
10,
Water-quality data of the near-surface Wasatch Formationof the northern Green River Basiin at selected samplingsites- > -
Components and results of mass-balance calculations forrecharge water to water at site 1
Components and results of mass-balance calculations forrecharge water to water at site 2
Components and results of mass-balance calculations forwater at site 2 to water at site 5 -
Summed carbon reactions from recharge water to water atsite 5 and calculated age of water at site 5
Components and results of mass-balance calculations forwater at site 5 to water at site 6--------------------
Components and results of mass-balance calculations forrecharge water to water at site 8
Components and results of mass-balance calculations forwater at site 8 to water at site 3
Summed carbon reactions from recljiarge water to water atsite 3 and calculated age of water at site 3
Page 9
33
35
Page
10
11
17
19
22
24
25
27
30
31
CONVERSION FACTORS, ABBREVIATED WATER-QUALITY UNITS, AND VERTICAL DATUM
Multiply
foot (ft)foot per day (ft/d)foot per mile (ft/mi)inch (in.)mile (mi)square mile (mi 2 )
By
0.30480.30480.1894
25.401.6092.590
To obtain
metermeter per daymeter per kilometermillimeterkilometersquare kilometer
Temperature in degree Celsius (°C) can be converted to degree Fahrenheit (°F) by use of the following formula:
°F = 9/5 (°C) + ^2 .
IV
The following chemical terms are used in this report:
H Hydrogen ion« ++ « -, .Ca Calcium ion
Mg Magnesium ion
Na Sodium ion
K Potassium ion
Cl Chloride ion
S04~2 Sulfate ion
HCOi Bicarbonate ion
CC>2 Carbon dioxide molecule
Water molecule
The following terms and abbreviations also are used in this report: charge units per liter (chg/L) millimole per liter (mmol/L) day per year (d/yr) parts per thousand (per mil) microgram per liter (|Jg/L) percent modern carbon (pmc) milligram per liter (mg/L)
National Geodetic Vertical Datum of 1929 (NGVD of 1929):A geodetic datum derived from a general adjustment of the first-order level nets of both the United States and Canada, formerly called Sea Level Datum of 1929.
GROUND-WATER GEOCHEMISTRY OF THE NEAR-SURFACEWASATCH FORMATION, NORTHERN GREEN RIVER
BASIN, SUBLETTE COUNTY, WYOMING
By Daniel T. Chafin and Briant A. Kimball
ABSTRACT
In 1981, the U.S. Geological Survey began a study of ground water of the Upper Colorado River Basin as part of the Regional Aquifer-System Analysis (RASA) Program. The near-surface Wasatch Formation of the northern Green River Basin was selected for study because of the importance of the ground water in this area for stock and domestic use. This report provides general information about the hydrologic system and detailed information about the chemical quality of the water and its evolution in this system.
The near-surface ground water in the arkosic sandstones of the Wasatch Formation of the northern Green River Basin primarily is fresh, sodium carbonate water with an alkaline pH. Dissolved solids generally increase down flow paths. The potentiometric surface in this area indicates that the ground water is providing base flow to the major streams in the central and eastern parts of the study area.
Chemical-reaction modeling indicates dissolution of carbonate minerals by water that is exposed to large carbon dioxide partial pressures in the soil of recharge areas. Below the soil zone, ground water quickly becomes isolated from the atmosphere, indicating that the Wasatch Formation is a confined aquifer system. Incongruent dissolution of dolomite predominates after the water flows a few miles into the basin. Incongruent dissolution of feldspars occurs throughout the study area; smectite precipitation dominates near recharge areas, and analcime and saponite precipitation dominate farther into the basin. Ion exchange of calcium and magnesium for sodium is a major reaction believed to affect the composition of the ground water in the Wasatch Formation throughout most of the study area. Sulfate is provided by gypsum (or anhydrite) dissolution throughout most of the basin but is reduced to sulfide by organic matter near the southern boundary of the study area. Sulfide is precipitated as pyrite, although, at greater depths in the Wasatch Formation, hydrogen sulfide gas is present because of a limited iron supply.
Final reaction models were used to calculate three carbon-14 ages for the ground water, and average ground-water velocities were computed from the calculated ages. Ground water near the recharge areas at the base of the Wind River Range in the northern part of the study area had a calculated age of about 4,700 years. The resulting estimated ground-water velocity is about
0.01 foot per day; the corresponding hydraulic day. A calculated age of 21,000 years for ground part of the study area indicates an estimated 0.017 foot per day from the recharge area by spending hydraulic conductivity is 0.3 foot ground water in the central part of the study in an estimated average ground-water velocity recharge area along the Wyoming Range to the conductivity is 0.8 foot per day. These values the value of 6.5 feet per day derived from a other investigators and the median of measured differences between calculated and measured from uncertainties in carbon-14 age calculations
Sulfate sulfur isotopes exhibit a progressive lightening basinward exceptfor those samples that have undergone sulfate
conductivity is 0.2 foot perwater in the south-central
average ground-water velocity of Wind River Range; the corre- day. The calculated age of
area is 12,700 years, resulting of 0.025 foot per day from the
; the corresponding hydraulic are considerably smaller than
gional ground-water model by values (8.7 feet per day). The
do not appear to result for ground water.
theper
west
re
values
reduction. This progressivelightening is hypothesized to result from the [progressive dissolution of sulfate minerals that vary in sulfur-34 contenlt regionally because of the depositional environment during warm, humid Eocene times.
INTRODUCTION
Water use has been increasing in the Upper Colorado River Basin because of increasing demands for agricultural, domestic, municipal, and industrial use. Ground-water systems may contain large volumes of water that could be developed to help meet these demands, but they have not been studied in detail. In addition, increased use of ground yater has prompted concern about the water-quality characteristics of these systems. Therefore, the U.S. Geological Survey began a study of the Upper Colorado River Basin in 1981 as part of the Regional Aquifer-System Analysis (RASA) Program. The objectives of the Upper Colorado RASA were to locate major aquifer systems, estimate the volume of ground water in storage, determine the quality of available ground water, and estimate the hydrologic effects of [major withdrawals and injection.
The near-surface (generally less than 300 ft deep) Wasatch Formation of the northern Green River Basin in Wyoming is a major aquifer in this arid region. However, little information is available about the geochemistry that affects the ground-water quality. This information is needed for effective ground-water-resources management and for evaluation of the potential conse quences of various water-management alternatives.
Purpose and Scope
This report describes the geochemistry ofin the Wasatch Formation in the northern Green River Basin in Wyoming. Specifically, this report presents: (1) distributions of dissolved-solidsconcentrations and water types; (2) results of water-rock geochemical reactions; (3) calculat
the near-surface ground water
mass-balance simulations of ions of ground-water ages by
the use of carbon-14 activities, and (4) stable isotope trends. Calculated carbon-14 ages allowed the estimation of hydraulic-conductivity values, which were compared to those used to calibrate a regional ground-water model by other investigators (Larry Martin, U.S. Geological Survey, written commun., 1988).
The data base included potentiometric and water-quality data obtained by the U.S. Geological Survey. Some of the water-quality data used are from Welder (1968). Additional water-quality data were obtained by the collection and analysis of seven samples from seven sites during August 1983. The only available isotope data are from these seven samples.
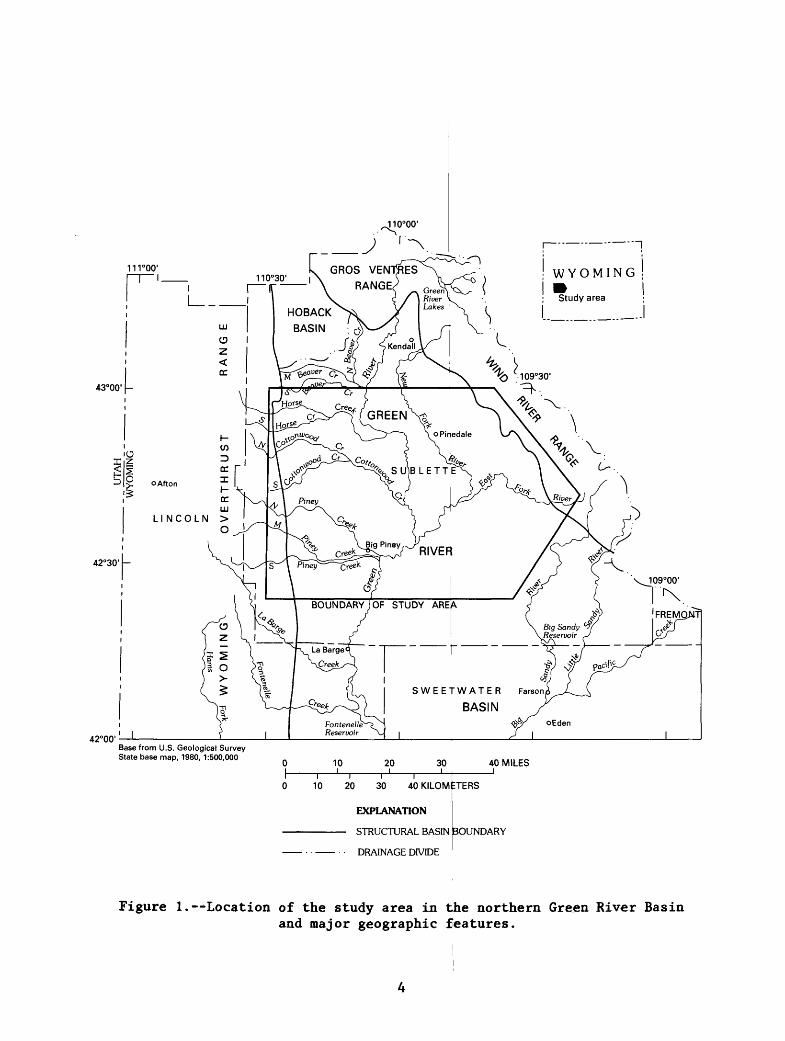
Geographic Setting
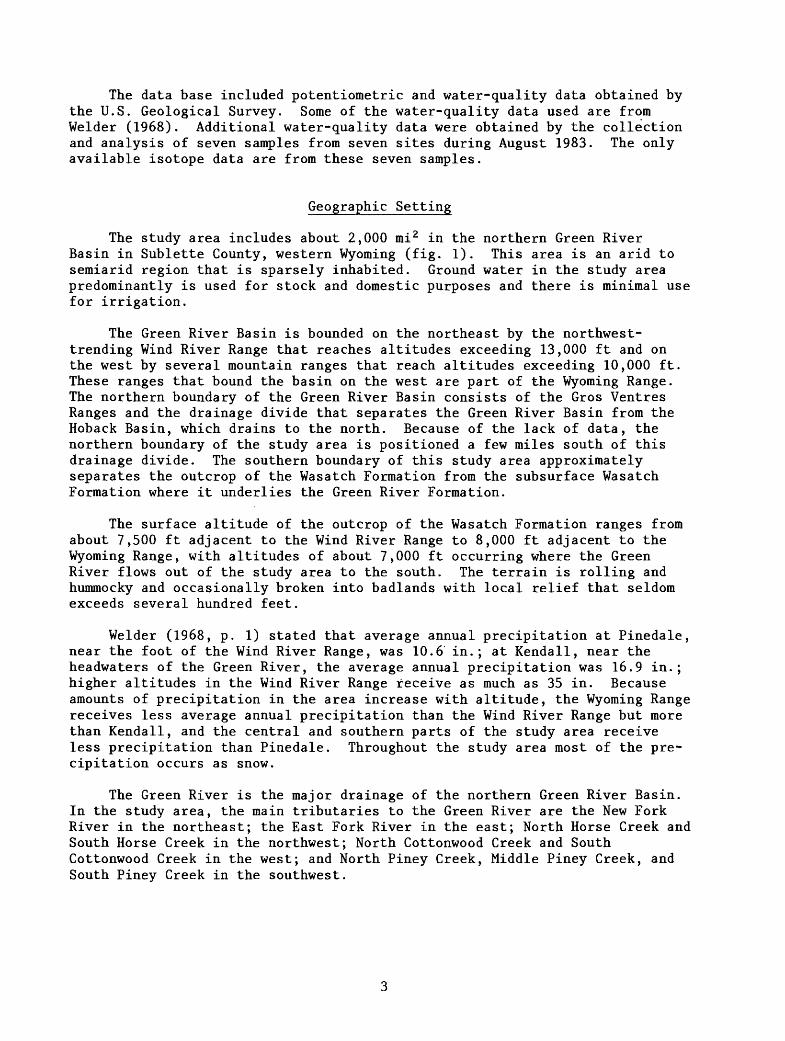
The study area includes about 2,000 mi 2 in the northern Green River Basin in Sublette County, western Wyoming (fig. 1). This area is an arid to semiarid region that is sparsely inhabited. Ground water in the study area predominantly is used for stock and domestic purposes and there is minimal use for irrigation.
The Green River Basin is bounded on the northeast by the northwest- trending Wind River Range that reaches altitudes exceeding 13,000 ft and on the west by several mountain ranges that reach altitudes exceeding 10,000 ft. These ranges that bound the basin on the west are part of the Wyoming Range. The northern boundary of the Green River Basin consists of the Gros Ventres Ranges and the drainage divide that separates the Green River Basin from the Hoback Basin, which drains to the north. Because of the lack of data, the northern boundary of the study area is positioned a few miles south of this drainage divide. The southern boundary of this study area approximately separates the outcrop of the Wasatch Formation from the subsurface Wasatch Formation where it underlies the Green River Formation.
The surface altitude of the outcrop of the Wasatch Formation ranges from about 7,500 ft adjacent to the Wind River Range to 8,000 ft adjacent to the Wyoming Range, with altitudes of about 7,000 ft occurring where the Green River flows out of the study area to the south. The terrain is rolling and hummocky and occasionally broken into badlands with local relief that seldom exceeds several hundred feet.
Welder (1968, p. 1) stated that average annual precipitation at Pinedale, near the foot of the Wind River Range, was 10.6 in.; at Kendall, near the headwaters of the Green River, the average annual precipitation was 16.9 in.; higher altitudes in the Wind River Range receive as much as 35 in. Because amounts of precipitation in the area increase with altitude, the Wyoming Range receives less average annual precipitation than the Wind River Range but more than Kendall, and the central and southern parts of the study area receive less precipitation than Pinedale. Throughout the study area most of the pre cipitation occurs as snow.
The Green River is the major drainage of the northern Green River Basin. In the study area, the main tributaries to the Green River are the New Fork River in the northeast; the East Fork River in the east; North Horse Creek and South Horse Creek in the northwest; North Cottonwood Creek and South Cottonwood Creek in the west; and North Piney Creek, Middle Piney Creek, and South Piney Creek in the southwest.
"I
111 ! WYOMINGmStudy area
43°00
BOUNDARY OF STUDY ARE<V
SWEETWATER Parson
BASIN
Base from U.S. Geological Survey State base map, 1980, 1:500,000
10 20 30 40 MILES
10 20 30 40 KILOMIETERS
EXPLANATION
STRUCTURAL BASIN BOUNDARY
DRAINAGE DIVIDE
Figure 1. Location of the study area in the northern Green River Basinand major geographic fieatures.
Hydrogeologic Setting
The northern Green River Basin is part of the greater Green River Basin, which is a structural basin. In the vicinity of the study area, the northern Green River Basin is bounded by the Precambrian igneous and metamorphic rocks of the Wind River Range on the northeast, the Cambrian through Cretaceous sedimentary rocks of the Wyoming Range on the west, and the Devonian through Cretaceous sedimentary rocks of the Gros Ventres Ranges on the north.
The Green River Basin contains Paleozoic through Quaternary deposits. Quaternary glacial outwash gravels occur along the Wind River Range, and narrow bands of Quaternary alluvium are in the flood plains of the major streams.
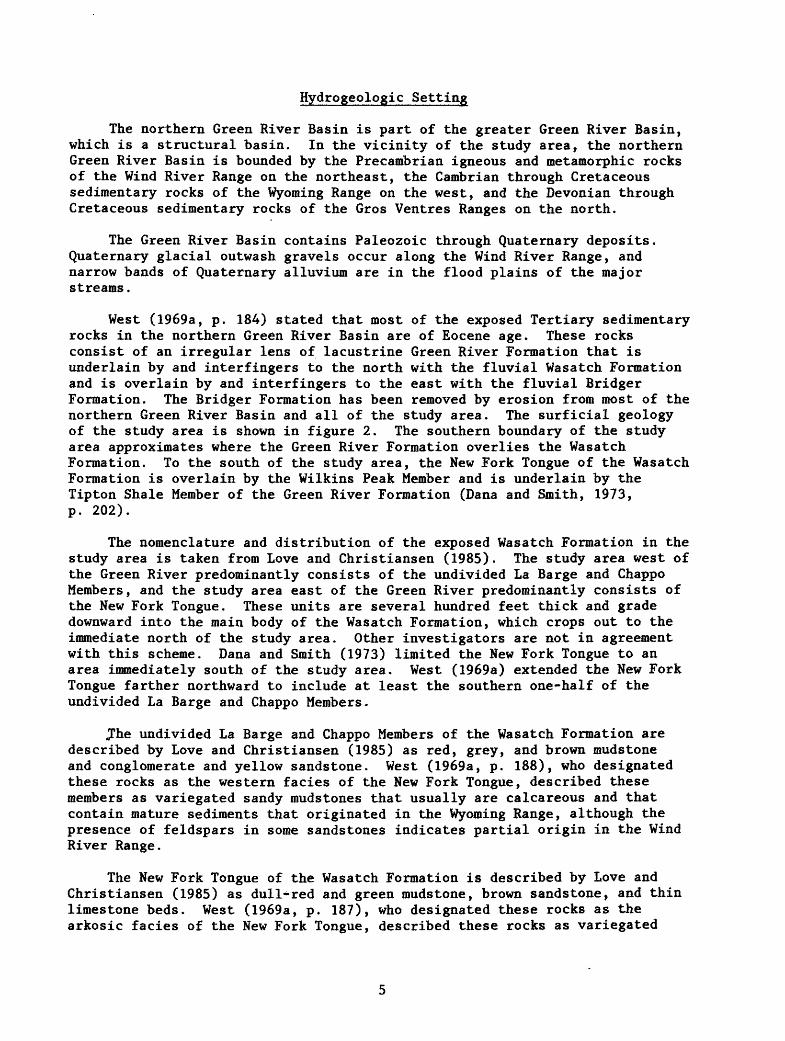
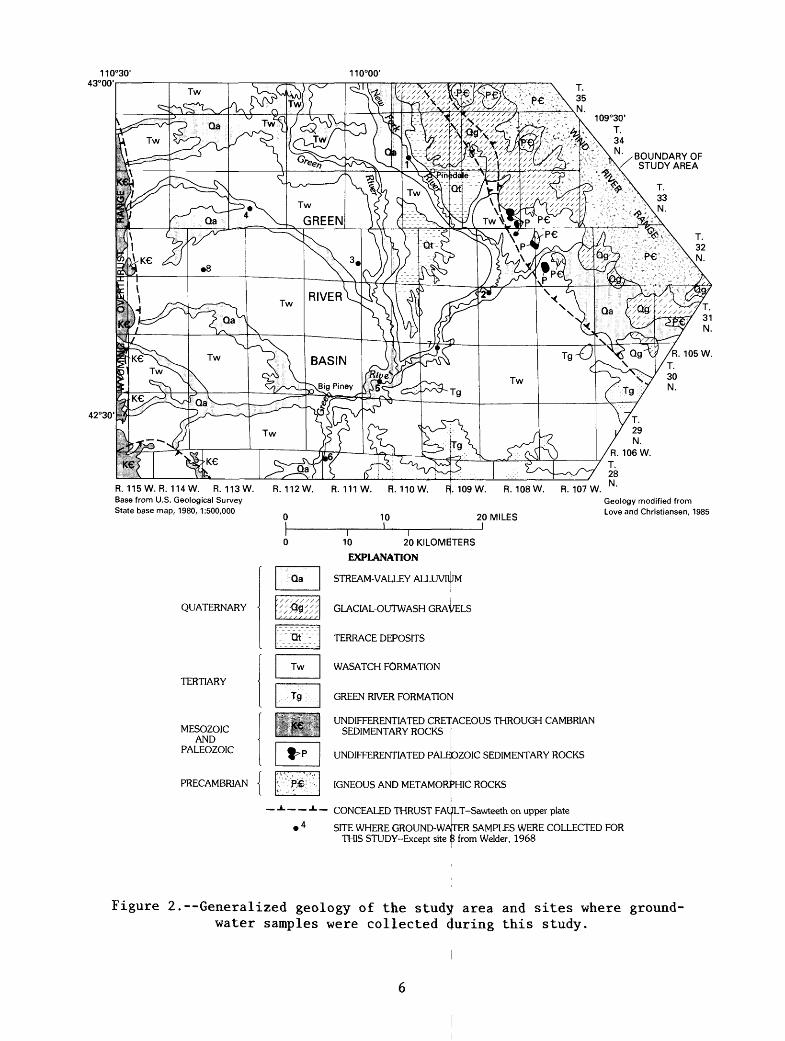
West (1969a, p. 184) stated that most of the exposed Tertiary sedimentary rocks in the northern Green River Basin are of Eocene age. These rocks consist of an irregular lens of lacustrine Green River Formation that is underlain by and interfingers to the north with the fluvial Wasatch Formation and is overlain by and interfingers to the east with the fluvial Bridger Formation. The Bridger Formation has been removed by erosion from most of the northern Green River Basin and all of the study area. The surficial geology of the study area is shown in figure 2. The southern boundary of the study area approximates where the Green River Formation overlies the Wasatch Formation. To the south of the study area, the New Fork Tongue of the Wasatch Formation is overlain by the Wilkins Peak Member and is underlain by the Tipton Shale Member of the Green River Formation (Dana and Smith, 1973, p. 202).
The nomenclature and distribution of the exposed Wasatch Formation in the study area is taken from Love and Christiansen (1985). The study area west of the Green River predominantly consists of the undivided La Barge and Chappo Members, and the study area east of the Green River predominantly consists of the New Fork Tongue. These units are several hundred feet thick and grade downward into the main body of the Wasatch Formation, which crops out to the immediate north of the study area. Other investigators are not in agreement with this scheme. Dana and Smith (1973) limited the New Fork Tongue to an area immediately south of the study area. West (1969a) extended the New Fork Tongue farther northward to include at least the southern one-half of the undivided La Barge and Chappo Members.
JPhe undivided La Barge and Chappo Members of the Wasatch Formation are described by Love and Christiansen (1985) as red, grey, and brown mudstone and conglomerate and yellow sandstone. West (1969a, p. 188), who designated these rocks as the western facies of the New Fork Tongue, described these members as variegated sandy mudstones that usually are calcareous and that contain mature sediments that originated in the Wyoming Range, although the presence of feldspars in some sandstones indicates partial origin in the Wind River Range.
The New Fork Tongue of the Wasatch Formation is described by Love and Christiansen (1985) as dull-red and green mudstone, brown sandstone, and thin limestone beds. West (1969a, p. 187), who designated these rocks as the arkosic facies of the New Fork Tongue, described these rocks as variegated
110°00'
BOUNDARY OF STUDY ARE A%'
::%X j.^N -
42°30'
R. 115 W. R. 114 W. R. 113 W. R. 112 W. R. 111 W. R. 110 W. F(. 109 W. R. 108 W. R. 107 W.Base from U.S. Geological Survey State base map, 1980,1:500,000
10 20 MILES
Geology modified from Love and Christiansen, 1985
QUATERNARY
TERTIARY
MESOZOICAND
PALEOZOIC
PRECAMBRIAN
Qa
'////////'/,$*'//,
:::W:::
Tw
,:%: : :
f^P
V: 'VP56J';V
10 20 KILOMETERS
EXPLANATION
STREAM-VALLEY ALLUVIUM
GLACIAL-OUTWASH GRAVELS
TERRACE DEPOSITS
WASATCH FORMATION
GREEN RIVER FORMATION
UNDIFFERENTIATED CRETACEOUS THROUGH CAMBRIAN SEDIMENTARY ROCKS
UNDIFFERENTIATED PALEOZOIC SEDIMENTARY ROCKS
IGNEOUS AND METAMORPHIC ROCKS
L L CONCEALED THRUST FAULT-Sawteeth on upper plate
4 SITE WHERE GROUND-WA TER SAMPLES WERE COLLECTED FORTHIS STUDY-Except site 1 ? from Welder, 1968
Figure 2. Generalized geology of the study area and sites where ground- water samples were collected (Juring this study.
strata of irregularly bedded horizontal bands of green, grey, red, brown, purple, yellow, and tan mudstones with textures ranging from mudstone to conglomerate. Most of the facies is a sandy mudstone that contains scattered grains of quartz and feldspar in a silty matrix that is rarely calcareous; some sandstones are moderately calcareous, and occasional beds and lenses of granular limestone are present. Channel deposits that contain granitoid clasts occur near the Wind River Range, which is the predominant source area for this subunit (West, 1969a, p. 187). The New Fork Tongue overlaps onto the Precambrian crystalline rocks of the Wind River Range. The contact is covered by glacial-outwash gravel that generally is 10 miles or less in width.
Dana and Smith (1973, p. 202) described the upper one-half to two-thirds of the New Fork Tongue south of this study area as a fine- to coarse-grained, friable, and porous sandstone aquifer that has less permeable layers of mudstone that separate the aquifer into several artesian zones. This hydrologic description probably is applicable for the Wasatch Formation throughout this study area, given the similarities of lithology. Welder (1968) presented data showing springs and flowing wells scattered over this study area.
To date, no detailed petrographic study has been done in the Wasatch Formation of the northern Green River Basin. The only available petrographic information results from a general study of lower Eocene fluvial sandstones in the Rocky Mountain region by Vine and Tourtelot (1973, p. 7). These authors describe four samples from the New Fork Tongue of the Wasatch Formation for the La Barge area in township 27N-113W, a few miles south of this study area adjacent to the Wyoming Range. All four of these samples are described as poorly sorted and fine- to medium-grained. Three samples consist of quartz, carbonate grains, feldspars (fresh and altered), and analcime tightly packed in a minor clay matrix; accessory minerals include abundant green, red, and brown biotite, garnet, zircon, and opaque minerals. The fourth sample con sists of a carbonate matrix that contains strongly etched feldspars and quartz with similar accessory minerals and anhydrite. The carbonate grains in the first three samples indicate allogenic clasts originating from marine source rocks. The carbonate matrix of the fourth sample indicates authigenic (post- depositional) cement. Authigenic and allogenic carbonates contribute dif ferent carbon-13 ratios upon dissolution and are discussed in the "Methods" section of this report.
A generalized map of the potentiometric surface of the near-surface Wasatch Formation in the study area is shown on plate 1. Some data from wells deeper than 300 ft were used in the construction of this map. Several hydro- logic characteristics are evident from this map:
1. Primary recharge to the Wasatch Formation occurs on the flanks of theWind River Range, the Wyoming Range, and, to a lesser extent, from the north near the headwaters of the Green River.
2. The water generally flows southwest from the Wind River Range,eastward from the Wyoming Range, and southward from the northern Green River Basin toward the central and southern parts of the study area.
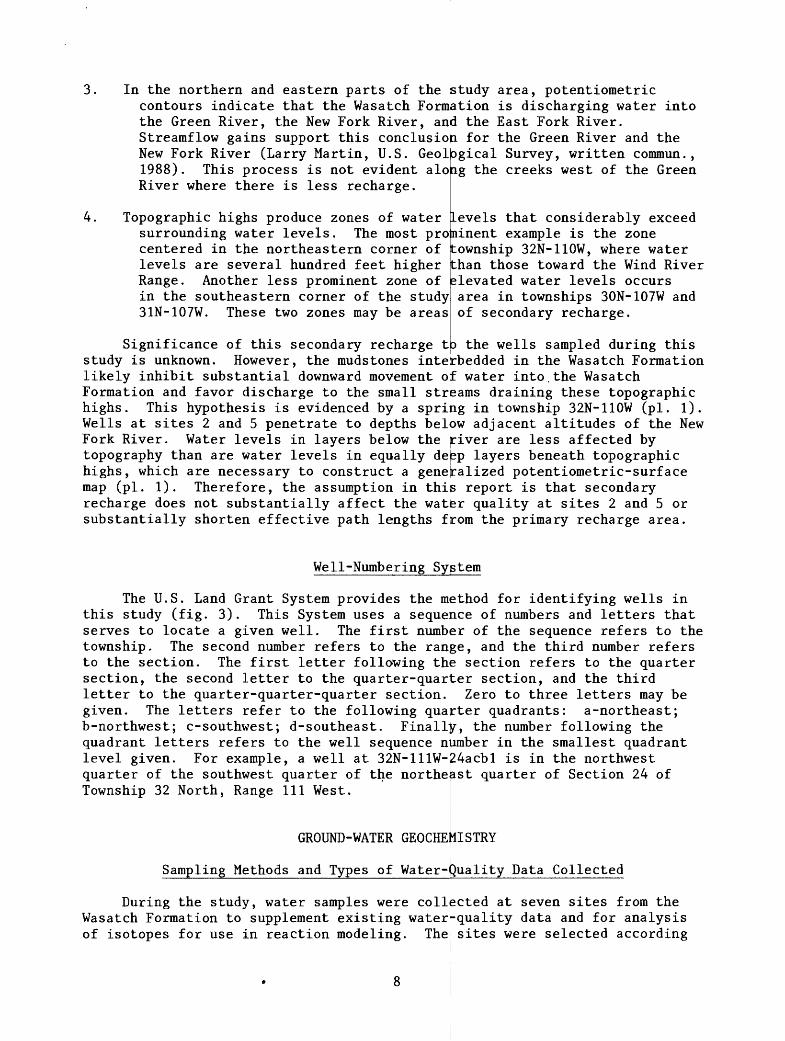
In the northern and eastern parts of the study area, potentiometriccontours indicate that the Wasatch Formation is discharging water into the Green River, the New Fork River, and the East Fork River. Streamflow gains support this conclusion for the Green River and the New Fork River (Larry Martin, U.S. Geological Survey, written commun., 1988). This process is not evident along the creeks west of the Green River where there is less recharge.
Topographic highs produce zones of watersurrounding water levels. The most prominent centered in the northeastern corner of levels are several hundred feet higher Range. Another less prominent zone of in the southeastern corner of the study 31N-107W. These two zones may be areas
levels that considerably exceedexample is the zone
township 32N-110W, where water than those toward the Wind River elevated water levels occursarea in townships 30N-107W andof secondary recharge.
Significance of this secondary recharge to the wells sampled during this study is unknown. However, the mudstones interbedded in the Wasatch Formation likely inhibit substantial downward movement of water into.the Wasatch Formation and favor discharge to the small streams draining these topographic highs. This hypothesis is evidenced by a spring in township 32N-110W (pi. 1). Wells at sites 2 and 5 penetrate to depths below adjacent altitudes of the New Fork River. Water levels in layers below the [river are less affected by topography than are water levels in equally dejsp layers beneath topographic highs, which are necessary to construct a generalized potentiometric-surface map (pi. 1). Therefore, the assumption in this report is that secondary recharge does not substantially affect the water quality at sites 2 and 5 or substantially shorten effective path lengths from the primary recharge area.
We11-Numbering System
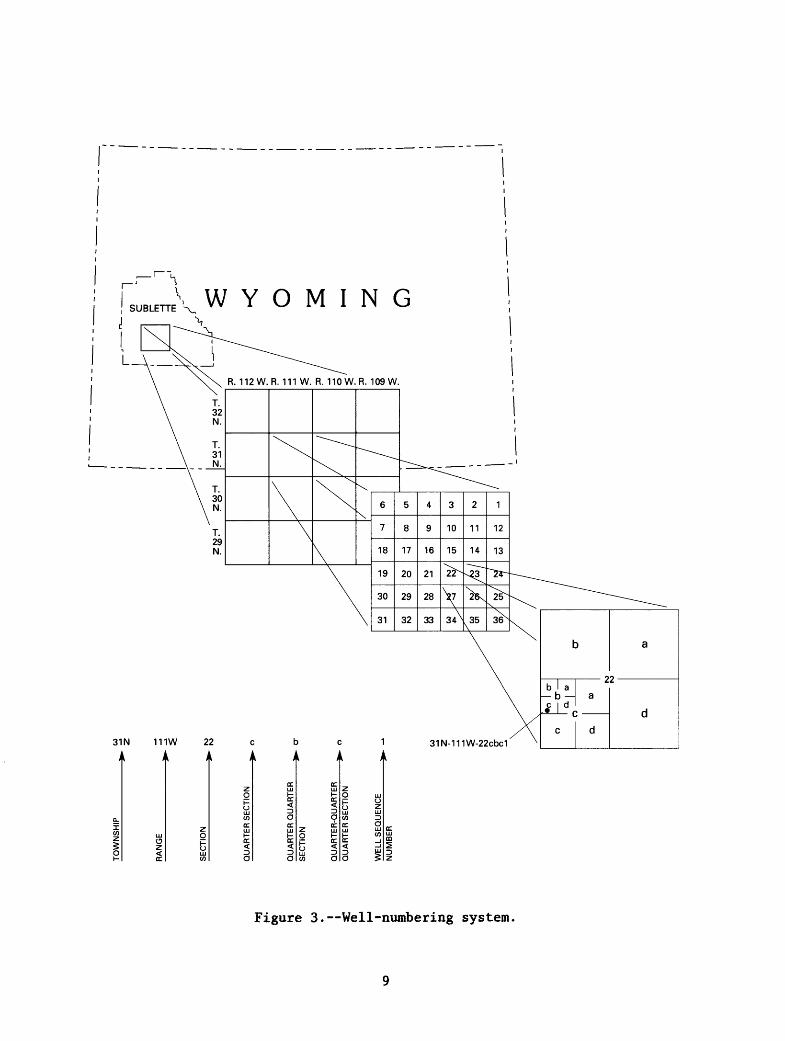
The U.S. Land Grant System provides the method for identifying wells in this study (fig. 3). This System uses a sequence of numbers and letters that serves to locate a given well. The first number of the sequence refers to the township. The second number refers to the range, and the third number refers to the section. The first letter following the section refers to the quarter section, the second letter to the quarter-quarter section, and the third letter to the quarter-quarter-quarter section. Zero to three letters may be given. The letters refer to the following quarter quadrants: a-northeast; b-northwest; c-southwest; d-southeast. Finally, the number following the quadrant letters refers to the well sequence number in the smallest quadrant level given. For example, a well at 32N-lllW-24acbl is in the northwest quarter of the southwest quarter of the northeast quarter of Section 24 of Township 32 North, Range 111 West.
GROUND-WATER GEOCHEMISTRY
Sampling Methods and Types of Water-duality Data Collected
During the study, water samples were collected at seven sites from the Wasatch Formation to supplement existing water-quality data and for analysis of isotopes for use in reaction modeling. The sites were selected according
TO
WN
SH
IP
VO
H-
00 H- P 00 M
*<J M ft n> S
RA
NG
E
SE
CT
ION
QU
AR
TE
R S
EC
TIO
N
QU
AR
TE
R-Q
UA
RT
ER
SE
CT
ION
QU
AR
TE
R-Q
UA
RT
ER
Q
UA
RT
ER
SE
CT
ION
WE
LL S
EQ
UE
NC
E
NU
MB
ER
[ O
1
0-
o
\ v
1 Q
. 1
0)
Q.
Q)
IV
CL
CT
j
Q]
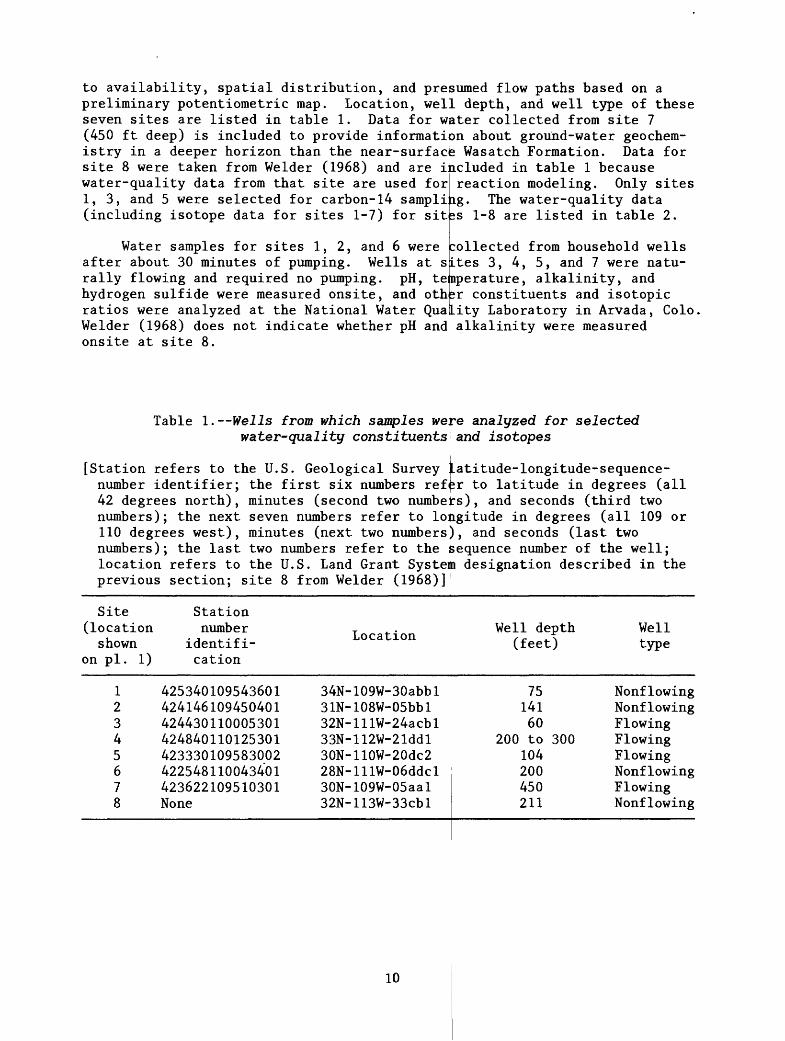
to availability, spatial distribution, and presumed flow paths based on a preliminary potentiometric map. Location, well depth, and well type of these seven sites are listed in table 1. Data for water collected from site 7 (450 ft deep) is included to provide information about ground-water geochem istry in a deeper horizon than the near-surface Wasatch Formation. Data for site 8 were taken from Welder (1968) and are included in table 1 becausewater-quality data from that site are used for1, 3, and 5 were selected for carbon-14 sampling. The water-quality data (including isotope data for sites 1-7) for sites 1-8 are listed in table 2.
sitesWater samples for sites 1, 2, and 6 were
after about 30 minutes of pumping. Wells at rally flowing and required no pumping. pH, teinperatu hydrogen sulfide were measured onsite, and oth ratios were analyzed at the National Water Quality Welder (1968) does not indicate whether pH and onsite at site 8.
reaction modeling. Only sites
collected from household wells 3, 4, 5, and 7 were natu
re, alkalinity, and isr constituents and isotopic
Laboratory in Arvada, Colo alkalinity were measured
Table 1. Wells from which samples were analyzed for selectedwater-quality constituents and isotopes
[Station refers to the U.S. Geological Survey .atitude-longitude-sequence- number identifier; the first six numbers refer to latitude in degrees (all 42 degrees north), minutes (second two numbers), and seconds (third two numbers); the next seven numbers refer to longitude in degrees (all 109 or 110 degrees west), minutes (next two numbers), and seconds (last two numbers); the last two numbers refer to the sequence number of the well; location refers to the U.S. Land Grant System designation described in the previous section; site 8 from Welder (1968)]
Site(location shown
on pl. 1)
12345678
Stationnumber
identification
425340109543601424146109450401424430110005301424840110125301423330109583002422548110043401423622109510301None
Location
34N-109W-30abbl31N-108W-05bbl32N-lllW-24acbl33N-112W-21ddl30N-110W-20dc228N-lllW-06ddcl30N-109W-05aal32N-113W-33cbl
Well depth (feet)
7514160
200 to 300104200450211
Well type
Nonf lowingNonflowingFlowingFlowingFlowingNonflowingFlowingNonflowing
10
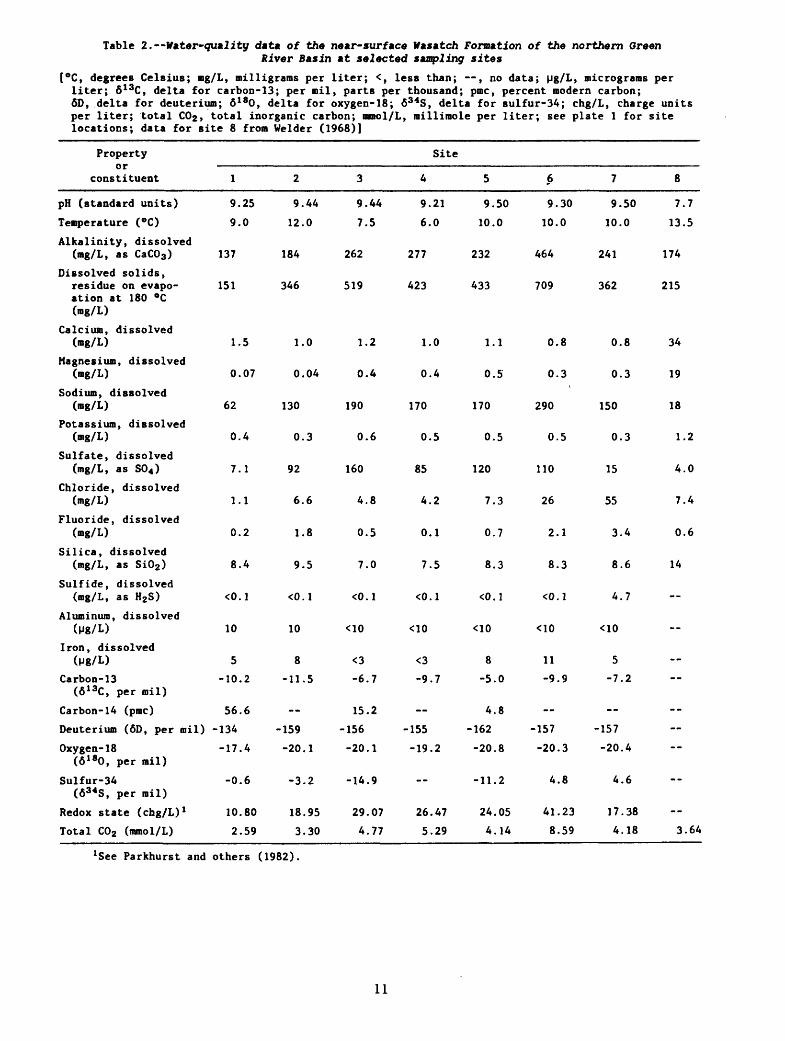
Table 2. Water-quality data of the near-surface tfasatch Formation of the northern GreenRiver Basin at selected sampling sites
[°C, degrees Celsius; rag/L, milligrams per liter; <, less than; , no data; Mg/L, micrograms per liter; 6 13C, delta for carbon-13; per mil, parts per thousand; pmc, percent modern carbon; 6D, delta for deuterium; 6 180, delta for oxygen-18; 634S, delta for sulfur-34; chg/L, charge units per liter; total C02, total inorganic carbon; mmol/L, millimole per liter; see plate 1 for site locations; data for site 8 from Welder (1968)]
Property or
constituent
pH (standard units)
Temperature (°C)
Alkalinity, dissolved(mg/L, as CaC03 )
Dissolved solids,residue on evapo-ation at 180 °C(mg/L)
Calcium, dissolved(mg/L)
Magnesium, dissolved(mg/L)
Sodium, dissolved(mg/L)
Potassium, dissolved(mg/L)
Sulfate, dissolved(mg/L, as SO 4 )
Chloride, dissolved(mg/L)
Fluoride, dissolved(mg/L)
Silica, dissolved(mg/L, as Si02 )
Sulfide, dissolved(mg/L, as H2S)
Aluminum, dissolved(Mg/L)
Iron, dissolved(Mg/L)
Carbon- 13(6 13C, per mil)
Carbon- 14 (pmc)
Deuterium (6D, per mil)
Oxygen- 18(6 180, per mil)
Sulfur-34(634S, per mil)
Redox state (chg/L) 1
Total C02 (mmol/L)
Site
1
9.25
9.0
137
151
1.5
0.07
62
0.4
7.1
1.1
0.2
8.4
<0.1
10
5
-10.2
56.6-134
-17.4
-0.6
10.80
2.59
2
9.44
12.0
184
346
1.0
0.04
130
0.3
92
6.6
1.8
9.5
<0.1
10
8
-11.5
--
-159
-20.1
-3.2
18.95
3.30
3
9.44
7.5
262
519
1.2
0.4
190
0.6
160
4.8
0.5
7.0
<0.1
<10
<3-6.7
15.2-156
-20.1
-14.9
29.07
4.77
4
9.21
6.0
277
423
1.0
0.4
170
0.5
85
4.2
0.1
7.5
<0.1
<10
<3-9.7
-155
-19.2
__
26.47
5.29
5
9.50
10.0
232
433
1.1
0.5
170
0.5
120
7.3
0.7
8.3
<0.1
<10
8-5.0
4.8-162
-20.8
-11.2
24.05
4.14
6
9.30
10.0
464
709
0.8
0.31
290
0.5
110
26
2.1
8.3
<0.1
<10
11-9.9
-157
-20.3
4.8
41.23
8.59
7
9.50
10.0
241
362
0.8
0.3
150
0.3
15
55
3.4
8.6
4.7
<10
5-7.2
-157
-20.4
4.6
17.38
4.18
8
7.7
13.5
174
215
34
19
18
1.2
4.0
7.4
0.6
14
--
--
--
--
--
--
--
3.64
*See Parkhurst and others (1982).
11
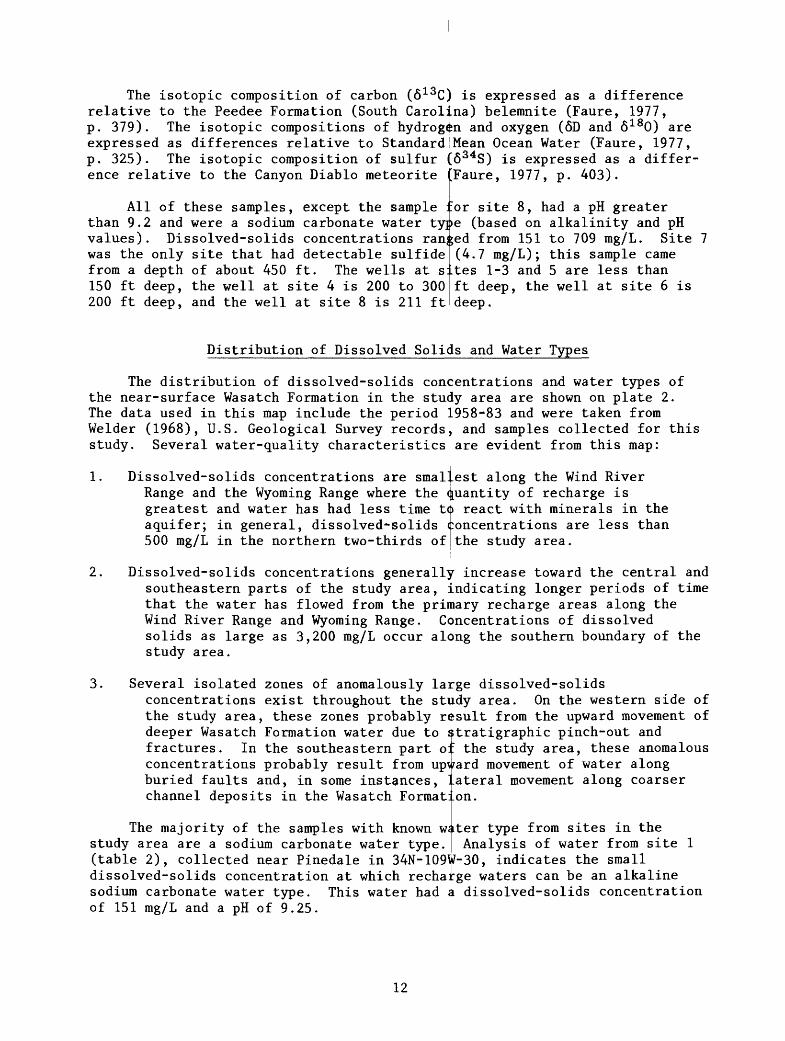
The isotopic composition of carbon (6 13C] relative to the Peedee Formation (South Carol] p. 379). The isotopic compositions of hydrogen expressed as differences relative to Standard p. 325). The isotopic composition of sulfur ence relative to the Canyon Diablo meteorite
typeAll of these samples, except the sample
than 9.2 and were a sodium carbonate water values). Dissolved-solids concentrations ran was the only site that had detectable sulfide from a depth of about 450 ft. The wells at s 150 ft deep, the well at site 4 is 200 to 300 200 ft deep, and the well at site 8 is 211 ft
is expressed as a difference na) belemnite (Faure, 1977,
and oxygen (6D and 6 180) are Mean Ocean Water (Faure, 1977, ]6 34S) is expressed as a differ- [Faure, 1977, p. 403).
or site 8, had a pH greater(based on alkalinity and pH
ged from 151 to 709 mg/L. Site (4.7 mg/L); this sample came tes 1-3 and 5 are less than ft deep, the well at site 6 is deep.
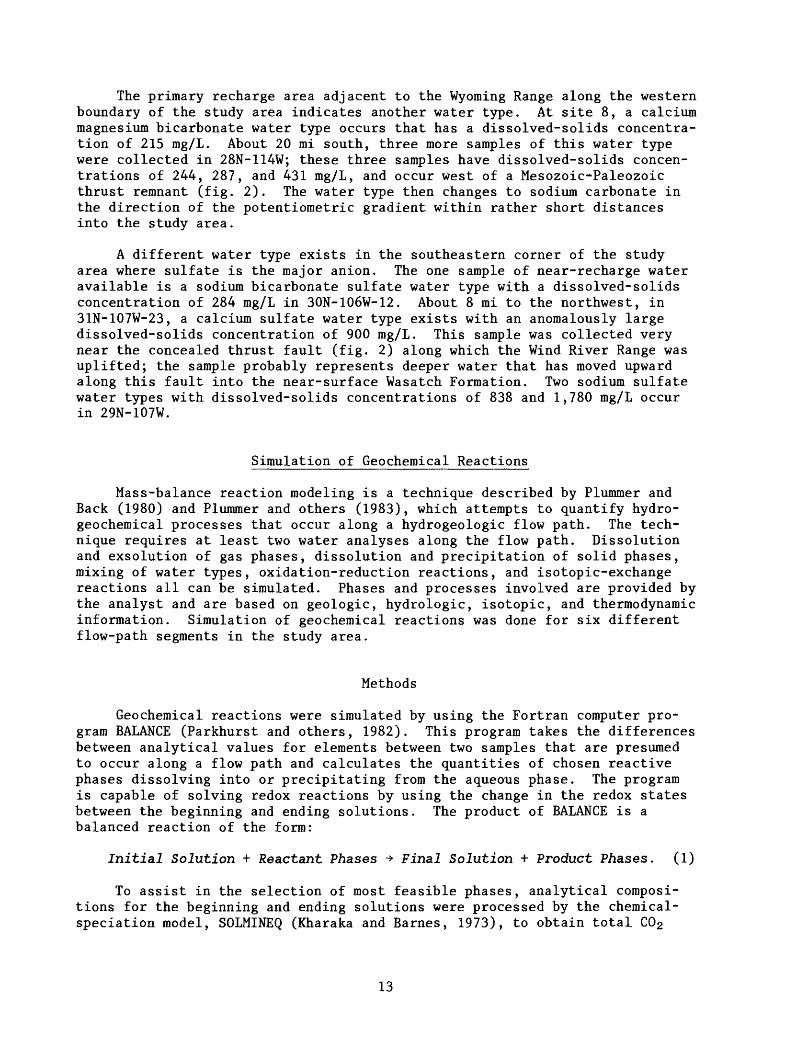
Distribution of Dissolved Solids and Water Types
The distribution of dissolved-solids concentrations and water types of the near-surface Wasatch Formation in the study area are shown on plate 2. The data used in this map include the period 1958-83 and were taken from Welder (1968), U.S. Geological Survey records, and samples collected for this study. Several water-quality characteristics are evident from this map:
1. Dissolved-solids concentrations are smallest along the Wind River Range and the Wyoming Range where the 4uantity of recharge is greatest and water has had less time to react with minerals in the aquifer; in general, dissolved-solids concentrations are less than 500 mg/L in the northern two-thirds of the study area.
2. Dissolved-solids concentrations generally increase toward the central and southeastern parts of the study area, indicating longer periods of time that the water has flowed from the primary recharge areas along the Wind River Range and Wyoming Range. Concentrations of dissolved solids as large as 3,200 mg/L occur along the southern boundary of the study area.
3. Several isolated zones of anomalously large dissolved-solidsconcentrations exist throughout the study area. On the western side of the study area, these zones probably result from the upward movement of deeper Wasatch Formation water due to stratigraphic pinch-out and fractures. In the southeastern part o:: the study area, these anomalous concentrations probably result from upward movement of water along buried faults and, in some instances, lateral movement along coarser channel deposits in the Wasatch Formation.
The majority of the samples with known water type from sites in the study area are a sodium carbonate water type. Analysis of water from site 1 (table 2), collected near Pinedale in 34N-109W-30, indicates the small dissolved-solids concentration at which recharge waters can be an alkaline sodium carbonate water type. This water had a dissolved-solids concentration of 151 mg/L and a pH of 9.25.
12
The primary recharge area adjacent to the Wyoming Range along the western boundary of the study area indicates another water type. At site 8, a calcium magnesium bicarbonate water type occurs that has a dissolved-solids concentra tion of 215 mg/L. About 20 mi south, three more samples of this water type were collected in 28N-114W; these three samples have dissolved-solids concen trations of 244, 287, and 431 mg/L, and occur west of a Mesozoic-Paleozoic thrust remnant (fig. 2). The water type then changes to sodium carbonate in the direction of the potentiometric gradient within rather short distances into the study area.
A different water type exists in the southeastern corner of the study area where sulfate is the major anion. The one sample of near-recharge water available is a sodium bicarbonate sulfate water type with a dissolved-solids concentration of 284 mg/L in 30N-106W-12. About 8 mi to the northwest, in 31N-107W-23, a calcium sulfate water type exists with an anomalously large dissolved-solids concentration of 900 mg/L. This sample was collected very near the concealed thrust fault (fig. 2) along which the Wind River Range was uplifted; the sample probably represents deeper water that has moved upward along this fault into the near-surface Wasatch Formation. Two sodium sulfate water types with dissolved-solids concentrations of 838 and 1,780 mg/L occur in 29N-107W.
Simulation of Geochemical Reactions
Mass-balance reaction modeling is a technique described by Plummer and Back (1980) and Plummer and others (1983), which attempts to quantify hydro- geochemical processes that occur along a hydrogeologic flow path. The tech nique requires at least two water analyses along the flow path. Dissolution and exsolution of gas phases, dissolution and precipitation of solid phases, mixing of water types, oxidation-reduction reactions, and isotopic-exchange reactions all can be simulated. Phases and processes involved are provided by the analyst and are based on geologic, hydrologic, isotopic, and thermodynamic information. Simulation of geochemical reactions was done for six different flow-path segments in the study area.
Methods
Geochemical reactions were simulated by using the Fortran computer pro gram BALANCE (Parkhurst and others, 1982). This program takes the differences between analytical values for elements between two samples that are presumed to occur along a flow path and calculates the quantities of chosen reactive phases dissolving into or precipitating from the aqueous phase. The program is capable of solving redox reactions by using the change in the redox states between the beginning and ending solutions. The product of BALANCE is a balanced reaction of the form:
Initial Solution + Reactant Phases -> Final Solution + Product Phases. (1)
To assist in the selection of most feasible phases, analytical composi tions for the beginning and ending solutions were processed by the chemical- speciation model, SOLMINEQ (Kharaka and Barnes, 1973), to obtain total C02
13
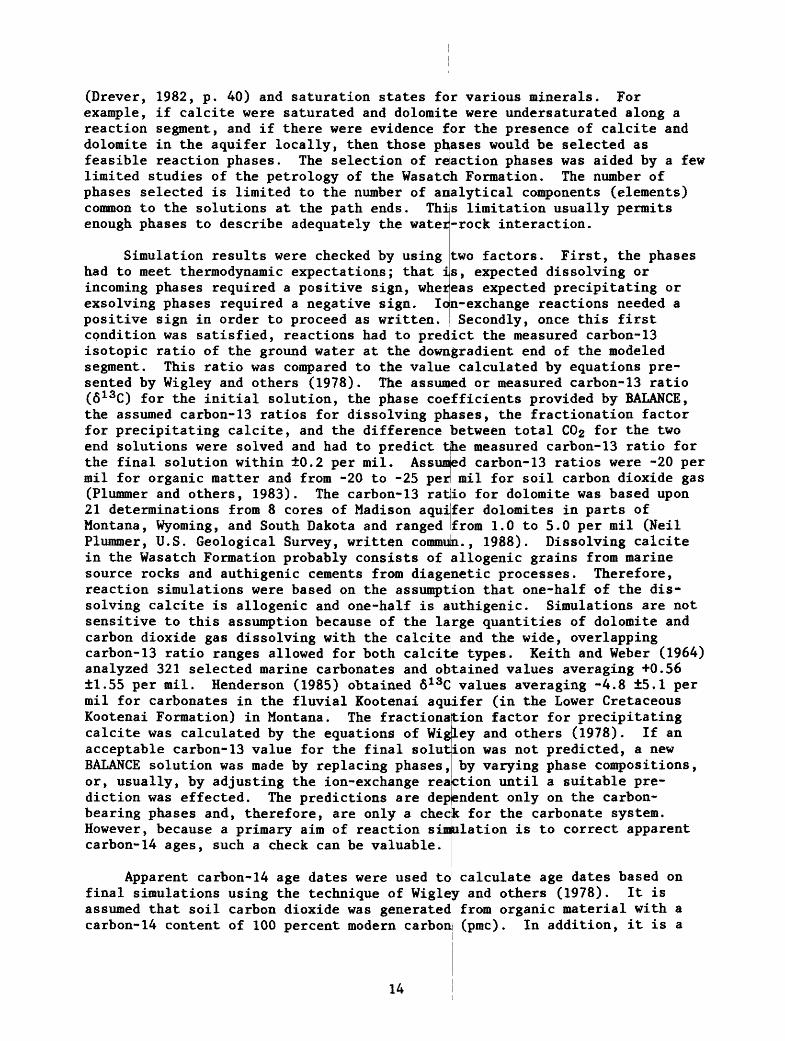
(Drever, 1982, p. 40) and saturation states for various minerals. For example, if calcite were saturated and dolomite were undersaturated along a reaction segment, and if there were evidence f|or the presence of calcite and dolomite in the aquifer locally, then those pbases would be selected as feasible reaction phases. The selection of reaction phases was aided by a few limited studies of the petrology of the Wasatch Formation. The number of phases selected is limited to the number of analytical components (elements) common to the solutions at the path ends. This limitation usually permits
-rock interaction.enough phases to describe adequately the water
Simulation results were checked by using two factors. First, the phases had to meet thermodynamic expectations; that is, expected dissolving or incoming phases required a positive sign, whereas expected precipitating or exsolving phases required a negative sign. Ion-exchange reactions needed a positive sign in order to proceed as written. Secondly, once this first condition was satisfied, reactions had to predict the measured carbon-13 isotopic ratio of the ground water at the downgradient end of the modeled segment. This ratio was compared to the value calculated by equations pre sented by Wigley and others (1978). The assumed or measured carbon-13 ratio (6 13C) for the initial solution, the phase coefficients provided by BALANCE, the assumed carbon-13 ratios for dissolving pbases, the fractionation factor for precipitating calcite, and the difference between total C02 for the two end solutions were solved and had to predict t|he measured carbon-13 ratio for the final solution within ±0.2 per mil. Assumed carbon-13 ratios were -20 per mil for organic matter and from -20 to -25 peri mil for soil carbon dioxide gas (Plummer and others, 1983). The carbon-13 ratlio for dolomite was based upon 21 determinations from 8 cores of Madison aquifer dolomites in parts of Montana, Wyoming, and South Dakota and ranged from 1.0 to 5.0 per mil (Neil Plummer, U.S. Geological Survey, written commuin., 1988). Dissolving calcite in the Wasatch Formation probably consists of allogenic grains from marine source rocks and authigenic cements from diagenetic processes. Therefore, reaction simulations were based on the assumption that one-half of the dis solving calcite is allogenic and one-half is authigenic. Simulations are not sensitive to this assumption because of the large quantities of dolomite and carbon dioxide gas dissolving with the calcite and the wide, overlapping carbon-13 ratio ranges allowed for both calcit|e types. Keith and Weber (1964) analyzed 321 selected marine carbonates and obtained values averaging +0.56 ±1.55 per mil. Henderson (1985) obtained 613C values averaging -4.8 ±5.1 per mil for carbonates in the fluvial Kootenai aquifer (in the Lower Cretaceous Kootenai Formation) in Montana. The fractionation factor for precipitating calcite was calculated by the equations of Wigley and others (1978). If an acceptable carbon-13 value for the final solution was not predicted, a new BALANCE solution was made by replacing phases, by varying phase compositions, or, usually, by adjusting the ion-exchange reaction until a suitable pre diction was effected. The predictions are dependent only on the carbon- bearing phases and, therefore, are only a check for the carbonate system. However, because a primary aim of reaction simulation is to correct apparent carbon-14 ages, such a check can be valuable.
Apparent carbon-14 age dates were used to calculate age dates based on final simulations using the technique of Wigley and others (1978). It is assumed that soil carbon dioxide was generated from organic material with a carbon-14 content of 100 percent modern carbon (pmc). In addition, it is a
14

common assumption (Freeze and Cherry, 1979, p. 290) that quantities of car bonates equivalent to reacting soil carbon dioxide also contain 100 pmc by isotopic equilibration during these reactions:
C02 (soil) N C02 (aqueous); (2) ^
CaC03 (calcite ) + H20 + C02 (aqueous) ^ Ca** + 2HCOi; and (3)\
CaMg(C03 ) 2 (dolomite) + 2H20 + 2C02 (aqueous) N (4)x_
Ca++ + Mg++ + 4HCOi.
Additional carbonates that dissolved downgradient from the soil zone should contain no appreciable carbon-14 (0 pmc). Once carbon-14 inputs were charac terized, carbon-14 ages were calculated by:
Age (yr) = 19,035 log [A^/A] , (5)
where A, . = pmc of solution for no decay, and
= observed pmc of solution.
Calculated ages were used to estimate average ground-water-velocity and hydraulic -conductivity values .
One must be cautious when interpreting the results of reaction simula tions. Although care has been taken to choose the most feasible phases and to calibrate the model according to isotope data, a unique solution cannot be proven. Phase coefficients, especially those for silicates, are not to be taken very quantitatively, although in some instances, overall thermodynamic requirements restrict their values to limited ranges. In addition, isotopic calibration of carbon phases enables considerable flexibility with assump tions that, in turn, precludes exact fixation of phase coefficients. Another consideration with reaction simulations is that, in real-world ground-water systems, the sampling of two solutions positioned exactly on a flow path is unusual. Usually, the solutions are somewhat offset, or the downgradient solution contains water that flowed from positions lateral to the presumed flow path, or both. The simulations presented incorporate the assumption that these effects are not significant. Despite all of these considerations, reaction simulations taken semi quantitatively can aid greatly in the geo- chemical characterization of ground-water processes.
Results
Six mass-balance simulations were produced for the various flow paths. Results for each of these simulations are presented here. In two separate instances, results for carbon reactions for adjacent flow-path segments were summed in order to calculate carbon-14 ages of the ground water at the downgradient ends of the adjacent segments.
15
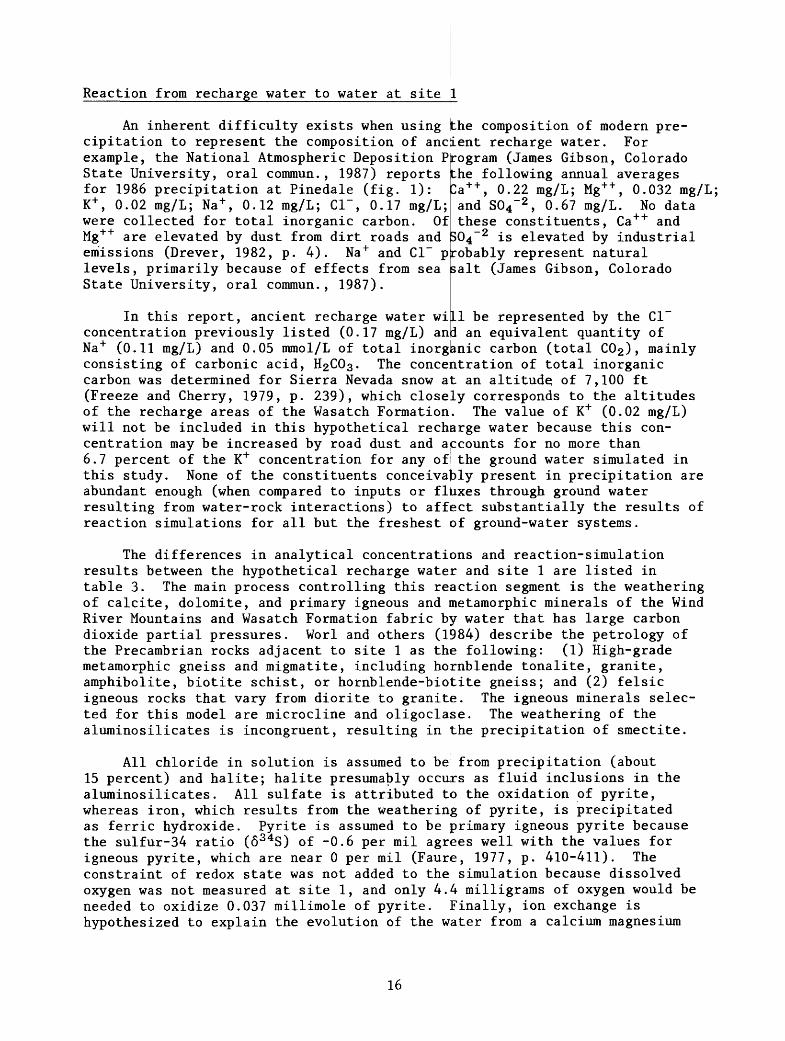
Reaction from recharge water to water at site 1
An inherent difficulty exists when using the composition of modern pre cipitation to represent the composition of ancient recharge water. For example, the National Atmospheric Deposition Program (James Gibson, ColoradoState University, oral commun., 1987) reports for 1986 precipitation at Pinedale (fig. 1): K+ , 0.02 mg/L; Na + , 0.12 mg/L; Cl~, 0.17 mg/L; were collected for total inorganic carbon. Of Mg++ are elevated by dust from dirt roads and
the following annual averages ++ , 0.22 mg/L; Mg++ , 0.032 mg/L;
emissions (Drever, 1982, p. 4). Na + and Cl~ probably represent naturallevels, primarily because of effects from sea State University, oral commun., 1987).
and S04 z , 0.67 mg/L. No data these constituents, Ca ++ and
is elevated by industrial
salt (James Gibson, Colorado
In this report, ancient recharge water wiLl be represented by the Cl~ concentration previously listed (0.17 mg/L) and an equivalent quantity of Na + (0.11 mg/L) and 0.05 mmol/L of total inorganic carbon (total C02 ), mainly consisting of carbonic acid, I^COa. The concentration of total inorganic carbon was determined for Sierra Nevada snow at an altitude of 7,100 ft (Freeze and Cherry, 1979, p. 239), which closely corresponds to the altitudes of the recharge areas of the Wasatch Formation. The value of K+ (0.02 mg/L) will not be included in this hypothetical recharge water because this con centration may be increased by road dust and accounts for no more than 6.7 percent of the K+ concentration for any of the ground water simulated in this study. None of the constituents conceivably present in precipitation are abundant enough (when compared to inputs or fluxes through ground water resulting from water-rock interactions) to affect substantially the results of reaction simulations for all but the freshest of ground-water systems.
The differences in analytical concentrations and reaction-simulation results between the hypothetical recharge water and site 1 are listed in table 3. The main process controlling this reaction segment is the weathering of calcite, dolomite, and primary igneous and metamorphic minerals of the Wind River Mountains and Wasatch Formation fabric by water that has large carbon dioxide partial pressures. Worl and others (1984) describe the petrology of the Precambrian rocks adjacent to site 1 as the following: (1) High-grade metamorphic gneiss and migmatite, including hornblende tonalite, granite, amphibolite, biotite schist, or hornblende-biotite gneiss; and (2) felsic igneous rocks that vary from diorite to granite. The igneous minerals selec ted for this model are microcline and oligoclase. The weathering of the aluminosilicates is incongruent, resulting in [the precipitation of smectite.
All chloride in solution is assumed to be from precipitation (about 15 percent) and halite; halite presumably occurs as fluid inclusions in the aluminosilicates. All sulfate is attributed to the oxidation of pyrite, whereas iron, which results from the weathering of pyrite, is precipitated as ferric hydroxide. Pyrite is assumed to be primary igneous pyrite because the sulfur-34 ratio (634S) of -0.6 per mil agrees well with the values for igneous pyrite, which are near 0 per mil (Faure, 1977, p. 410-411). The constraint of redox state was not added to the simulation because dissolved oxygen was not measured at site 1, and only 4.4 milligrams of oxygen would be needed to oxidize 0.037 millimole of pyrite. Finally, ion exchange is hypothesized to explain the evolution of the water from a calcium magnesium
16
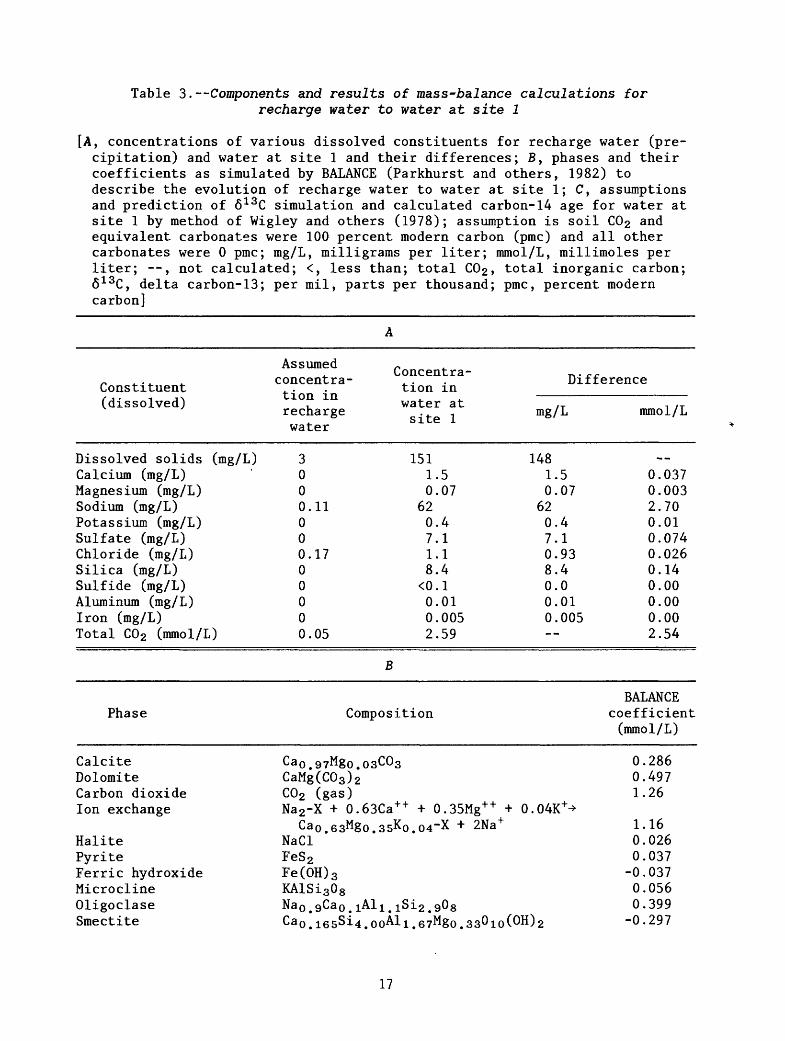
Table 3.--Components and results of mass-balance calculations for recharge water to water at site 1
[A, concentrations of various dissolved constituents for recharge water (pre cipitation) and water at site 1 and their differences; B, phases and their coefficients as simulated by BALANCE (Parkhurst and others, 1982) to describe the evolution of recharge water to water at site 1; C, assumptions and prediction of 6 13C simulation and calculated carbon-14 age for water at site 1 by method of Wigley and others (1978); assumption is soil C02 and equivalent carbonates were 100 percent modern carbon (pmc) and all other carbonates were 0 pmc; mg/L, milligrams per liter; mmol/L, millimoles per liter; --, not calculated; <, less than; total C02, total inorganic carbon; 6 13C, delta carbon-13; per mil, parts per thousand; pmc, percent modern carbon]
Constituent(dissolved)
Dissolved solids (mg/L)Calcium (mg/L)Magnesium (mg/L)Sodium (mg/L)Potassium (mg/L)Sulfate (mg/L)Chloride (mg/L)Silica (mg/L)Sulfide (mg/L)Aluminum (mg/L)Iron (mg/L)Total C02 (mmol/L)
A c oiim^Hrto o UlilCU.
concentra tion inrechargewater
3000.11000.1700000.05
Concentra tion inwater at site 1
1511.50.07
620.47.11.18.4
<0.10.010.0052.59
Difference
mg/L
1481.50.07
620.47.10.938.40.00.010.005--
mmol/L
--0.0370.0032.700.010.0740.0260.140.000.000.002.54
B
Phase
CalciteDolomiteCarbon dioxideIon exchange
HalitePyriteFerric hydroxideMicroclineOligoclaseSmectite
Composition
Cao.97M8o.03C03CaMg(C03 ) 2C02 (gas)Na2 -X + 0.63Ca++ + 0.35Mg++ + 0.04K++
Ca 0 .63M8o.35Ko.04-x + 2Na+NaClFeS 2Fe(OH) 3KAlSi30 8Nao.gCao. lAli . i.Si 2 ̂ gOsCa 0 lesSia ooAli 6?Mgo 33Oio(OH) 2
BALANCEcoefficient(mmol/L)
0.2860.4971.26
1.160.0260.037-0.0370.0560.399-0.297
17
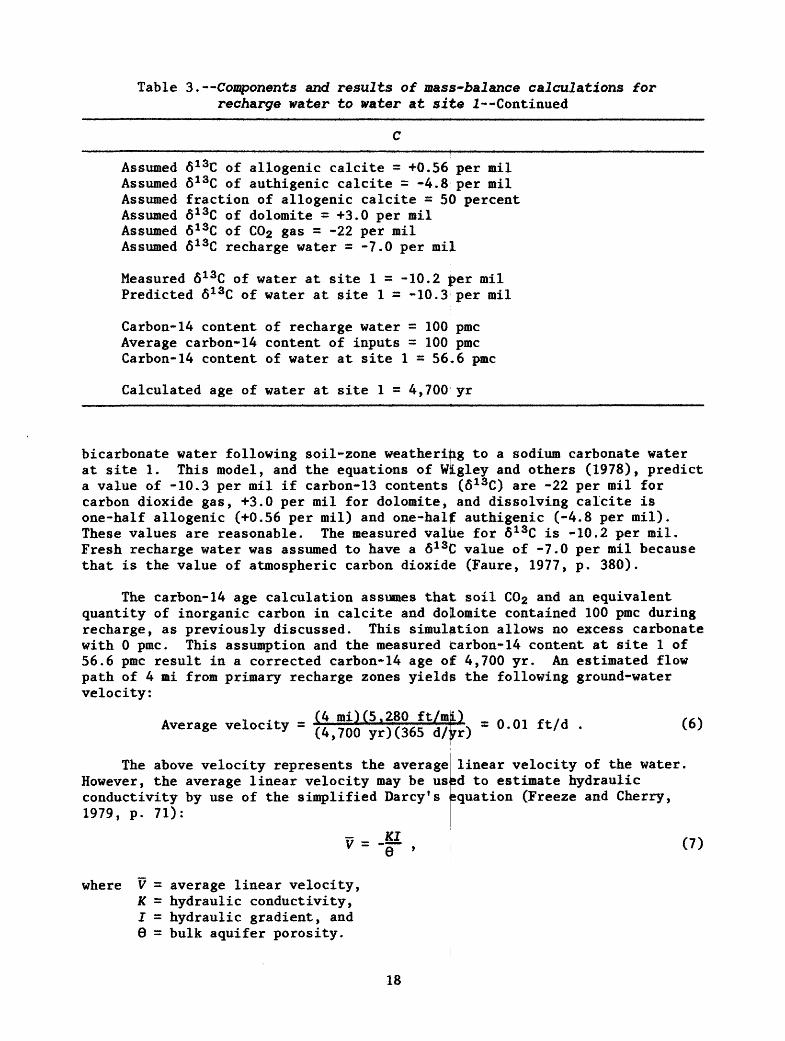
Table 3. Components and results of mass-balance calculations for recharge water to water at site 1 Continued
Assumed 6 13C of allogenic calcite = +0.56 Assumed 6 13C of authigenic calcite = -4.8 Assumed fraction of allogenic calcite = 5 Assumed 613C of dolomite = +3.0 per mil Assumed 6 13C of COz Bas = "22 per mil Assumed 6 13C recharge water = -7.0 per mi
Measured 6 13C of water at site 1 = -10.2 Predicted 613C of water at site 1 = -10.3
per mil per mil
0 percent
I
per mil per mil
Carbon-14 content of recharge water = 100 pmc Average carbon-14 content of inputs = 100 pmc Carbon-14 content of water at site 1 = 56.6 pmc
Calculated age of water at site 1 = 4,700 yr
bicarbonate water following soil-zone weathering to a sodium carbonate water at site 1. This model, and the equations of Wigley and others (1978), predict a value of -10.3 per mil if carbon-13 contents (6 13C) are -22 per mil for carbon dioxide gas, +3.0 per mil for dolomite, and dissolving calcite is one-half allogenic (+0.56 per mil) and one-half authigenic (-4.8 per mil). These values are reasonable. The measured value for 613C is -10.2 per mil. Fresh recharge water was assumed to have a 613C value of -7.0 per mil because that is the value of atmospheric carbon dioxide (Faure, 1977, p. 380).
The carbon-14 age calculation assumes that soil C02 and an equivalent quantity of inorganic carbon in calcite and dolomite contained 100 pmc during recharge, as previously discussed. This simulation allows no excess carbonate with 0 pmc. This assumption and the measured carbon-14 content at site 1 of 56.6 pmc result in a corrected carbon-14 age of 4,700 yr. An estimated flow path of 4 mi from primary recharge zones yields the following ground-water velocity:
A i -,- (4 mi) (5.280 ft/ml) n n . .... Average velocity = ^ >70^yr)(365 ^ =0.01 ft/d . (6)
The above velocity represents the average However, the average linear velocity may be use conductivity by use of the simplified Darcy's 1979, p. 71):
e
linear velocity of the water sd to estimate hydraulic equation (Freeze and Cherry,
(7)
where V = average linear velocity, K = hydraulic conductivity, J = hydraulic gradient, and 6 = bulk aquifer porosity.
18
An estimated hydraulic gradient of -0.012 and an assumed bulk porosity of 0.20 renders:
v - Z§ - 0.01 ft/d (0.20) _ .* - -r -" =0^12 - °- 2 ft/d
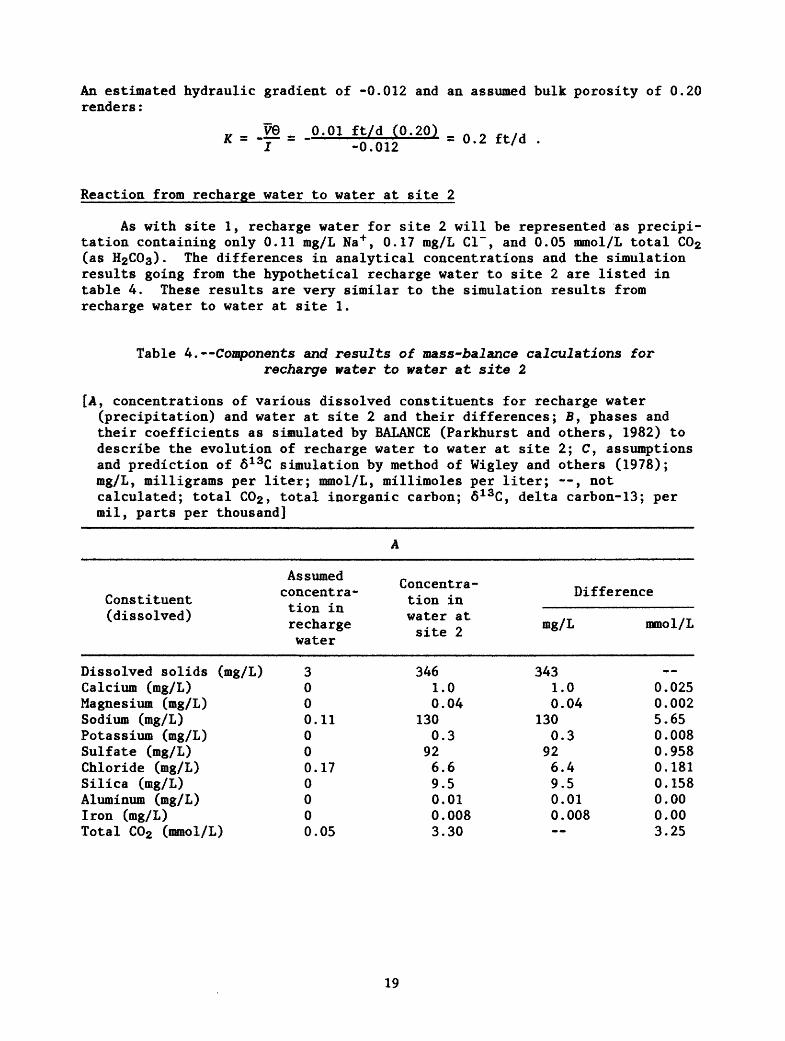
Reaction from recharge water to water at site 2
As with site 1, recharge water for site 2 will be represented as precipi tation containing only 0.11 mg/L Na+ , 0.17 mg/L Cl~, and 0.05 mmol/L total C02 (as I^COa) . The differences in analytical concentrations and the simulation results going from the hypothetical recharge water to site 2 are listed in table 4. These results are very similar to the simulation results from recharge water to water at site 1.
Table 4. Components and results of mass-balance calculations for recharge water to water at site 2
[A y concentrations of various dissolved constituents for recharge water (precipitation) and water at site 2 and their differences; B, phases and their coefficients as simulated by BALANCE (Parkhurst and others, 1982) to describe the evolution of recharge water to water at site 2; C, assumptions and prediction of 6 13C simulation by method of Wigley and others (1978); mg/L, milligrams per liter; mmol/L, millimoles per liter; , not calculated; total C0£, total inorganic carbon; 613C, delta carbon- 13; per mil, parts per thousand]
Constituent(dissolved)
Dissolved solids (mg/L)Calcium (mg/L)Magnesium (mg/L)Sodium (mg/L)Potassium (mg/L)Sulfate (mg/L)Chloride (mg/L)Silica (mg/L)Aluminum (mg/L)Iron (mg/L)Total C02 (mmol/L)
concentration in rechargewater
3000.11000.170000.05
Concentra tion inwater at site 2
3461.00.04
1300.3
926.69.50.010.0083.30
Difference
mg/L
3431.00.04
1300.3
926.49.50.010.008
mmol/L
0.0250.0025.650.0080.9580.1810.1580.000.003.25
19
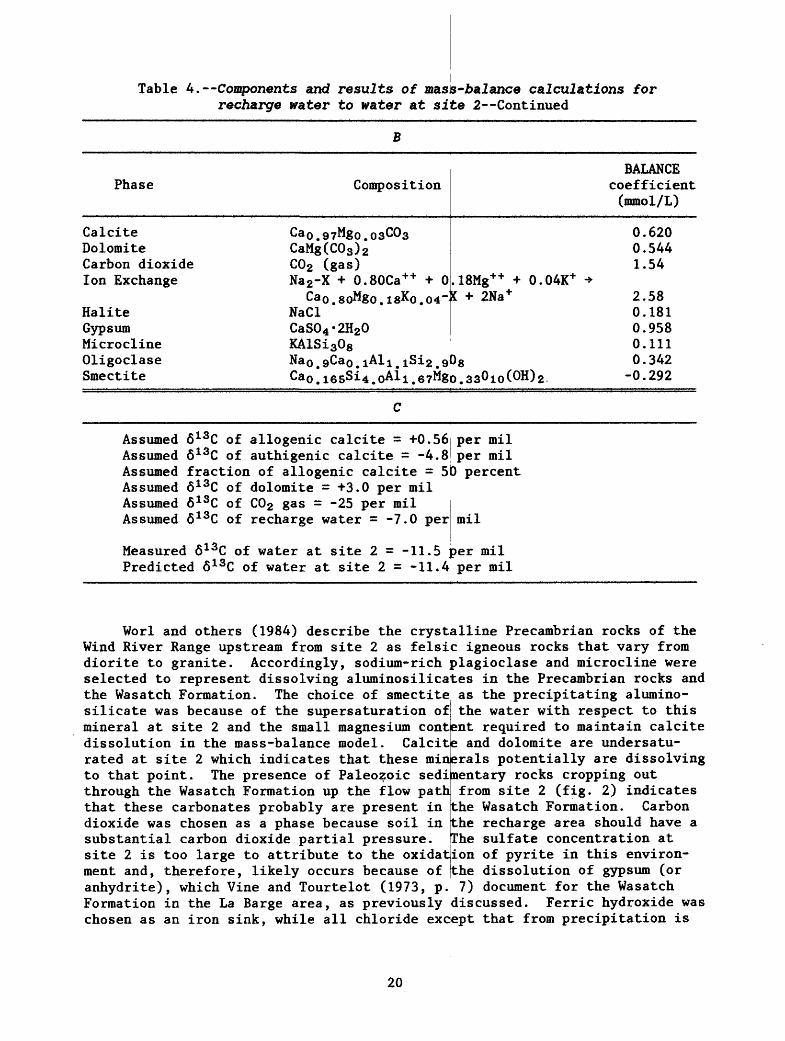
Table 4. Components and results of mass-balance calculations for recharge water to water at site 2--Continued
B
Phase
Calcite Dolomite Carbon dioxide Ion Exchange
Halite Gypsum Microcline Oligoclase Smectite
Composition
Ca0 .97Mgo.o3C03 CaMg(C03 ) 2 C02 (gas) Na2 -X + 0.80Ca++ + 0
Ca0 . soMgo . is^o .04'- NaCl CaS04 -2H20 KAlSi308 Na0 .gCao. lAli . iSi 2 .9 Cao . i6sSi4.oAli.67Mg
BALANCE coefficient (mmol/L)
0.620 0.544 1.54
.18Mg++ + 0.04K+ -> K + 2Na+ 2.58
0.181 0.958 0.111
0 8 0.342 o.330io(OH) 2 -0.292
Assumed 613C of allogenic calcite = +0.56 per mil Assumed 6 13C of authigenic calcite = -4.8 per mil Assumed fraction of allogenic calcite = 50 percent Assumed 6 13C of dolomite = +3.0 per mil Assumed 6 13C of C02 gas = -25 per mil Assumed 6 13C of recharge water = -7.0 per mil
Measured 613C of water at site 2 = -11.5 per mil Predicted 6 13C of water at site 2 = -11.4 per mil
Worl and others (1984) describe the crystalline Precambrian rocks of the Wind River Range upstream from site 2 as felsic igneous rocks that vary from diorite to granite. Accordingly, sodium-rich plagioclase and microcline were selected to represent dissolving aluminosilicates in the Precambrian rocks and the Wasatch Formation. The choice of smectite as the precipitating alumino-silicate was because of the supersaturation ofmineral at site 2 and the small magnesium content required to maintain calcite dissolution in the mass-balance model. Calcite and dolomite are undersatu- rated at site 2 which indicates that these minerals potentially are dissolving to that point. The presence of Paleozoic sedimentary rocks cropping outthrough the Wasatch Formation up the flow path that these carbonates probably are present in dioxide was chosen as a phase because soil in
the water with respect to this
from site 2 (fig. 2) indicates the Wasatch Formation. Carbon the recharge area should have a The sulfate concentration atsubstantial carbon dioxide partial pressure,
site 2 is too large to attribute to the oxidation of pyrite in this environ ment and, therefore, likely occurs because of [the dissolution of gypsum (or anhydrite), which Vine and Tourtelot (1973, p. 7) document for the Wasatch Formation in the La Barge area, as previously discussed. Ferric hydroxide was chosen as an iron sink, while all chloride exqept that from precipitation is
20
attributed to halite dissolution. Finally, ion exchange of calcium, magnesium, and potassium for sodium was included to explain the dominance of the sodium cation in ground water at site 2. The proportions of the exchanged cations were adjusted to achieve the right thermodynamic direction for the aluminosilicate phases and to obtain a good 613C prediction.
Using the assumptions in table 4 (part C), the simulation predicts a 6 13C for water at site 2 of -11.4 per mil. The measured value is -11.5 per mil. Therefore, the model is calibrated thermodynamically and isotopically. The carbon-14 activity of the ground water at site 2 was not analyzed. The results of this reaction segment will be combined with the results of the next segment to calculate an age.
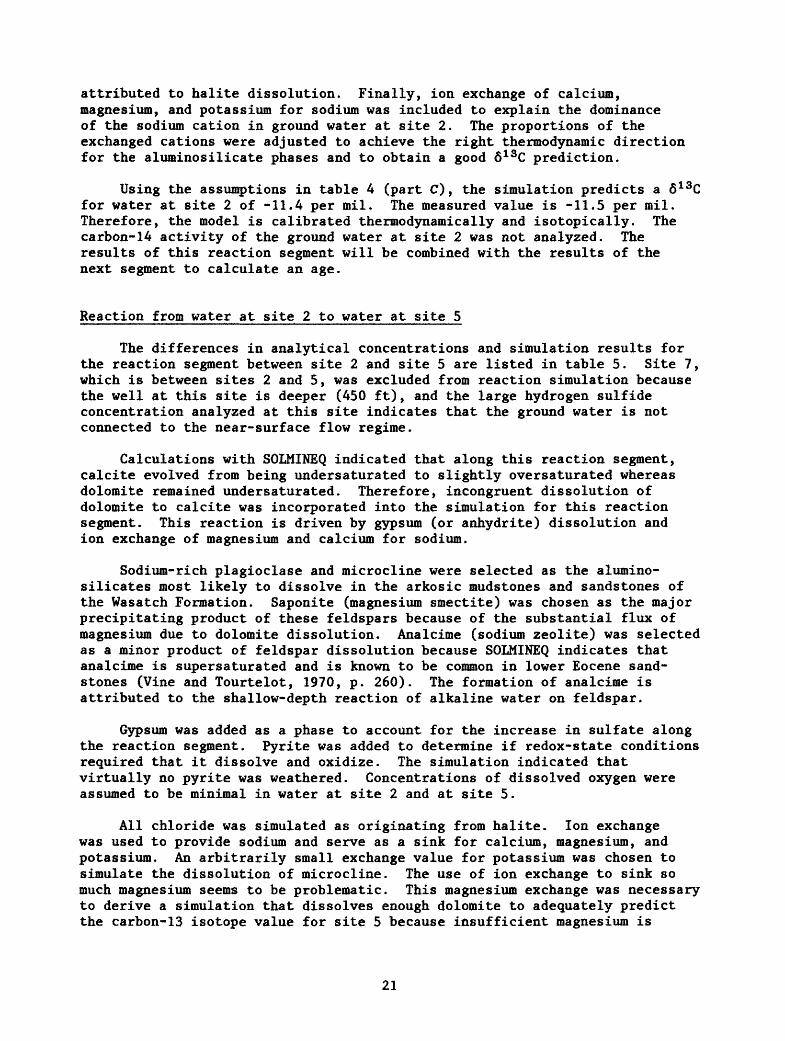
Reaction from water at site 2 to water at site 5
The differences in analytical concentrations and simulation results for the reaction segment between site 2 and site 5 are listed in table 5. Site 7, which is between sites 2 and 5, was excluded from reaction simulation because the well at this site is deeper (450 ft), and the large hydrogen sulfide concentration analyzed at this site indicates that the ground water is not connected to the near-surface flow regime.
Calculations with SOLMINEQ indicated that along this reaction segment, calcite evolved from being undersaturated to slightly oversaturated whereas dolomite remained undersaturated. Therefore, incongruent dissolution of dolomite to calcite was incorporated into the simulation for this reaction segment. This reaction is driven by gypsum (or anhydrite) dissolution and ion exchange of magnesium and calcium for sodium.
Sodium-rich plagioclase and microcline were selected as the alumino- silicates most likely to dissolve in the arkosic mudstones and sandstones of the Wasatch Formation. Saponite (magnesium smectite) was chosen as the major precipitating product of these feldspars because of the substantial flux of magnesium due to dolomite dissolution. Analcime (sodium zeolite) was selected as a minor product of feldspar dissolution because SOLMINEQ indicates that analcime is supersaturated and is known to be common in lower Eocene sand stones (Vine and Tourtelot, 1970, p. 260). The formation of analcime is attributed to the shallow-depth reaction of alkaline water on feldspar.
Gypsum was added as a phase to account for the increase in sulfate along the reaction segment. Pyrite was added to determine if redox-state conditions required that it dissolve and oxidize. The simulation indicated that virtually no pyrite was weathered. Concentrations of dissolved oxygen were assumed to be minimal in water at site 2 and at site 5.
All chloride was simulated as originating from halite. Ion exchange was used to provide sodium and serve as a sink for calcium, magnesium, and potassium. An arbitrarily small exchange value for potassium was chosen to simulate the dissolution of microcline. The use of ion exchange to sink so much magnesium seems to be problematic. This magnesium exchange was necessary to derive a simulation that dissolves enough dolomite to adequately predict the carbon-13 isotope value for site 5 because insufficient magnesium is
21
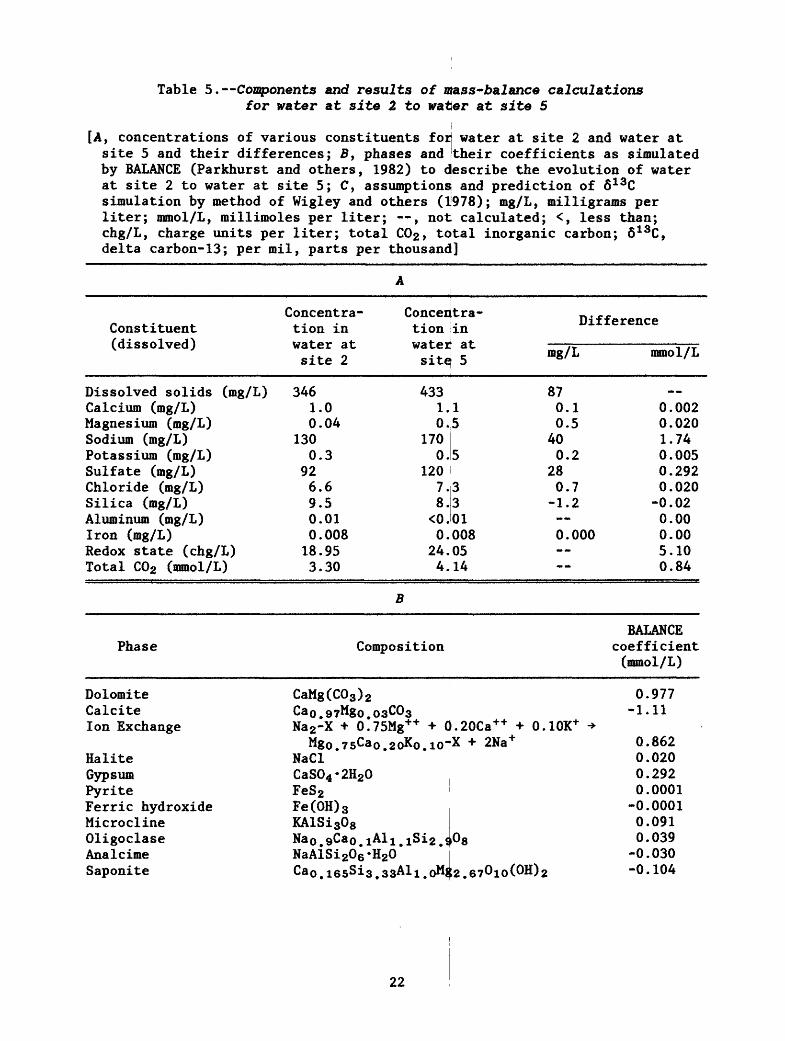
Table 5. Components and results of mass-balance calculations for water at site 2 to water at site 5
i[A, concentrations of various constituents for water at site 2 and water at site 5 and their differences; B, phases and their coefficients as simulated by BALANCE (Parkhurst and others, 1982) to describe the evolution of water at site 2 to water at site 5; C, assumptions and prediction of 6 13C simulation by method of Wigley and others (1978); mg/L, milligrams per liter; ramol/L, millimoles per liter; , not calculated; <, less than; chg/L, charge units per liter; total C(>2, total inorganic carbon; 6 13C, delta carbon-13; per mil, parts per thousand]
A
Constituent(dissolved)
Dissolved solids (mg/L)Calcium (mg/L)Magnesium (mg/L)Sodium (mg/L)Potassium (mg/L)Sulfate (mg/L)Chloride (mg/L)Silica (mg/L)Aluminum (mg/L)Iron (mg/L)Redox state (chg/L)Total C02 (mmol/L)
Concentra tion inwater at site 2
3461.00.04
1300.3
926.69.50.010.00818.953.30
Concen tra- . ,. ,. Difference tion inWet L-CX. « L- if
site 5 mg/L
433 871.1 0.10,5 0.5
170 400.5 0.2
120 287.3 0.78.3 -1.2<0.010.008 0.000
24.054.14
mmol/L
..0.0020.0201.740.0050.2920.020-0.020.000.005.100.84
B
Phase
DolomiteCalciteIon Exchange
HaliteGypsumPyriteFerric hydroxideMicroclineOligoclaseAnalcimeSaponite
Composition
CaMg(C03 ) 2Cao 9?Mgo 03^0Na2:X + 0.*75Mg
Mgo.7sCao.20NaClCaS04 *2H20FeS2Fe(OH) 3KAlSi308Na0 9Ca0 iAli.NaAiSi206-H20*Cao.iesSis.ssA
3++ + 0.20Ca++ + 0.10K+ »KO.IO-X » 2Na+
!Si2.c»08
li.oMj;2.67°io(OH) 2
BALANCEcoefficient(mmol/L)
0.977-1.11
0.8620.0200.2920.0001-0.00010.0910.039-0.030-0.104
22
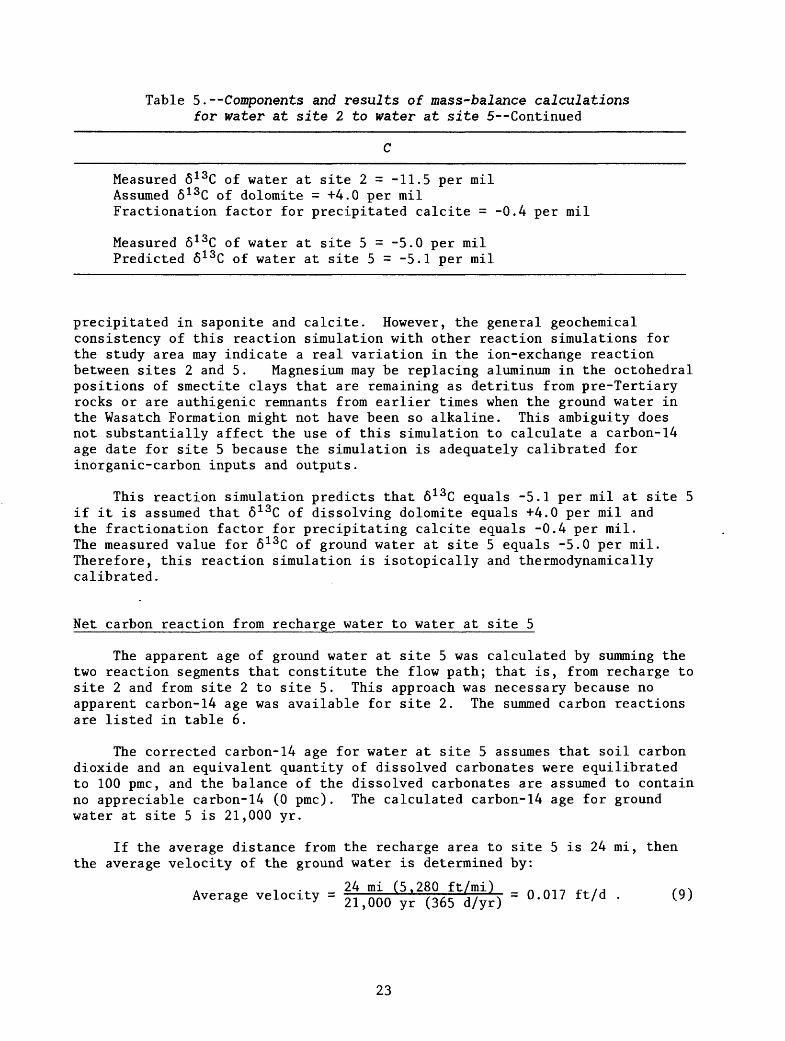
Table 5. Components and results of mass-balance calculations for water at site 2 to water at site 5--Continued
Measured 6 13C of water at site 2 = -11.5 per milAssumed 6 13C of dolomite = +4.0 per milFractionation factor for precipitated calcite = -0.4 per mil
Measured 6 13C of water at site 5 = -5.0 per mil Predicted 6 13C of water at site 5 = -5.1 per mil
precipitated in saponite and calcite. However, the general geochemical consistency of this reaction simulation with other reaction simulations for the study area may indicate a real variation in the ion-exchange reaction between sites 2 and 5. Magnesium may be replacing aluminum in the octohedral positions of smectite clays that are remaining as detritus from pre-Tertiary rocks or are authigenic remnants from earlier times when the ground water in the Wasatch Formation might not have been so alkaline. This ambiguity does not substantially affect the use of this simulation to calculate a carbon-14 age date for site 5 because the simulation is adequately calibrated for inorganic-carbon inputs and outputs.
This reaction simulation predicts that 6 13C equals -5.1 per mil at site 5 if it is assumed that 6 13C of dissolving dolomite equals +4.0 per mil and the fractionation factor for precipitating calcite equals -0.4 per mil. The measured value for 6 13 C of ground water at site 5 equals -5.0 per mil. Therefore, this reaction simulation is isotopically and thermodynamically calibrated.
Net carbon reaction from recharge water to water at site 5
The apparent age of ground water at site 5 was calculated by summing the two reaction segments that constitute the flow path; that is, from recharge to site 2 and from site 2 to site 5. This approach was necessary because no apparent carbon-14 age was available for site 2. The summed carbon reactions are listed in table 6.
The corrected carbon-14 age for water at site 5 assumes that soil carbon dioxide and an equivalent quantity of dissolved carbonates were equilibrated to 100 pmc, and the balance of the dissolved carbonates are assumed to contain no appreciable carbon-14 (0 pmc). The calculated carbon-14 age for ground water at site 5 is 21,000 yr.
If the average distance from the recharge area to site 5 is 24 mi, then the average velocity of the ground water is determined by:
A i -4- 24 mi (5,280 ft/mi) A ni _ _. ., , 0 >. Average velocity = 21)000 yr (365 d/yr) = 0 '° 17 ft/d ' (9)
23
Table 6. Summed carbon reactions from recharge water to water at site 5 and calculated age of water at site 5
[A, sum of carbon-phase coefficients as Simula others, 1982) to describe the evolution of to water at site 2 and from water at site 2 (before decay) carbon-14 content and calcula assumption is soil C02 and equivalent carbon (pmc) and all other carbonates were 0 liter; pmc, percent modern carbon]
ed by BALANCE (Parkhurst and recharge water (precipitation) l:o water at site 5; B, original ed age for water at site 5;
were 100 percent modern pmc; mmol/L, millimole per
carbonates
Calcite dissolved = 0.620 mmol/LCalcite precipitated =1.11 mmol/LDolomite dissolved = 1.52 mmol/LCarbon dioxide dissolved = 1.54 mmol/LTotal carbon dissolved from carbonates =3.66 mmol/L
B
Carbon-14 content of recharge water = 100 pmc Average carbon-14 content of inputs =59.2 pmc Carbon-14 content of water at site 5 = 4.B pmc
Calculated age of water at site 5 = 21,000 yr
This value agrees well with the average ground-water velocity calculated upgradient of site 1 (0.01 f t/d) . As with site 1, the average hydraulic conductivity upgradient of site 5 may be calculated from equation 7, esti mating the hydraulic gradient to be -0.012 and! assuming the bulk porosity of the aquifer to be 0.20:
K = - = 0.3 ft/d (10)
Reaction from water at site 5 to water at site
The reaction segment from site 5 to site 6 represents the final phase ofhydrogeochemical development modeled in the study area. The differences in analytical concentrations and simulation results for this segment are listed in table 7.
The most noteworthy chemical change is the decrease in sulfate concen tration along the reaction segment. This decrease was simulated as sulfate reduction by microorganisms oxidizing organic matter and by pyrite precipi tation maintaining undetectable levels of hydrogen sulfide (iron being supplied by ferric hydroxide). The overall reaction is:
15/4 CH20 + 2 SOS + Fe(OH) 3 + 1/4 H+ «-» FeS2 + 15/4 HCOi + 7/2 H20 . (11)
24
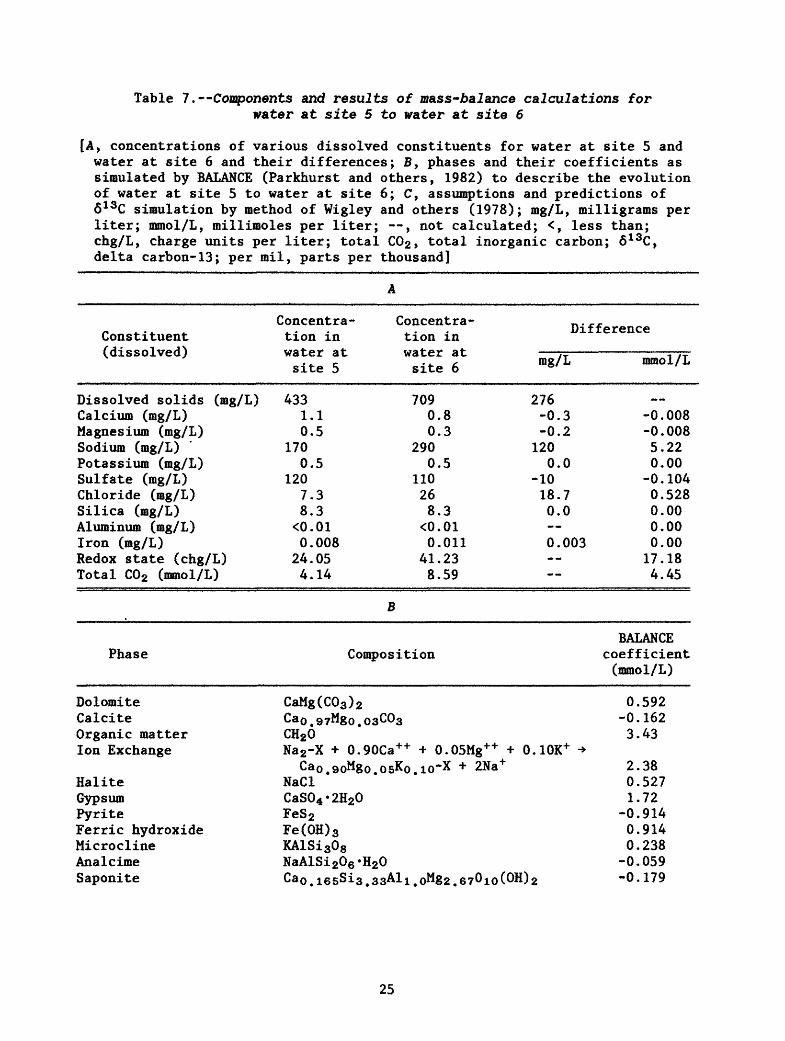
Table 7. Components and results of mass-balance calculations for water at site 5 to water at site 6
[A, concentrations of various dissolved constituents for water at site 5 and water at site 6 and their differences; B, phases and their coefficients as simulated by BALANCE (Parkhurst and others, 1982) to describe the evolution of water at site 5 to water at site 6; C, assumptions and predictions of 6 13C simulation by method of Wigley and others (1978); mg/L, milligrams per liter; mmol/L, millimoles per liter; , not calculated; <, less than; chg/L, charge units per liter; total C02, total inorganic carbon; 6 13C, delta carbon-13; per mil, parts per thousand]
A
Constituent(dissolved)
Dissolved solids (mg/L)Calcium (mg/L)Magnesium (mg/L)Sodium (mg/L)Potassium (mg/L)Sulfate (mg/L)Chloride (mg/L)Silica (mg/L)Aluminum (mg/L)Iron (mg/L)Redox state (chg/L)Total C02 (mmol/L)
Concentra- Concentra tion in tion inwater at water at site 5 site 6
4331.10.5
1700.5
1207.38.3<0.010.008
24.054.14
7090.80.3
2900.5
110268.3
<0.010.01141.238.59
Difference
mg/L
276-0.3-0.2
1200.0
-1018.70.0 0.003 --
mmol/L
»-0.008-0.0085.220.00-0.1040.5280.000.000.0017.184.45
B
Phase
DolomiteCalciteOrganic matterIon Exchange
HaliteGypsumPyriteFerric hydroxideMicroclineAnalcimeSaponite
Composition
CaMg(C03 ) 2Ca0 4 97Mgo.03C°3CH26Na2-X + 0.90Ca++
Cao.aoMgo.osKoNadCaS04 «2H20FeS2Fe(OH) 3KAlSi308NaAlSi 206 «H20Cao.iesSis.ssAli
+ 0.05Mg++ H. io*"X + 2Na*
.0M82.670io((
( 0.10K+ ->
)H) 2
BALANCEcoefficient(mmol/L)
0.592-0.1623.43
2.380.5271.72
-0.9140.9140.238
-0.059-0.179
25
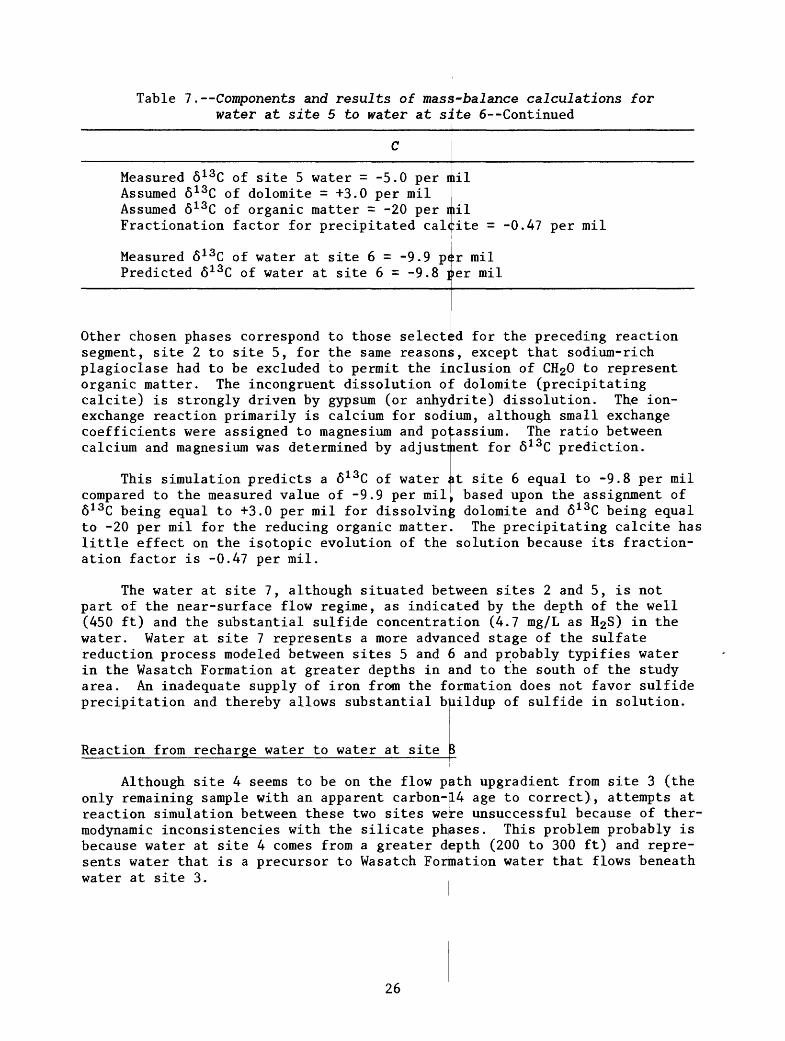
Table 7. Components and results of mass-Jbalance calculations for water at site 5 to water at site 6 Continued
milMeasured 6 13C of site 5 water = -5.0 perAssumed 6 13C of dolomite = +3.0 per milAssumed 6 13C of organic matter = -20 perFractionation factor for precipitated calcite = -0.47 per mil
mil
Measured 6 13C of water at site 6 = -9.9 pe;r mil Predicted 6 13C of water at site 6 = -9.8 per mil
Other chosen phases correspond to those selected for the preceding reaction segment, site 2 to site 5, for the same reasons, except that sodium-rich plagioclase had to be excluded to permit the inclusion of CI^O to represent organic matter. The incongruent dissolution of dolomite (precipitating calcite) is strongly driven by gypsum (or anhydrite) dissolution. The ion- exchange reaction primarily is calcium for sodium, although small exchange coefficients were assigned to magnesium and potassium. The ratio between calcium and magnesium was determined by adjustment for 6 13C prediction.
This simulation predicts a 6 13C of water at site 6 equal to -9.8 per mil compared to the measured value of -9.9 per mil^ based upon the assignment of 6 13C being equal to +3.0 per mil for dissolving dolomite and 6 13C being equal to -20 per mil for the reducing organic matter. The precipitating calcite has little effect on the isotopic evolution of the solution because its fraction- ation factor is -0.47 per mil.
The water at site 7, although situated between sites 2 and 5, is not part of the near-surface flow regime, as indicated by the depth of the well (450 ft) and the substantial sulfide concentration (4.7 mg/L as H2S) in the water. Water at site 7 represents a more advanced stage of the sulfate reduction process modeled between sites 5 and 6 and probably typifies water in the Wasatch Formation at greater depths in and to the south of the study area. An inadequate supply of iron from the formation does not favor sulfide precipitation and thereby allows substantial buildup of sulfide in solution.
Reaction from recharge water to water at site
Although site 4 seems to be on the flow path upgradient from site 3 (the only remaining sample with an apparent carbon-14 age to correct), attempts at reaction simulation between these two sites were unsuccessful because of ther- modynamic inconsistencies with the silicate phases. This problem probably is because water at site 4 comes from a greater depth (200 to 300 ft) and repre sents water that is a precursor to Wasatch Formation water that flows beneath water at site 3.
26
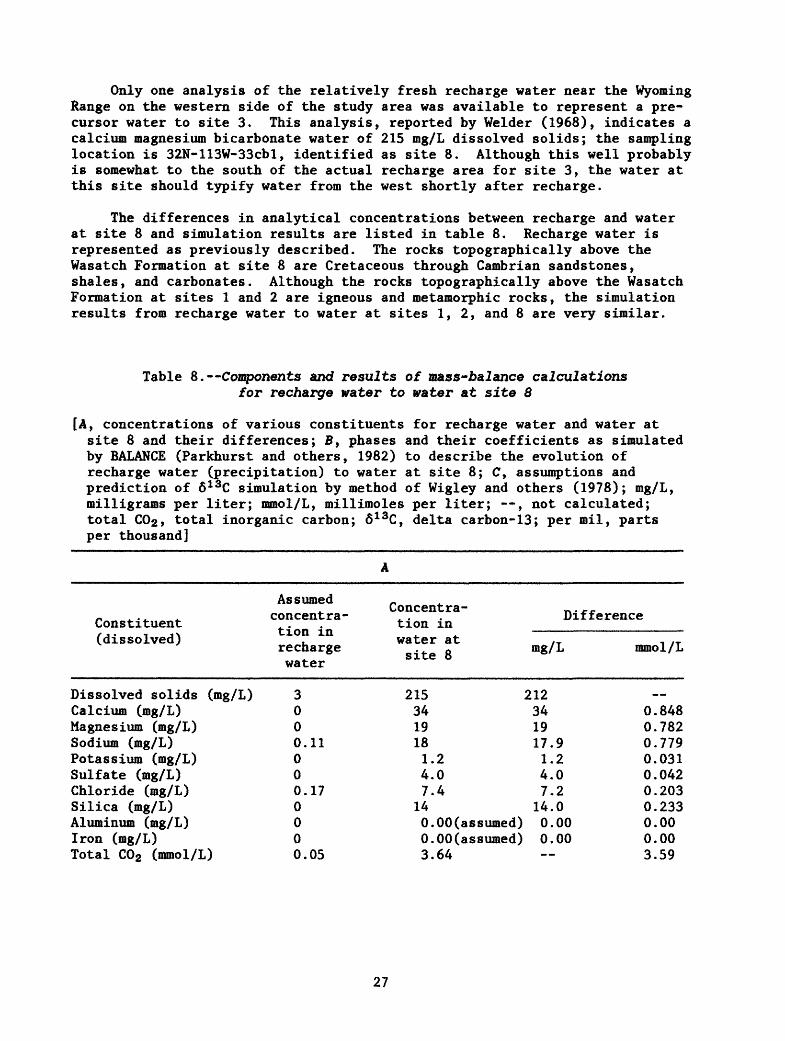
Only one analysis of the relatively fresh recharge water near the Wyoming Range on the western side of the study area was available to represent a pre cursor water to site 3. This analysis, reported by Welder (1968), indicates a calcium magnesium bicarbonate water of 215 mg/L dissolved solids; the sampling location is 32N-113W-33cbl, identified as site 8. Although this well probably is somewhat to the south of the actual recharge area for site 3, the water at this site should typify water from the west shortly after recharge.
The differences in analytical concentrations between recharge and water at site 8 and simulation results are listed in table 8. Recharge water is represented as previously described. The rocks topographically above the Wasatch Formation at site 8 are Cretaceous through Cambrian sandstones, shales, and carbonates. Although the rocks topographically above the Wasatch Formation at sites 1 and 2 are igneous and metamorphic rocks, the simulation results from recharge water to water at sites 1, 2, and 8 are very similar.
Table 8. Components and results of mass-balance calculations for recharge water to water at site 8
[A t concentrations of various constituents for recharge water and water at site 8 and their differences; £, phases and their coefficients as simulated by BALANCE (Parkhurst and others, 1982) to describe the evolution of recharge water (precipitation) to water at site 8; C, assumptions and prediction of 613C simulation by method of Wigley and others (1978); mg/L, milligrams per liter; mmol/L, millimoles per liter; , not calculated; total C02, total inorganic carbon; 6 13C, delta carbon-13; per mil, parts per thousand]
Constituent(dissolved)
Dissolved solids (mg/L)Calcium (mg/L)Magnesium (mg/L)Sodium (mg/L)Potassium (mg/L)Sulfate (mg/L)Chloride (rag/L)Silica (mg/L)Aluminum (mg/L)Iron (mg/L)Total C02 (mmol/L)
Acciimo/lno o uuicu
concentra tion inrechargewater
3000.11000.170000.05
Concentra- ,> . r - Difference tion inwater at /T site 8 mg/L
215 21234 3419 1918 17.91.2 1.24.0 4.07.4 7.2
14 14.0O.OO(assumed) 0.000.00 (assumed) 0.003.64
mmol/L
0.8480.7820.7790.0310.0420.2030.2330.000.003.59
27
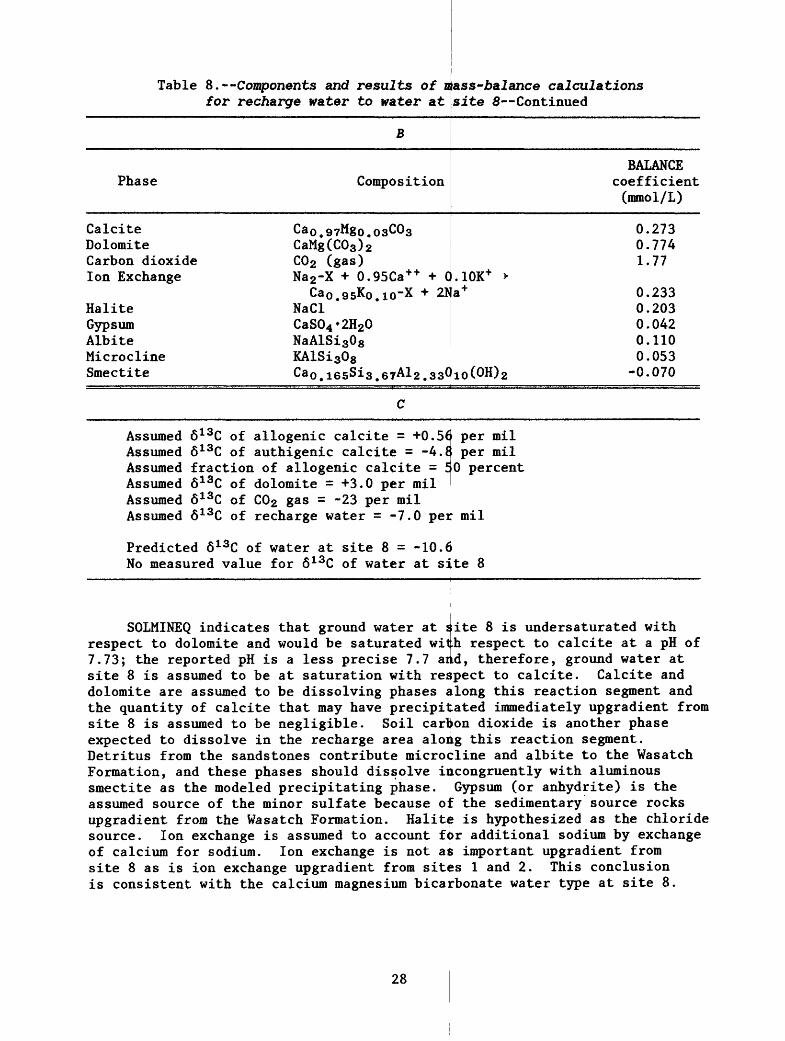
Table 8. Components and results of for recharge water to water at
nass-balance calculations site 8 Continued
B
Phase
Calcite Dolomite Carbon dioxide Ion Exchange
HaliteGypsum Albite Mi croc line Smectite
Composition
Cao » 97"80 . 03^03CaMg(C03 ) 2 C02 (gas) Na2 -X + 0.95Ca++ + 0
NaClCaS04 *2H20 NaAlSi308 KAlSi308^aO. 16sSi3 ,67A12 .33^
BALANCEcoefficient (mmol/L)
0.273 0.774 1.77
.10K+ > a+ 0.233
0.2030.042 0.110 0.053
io(OH) 2 -0.070
Assumed 613C of allogenic calcite = +0.56 per mil Assumed 6 13C of authigenic calcite = -4.£ per mil Assumed fraction of allogenic calcite = 50 percent Assumed 613C of dolomite = +3.0 per mil Assumed 6 13C of C02 gas = -23 per mil Assumed 613C of recharge water = -7.0 per mil
Predicted 6 13C of water at site 8 = -10.6No measured value for 6 13C of water at site 8
SOLMINEQ indicates that ground water at siite 8 is undersaturated with respect to dolomite and would be saturated with respect to calcite at a pH of 7.73; the reported pH is a less precise 7.7 and, therefore, ground water at site 8 is assumed to be at saturation with respect to calcite. Calcite and dolomite are assumed to be dissolving phases along this reaction segment and the quantity of calcite that may have precipitated immediately upgradient from site 8 is assumed to be negligible. Soil carbon dioxide is another phase expected to dissolve in the recharge area along this reaction segment. Detritus from the sandstones contribute microcline and albite to the Wasatch Formation, and these phases should dissolve incongruently with aluminous smectite as the modeled precipitating phase. Gypsum (or anhydrite) is the assumed source of the minor sulfate because oJ: the sedimentary source rocks upgradient from the Wasatch Formation. Halit<; is hypothesized as the chloride source. Ion exchange is assumed to account for additional sodium by exchange of calcium for sodium. Ion exchange is not an important upgradient from site 8 as is ion exchange upgradient from sites 1 and 2. This conclusion is consistent with the calcium magnesium bicarbonate water type at site 8.
28
Site 8 has no 6 13C value available to check the model. However, the results of this simulation and the assumptions in table 8 (part C) predict a 613C of -10.6 per mil for ground water at site 8. This value will be used to predict 613C at the end of the following reaction segment (site 8 to site 3).
Reaction from water at site 8 to water at site 3
The differences in analytical concentrations between water ajt site 8 and at site 3 and the simulation results for this reaction segment are listed in table 9. These results are essentially the same results simulated between sites 2 and 5. Ground water is undersaturated with respect to dolomite and is assumed to be calcite saturated at both ends of the reaction segment. These saturation states indicate incongruent dissolution of dolomite. Other phases were chosen to correspond with those of the preceding reaction segment, except that soil carbon dioxide was eliminated,-analcime was substituted for albite because of supersaturation at site 3, and the clay product was changed from smectite to saponite in order to sink magnesium from solution. Also, calibration of the model to effect a good 6 13C prediction required that some magnesium exchange for sodium, although calcium remains the major exchanger. The silicate system was modeled as incongruent dissolution of microcline and oligoclase with precipitation of analcime and saponite. Chloride concen trations slightly decreased along this reaction segment. Because chloride is considered to be conservative, no feasible mechanism exists for removing chloride from the aqueous system. Therefore, chloride was simulated as remaining steady in concentration along the reaction segment. This apparent decrease in concentration probably is because of the previously mentioned supposition that site 8 is not directly up the flow path from site 3. None theless, the consistency of the results for this reaction segment and the results of other reaction segments supports the assumption that water at site 8 adequately represents water upgradient from site 3.
Net carbon reaction from recharge water to water at site 3
The net reaction for the carbon phases from recharge to site 3 is summar ized in table 10. The net reaction in table 10 gives a calculated carbon-14 age of 12,700 yr. The assumptions duplicate those for site 1 and site 5 age calculations. If an average distance of 22 mi is assumed to the recharge area, then the average velocity would be:
Average velocity = "j^yr^efd/yr) = 0 ' 025 ft/d '
Assuming a bulk aquifer porosity of 0.20 and estimating a hydraulic gradient of -0.0063, the calculated hydraulic conductivity from equation 7 is
v - 0.025 (0.20) _ A ft ,. K ~ " -0.0063 " °' 8 ft/d '
29
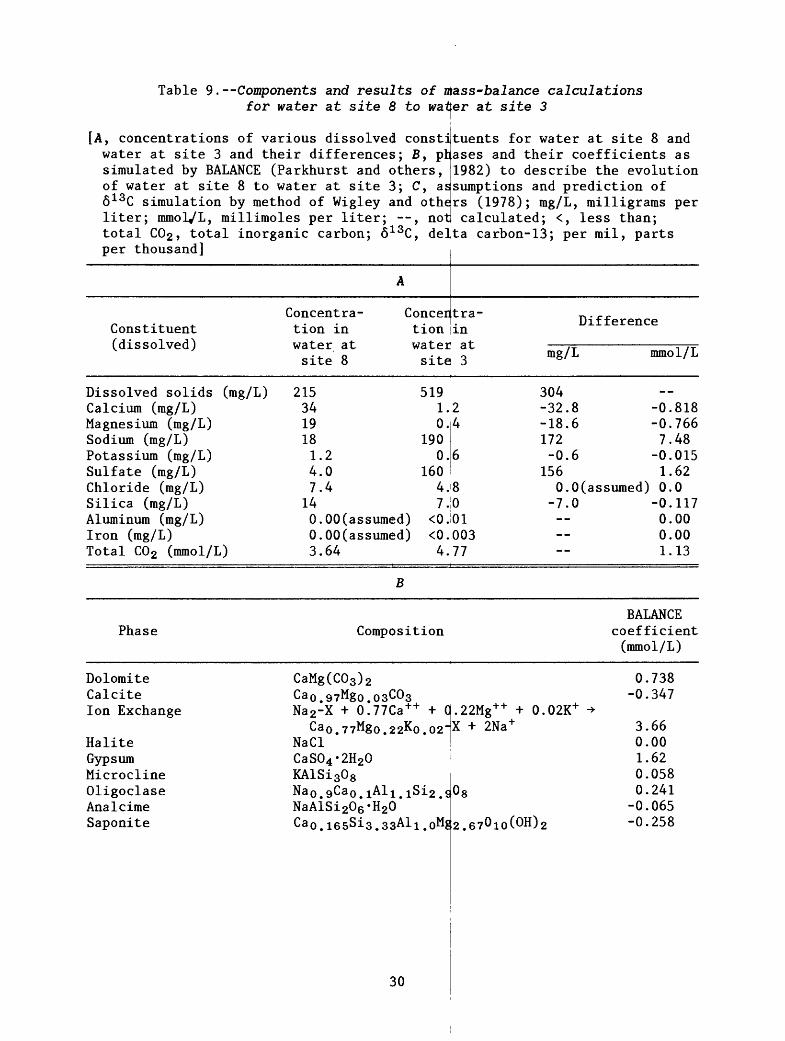
Table 9. Components and results of mass-balance calculations for water at site 8 to water at site 3
[A, concentrations of various dissolved constituents for water at site 8 and water at site 3 and their differences; B, ph.ases and their coefficients assimulated by BALANCE (Parkhurst and others, of water at site 8 to water at site 3; C, as6 13C simulation by method of Wigley and others (1978); mg/L, milligrams perliter; mmoVL, millimoles per liter; --, not
1982) to describe the evolution sumptions and prediction of
calculated; <, less than;total C02 , total inorganic carbon; 6 13C, delta carbon-13; per mil, parts per thousand]
A
Constituent(dissolved)
Dissolved solids (mg/L)Calcium (mg/L)Magnesium (mg/L)Sodium (mg/L)Potassium (mg/L)Sulfate (mg/L)Chloride (mg/L)Silica (mg/L)Aluminum (mg/L)Iron (mg/L)Total C02 (mmol/L)
Concentra- Concer tion in tionwater at water site 8 site
tra- -n-fj: Difference inI nl-a L. i-r3 mg/L
215 519 30434 1.2 -32.819 0.18 1901.2 0.4.0 1607.4 4.
14 7.O.OO(assumed) <0.
4 -18.6172
6 -0.6156
mmol/L
-0.818-0.7667.48
-0.0151.62
8 O.O(assumed) 0.00 -7.001
O.OO(assumed) <0.0033.64 4.77
-0.1170.000.001.13
B
Phase
DolomiteCalciteIon Exchange
HaliteGypsumMicroclineOligoclaseAnalcimeSaponite
Composition
CaMg(C03 ) 2Ca0.97M80.03C03Na 2 -X + 0.77Ca++ + C
Ca0.77M8o.22K0.02"NaCl
.22Mg++ + 0.02K+ *X + 2Na+
CaS04 -2H20KAlSi 308Nao gCao i&li iSi 2 cNaAisi 2Oe*H20*Ca0.165Si3.33Ali.OM£
0 8
2 ,67^1o(OH) 2
BALANCEcoefficient(mmol/L)
0.738-0.347
3.660.001.620.0580.241
-0.065-0.258
30
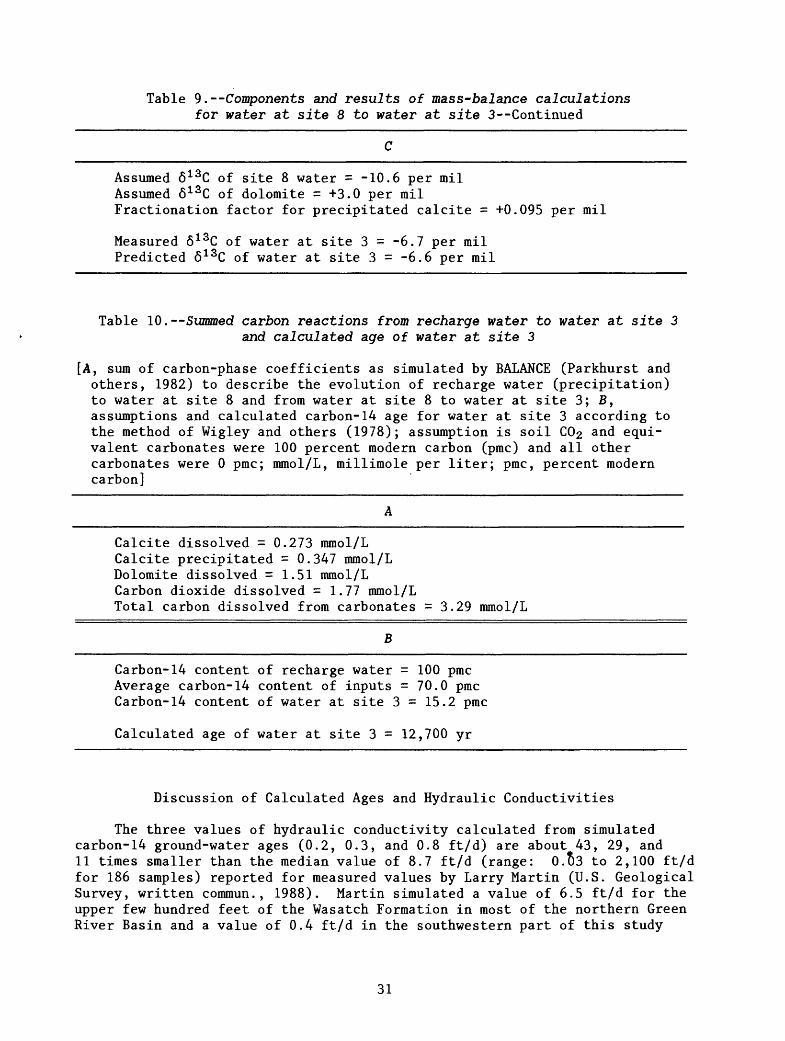
Table 9. Components and results of mass-balance calculations for water at site 8 to water at site 3 Continued
Assumed 6 13C of site 8 water = -10.6 per milAssumed 6 13C of dolomite = +3.0 per milFractionation factor for precipitated calcite = +0.095 per mil
Measured 6 13C of water at site 3 = -6.7 per mil Predicted 6 13C of water at site 3 = -6.6 per mil
Table 10. Summed carbon reactions from recharge water to water at site 3 and calculated age of water at site 3
[A, sum of carbon-phase coefficients as simulated by BALANCE (Parkhurst and others, 1982) to describe the evolution of recharge water (precipitation) to water at site 8 and from water at site 8 to water at site 3; B, assumptions and calculated carbon-14 age for water at site 3 according to the method of Wigley and others (1978); assumption is soil C02 and equi valent carbonates were 100 percent modern carbon (pmc) and all other carbonates were 0 pmc; mmol/L, millimole per liter; pmc, percent modern carbon]
Calcite dissolved = 0.273 mmol/LCalcite precipitated = 0.347 mmol/LDolomite dissolved = 1.51 mmol/LCarbon dioxide dissolved = 1.77 mmol/LTotal carbon dissolved from carbonates =3.29 mmol/L
B
Carbon-14 content of recharge water = 100 pmc Average carbon-14 content of inputs =70.0 pmc Carbon-14 content of water at site 3 = 15.2 pmc
Calculated age of water at site 3 = 12,700 yr
Discussion of Calculated Ages and Hydraulic Conductivities
The three values of hydraulic conductivity calculated from simulated carbon-14 ground-water ages (0.2, 0.3, and 0.8 ft/d) are about 43, 29, and 11 times smaller than the median value of 8.7 ft/d (range: O.t)3 to 2,100 ft/d for 186 samples) reported for measured values by Larry Martin (U.S. Geological Survey, written commun., 1988). Martin simulated a value of 6.5 ft/d for the upper few hundred feet of the Wasatch Formation in most of the northern Green River Basin and a value of 0.4 ft/d in the southwestern part of this study
31
area. Martin simulated a hydraulic conductivity part of the Wasatch Formation but concluded the upper few hundred feet of the Wasatch deeper layers of the Wasatch Formation, which the mountains. This hypothesis would favor hydraulic conductivity calculated from carbon- regional flow model. The possibility exists conductivity are biased towards larger values installed in aquifer horizons offering the evolution of ground-water chemistry is affectesd ring in horizons with a larger range of perme
of 0.9 ft/d for the deeper much of the ground water in
Formation moved up from slightly is recharged along the foot of
agreement between values of 14 ground-water ages and the
that measured values of hydraulic because wells tend to be
yields, whereas the by flow and processes occur-
bility.
The common assumption that an amount of c issolved carbonate equivalentto dissolved carbon dioxide equilibrated with
that
better
greiatest
modern inorganic carbon in thesoil horizon in the recharge zone may cause some of the differences between calculated and measured values of hydraulic conductivity. To test this possibility, each of the ground-water ages and resulting values of hydraulic conductivity were recomputed with the assumption that dissolved carbon dioxide consisted of 100 pmc and all dissolved carbonate consisted of 0 pmc. For site 5 water, recomputation decreased the age from 21,000 years to 15,000 years and increased the resulting upgridient hydraulic-conductivity value from 0.3 to 0.4 ft/d. For site 3 water,, recomputation decreased the age from 12,700 years to 7,040 years and increased the resulting upgradient hydraulic-conductivity value from 0.8 to 1.4 ft/d. In both of these instan ces, age and hydraulic-conductivity calculations are not very sensitive to the assumption of carbon-14 content of dissolving carbonates near recharge zones. This fact indicates that the differences between calculated and measured values of hydraulic conductivity cannot largely be attributed to uncertainties in carbon-14 age calculations. However, for site 1 water, recomputation decreased the age from 4,700 years to an impossible -930 years, indicating a severe sensitivity to the assumption of carboii-14 inputs. The reason for this sensitivity is that, unlike the two previous instances, the reaction model for site 1 water allows no carbonate dissolution in excess of the equivalent amount of dissolved carbon dioxide because of the smaller distance from the recharge zone. This example indicates that some (perhaps all) dissolved carbonate probably does equilibrate to 100 pmc in the soil horizon. Because there exists no feasible method to estimate tlie fraction of equilibrating dissolved carbonate, this problem will be lef: for future studies and the initial calculations for ground-water ages and values of hydraulic conductivity will be accepted in this report.
Stable Isotope Trends
Sulfur-34, oxygen-18, and deuterium i sites 1-7 (except sulfur-34 for site 4) were hydrogeochemical information and to compare simulations. Oxygen-18 and deuterium isotope
sotopes in samples collected at analyzed to provide additional the results of reaction are interpreted jointly.
32
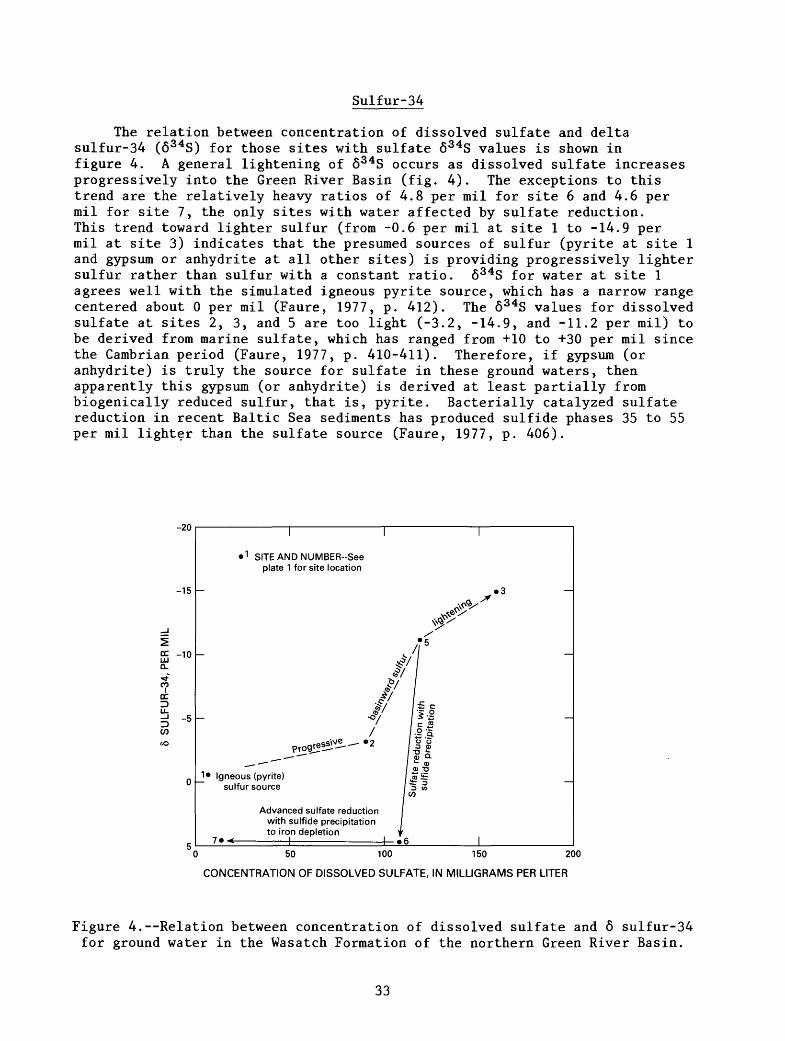
Sulfur-34
The relation between concentration of dissolved sulfate and delta sulfur-34 (634S) for those sites with sulfate 634S values is shown in figure 4. A general lightening of 634S occurs as dissolved sulfate increases progressively into the Green River Basin (fig. 4). The exceptions to this trend are the relatively heavy ratios of 4.8 per mil for site 6 and 4.6 per mil for site 7, the only sites with water affected by sulfate reduction. This trend toward lighter sulfur (from -0.6 per mil at site 1 to -14.9 per mil at site 3) indicates that the presumed sources of sulfur (pyrite at site 1 and gypsum or anhydrite at all other sites) is providing progressively lighter sulfur rather than sulfur with a constant ratio. 634S for water at site 1 agrees well with the simulated igneous pyrite source, which has a narrow range centered about 0 per mil (Faure, 1977, p. 412). The 634S values for dissolved sulfate at sites 2, 3, and 5 are too light (-3.2, -14.9, and -11.2 per mil) to be derived from marine sulfate, which has ranged from +10 to +30 per mil since the Cambrian period (Faure, 1977, p. 410-411). Therefore, if gypsum (or anhydrite) is truly the source for sulfate in these ground waters, then apparently this gypsum (or anhydrite) is derived at least partially from biogenically reduced sulfur, that is, pyrite. Bacterially catalyzed sulfate reduction in recent Baltic Sea sediments has produced sulfide phases 35 to 55 per mil lighter than the sulfate source (Faure, 1977, p. 406).
cc.LLJ Q_
I
C/3
-20
-15
-10
-5
SITE AND NUMBER-See plate 1 for site location
_] Igneous (pyrite) sulfur source
Advanced sulfate reduction with sulfide precipitation to iron depletion
50 100 150 200
CONCENTRATION OF DISSOLVED SULFATE, IN MILLIGRAMS PER LITER
Figure 4.--Relation between concentration of dissolved sulfate and 6 sulfur-34 for ground water in the Wasatch Formation of the northern Green River Basin.
33
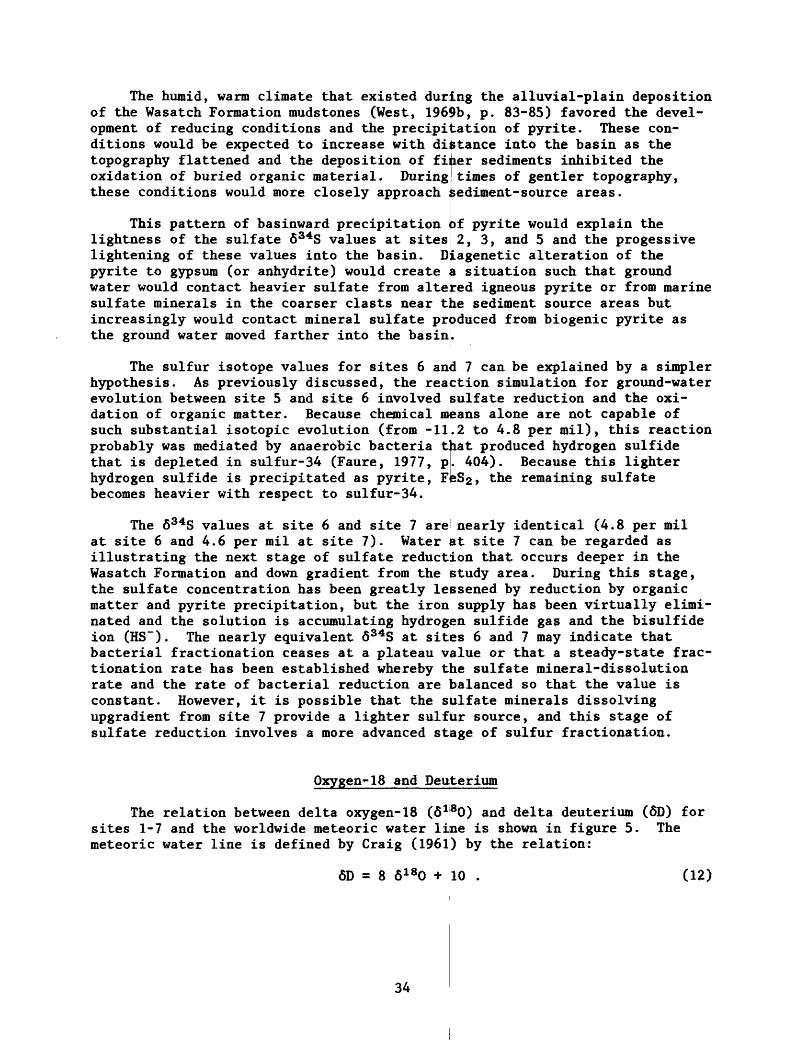
The humid, warm climate that existed during the alluvial-plain deposition of the Wasatch Formation mudstones (West, 1969b, p. 83-85) favored the devel opment of reducing conditions and the precipitation of pyrite. These con ditions would be expected to increase with distance into the basin as the topography flattened and the deposition of finer sediments inhibited theoxidation of buried organic material. Duringthese conditions would more closely approach isediment-source areas.
This pattern of basinward precipitation lightness of the sulfate 634S values at sites lightening of these values into the basin, pyrite to gypsum (or anhydrite) would create water would contact heavier sulfate from sulfate minerals in the coarser clasts near increasingly would contact mineral sulfate the ground water moved farther into the basin
altered tlie
times of gentler topography,
f pyrite would explain the 2, 3, and 5 and the progessive
Diagenetic alteration of the situation such that ground
igneous pyrite or from marine sediment source areas but
from biogenic pyrite asproduced
The sulfur isotope values for sites 6 and 7 can be explained by a simpler hypothesis. As previously discussed, the reaction simulation for ground-water evolution between site 5 and site 6 involved sulfate reduction and the oxi dation of organic matter. Because chemical means alone are not capable of such substantial isotopic evolution (from -11.2 to 4.8 per mil), this reaction probably was mediated by anaerobic bacteria that produced hydrogen sulfide that is depleted in sulfur-34 (Faure, 1977, pi. 404). Because this lighter hydrogen sulfide is precipitated as pyrite, FeSa, the remaining sulfate becomes heavier with respect to sulfur-34.
The 634S values at site 6 and site 7 are nearly identical (4.8 per mil at site 6 and 4.6 per mil at site 7). Water at site 7 can be regarded as illustrating the next stage of sulfate reduction that occurs deeper in the Wasatch Formation and down gradient from the study area. During this stage, the sulfate concentration has been greatly lessened by reduction by organic matter and pyrite precipitation, but the iron supply has been virtually elimi nated and the solution is accumulating hydrogen sulfide gas and the bisulfide ion (HS~). The nearly equivalent 6S4S at sites 6 and 7 may indicate that bacterial fractionation ceases at a plateau value or that a steady-state frac- tionation rate has been established whereby the sulfate mineral-dissolution rate and the rate of bacterial reduction are balanced so that the value is constant. However, it is possible that the sulfate minerals dissolving upgradient from site 7 provide a lighter sulfur source, and this stage of sulfate reduction involves a more advanced stage of sulfur fractionation.
Oxygen-18 and Deuterium
The relation between delta oxygen-18 sites 1-7 and the worldwide meteoric water meteoric water line is defined by Craig (1961)
6D = 8 6180 +
(6180) and delta deuterium (6D) foris shown in figure 5. The
by the relation:line
10 . (12)
34
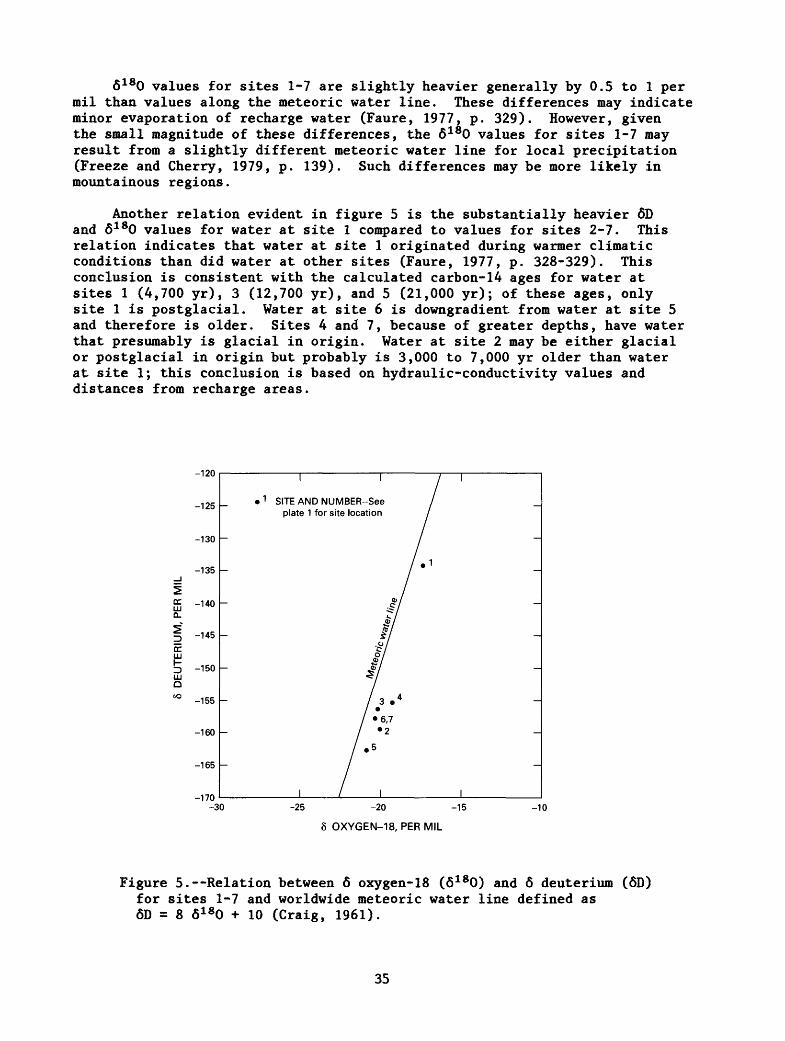
6180 values for sites 1-7 are slightly heavier generally by 0.5 to 1 per mil than values along the meteoric water line. These differences may indicate minor evaporation of recharge water (Faure, 1977, p. 329). However, given the small magnitude of these differences, the 6 180 values for sites 1-7 may result from a slightly different meteoric water line for local precipitation (Freeze and Cherry, 1979, p. 139). Such differences may be more likely in mountainous regions.
Another relation evident in figure 5 is the substantially heavier 6D and 6180 values for water at site 1 compared to values for sites 2-7. This relation indicates that water at site 1 originated during warmer climatic conditions than did water at other sites (Faure, 1977, p. 328-329). This conclusion is consistent with the calculated carbon-14 ages for water at sites 1 (4,700 yr), 3 (12,700 yr), and 5 (21,000 yr); of these ages, only site 1 is postglacial. Water at site 6 is downgradient from water at site 5 and therefore is older. Sites 4 and 7, because of greater depths, have water that presumably is glacial in origin. Water at site 2 may be either glacial or postglacial in origin but probably is 3,000 to 7,000 yr older than water at site 1; this conclusion is based on hydraulic-conductivity values and distances from recharge areas.
-120
-125
-130
-135
£ -140 0.
-145
-150
-155
-160
-165
-170 -30
1 SITE AND NUMBER--See plate 1 for site location
-25 -20 -15
8 OXYGEN-18, PER MIL
-10
Figure 5. Relation between 6 oxygen-18 (6 180) and 6 deuterium (6D) for sites 1-7 and worldwide meteoric water line defined as 6D = 8 6 180 + 10 (Craig, 1961).
35
SUMMARY AND CONCLUSIONS
In 1981, the U.S. Geological Survey began a study of ground water of theUpper Colorado River Basin as part of the Regional Aquifer-System Analysis (RASA) Program. The near-surface Wasatch Formation of the northern Green River Basin was selected for study because it] provides ground water for stock and domestic use in this area. This report provides general information about the hydrologic system and detailed information about the chemical quality of the water and its evolution in this system.
The near-surface Wasatch Formation of the northern Green River Basin consists of the mudstones, sandstones, and conglomerates of the La Barge and Chappo Members west of the Green River and th|e New Fork Tongue east of the Green River. The lithology of the aquifer and the presence of springs andflowing wells in the study area indicate that the sandstone aquifer probablyis separated into several artesian zones by impermeable layers of mudstone.
Generally, water in the near-surface Wasatch Formation in the northern Green River Basin flows southwestward from thie Wind River Range, eastward from the Wyoming Range, and southward from the area of the Green River headwaters. Water levels of the near-surface Wasatch Formation indicate drainage into the Green, New Fork, and East Fork Rivers but do not indicate drainage into the creeks west of the Green River, presumably because of less recharge.
Water in the near-surface Wasatch Formation is freshest in the recharge areas near the mountains and becomes saltier toward the central and southern parts of the study area. Ground water in the study area generally contains less than 500 mg/L dissolved solids, although concentrations of dissolved solids as large as 3,200 mg/L occur along the southern boundary. An extremely alkaline sodium carbonate water with small concentrations of dissolved solids generally develops within small distances of recharge zones in the northern Green River Basin. However, calcium magnesium bicarbonate water exists in the Wasatch Formation along the Wyoming Range, and sodium (and calcium) sulfate water of greater salinity is common in the southeastern corner of the study area.
Mass-balance reaction simulations were done by using the computer program BALANCE to calculate quantities of chosen reactive phases dissolving into or precipitating from the aqueous phase along six different flow-path segments. The chemical-speciation model SOLMINEQ was used to assist in the choice of phases and provide thermodynamic constraints on the results. 6 13C values for carbon phases were used to calibrate the results of the simulations. Carbon-14 ages were calculated for three ground-water samples, and the ages were used to estimate hydraulic-conductivity values.
Water at site 1 near the Wind River Rang^ in the northern part of the study area is the freshest water (151 mg/L diissolved-solids concentration) that was simulated. This water represents Wasatch Formation water that is affected by the weathering of primary igneous! and metamorphic minerals in the Wind River Range and in the Wasatch Formation and the dissolution of calcite and dolomite by water containing substantial Isoil carbon dioxide. Oligoclase and traces of microcline dissolve incongruentpLy and precipitate smectite. Pyrite is oxidized to provide sulfate. Most chloride is assumed to derive
36
from salts in fluid inclusions; however, atmospheric precipitation is a likely source for about 15 percent of the chloride. Ion exchange of calcium and magnesium for sodium is another dominant reaction believed to cause the large sodium concentrations of water in the Wasatch Formation. A calculated carbon-14 age of 4,700 yr resulted in an estimate of 0.2 ft/d for the hydrau lic conductivity upgradient from site 1.
Chemical processes simulated from recharge water to water at site 2 (near the Wind River Range and about 17 mi southeast of site 1) are very similar to those from recharge water to water at site 1. The main difference is that gypsum (or anhydrite) becomes the source of sulfate.
The next major change in the geochemical processes that affects the evolution of ground water in the Wasatch Formation as it moves farther into the basin is the incongruent dissolution of dolomite in an environment closed to carbon dioxide. This process is simulated to occur from site 2 to site 5 in the south-central part of the basin. Calcite precipitation maintains dolomite dissolution and is driven by dissolution of gypsum (or anhydrite) and ion exchange of magnesium and calcium for sodium. Incongruent dissolution of feldspars continue, but analcime (sodium zeolite) becomes a minor product, while saponite (magnesium smectite) becomes the clay product.
Reactions for carbon-bearing phases between recharge water and water at site 2 and water at site 5 were summed to calculate a carbon-14 age for ground water at site 5. An age of 21,000 yr results in an estimate of 0.3 ft/d for the hydraulic conductivity between the recharge area and site 5.
The final stage of ground-water chemical evolution in the Wasatch Formation in the study area is represented by a simulation of the flow path between site 5 and site 6 near the southern boundary of the study area. All of the phases involved between sites 2 and 5 are involved between these two sites (except oligoclase was excluded to allow the addition of organic matter). In addition, sulfate is reduced by organic matter and the resulting sulfide is precipitated as pyrite. Iron is assumed to be provided by ferric hydroxide.
The water at site 7, situated between site 2 and site 5, is not part of the near-surface flow regime because of the depth of the well and the sub stantial sulfide concentration in the water. However, water at site 7 repre sents a more advanced stage of the sulfate-reduction process between site 5 and site 6 and probably typifies water in the Wasatch Formation at greater depth in and to the south of the study area. The substantial sulfide concen tration results from an inadequate supply of iron to precipitate sulfide minerals.
Chemical processes simulated from recharge water to water at site 8 (near the recharge area flanking the Wyoming Range along the western boundary of the study area) are very similar to the processes simulated from recharge water to water at site 1 and site 2. Soil carbon dioxide, calcite, and dolomite are the carbon-bearing phases dissolved. Albite and microcline weather incongru- ently, precipitating smectite. Halite dissolution accounts for most of the chloride in solution whereas gypsum (or anhydrite) supplies the small concen tration of sulfate. Ion exchange of calcium for sodium is not as important as ion exchange upgradient from sites 1 and 2. This conclusion is consistent with the calcium magnesium bicarbonate water type at site 8.
37
Chemical processes simulated between sites 8 and 3 (in the west-central part of the study area) essentially are the same as those simulated between sites 2 and 5. Incongruent dissolution of dolomite with calcite precipitation is driven by dissolution of gypsum (or anhydrite) and ion exchange of calcium and magnesium for sodium. Dissolution of microcline and oligoclase is incon- gruent, resulting in the precipitation of analcime and saponite.
betweenReactions for carbon-bearing phases site 8 and site 3 were summed to calculate a at site 3. An age of 12,700 yr results in an average hydraulic conductivity between the
recharge and site 8 and carbon-14 age for ground waterestimate of 0.8 ft/d for the
recharge area and site 3.
The three values of hydraulic conductivity calculated from simulated carbon-14 ground-water ages (0.2 ft/d for site 1, 0.3 ft/d for site 5, and 0.8 ft/d for site 3) are about 43, 29, and 11 times smaller than the median of measured values (8.7 ft/d). These differences may result from measured values that are biased towards larger values because wells tend to be installed in aquifer horizons with the greatest yields, whereas the evolution of ground- water chemistry is affected by flow and processes occurring in horizons with smaller and larger permeabilities. Recomputations of site 5 and site 3 ground-water carbon-14 ages based on the assumption of 0 pmc for all dis solving carbonates resulted in small differences for values of hydraulic conductivity upgradient from those sites. However, a recomputation of the site 1 ground-water carbon-14 age on the same; basis resulted in an impossible negative age and indicated that some (perhapsj all) dissolved carbonate probably does equilibrate to 100 pmc in the sjoil horizon.
634S values for ground water at sites 1-5 (-0.6 to -14.9 per mil) indi cate a general lightening as dissolved sulfate concentrations increase pro gressively into the Green River Basin. This trend is hypothesized to result from basinward precipitation of biogenic pyrite in the sediments building the Wasatch Formation during the warm, humid conditions of the Eocene Epoch. Subsequent diagenetic alteration of this pyrite, which is relatively depleted in sulfur-34, produced gypsum (or anhydrite) relatively depleted in sulfur-34. Ground water would contact the relatively enriched sulfur-34 content of altered igneous pyrite and marine sulfate minerals to a greater extent near the recharge areas but increasingly would contact mineral sulfate produced from biogenic pyrite as the ground water moved farther into the basin.
634S values for ground water at sites 6 and 7 (+4.8 and +4.6 per mil) indicate sulfate reduction by organic matter. This interpretation is sup ported by the results of chemical-reaction simulations for the water at site 5 to the water at site 6. The extent of isotoplic evolution between these sites (from 634S equals -11.2 per mil to +4.8 per mil) indicates that sulfate reduction probably is mediated by anaerobic bacteria. The sulfur-34 content of the ground water has been enriched by precipitation of pyrite that is relatively depleted in sulfur-34.
The relation between 6D and 6 180 values indicates slightly heavier oxygen-18 content meteoric water line. This relation may result recharge water or a slightly different local
for ground water at sites 1-7 than predicted by the worldwide
from slight evaporation of meteoric water line. Water at
38
site 1 had substantially heavier 6D and 6 180 values than did water at sites 2-7, indicating that water at site 1 originated during warmer, post glacial climatic conditions than did water at the other sites. This conclu sion is consistent with the calculated ages of the ground water and inferred relative ages of samples from sites without calculated ages.
REFERENCES CITED
Craig, Harmon, 1961, Isotopic variations in meteoric waters: Science, v. 133,no..3465, p. 1702-1703.
Dana, G.F., and Smith, J.W., 1973, Artesian aquifer, New Fork Tongue of theWasatch Formation, northern Green River Basin, in Schell, E.M., ed.,Wyoming Geological Association Guidebook: Casper, Prairie PublicationCo., p. 201-206.
Drever, James I., 1982, The geochemistry of natural waters: Englewood Cliffs,N.J., Prentice-Hall, Inc., 388 p.
Faure, Gunter, 1977, Principles of Isotope Geology: New York, John Wiley andSons, 464 p.
Freeze, R.A., and Cherry, J.A., 1979, Groundwater: Englewood Cliffs, N.J. ,Prentice-Hall Inc., 604 p.
Henderson, Thomas, 1985, Geochemistry of ground water in two sandstone aquifersystems in the northern Great Plains in parts of Montana and Wyoming:U.S. Geological Survey Professional Paper 1402-C, 84 p.
Keith, M.L., and Weber, J.N., 1964, Carbon and oxygen isotopic composition ofselected limestones and fossils: Geochimica et Cosmochimica Acta, v. 28,no. 11, p. 1787-1816.
Kharaka, Y.K., and Barnes, Ivan, 1973, SOLMINEQ--Solution-mineral equilibriumcomputations: U.S. Department of Commerce PB-215 899, 81 p.
Love, J.D., and Christiansen, A.C., 1985, Geologic map of Wyoming: U.S.Geological Survey, scale 1:500,000, 3 sheets.
Parkhurst, D.L., Plummer, L.N., Thorstenson, D.C., 1982, BALANCE--a computerprogram for calculating mass transfer for geochemical reactions in groundwater: U.S. Geological Survey Water-Resources Investigations 82-14,29 p.
Plummer, L.N., and Back, W., 1980, The mass-balance approach application tointerpreting the chemical evolution of hydrologic systems: AmericanJournal of Science, v. 280, p. 130-142.
Plummer, L.N., Parkhurst, D.L., and Thorstenson, D.C., 1983, Development ofreaction models for ground-water systems: Geochimica et CosmochimicaActa, v. 47, p. 665-686.
Vine, J.D., and Tourtelot, E.B., 1970, Preliminary geochemical andpetrographic analysis of lower Eocene fluvial sandstones in the RockyMountain region, in Enyert, R.L., ed., Symposium on Wyoming sandstones--Their economic importance, past, present, and future: Wyoming GeologicalAssociation, 22nd Field Conference Guidebook, Casper, Wyoming GeologicalAssociation, p. 251-263.
___1973, Geochemistry of lower Eocene sandstones in the Rocky Mountainregion: U.S. Geological Survey Professional Paper 789, 36 p.
Welder, G.E., 1968, Ground-water reconnaissance of the Green River Basin,southwestern Wyoming: U.S. Geological Survey Hydrologic InvestigationsAtlas, HA-290, scale 1:250,000, 2 sheets, 5 p.
39
West, R.M., 1969a, Biostratigraphy of fluvialFormation in the northern Green River Basin, Wyoming, in Parker, R.B.,ed., Contributions to Geology: Laramie,
sediments of the upper Wasatch
University of Wyoming, v. 8,no. 2, part 2, p. 184-196.1969b, Geology and vertebrate paleontology of the northeastern GreenRiver Basin, Wyoming, in Barlow, J.A., ec., Symposium on Tertiary rocks of Wyoming: Wyoming Geological Association 21st Field Conference Guidebook, Casper, Wyoming Geological Association, p. 77-92.
Wigley, T.M., Plummer, L.N. , and Pearson, F.J., Jr., 1978, Mass transfer and carbon isotope evolution in natural water systems: Geochimica et Cosmochimica Acta, v. 42, p. 1117-1139. [
Worl, R.G., Lee, G.K., and Long, C.L., 1984, Mineral resource potential map of the Bridger Wilderness and Green-Sweetwater Roadless area, Wyoming: U.S. Geological Survey Miscellaneous Field Investigations map MF-1636-A, scale 1:250,000, 1 sheet.
40
*U.S. GOVERNMENT PRINTING OFFICE 1992-0673-207/50040