warm tundra: atmospheric and near-surface ground
TRANSCRIPT

PERMAFROST AND PERIGLACIAL PROCESSESPermafrost and Periglac. Process. (2015)Published online in Wiley Online Library(wileyonlinelibrary.com) DOI: 10.1002/ppp.1838
‘Warm’ Tundra: Atmospheric and Near-Surface Ground Temperature InversionsAcross an Alpine Treeline in Continuous Permafrost, Western Arctic, Canada
H. B. O’Neill,1* C. R. Burn,1 S. V. Kokelj2 and T. C. Lantz3
1 Department of Geography and Environmental Studies, Carleton University, Ottawa, ON, Canada2 Northwest Territories Geoscience Office, Government of the Northwest Territories, Yellowknife, NWT, Canada3 School of Environmental Studies, University of Victoria, Victoria, BC, Canada
*CorEnviOttawE-ma
Copy
ABSTRACT
Permafrost conditions were examined between 2010 and 2014 at four sites across an alpine treeline on Peel Plateau,Northwest Territories, Canada. Ground and air temperature sensors were installed in forest and tundra between 30and 500m asl. Annual mean air temperatures increased and the number of freezing degree days declined with eleva-tion, due to persistent winter air temperature inversions. The annual mean temperature at the permafrost surface (Tps)in mineral soils increased with elevation from about �2.5 °C in lowland forest to about �1.5 °C in dwarf shrub tun-dra. The increase in Tps coincided with higher air temperatures and earlier snow accumulation at tundra sites. Thehigher Tps in alpine tundra compared to lowland forest in Peel Plain contrasts with the northward decrease in Tps
across latitudinal treeline elsewhere in the western Arctic. An increase in Tps with elevation may be common in Arcticmountain environments due to the prevalence of atmospheric temperature inversions in winter. In such contexts, al-though vegetation characteristics are governed by summer climate, permafrost conditions are critically influenced bythe winter regime. The tundra permafrost on Peel Plateau is considerably warmer and, hence, more sensitive to dis-turbance than perennially frozen ground north of treeline in other parts of the western Arctic. Copyright © 2015 JohnWiley & Sons, Ltd.
KEY WORDS: permafrost; thermal regime; treeline; atmospheric inversions
INTRODUCTION
The forest-tundra ecotone presents significant variationsin surface conditions that control the thermal regime ofpermafrost (Lewkowicz et al., 2012; Palmer et al., 2012;Roy-Léveillée et al., 2014). Changes to the ecotone are be-coming apparent, as increases in shrub abundance havebeen observed near treeline (Sturm et al., 2001a; Mackayand Burn, 2011; Lantz et al., 2012). The interactions be-tween physical and ecological conditions across treelineare likely to influence future changes in ground tempera-tures, which may in turn affect hydrology, terrain stability,ecosystem function and northern infrastructure.The Dempster Highway in Canada’s Northwest Territories
(NWT) traverses the forest-tundra ecotone over 77km from PeelPlain at about 30m asl near FortMcPherson, to around 930m asl
respondence to: H. B. O’Neill, Department of Geography andronmental Studies, B349 Loeb Building, 1125 Colonel By Dr,a, ON K1S 5B6, Canada.il: [email protected]
right © 2015 John Wiley & Sons, Ltd.
at the Yukon/NWT border in Richardson Mountains (Figure 1).For 40km, the road traverses Peel Plateau, reaching about 500masl. The road crosses an alpine treeline, as vegetation changeswith elevation from open-canopy forest on Peel Plain to tallshrub tundra and dwarf shrub tundra near the top of Peel Plateau.The vegetation gradient is similar to that at latitudinal treeline,which occurs in the western Arctic uplands to the northeast ofPeel Plain (Mackay, 1963; Lantz et al., 2010). The entire regionlies in the continuous permafrost zone (Figure 1).
Permafrost temperatures decline significantly across lati-tudinal treeline (e.g. Burn and Kokelj, 2009, Figure 11)due to reduced snow cover, higher snow density and lowerair temperatures over the tundra (Palmer et al., 2012). In asimilar fashion, Lewkowicz et al. (2012) observed that per-mafrost temperatures decline with elevation across an alpinetreeline in mountainous terrain of the Wolf Creek drainage,southern Yukon. Near Dawson City in central Yukon, the re-lations between permafrost temperatures and elevation areless clear due to the influence of more persistent atmospherictemperature inversions in winter (Lewkowicz et al., 2012,Figure 4), which are common at high latitudes (e.g. Burns,
Received 3 July 2014Revised 10 January 2015
Accepted 30 January 2015

Figure 1 Location of study sites, and elevation profile between points A and B along the Dempster Highway (elevation profile modified from Google Earth V7.1, 2013). Symbols are as follows: ▲ shallow (1 m) thermistor array; ◊ deep (4–7 m) thermistor array; * air temperature sensor; X iButton array; M mete-orological station. The locations of instruments are approximate. The inset is modified from Burn (1994, Figure 1), and permafrost zones are after Heginbottom
et al. (1995). The Dempster Highway begins near Dawson City and runs through Fort McPherson to Inuvik. See text for abbreviations.
H. B. O’Neill et al.
1973; Wahl et al., 1987; Burn, 1993; Taylor et al., 1998;Bonnaventure and Lewkowicz, 2013). To our knowledge,no studies have examined permafrost conditions across analpine treeline in the continuous permafrost zone.This paper investigates ground temperatures at four sites
across the ecological transition between the forest in thePeel Plain lowlands and DST on Peel Plateau. We assess
Copyright © 2015 John Wiley & Sons, Ltd.
the influence of air temperature, vegetation and snow condi-tions on the thermal regime of permafrost. We determinewhether the pattern of declining ground temperatures acrosstreeline observed by Palmer et al. (2012) and Lewkowiczet al. (2012) applies to the alpine treeline in the Peel Plateauregion. Since the study region spans a considerable eleva-tion range, we predict that permafrost temperatures will
Permafrost and Periglac. Process., (2015)
Near-Surface Ground Temperatures Across an Alpine Treeline
decrease less drastically from forest to tundra than at latitu-dinal treeline due to winter air temperature inversions. Totest our prediction, we: (1) characterise environmental con-ditions at the study sites across an Arctic alpine treeline; (2)describe air and ground temperatures along this vegetation-elevation gradient; and (3) assess relations between snowproperties, vegetation, air temperature and permafrost con-ditions at the sites.
PERMAFROST TEMPERATURES ACROSSTREELINE
In the continental continuous permafrost zone, snow coveris the most important surficial factor causing local groundtemperature variations (Mackay and MacKay, 1974; Smith,1975; Zhang, 2005; Burn and Zhang, 2009; Morse et al.,2012). The thermal resistance (Rs, m
2 K W�1) of the snowcover limits heat flow out of the ground in winter, and iscontrolled by the thermal conductivity (λs, W m�1K�1)and the snow thickness (ΔH, m):
Rs ¼ ΔHλs
ðLunardini; 1981; p: 43; Equation 3:9Þ (1)
The snow cover is thinner and denser in tundra than in for-est due to sublimation and packing by strong winter winds(Mackay and MacKay, 1974; Sturm et al., 2001b). It there-fore offers low thermal resistance, facilitating ground heatloss. Palmer et al. (2012) reported thermal resistances from2.4 to 9.5m2KW�1 in tundra and 11.0m2KW�1 in borealforest north of Inuvik. In the forest, wind distribution of snowis limited, so snow depths are more uniform and the snowcover density is lower (Burn, 2004; Palmer et al., 2012).The marked changes in snow conditions across the ecotonecause ground temperatures to be significantly lower at tundrasites than in forests (Palmer et al., 2012). For example, meanannual permafrost temperatures in upland forests near Inuvikare�1 to�3 °C, but decline to around�6 °C in tundra northof latitudinal treeline (Burn and Kokelj, 2009, Figure 11).For infrastructure management and engineering purposes,tundra in the continuous permafrost zone is generally associ-ated with cold (<�5 °C) permafrost temperatures (e.g. John-ston, 1981, p. 34; MacGregor et al., 2010, p. 3).Air temperatures also influence permafrost conditions
across treeline. The northern limit of trees is predominantlydetermined by summer climate, but is also influenced by theavailability of moisture (Elliott-Fisk, 2000). Treeline coin-cides with the 12 °C mean July isotherm in continental areasof North America, and is close to the 10 °C mean July iso-therm in maritime locations (Walker, 2000). At latitudinaltreeline near Inuvik, autumn and winter air temperaturesare similar across the ecotone (Palmer et al., 2012). Summerair temperatures decline across the vegetation gradient dueto differences in net radiation (Palmer et al., 2012) and on-shore breezes blowing off the Beaufort Sea (Burn, 1997).Summer air temperatures also theoretically decline acrossan alpine treeline, as temperatures decrease with elevation
Copyright © 2015 John Wiley & Sons, Ltd.
at the environmental lapse rate (e.g. �6.5 °Ckm�1). How-ever, air temperature inversions are common in winter athigh latitudes and, in mountainous terrain, strong inversionsmay develop during calm periods with a clear sky (Burns,1973; Wahl et al., 1987; Burn, 1993; Taylor et al., 1998).For short periods in winter, valley temperatures in theYukon may be �40 to �50 °C, and rise to �15 °C at1000m (Wahl et al., 1987). As a result, the number of freez-ing degree days may decline with elevation, reducing winterground cooling in higher terrain (Taylor et al., 1998;Lewkowicz and Bonnaventure, 2011).
PEEL PLATEAU REGION
The study area lies along the Dempster Highway on PeelPlateau and Peel Plain near Fort McPherson (Figure 1).The region is within the Taiga Plains ecozone (Smithet al., 2004). Peel Plateau consists of gently sloping terrainwith terraces and rounded plateaus of low relief, incisedby steep V-shaped stream valleys draining eastward fromRichardson Mountains to Peel River. Peel Plain to the eastis characterised by low relief, poor drainage and numerouspeatlands (Smith et al., 2004).
Peel Plateau is within the limits of the Late-Wisconsin ad-vance of the Laurentide Ice Sheet (Fulton, 1995; Smithet al., 2004). The ground surface was ice-free by about 11800 14C years ago (Zazula et al., 2009), and is covered bymoraine, glaciolacustrine and glaciofluvial deposits overly-ing Lower Cretaceous marine shale and siltstone bedrock(Norris, 1984). The sediments on Peel Plateau are character-istically ice-rich (Heginbottom et al., 1995), and may hostthick layers of massive ground ice, which is apparent fromthe relatively high density of large retrogressive thawslumps on slopes in the region (Lacelle et al., 2010; Kokeljet al., 2013). The substrate on Peel Plain near FortMcPherson also consists of ice-rich, fine-grained glacial de-posits, underlain by fluvial silt, sand and gravel over shalebedrock (Heginbottom et al., 1995; Norris, 1984).
The study region has a subarctic, continental climate withlong, cold winters and short, cool summers. The mean an-nual air temperature at Fort McPherson (1987–2006) is�7.0 °C. Total annual precipitation averages 295mm, with148mm falling as rain (Environment Canada, 2012). Pre-cipitation is typically heaviest in late summer and early fall(Burn and Kokelj, 2009, Figure 3).
Mackay (1967) estimated that permafrost at a site on PeelPlateau 22 km due west of Fort McPherson was approxi-mately 120m thick. Permafrost thickness of 625m has beeninferred from geophysical data collected in unglaciated ter-rain near the Yukon/NWT border, but at lower elevationson the plateau the thickness is likely closer to 300m (Smithet al., 2004, p. 79). Near-surface ground temperatures re-ported on national-scale maps range from �2 to �5 °C(Heginbottom et al., 1995; Henry and Smith, 2001).
The study area was selected because sites along the forest-tundra transition are easily accessed from the DempsterHighway. In addition, significant road maintenance has been
Permafrost and Periglac. Process., (2015)
H. B. O’Neill et al.
necessary on Peel Plateau to address problems related to thethaw of near-surface ground ice near the road embankment.Characterisation of permafrost conditions may also informplanning of road maintenance.
STUDY SITES
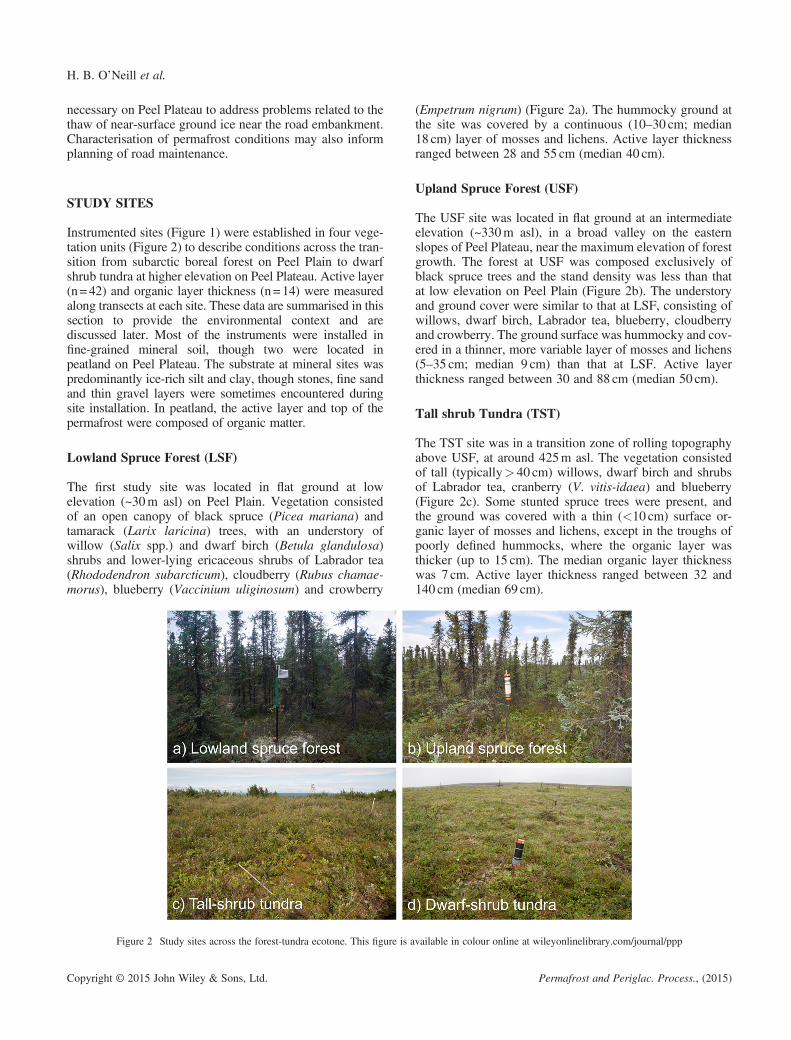
Instrumented sites (Figure 1) were established in four vege-tation units (Figure 2) to describe conditions across the tran-sition from subarctic boreal forest on Peel Plain to dwarfshrub tundra at higher elevation on Peel Plateau. Active layer(n=42) and organic layer thickness (n=14) were measuredalong transects at each site. These data are summarised in thissection to provide the environmental context and arediscussed later. Most of the instruments were installed infine-grained mineral soil, though two were located inpeatland on Peel Plateau. The substrate at mineral sites waspredominantly ice-rich silt and clay, though stones, fine sandand thin gravel layers were sometimes encountered duringsite installation. In peatland, the active layer and top of thepermafrost were composed of organic matter.
Lowland Spruce Forest (LSF)
The first study site was located in flat ground at lowelevation (~30m asl) on Peel Plain. Vegetation consistedof an open canopy of black spruce (Picea mariana) andtamarack (Larix laricina) trees, with an understory ofwillow (Salix spp.) and dwarf birch (Betula glandulosa)shrubs and lower-lying ericaceous shrubs of Labrador tea(Rhododendron subarcticum), cloudberry (Rubus chamae-morus), blueberry (Vaccinium uliginosum) and crowberry
Figure 2 Study sites across the forest-tundra ecotone. This figure is a
Copyright © 2015 John Wiley & Sons, Ltd.
(Empetrum nigrum) (Figure 2a). The hummocky ground atthe site was covered by a continuous (10–30 cm; median18 cm) layer of mosses and lichens. Active layer thicknessranged between 28 and 55 cm (median 40 cm).
Upland Spruce Forest (USF)
The USF site was located in flat ground at an intermediateelevation (~330m asl), in a broad valley on the easternslopes of Peel Plateau, near the maximum elevation of forestgrowth. The forest at USF was composed exclusively ofblack spruce trees and the stand density was less than thatat low elevation on Peel Plain (Figure 2b). The understoryand ground cover were similar to that at LSF, consisting ofwillows, dwarf birch, Labrador tea, blueberry, cloudberryand crowberry. The ground surface was hummocky and cov-ered in a thinner, more variable layer of mosses and lichens(5–35 cm; median 9 cm) than that at LSF. Active layerthickness ranged between 30 and 88 cm (median 50 cm).
Tall shrub Tundra (TST)
The TST site was in a transition zone of rolling topographyabove USF, at around 425m asl. The vegetation consistedof tall (typically> 40 cm) willows, dwarf birch and shrubsof Labrador tea, cranberry (V. vitis-idaea) and blueberry(Figure 2c). Some stunted spruce trees were present, andthe ground was covered with a thin (<10 cm) surface or-ganic layer of mosses and lichens, except in the troughs ofpoorly defined hummocks, where the organic layer wasthicker (up to 15 cm). The median organic layer thicknesswas 7 cm. Active layer thickness ranged between 32 and140 cm (median 69 cm).
vailable in colour online at wileyonlinelibrary.com/journal/ppp
Permafrost and Periglac. Process., (2015)
Near-Surface Ground Temperatures Across an Alpine Treeline
Dwarf shrub Tundra (DST)
The DST site was located at higher elevation on PeelPlateau, between ~470 and 495m asl. The vegetationconsisted of stunted willows, dwarf birch and ericaceousshrubs, typically<40 cm tall (Figure 2d). Well-defined earthhummocks and tussocks covered much of the gently rollingground. The organic layer was thin (<10 cm) on hummocktops, but greater in hummock troughs (up to ~ 30 cm). Themedian organic layer thickness was 8 cm. Active layer thick-ness ranged between 41 and 100 cm (median 67 cm).
Site-Scale Topography and Moisture Contents
All sites were in flat or gently sloping (≤5°) ground, and hadsimilar soil moisture conditions. Active layer soil samplesfrom 30 cm depth were collected from eight soil pits in min-eral soil at USF, TST and DST. The samples were carefullyextracted to yield a volume of 216 cm3 (i.e. 6 cm x 6 cm x6 cm). At LSF, the soil was organic material to below30 cm depth. Volumetric water content (VWC) was deter-mined by oven drying the samples. VWC was between0.28 and 0.44 (mean 0.35; sd 0.05). The small variation inVWC suggests that moisture differences between sites didnot likely have a profound influence on the ground thermalregime in mineral soil.
METHODS
Air and Ground Temperatures
Air and near-surface ground temperatures across the alpinetreeline were measured every 2h using thermistors (TMC6-HD or -HA, Onset Computer Corporation, Bourne, MA,USA) attached to HOBO data loggers (Onset, U12-006 orH08-006-04). These thermistors have a reported accuracyof±0.25 °C over a measurement range of �40 to 50 °Cand a resolution of±0.03 °C at 20 °C. When used with theU12-006 logger, the precision of measurements is approxi-mately±0.02 °C and about ± 0.45 °C with the H08-006-04logger. Given the range of temperature fluctuations inthe air and near-surface ground, the performance of theloggers was sufficient for assessing relative differencesbetween sites.
Table 1 Annual mean air temperatures (AMAT) and the numthree monitoring sites.
Site Elev. (m)
2011–12
AMAT (°C) FD
LSF (Peel Plain) 30 �7.6 441USF (Peel Plateau) 326 �6.8 409DST (Peel Plateau) 492 �6.8 396
*Mean daily temperatures estimated using regressions of Dother abbreviations.
Copyright © 2015 John Wiley & Sons, Ltd.
Air temperature loggers (U12-006) were installed at LSF,USF and DST in radiation shields attached to steel pipes.The sensors were approximately 1.5m above the groundsurface. The air temperature sensors were in operation fromAugust 2011 to August 2013, but the instrument at the USFsite failed in autumn 2012. The annual values in Table 1 for2012–13 were obtained by estimating daily air temperaturesat USF using regression equations derived from 2011–12DST and USF daily air temperatures for both the freezingand thawing seasons (thawing: USF=0.98(DST) +1.20;r2 = 0.99; freezing: USF=1.02(DST) - 0.28; r2 = 0.97).These estimated values are presented in summary form butwere not used to quantify the inversions, which werecharacterised using data from the LSF and DST sensors.
Relations between air and ground temperatures and spa-tial variation in ground temperatures across the treeline werestudied using shallow thermistor arrays, consisting of fourthermistor cables mounted on dowels and placed in holesdrilled to 1m. The sensors were typically at 5, 20, 50 and100 cm depths. The 5 cm thermistor represents the tempera-ture at the ground surface and the 100 cm thermistor approx-imates the temperature at the permafrost surface. In total,eight shallow thermistor arrays were installed (see Table 2).Three arrays were located at DST, three at TST and oneeach at LSF and USF. Snow depths were relatively uniformin the forest because the open canopy and stunted trees didnot cause substantial tree wells, and wind distribution wasminimal, so a single cable was deemed sufficient to describeground thermal conditions at the LSF and USF sites. Theshallow cables were installed in 2010 and 2011 (seeTable 2). In TST, two of the shallow thermistor arrays werelocated in flat ground on a ridge in mineral soil, and anotherat the base of a north-facing slope below the ridge in a flatpeatland (Figure 1). In DST, two of the shallow thermistorarrays were located at around 495m asl, with one in a flatpeatland and one on a gentle (2°) slope in mineral soil. An-other was placed at 470m asl in mineral soil, on a gentle(~5°), north-facing slope. The shallow thermistor cableslocated in hummocky, mineral soil in TST and DST wereplaced on hummock tops.
Ground temperatures at depths of 5–8m were measuredin order to obtain values less affected by seasonal variationthan those at 1m. These deeper ground temperatures weremeasured using thermistor cables with sensors (YSI44033,YSI Incorporated, Yellow Springs, CO, USA) spaced at
ber of freezing/thawing degree days (FDD/TDD) from
2012–13
D TDD AMAT (°C) FDD TDD
8 1755 �7.8 4645 17822 1782 �7.5* 4361* 1619*8 1327 �7.6 4257 1485
ST and USF temperatures from 2011–12. See text for
Permafrost and Periglac. Process., (2015)

Table
2Annualmeantemperaturesat
theperm
afrostsurface(T
ps)andground
surface(T
s),late-wintersnow
depths
andtheestim
ated
datesof
snow
arrival.
2010
–11
2011–1
22012
–13
Site
Elev.
(m)
Snow
arr.
Tps(°C)
Ts
Snow
arr.
Snow
depth(cm)
Tps(°C)
Ts
Snow
arr.
Snow
depth(cm)
Tps(°C)
Ts
LSF-1
30Sep.24
�2.6
0.1
Oct.9
—�2
.80.0
Oct.17
75�2
.5�0
.4USF-1
327
Sep.21
�1.7
0.0
Sep.24
107a
�1.7
0.4
Oct.17
99a
�2.7
�0.8
TST-1
423
Sep.21
�2.1
�1.9
Sep.24
62a
�2.2
�1.8
Oct.17
74�1
.7�1
.9TST-2
(peatland)
415
Sep.21
�0.5
1.3
-119b
--
-97
2-
-TST-3
423
--
-n/a
62�1
.8n/a
n/a
73�1
.4n/a
DST-1
494
Sep.21
�1.4
�0.5
Sep.24
68�1
.20.2
Oct.17
67�1
.5�1
.1DST-2
(peatland)
492
Sep.21
�2.3
�0.8
Sep.24
37�3
.7�2
.5Oct.17
20�4
.4�3
.4DST-3
479
--
-Sep.24
52�2
.0�0
.3Oct.17
48�2
.4n/a
a Meansnow
depthfrom
anadjacent
transect.
bInstrumentcouldnotbe
located,
snow
estim
ated
bytaking
theaverageof
tenprobed
locatio
nsin
awidecircle
arou
ndthesite.See
text
forotherabbreviatio
ns.
H. B. O’Neill et al.
Copyright © 2015 John Wiley & Sons, Ltd.
1m intervals (1–8m). The sensors have an accuracy of± 0.1 °C. The cables were manufactured by M-Squared In-struments, Cochrane, AB, Canada, and were installed inholes drilled by water jet, with a steel pipe used to casethe hole. Gravel layers limited the penetration of the waterjet drill. The thermistor cables were connected to RBR dataloggers that are accurate to ± 0.002 °C and have a resolutionof< 0.00005 °C (model XR420 T8, Richard Brancker Re-search, Ottawa, ON, Canada), with measurements collectedevery 4 h. A deep cable was installed at LSF to a depth of4.57m, at USF to 4.91m and at DST, near the top of PeelPlateau, to 6.74m depth. In this paper, we report mean tem-peratures from the sensor nearest 5m depth.
Snow Surveys and iButton Arrays
Snow surveys were conducted in February 2012 and March2013 and 2014. Snow depths were measured in each vege-tation unit with a graduated steel probe every 5m along70 to 75m transects marked with PVC pipes to characterisesnow cover in the vegetation units. The transects were lo-cated on flat or gently sloping ground. It was not possibleto measure snow depths at LSF in 2012 due to logisticalconstraints. Snow depths were also measured at five pointswithin a 1m radius of shallow ground temperature sensors,and the average was used to estimate the snow depth at thesensor in order to examine the relation between the annualmean temperature at the permafrost surface (Tps) and late-winter snow depth (LWSD). One snow pit was dug in eachvegetation unit adjacent to the snow transects in 2013 andnear each shallow thermistor cable in 2014 to determinesnow densities and the thermal resistance of the snow cover.Snow samples of 100 cm3 were collected at 10 cm intervalsfrom the snow surface to the base of the snowpack, and thedensities were averaged for each pit. The snow cover ther-mal resistance was calculated using Equation 1, with thethermal conductivity estimated using:
λs ¼ 10 2:650ρ�1:652ð Þ ðSturm et al:; 1997; Equation 7Þ (2)
where ρ is the snow cover density in g cm�3.Snow depth was also measured using arrays of iButton®
miniature temperature sensors (model DS1921G, MaximIntegrated, San Jose, CA, USA) to investigate the influenceof the timing of deep snow cover development in forestand tundra on ground thermal conditions. These sensorshave a resolution of 0.5 °C and an accuracy of ±1.0 °Cbetween �30 and +70 °C. The iButtons were mounted ondowels: one sensor was located 5 cm above the groundsurface and the rest were spaced at 10 cm intervals(10–100 cm), so that snow cover development could bemonitored to≥ 90 cm. The snow level was inferred semi-quantitatively, similar to Lewkowicz’s (2008) method: ifthe temperature difference between two adjacent iButtonsdeviated persistently by> 1 °C, this suggested that the snowhad covered the lower sensor. Plots of the iButton
Permafrost and Periglac. Process., (2015)

Near-Surface Ground Temperatures Across an Alpine Treeline
measurements from all sensors on the dowel were also com-pared visually with air temperatures to validate the patternsof temperature deviations with the inferred snow levels.One iButton array was installed in forest in USF and an-
other was located near the Dempster Highway in DST, adja-cent to a snow fence where a deep snowdrift forms. Thesnow fence iButton site is not representative of average snowconditions in the tundra, but is analogous to locations on thetundra where deep snow accumulates from wind redistribu-tion, such as at the base of slopes, in depressions or in areaswith tall shrubs (Sturm et al., 2001b). Data from this iButtonarray were used solely to compare the timing of deep snowaccumulation in the tundra with that in the forest. The WaterResources Division (Aboriginal Affairs and Northern Devel-opment Canada) established a meteorological (MET) stationin 2010 on Peel Plateau, in forest dominated by tall shrubs,to measure air temperature, precipitation, net radiation, windspeed and snow depths (Figure 1). Snow depths inferred fromthe USF iButton array were compared with depths measured atthe MET station. Maximum daily wind speeds at the METstation were used to determine when wind-driven redistribu-tion of snow may have occurred. Snow depths were measuredusing an acoustic sensor (Sonic Ranger SR50A, CampbellScientific, Edmonton, AB, Canada) and wind speed wasdetermined using an RM Young wind speed monitor (model05103, RM Young Company, Traverse City, MI, USA).The data were recorded on a Campbell CRX1000 logger.
Vegetation Heights
The ability of vegetation to trap snow depends on its heightand structural complexity, which are closely correlated inshrub tundra (Thompson et al., 2004). Vegetation canopyheights were measured at ten randomly selected pointswithin 3m of the shallow thermistor arrays, as vegetationinfluences wind-distributed snow over distances of severalmetres (Sturm et al., 2001b). The ten canopy height mea-surements were averaged to obtain the mean maximum veg-etation height, which was used to examine the influence ofvegetation on snow depths at the shallow thermistor cables.
Active Layer Thicknesses
The thickness of the active layer was estimated by probingthe ground with a graduated steel rod in mid-late August2011 to 2013 at 5m intervals along the established transectsat each site. Active layer thicknesses were also measured atthe two peatland sites in 2011–12, but were only measuredat the DST peatland after the site at TST was damaged.
Statistical Analyses
The Wilcoxon rank-sum test was employed to examine dif-ferences in snow depths and active layer thicknessesamongst the site transects for each year. This non-parametric test was used because the data violated the nor-mality assumption for parametric tests. Least-squares linear
Copyright © 2015 John Wiley & Sons, Ltd.
regression was employed to examine relations between (1)snow depth and vegetation height at tundra sites, and (2)Tps and LWSDs for forest and tundra sites, respectively.All statistical tests were conducted at the 0.05 significancelevel. TST-2 was not included in the regression betweenTps and LWSD, due to damage at the site.
RESULTS
Air Temperature Regime
Annual mean air temperatures (AMAT) from LSF, USF andDST are summarised in Table 1. The AMAT at LSF forboth years were lower (�7.6 and �7.8 °C) than the histori-cal average at Fort McPherson (�7.0 °C), but the instrumentwas in undisturbed forest, while the Environment Canadasite, which was in operation until 2007, was at the FortMcPherson airport.
Strong air temperature inversions were observed betweenLSF and DST during the winter, and particularly during thecoldest months (Figure 3a, b). Here, an inversion is consid-ered to have occurred when the daily mean air temperature,calculated from measurements at 2 h intervals, was higher inDST than in LSF. During the freezing season (Oct–Apr),when daily mean air temperatures in LSF were below 0 °C, inversions occurred on 55 per cent of the days. Duringthe thawing season (May–Sep), normal surface lapse rateswere persistent (Figure 3b), and inversions between LSFand DST occurred during only 8 per cent of days.
The frequent and persistent temperature inversionscaused the number of freezing degree days to decline withelevation from LSF to DST (Figure 3b). The strength ofthe winter inversions, when positive surface lapse ratesdominated, was enough cumulatively to outweigh theweaker normal surface lapse rates in summer, so that theAMAT were lowest at LSF in both years (Table 1). For ex-ample, the mean winter air temperature (Dec–Feb) in 2011–12 was �21.1 °C at DST and �25.1 °C at LSF, while themean summer temperatures in 2012 (Jun–Aug) were 13.4and 14.5 °C, respectively.
Snow Conditions
The annual start date of a continuous winter snow coverwas estimated by examining ground temperatures fromthe thermistors at 5 cm depth. Snow was assumed to coverthe ground when the diurnal variation in surface tempera-ture dropped below 1 °C (Burn and Zhang, 2009). At lowelevation on Peel Plain, these conditions were recordedbetween 24 September and 17 October in 2010–13 (Table 2).On Peel Plateau, the arrival of snow occurred between21 September and 17 October.
In each year, median LWSD was greater in the forest thanon the tundra (Figure 4a). The rank order in the forest hasbeen USF>LSF, but it has not been consistent betweenTST and DST over the period of study. Variation in LWSD
Permafrost and Periglac. Process., (2015)

Figure 3 Plots showing (a) air temperatures on Peel Plain (LSF – 30m) and near the top of Peel Plateau (DST – 492m); (b) daily surface lapse rates between30m and 492m; and (c) relations between freezing degree days and elevation. The question mark indicates where missing data were estimated for USF using
regression (see text). See text for abbreviations. This figure is available in colour online at wileyonlinelibrary.com/journal/ppp
H. B. O’Neill et al.
increased with elevation across the ecotone. On Peel Plainin LSF, snow depths were the least variable (47–95 cm).At USF, variation in snow depth was greater (50–132 cm)than at LSF. Snow depth along the transects varied less inTST (32–80 cm) than in USF, but had the greatest variabil-ity overall due to deep snow accumulation at the TST-2thermistor (Figure 4a). Snow depth variation was relativelyhigh along the DST transect (23–111 cm). The Wilcoxonrank-sum tests indicated that snow depths measured alongthe transects at each site were significantly different fromthose at all other sites in individual years, except betweenLSF and DST in 2013 (Table 3a). When the data for allyears were pooled, there were significant differences be-tween all vegetation units except DST and TST, and DSTand LSF (Table 3).Snow density increased, and snow thermal resistance de-
creased with elevation from forest to tundra (Figure 4b). Den-sity was lowest at LSF (172–194kg/m3) and increased withelevation to DST (233–311kg/m3). The thermal resistanceof snow was higher at the forest sites (7.9–11.4m2KW�1)than in tundra (1.4–8.3m2KW�1) (Figure 4b), due to lowerdensities and deeper cover in the forest. However, at TST-2, the thermal resistance was comparable to forest sites dueto snowdrift accumulation at the slope base.iButton thermistor arrays were employed to characterise
the timing of deep snow accumulation in forest and tundra.Snow accumulation inferred from the iButton array inforest at USF suggests that snow accumulates gradually, co-incident with precipitation events (Figure 5a). The inferrediButton snow depths closely agree with those measured atthe MET station located in forest approximately 6 km tothe southwest (Figure 1). The similarity of the plots suggeststhat snow accumulation is relatively uniform in forest onPeel Plateau and that wind distribution is minimal. In contrast,snow accumulation occurred rapidly at the iButton array
Copyright © 2015 John Wiley & Sons, Ltd.
located beside the snow fence in DST, presumably due toredistribution by wind (Figure 5b).
Permafrost Conditions Across Treeline
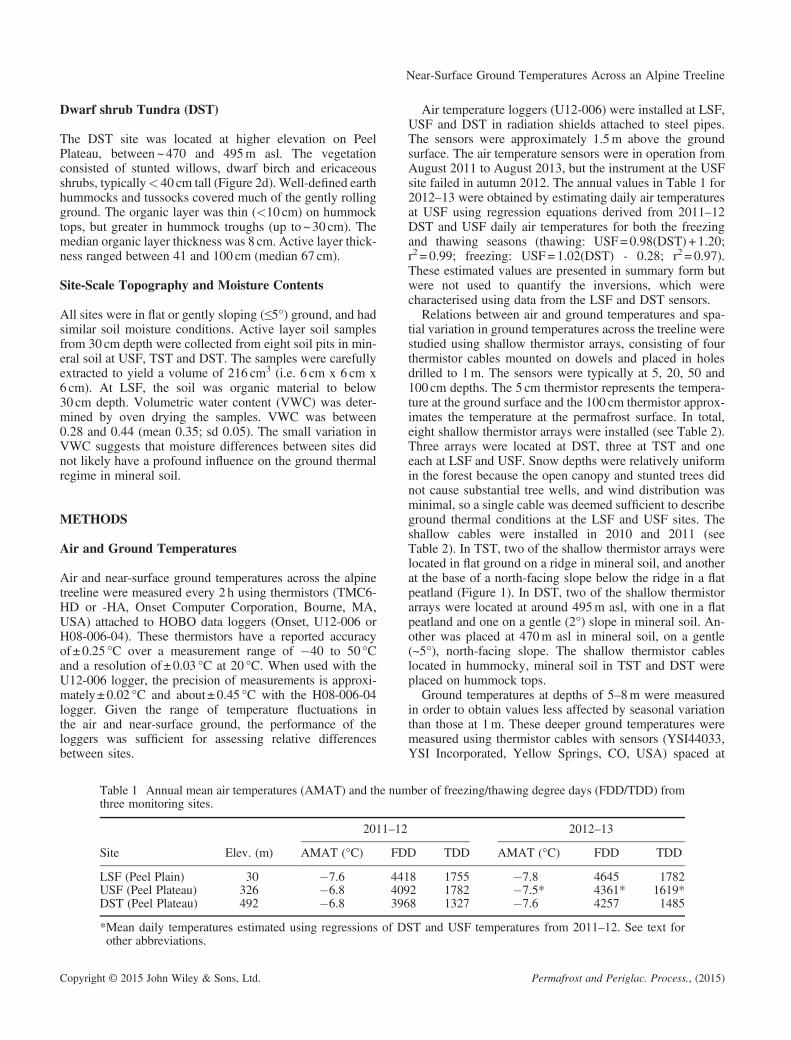
Near-surface ground temperatures in 2010–13 (Table 2)generally increased with elevation across the forest-tundraecotone (Figure 6). The Tps in LSF on Peel Plain ranged be-tween �2.5 and �2.8 °C in 2010–13 (Table 2). These dataare corroborated by a mean temperature of �2.5 °C near5m depth from the LSF deep cable in 2012–14 (Figure 7).In forest on Peel Plateau (USF-1), Tps was between �1.7and �2.7 °C, and was �1.0 °C near 5m depth at the deepcable in 2012–14. At TST, Tps at sites with mineral soilranged from �1.4 to �2.2 °C in 2010–13. At DST, Tps
was between �1.2 and �2.4 °C at sites with mineral soilsin the same period. The mean temperature near 5m at thedeep cable in DST was �2.2 °C in 2012–14. In peatland,Tps was �0.5 °C at TST-2, and between �2.3 and �4.4 °Cat DST-2 (Figure 6). The majority of Tps values at TSTand DST (12 of 14) were higher than those observed in for-est on Peel Plain (Figure 6). The data from deep thermistorcables also indicate that permafrost on Peel Plateau is rela-tively warm, with higher temperatures at both USF andDST than at LSF (Figure 7).
Ground Temperatures and Snow Cover
Strong associations were registered between LWSD andboth Tps and annual mean surface temperature (Ts) at tundrasites (Figure 8). Linear regression indicated that LWSDaccounted for the majority of variation in Tps (Tps = 0.04(LWSD) - 4.79, r2 = 0.72, n = 19, p<0.01). The relation forforest sites was not statistically significant (Tps = 0.03
Permafrost and Periglac. Process., (2015)

Table 3a Wilcoxon rank-sum results for 2012–14 snow depthsfrom transects.
Site LSF USF TST DST
LSF — 20 18 9USF X — 38 29TST X X — 9DST 4 X X —
Figure 4 (a) Box plot of snow depths from transects for winters 2012–14. The number of points measured along each transect is in parentheses. The shadedgrey areas represent the range of individual snow depth measurements from transects and shallow thermistor sites (Table 2). Snow depths were not measured atLSF in 2012 due to logistical constraints; (b) average snow density and snow cover thermal resistance determined from 2013 and 2014 snow pits. In LSF andUSF, the snowpack mainly comprised powder and hoar fractions. In tundra, the depth hoar fraction was smaller, and dense (300–400 kg/m3) wind slab layers
were present at some sites, contributing to the higher densities. See text for abbreviations.
Near-Surface Ground Temperatures Across an Alpine Treeline
(LWSD) - 4.56, r2 = 0.43, n =8, p=0.14), and all the pointslay below the tundra regression line (Figure 8).The thermal effect of snow was also apparent when com-
paring TST-2 and DST-2. Both sites were in peatland, andhad similar late-summer thaw depths (45 cm in 2011–12).Only 77m of elevation separated the sites, so their air tem-peratures were also similar. However, TST-2 was at the baseof a north-facing slope, where deep snow accumulated an-nually, whereas DST-2 was exposed and most snow blewaway. In 2012 and 2013, LWSDs at TST-2 were 119 and
Copyright © 2015 John Wiley & Sons, Ltd.
97 cm, respectively, while there was 37 and 20 cm of snowat DST-2, respectively. At TST-2, the surface temperaturewas decoupled from the air temperature in autumn, indicat-ing the early accumulation of deep snow (Figure 9). As a re-sult, freezeback was delayed significantly at TST-2.Between 2010 and 2013, Tps at DST-2 was between �2.3and �4.4 °C, and freezeback in 2010–11 occurred nearly2 months earlier than at TST-2 (Figure 9). The 2010–11data suggest that, if all other environmental conditions aresimilar, snow may account for at least 1.8 °C of the variationin Tps on Peel Plateau (Table 2). This magnitude may onlyapply at peatland sites, as variation of Tps resulting fromsnow cover in mineral soil likely differs due to the differentthermal properties of the substrates.
Active Layer Thicknesses
Active layer thicknesses and variability generally increasedwith elevation from forest to tundra (Figure 10), except inpeatland. Median active layer thicknesses from 2011 to
Permafrost and Periglac. Process., (2015)

Figure 5 (a) iButton temperatures (grey lines) and inferred snow depth in forest oa snow fence in tundra. The blue lines in (a) and (b) are air temperatures from thespeeds from the meteorological (MET) station are plotted as black bars, and the grcold, dry conditions (Li and Pomeroy, 1997). Question marks indicate the limit of
the MET station. See text for abbreviations. This figure is availa
Table 3b Wilcoxon rank-sum results for 2011–13 active layerthicknesses from transects.
Site LSF USF TST DST Peatland
LSF — 10.5 29 27.5 5.5USF 1,2 — 18.5 17 5TST X 2,3 — 1.5 23.5DST X None None — 22Peatland X None X X —
Note: X indicates significant p-values between the sites in allyears, while 1, 2, 3 and 4 refer to significant p-values in2011, 2012, 2013 and 2014, respectively. The upper rightquadrant is a summary of the data pooled for 2011–13. Thenumbers indicate the difference in the 3 year median valuesbetween the sites (cm). Underlined values indicate significantresults in the pooled years. No snow depths were measured atLSF in 2012. See text for abbreviations.
H. B. O’Neill et al.
Copyright © 2015 John Wiley & Sons, Ltd.
2013 were between 36 and 40 cm in LSF on Peel Plain, andin individual years, the Wilcoxon rank-sum tests indicatedthat the thicknesses were statistically different than thoseat all other sites, except USF in 2013 (Table 3b). In USF,the 2011–13 median thicknesses were between 48 and55 cm. TST had the greatest median active layer thick-nesses, between 63 and 87 cm, and in individual years, thethicknesses differed statistically from all sites except DST(Table 3b). In DST, median thicknesses were between 63and 72 cm, and the active layer thicknesses were statisticallydifferent from those in LSF and the peatlands (Table 4). Thepeatland active layer thicknesses in TST and DST were rel-atively uniform and varied little from 2011 to 2013, withmedian values from 43 to 46 cm. Peatland active layer thick-nesses were significantly different from those measuredalong the transects at all sites except USF, which had similarmedian values (Table 3b).
n Peel Plateau; (b) iButton temperatures and inferred snow depth adjacent toUSF and DST air temperature sensors, respectively. Daily maximum windey shading represents wind speeds at which snow transport is possible underinferred snow depths (when snow is ≥ 90 cm), and missing wind data fromble in colour online at wileyonlinelibrary.com/journal/ppp
Permafrost and Periglac. Process., (2015)
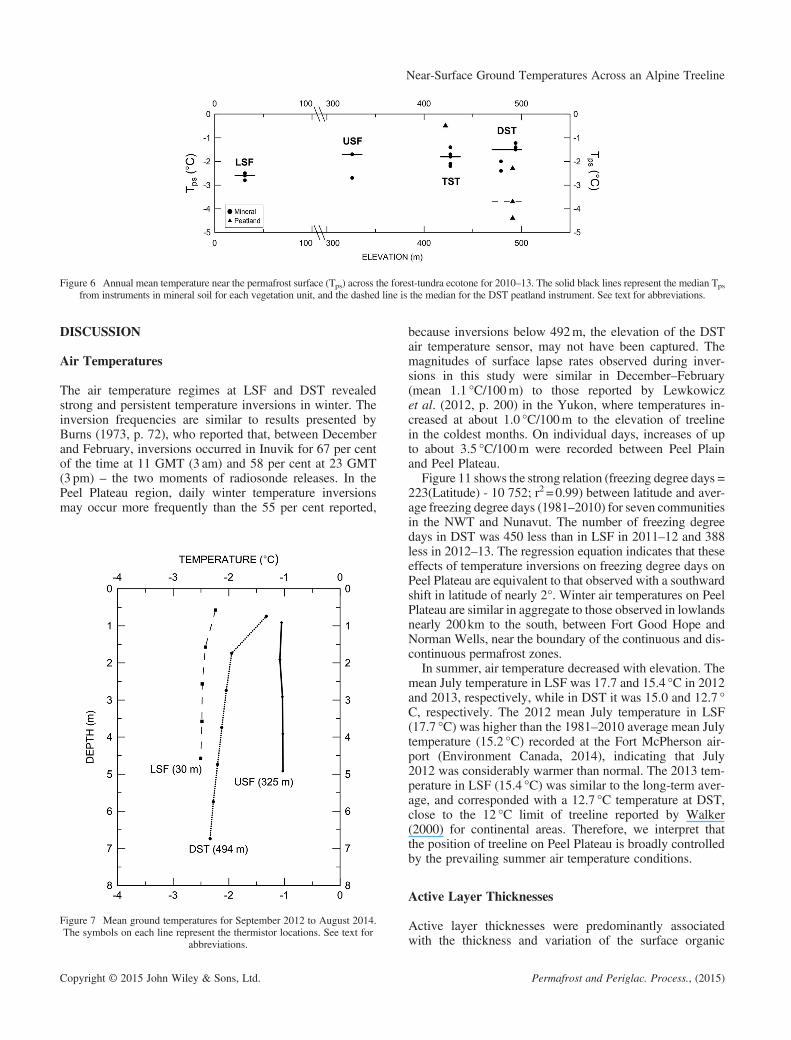
Figure 6 Annual mean temperature near the permafrost surface (Tps) across the forest-tundra ecotone for 2010–13. The solid black lines represent the median Tpsfrom instruments in mineral soil for each vegetation unit, and the dashed line is the median for the DST peatland instrument. See text for abbreviations.
Near-Surface Ground Temperatures Across an Alpine Treeline
DISCUSSION
Air Temperatures
The air temperature regimes at LSF and DST revealedstrong and persistent temperature inversions in winter. Theinversion frequencies are similar to results presented byBurns (1973, p. 72), who reported that, between Decemberand February, inversions occurred in Inuvik for 67 per centof the time at 11 GMT (3 am) and 58 per cent at 23 GMT(3 pm) – the two moments of radiosonde releases. In thePeel Plateau region, daily winter temperature inversionsmay occur more frequently than the 55 per cent reported,
Figure 7 Mean ground temperatures for September 2012 to August 2014.The symbols on each line represent the thermistor locations. See text for
abbreviations.
Copyright © 2015 John Wiley & Sons, Ltd.
because inversions below 492m, the elevation of the DSTair temperature sensor, may not have been captured. Themagnitudes of surface lapse rates observed during inver-sions in this study were similar in December–February(mean 1.1 °C/100m) to those reported by Lewkowiczet al. (2012, p. 200) in the Yukon, where temperatures in-creased at about 1.0 °C/100m to the elevation of treelinein the coldest months. On individual days, increases of upto about 3.5 °C/100m were recorded between Peel Plainand Peel Plateau.
Figure 11 shows the strong relation (freezing degree days =223(Latitude) - 10 752; r2 = 0.99) between latitude and aver-age freezing degree days (1981–2010) for seven communitiesin the NWT and Nunavut. The number of freezing degreedays in DST was 450 less than in LSF in 2011–12 and 388less in 2012–13. The regression equation indicates that theseeffects of temperature inversions on freezing degree days onPeel Plateau are equivalent to that observed with a southwardshift in latitude of nearly 2°. Winter air temperatures on PeelPlateau are similar in aggregate to those observed in lowlandsnearly 200km to the south, between Fort Good Hope andNorman Wells, near the boundary of the continuous and dis-continuous permafrost zones.
In summer, air temperature decreased with elevation. Themean July temperature in LSF was 17.7 and 15.4 °C in 2012and 2013, respectively, while in DST it was 15.0 and 12.7 °C, respectively. The 2012 mean July temperature in LSF(17.7 °C) was higher than the 1981–2010 average mean Julytemperature (15.2 °C) recorded at the Fort McPherson air-port (Environment Canada, 2014), indicating that July2012 was considerably warmer than normal. The 2013 tem-perature in LSF (15.4 °C) was similar to the long-term aver-age, and corresponded with a 12.7 °C temperature at DST,close to the 12 °C limit of treeline reported by Walker(2000) for continental areas. Therefore, we interpret thatthe position of treeline on Peel Plateau is broadly controlledby the prevailing summer air temperature conditions.
Active Layer Thicknesses
Active layer thicknesses were predominantly associatedwith the thickness and variation of the surface organic
Permafrost and Periglac. Process., (2015)

Figure 8 Relations between late-winter snow depth (LWSD) and (a) annual mean permafrost surface temperature (Tps) and (b) ground surface temperature(Ts) for 2012 and 2013. Tundra (M) and Tundra (P) denote sites in mineral and peatland soils, respectively. Asterisks in the legend denote additional datacollected on Peel Plateau by Gill et al. (2014). The dashed line is the regression relation for tundra sites (Tps = 0.04(LWSD) - 4.79, r2 = 0.72, n = 19, p< 0.01),and the dotted line is for forest sites (Tps = 0.03(LWSD) - 4.56, r2 = 0.43, n = 8, p = 0.14). There are fewer points for Ts than Tps because subsidence at DST-3
caused the 5 cm thermistor to be exposed after 2011–12, and because TST-3 did not have a surface thermistor. See text for abbreviations.
Figure 9 Ground temperatures at (a) peatland at the base of a slope wherethick snow accumulates (Ts = 1.3 °C; Tps =�0.5 °C), and (b) an exposedpeatland where little snow accumulates (Ts =�0.8 °C; Tps =�2.3°C). See
text for abbreviations. This figure is available in colour online atwileyonlinelibrary.com/journal/ppp
H. B. O’Neill et al.
layer at the four sites, while shading from the forestcanopy and substrate composition were also important atsome sites. Active layer thickness is generally consideredto be predominantly a function of summer temperature,
Copyright © 2015 John Wiley & Sons, Ltd.
surface conditions and substrate composition (Smith, 1975),though conditions in winter are important in some settings(e.g. Burn and Zhang, 2010). Thawing degree days declinedwith elevation on Peel Plateau due to the persistent normalsurface lapse rates in summer (Table 1), but active layer thick-nesses generally increased from the forest up to the tundra(Figure 10).
Active layer thicknesses were relatively shallow and uni-form at LSF (Figure 10), likely because a thick, continuoussurface organic layer was present, and shading from the can-opy decreased incident radiation on the surface (Smith,1975). The lower permafrost temperatures at LSF may havealso contributed to shallower active layer depths, due tothe heat required to thaw the colder ground. The medianactive layer thicknesses at USF were greater than at LSF(Figure 10), and depths were more variable, likely due tothe sparser forest canopy and variable surface organic layerthickness at the higher elevation site. TST had the greatestand most variable active layer thicknesses (Figure 10).The deepest measurements were from sandy areas, whereit was difficult to ascertain the position of the frost tabledue to friction along the probe, while the shallow measure-ments were in troughs of poorly defined hummocks wherethere was a thicker surface organic layer. DST had less var-iable active layer thicknesses than TST (Figure 10), due tothe absence of sandy substrate, but the differences werenot statistically significant (Table 3b). The variation atDST was related to the differences in organic cover on hum-mock tops and troughs. Peatlands had uniform and thin(~45 cm) active layers, similar to LSF, due to the thickand continuous organic cover. However, the active layerthicknesses in peatland and LSF were statistically different,because LSF had consistently shallower depths, likely dueto shading in the forest.
Permafrost and Periglac. Process., (2015)

Figure 10 Active layer thicknesses across the forest-tundra ecotone fromthe four transects in mineral soil and around instrumented sites in peatland(pooled values from the TST and DST peatland). The number of individual
points measured is in parentheses. See text for abbreviations.
Near-Surface Ground Temperatures Across an Alpine Treeline
In summary, the effects of surface and subsurface condi-tions obscured any relation between thawing degree daysand active layer thicknesses across the ecotone.
Snow Conditions
Snow depths generally declined with elevation from forestto tundra and were more variable in tundra (Figure 4a),but the pattern is not as clearly defined as at latitudinaltreeline (Palmer et al., 2012, Figure 5). Snow depths fromthe transects in DST exceeded those in TST in 2012 and2013 (Figure 4a), in contrast with the typically observed re-lation of increasing snow depth with vegetation height(Thompson et al., 2004; Palmer et al., 2012). Linear regres-sion showed no apparent relation between mean maximumvegetation height and LWSD at instrumented sites in tun-dra, suggesting that vegetation is a secondary control ofsnow accumulation at the site scale. This observation sug-gests that mesoscale topographic/wind effects may be im-portant in the rolling terrain of Peel Plateau.Snow cover was thin on Peel Plateau in winter 2013–14
(Figure 4a), due to low snowfall in early winter and strongwinds that removed snow from the tundra (S. Tetlichi andC. Firth, personal communication, 2014). Mesoscale topo-graphic effects may explain the deep snow observed in forestat USF (Figure 4a), which is located in a broad valley. For-ested valleys in the Peel Plateau region may be sinks forsnowfall blown from nearby tundra (e.g. Roy-Léveilléeet al., 2014), but further investigation is required on thistopic, since our study did not control for these effects.Snow depths in LSF were similar to those observed in
forest near Inuvik, but average tundra snow depths weretypically deeper on Peel Plateau than has been observedrecently north of treeline in the Mackenzie Delta area(~50–60 cm vs 20–50 cm) (Morse et al., 2012; Palmeret al., 2012). Snow is likely deeper in tundra on Peel Plateauthan tundra further north because more precipitation falls in
Copyright © 2015 John Wiley & Sons, Ltd.
the former than has been measured north of latitudinaltreeline (Burn and Kokelj, 2009, Figure 3).
Snow cover density increased with elevation, and tundrasnow cover densities were much greater than those in forest.Aggregate snow densities from tundra snow pits were higherthan those observed north of latitudinal treeline to the north-east. On Peel Plateau, the snow densities from pits in TSTand DST were between 233 and 311kg/m3, whereas uplandshrub tundra sites in the Mackenzie Delta area have reportedaverage densities of 120–230 kgm�3 (Palmer et al., 2012)and 238 kgm�3 (Morse et al., 2012). In LSF and USF, snowcover densities were 172–194 and 197–217kg/m3, respec-tively, similar to the value of 190 kg/m3 reported by Palmeret al. (2012) from forest near Inuvik.
The thermal resistance of the snow covers observed inthis study were within the range of those observed at latitu-dinal treeline, but the average resistance from snow pits inDST (3.2m2KW�1, n = 6) was greater than that reportedby Palmer et al. (2012) (2.4m2KW�1) for a site north oflatitudinal treeline in DST, even though five of the six snowpits were dug in 2014, when snow cover was thinnest onPeel Plateau. The high thermal resistance of the snow coverin tundra on Peel Plateau may contribute to the warm per-mafrost conditions.
Permafrost Conditions
Ground temperatures did not decline substantially acrosstreeline, in contrast to observations by Lewkowicz et al.(2012) and Palmer et al. (2012). The majority of tundra siteshad higher Tps than those at LSF (Figure 6). Ground temper-atures at 5m depth were also greater on Peel Plateau thanthose on the lower-lying Peel Plain (Figure 7). Tundra per-mafrost temperatures were several degrees higher than thosetypically observed north of latitudinal treeline (e.g. Burnand Kokelj, 2009; Palmer et al., 2012), and higher thanthose reported for the study region on national-scale maps(Heginbottom et al., 1995; Henry and Smith, 2001). Thecombined effects of strong winter temperature inversionsand relatively deep snow contribute to the warm permafrostconditions observed at tundra sites. We emphasise that ourresults apply to the elevation range examined, but that inhigher terrain, which may have thinner snow cover and ex-perience the effects of inversions less frequently, groundtemperatures may be lower than at LSF.
Our data show that the number of freezing degree days onPeel Plateau may be similar to that of lower latitudes such asthe area between Fort Good Hope and Norman Wells,NWT. Burgess and Smith (2000, Figure 3a) reported meanannual ground temperatures at sites near Fort Good Hopebetween �2 and 0 °C. The average mean annual groundtemperature from 17 sites near Norman Wells, reported inthe Ground Temperature Database for Northern Canada(Smith and Burgess, 2000) is about �2.7 °C, lower thanthe median temperature on Peel Plateau, but with a similarrange (�0.8 to about �4.5 °C). Therefore, the similar winterair temperature conditions on Peel Plateau and between Fort
Permafrost and Periglac. Process., (2015)

Figure 11 Relation between latitude and average freezing degree days(1981–2010) in seven communities (Environment Canada, 2014). Thestudy area on Peel Plateau is at about 67.2°N, and there were 3968 and4257 freezing degree days at DST in 2011–12 and 2012–13, respectively.These data are not plotted here, as they are not similar to the long-term
averages. See text for abbreviations. NU =Nunavut.
H. B. O’Neill et al.
Good Hope and Norman Wells likely lead to similar perma-frost temperatures.Typically, higher permafrost temperatures in forest than
tundra are attributed to deep snow covers (e.g. Smith et al.,1998; Burn and Kokelj, 2009; Palmer et al., 2012).However, on Peel Plateau, where snow in tundra may alsobe deep, the timing of snow accumulation may be an impor-tant factor contributing to lower ground temperatures atforest sites. Data from the iButtons in DST suggestedthat> 90 cm of snow may accumulate by early November,whereas the snow cover in the forest accumulated moregradually over several months, only surpassing 90 cm depthin early February (Figure 5). The more gradual snowaccumulation in forest may partly explain why the relationbetween Tps and LWSD for forest sites is distinctive fromthat for tundra sites (Figure 8). This is supported by a shorterduration of freezeback at forest sites. For 2010–13, LSF hada mean freezeback duration of 116 days, while the mean atUSF was 118 days; at tundra sites, freezeback averaged140 days. The shorter freezeback period at forest sites islikely due, in part, to thinner snow cover early in the freezingseason compared to tundra sites where wind-blown snowaccumulates, and because active layers are thinner in theforest.In summary, the warm permafrost temperatures observed
on Peel Plateau are likely an integrated response to thehigher air temperatures in winter caused by atmospherictemperature inversions, relatively deep snow in the tundraand rapid snow accumulation in some areas due to windredistribution. These conditions may apply over large
Copyright © 2015 John Wiley & Sons, Ltd.
spatial extents in the continuous and discontinuous perma-frost zones, in areas with alpine treelines and air temperatureinversions.
The results of this study are also relevant to infrastructureplanning, as it is apparent that the presence of tundra inthe continuous permafrost zone does not necessarily implycold (< �5.0 °C) permafrost conditions, in contrast withcommon understanding (e.g. Johnston, 1981; MacGregoret al., 2010). The vegetation gradient at treeline is controlledby summer air temperatures (Walker, 2000), but here weemphasise the role of winter conditions, which do not gov-ern the broad-scale vegetation assemblages across the eco-tone, but largely define the ground thermal regime and Tps.
The high Tps values measured on Peel Plateau and theirassociation with snow depth suggest that the ice-rich perma-frost is particularly susceptible to degradation followingperturbations that increase snow cover. Precipitation innorthern regions is likely to increase in the future (Collinset al., 2013), which may cause permafrost to warm and de-grade if snow cover increases.
The relation between Tps and snow depth may also haveimportant consequences for the ground thermal regimealong the Dempster Highway, where the embankment androadside shrubs that have proliferated since its constructionenhance snow depth (Gill et al., 2014). In 2013, the Gov-ernment of the NWT installed two permanent permafrostmonitoring sites beside the highway in the study region.Continued research should focus on the thermal regime ofpermafrost where snow accumulates adjacent to the high-way embankment. The compaction or removal of snowshould be explored as methods to facilitate freezeback ofthe active layer given the strong relation between LWSDand Tps observed in this study.
CONCLUSIONS
The results from our study area contrast with previous ob-servations of permafrost temperatures declining markedlyacross the forest-tundra ecotone. Permafrost in the tundraenvironment was remarkably warm, contrary to commonassociations of the vegetation type with cold (< �5 °C)ground temperatures in the continuous permafrost zone.The results of this investigation into air and ground temper-atures and snow conditions across this elevational treelineallow the following conclusions to be drawn.
1. Strong and persistent air temperature inversions in win-ter caused the number of freezing degree days to vary in-versely with elevation between Peel Plain and PeelPlateau, so that tundra sites were warmer than forestsites. The difference in freezing degree days due toelevation is equivalent to a southwards shift of nearly200 km.
2. Snow depths generally declined and snow cover densityincreased from forest to tundra, suggesting that vegeta-tion controls regional-scale snow conditions across theecotone. Variation in snow depth was greater at tundra
Permafrost and Periglac. Process., (2015)
Near-Surface Ground Temperatures Across an Alpine Treeline
sites than in forest. Deep tundra snow is primarily relatedto topographic setting at the site scale, whereas vegeta-tion height is a secondary factor. Tundra snow depthsare greater on Peel Plateau than north of latitudinaltreeline, likely due to greater precipitation in the studyarea.
3. Snow may accumulate rapidly in tundra due to wind re-distribution, and gradually in forest, coincident withsnowfall events. This contributes to shorter freezebackduration and lower permafrost temperatures at forestsites in comparison with tundra sites with similar late-winter snow accumulation.
4. Permafrost temperatures in the tundra of Peel Plateau areremarkably high as a result of the combined effects ofwinter air temperature inversions, relatively deep tundrasnow depths and rapid accumulation of snow in sometundra settings.
Copyright © 2015 John Wiley & Sons, Ltd.
ACKNOWLEDGEMENTS
This project has been supported by the NWT CumulativeImpact Monitoring Program, the Northern Scientific Train-ing Program of Aboriginal and Northern Development Can-ada, the Natural Sciences and Engineering Research Councilof Canada, the Polar Continental Shelf Program, the AuroraResearch Institute, the W. Garfield Weston Foundation, theTetlit Gwich’in Council and Transport Canada. Field assis-tance from Steven Tetlichi, Clifford Vaneltsi, AbrahamSnowshoe, John Itsi, Christine Firth, Adrian Gaanderse, JeffMoore, Blair Kennedy, Marcus Phillips, Emily Cameron,Krista Chin and Dominique Hill is greatly appreciated.Thank you to the people of Fort McPherson for your helpand hospitality. Helpful comments, which improved thepaper, were received from S. A. Wolfe, P. P. Bonnaventureand an anonymous reviewer.
REFERENCES
Bonnaventure PP, Lewkowicz AG. 2013. Im-pacts of mean annual air temperaturechange on a regional permafrost probabilitymodel for the southern Yukon and northernBritish Columbia, Canada. The Cryosphere7: 935–946. DOI:10.5194/tcd-6-4517-2012.
Burgess MM, Smith SS. 2000. Shallowground temperatures. In The Physical Envi-ronment of the Mackenzie Valley, North-west Territories: a Base Line for theAssessment of Environmental Change,Bulletin 547. Geological Survey of Canada:Ottawa; 89–103.
Burn CR. 1993. Comments on ‘Detection ofclimatic change in the western NorthAmerican Arctic using a synoptic climato-logical approach’. Journal of Climate 6:1473–1475.
Burn CR. 1994. Permafrost, tectonics, andpast and future regional climate change,Yukon and adjacent Northwest Territories.Canadian Journal of Earth Sciences 31:181–192. DOI:10.1139/e94-015.
Burn CR. 1997. Cryostratigraphy, paleogeogra-phy, and climate change during the early Ho-locene warm interval, western Arctic coast,Canada.Canadian Journal of Earth Sciences34: 912–925. DOI:10.1139/e17-076.
Burn CR. 2004. The thermal regime of cryo-sols. In Cryosols, Kimble J (ed). Springer:Berlin; 391–413.
Burn CR, Kokelj SV. 2009. The environmentand permafrost of the Mackenzie Delta area.Permafrost and Periglacial Processes 20:83–105. DOI:10.1002/ppp.655.
Burn CR, Zhang Y. 2009. Permafrost and cli-mate change at Herschel Island (Qikiqtaruq),Yukon Territory, Canada. Journal of Geo-physical Research 114: F02001. DOI: 10.1029/2008JF001087
Burn CR, Zhang Y. 2010. Sensitivity of active-layer development to winter conditionsnorth of treeline, Mackenzie delta area,western Arctic coast. In Proceedings ofthe 6th Canadian Permafrost Conference,12–16 September 2010, Calgary, AB,1458–1465. http://pubs.aina.ucalgary.ca/cpc/CPC6-1458.pdf [8 December 2014].
Burns BM. 1973. The Climate of theMackenzie – Beaufort Sea, Volume I, Envi-ronment Canada, Climatological StudiesNo. 24.
Collins M, Knutti R, Arblaster J, Dufresne J-L,Fichefet T, Friedlingstein P, Gao X,GutowskiWJ, Johns T, Krinner G, ShongweM, Tebaldi C, Weaver AJ, Wehner M. 2013.Long-term climate change: Projections,commitments and irreversibility. In ClimateChange 2013: The Physical Science Basis.Contribution of Working Group I to theFifth Assessment Report of the Intergovern-mental Panel on Climate Change, StockerTF, Qin D, Plattner G-K, Tignor M, AllenSK, Boschung J, Nauels A, Xia Y, Bex V,Midgley PM (eds). Cambridge UniversityPress: Cambridge, UK and New York, NY,USA; 1029–1136.
Elliott-Fisk DL. 2000. The Taiga and BorealForest. In North American Terrestrial Vege-tation, Barbour MG, Billings MD (eds).Cambridge University Press: Cambridge;41–74.
Environment Canada. 2012. Climate Data On-line. http://climate.weather.gc.ca/index_e.html#access [31 January 2012].
Environment Canada. 2014. 1981–2010 Cli-mate Normals & Averages. http://climate.weather.gc.ca/climate_normals/index_e.html [14 March 2014].
Fulton RJ. 1995. Surficial Materials ofCanada. Geological Survey of Canada,Map 1880A, Scale 1:5,000,000.
Gill HK, Lantz TC, O’Neill HB, Kokelj SV.2014. Cumulative Impacts and Feedbacksof a Gravel Road on Shrub Tundra Ecosys-tems in the Peel Plateau, Northwest Terri-tories, Canada. Arctic, Antarctic, andAlpine Research 46(4): 947–961. DOI:10.1657/1938-4246-46.4.947.
Google Earth V 7.1. 2013. Fort McPherson,Canada. DigitalGlobe 2014. http://www.google.com/earth/index.html [3 May 2014].
Heginbottom JA, Dubreuil M-A, Harker PA.1995. Canada – permafrost. In NationalAtlas of Canada, Fifth Edition. Natural Re-sources Canada: Ottawa, Canada; Plate 2.1,MCR 4177, scale 1:7,500,000.
Henry K, Smith M. 2001. A model-based mapof ground temperatures for the permafrostregions of Canada. Permafrost and Perig-lacial Processes 12: 389–398. DOI:10.1002/ppp.399.
Johnston GH (ed). 1981. Permafrost: Engi-neering Design and Construction. Associ-ate Committee on Geotechnical Research,National Research Council of Canada. JohnWiley and Sons: Toronto.
Kokelj SV, Lacelle D, Lantz TC, Tunnicliffe J,Malone L, Clark ID, Chin K. 2013.Thawing of massive ground-ice in megaslumps drives increases in stream sedimentand solute flux across a range of watershedscales. Journal of Geophysical Research118: 681–692. DOI:10.1002/jgrf.20063.
Lacelle D, Bjornson J, Lauriol B. 2010.Climatic and geomorphic factors affect-ing contemporary (1950–2004) activityof retrogressive-thaw slumps on theAklavik Plateau, Richardson Moun-tains, NWT, Canada. Permafrost andPeriglacial Processes 21: 1–15. DOI:10.1002/ppp.666.
Lantz TC, Gergel SE, Kokelj SV. 2010. Spatialheterogeneity in the shrub tundra ecotone in
Permafrost and Periglac. Process., (2015)

H. B. O’Neill et al.
the Mackenzie Delta region, Northwest Ter-ritories: implications for Arctic environmen-tal change. Ecosystems 13: 194–204. DOI:10.1007/s10021-009-9310-0.
Lantz TC, Marsh P, Kokelj SV. 2012. Re-cent shrub proliferaton in the MackenzieDelta uplands and microclimatic implica-tions. Ecoystems 16: 47–59. DOI:10.1007/s10021-012-9595-2.
Lewkowicz AG. 2008. Evaluation of minia-ture temperature-loggers to monitor snow-pack evolution at mountain permafrostsites, Northwestern Canada. Permafrostand Periglacial Processes 19: 323–331.DOI:10.1002/ppp.625.
Lewkowicz AG, Bonnaventure PP. 2011.Equivalent elevation: a new method to in-corporate variable surface lapse rates intomountain permafrost modelling. Permafrostand Periglacial Processes 22: 153–162.DOI:10.1002/ppp.720.
Lewkowicz AG, Bonnaventure PP, Smith SL,Kuntz Z. 2012. Spatial and thermal charac-teristics of mountain permafrost, northwestCanada. Geografiska Annaler Series A,Physical Geography 94(2): 195–213. DOI:10.1111/j.1468-0459.2012.00462.x.
Li L, Pomeroy JW. 1997. Estimates of thresh-old wind speeds for snow transport usingmeteorological data. Journal of AppliedMeteorology 36: 205–213. DOI:10.1175/1520-0450(1997)036<0205:EOTWSF>2.0.CO;2.
Lunardini VJ. 1981. Heat transfer in cold cli-mates. Van Nostrund Reinhold Company:New York.
MacGregor R, Hayley D, Wilkins G, Hoeve E,Grozic E, Roujanski V, Jansen A, Doré G.2010. Guidelines for Development andManagement of Transportation Infrastruc-ture in Permafrost Regions. TransportationAssociation of Canada report, Ottawa.
Mackay JR. 1963. The Mackenzie Delta Area,N.W.T. Memoir 8, Geographical Branch,Department of Mines and Technical Sur-veys, Ottawa.
Mackay JR. 1967. Permafrost depths, lowerMackenzie valley, Northwest Territories.1967. Arctic 20: 21–26.
Mackay JR, Burn CR. 2011. A century(1910–2008) of change in a collapsingpingo, Parry Peninsula, western Arctic coast,
Copyright © 2015 John Wiley & Sons, Ltd.
All in-text references underlined in blue are linke
Canada. Permafrost and Periglacial Pro-cesses 22: 266–272. DOI:10.1002/ppp.723.
Mackay JR, MacKay DK. 1974. Snow coverand ground temperatures, Garry Island, N.W.T. Arctic 27: 287–296.
Morse PD, Burn CR, Kokelj SV. 2012. Influ-ence of snow on near-surface ground temper-atures in upland and alluvial environments ofthe outer Mackenzie Delta, Northwest Terri-tories. Canadian Journal of Earth Sciences49: 895–913. DOI:10.1139/e2012-012.
Norris DK. 1984. Geology of the northernYukon and northwestern District ofMackenzie. Geological Survey of Canada,Map 1581A, scale 1:500,000.
Palmer MJ, Burn CR, Kokelj SV. 2012. Fac-tors influencing permafrost temperaturesacross tree line in the uplands east of theMackenzie Delta, 2004–2010. CanadianJournal of Earth Sciences 49: 877–894.DOI:10.1139/e2012-002.
Roy-Léveillée P, Burn CR, McDonald ID.2014. Vegetation-permafrost relations with-in the forest-tundra ecotone near Old Crow,Northern Yukon, Canada. Permafrost andPeriglacial Processes 25(2): 127–135.DOI:10.1002/ppp.1805.
Smith CAS, Burn CR, Tarnocai C, Sproule B.1998. Air and soil temperature relationsalong an ecological transect through thepermafrost zones of northwestern Canada.In Proceedings, 7th International Confer-ence on Permafrost, 23–26 June 1998,Yellowknife, Canada, Lewkowicz AG,Allard, M (eds). Collection Nordicana 57.Centre d’études Nordiques, UniversitéLaval: Québec; 993–999.
Smith CAS, Meikle JC, Roots CF (eds). 2004.Ecoregions of the Yukon Territory: Bio-physical Properties of Yukon Landscapes.Agriculture and Agri-Food Canada, PARCTechnical Bulletin No. 04–01, Summerland,British Columbia.
Smith MW. 1975. Microclimatic influenceson ground temperatures and permafrostdistribution, Mackenzie Delta, NorthwestTerritories. Canadian Journal of EarthSciences 12: 1421–1438.
Smith S, Burgess M. 2000. Ground Tempera-ture Database for Northern Canada, OpenFile Report 3954. Geological Survey ofCanada: Ottawa.
d to publications on ResearchGate, letting you a
Sturm M, Holmgren J, Konig M, Morris K.1997. The thermal conductivity of sea-sonal snow. Journal of Glaciology 43:42–59.
Sturm M, Racine C, Tape K. 2001a. Increasingshrub abundance in the Arctic. Nature 411:546–547. DOI:10.1038/35079180.
Sturm M, McFadden JP, Liston GE, ChapinFS III, Racine CH, Holmgren J. 2001b.Snow-shrub interactions in Arctic tundra: ahypothesis with climatic implications.Journal of Climate 14: 336–344. DOI:10.1175/1520-0442(2001)014<0336:SSIIAT>2.0.CO;2.
Taylor A, Nixon M, Eley J, Burgess M,Eggington P. 1998. Effect of atmospherictemperature inversions on ground surfacetemperatures and discontinuous permafrost,Norman Wells, Mackenzie Valley, Canada.In Proceedings of the Seventh InternationalConference on Permafrost, 23–27 June,Yellowknife, Canada, Lewkowicz AG,Allard M (eds). Collection Nordicana 57.Centre d’études Nordiques, UniversitéLaval: Québec; 1043–1048.
Thompson C, Beringer J, Chapin FS III,McGuire AD. 2004. Structural complexityand land-surface energy exchange along agradient from arctic tundra to borealforest. Journal of Vegetation Science 15:397–406. DOI:10.1658/1100-9233(2004)015[0397:SCALEE]2.0.CO;2.
Wahl HE, Fraser DB, Harvey RC, MaxwellJB. 1987. Climate of Yukon. Canadian Gov-ernment Publishing Centre: Ottawa.
Walker DA. 2000. Hierarchical subdivisionof Arctic tundra based on vegetationresponse to climate, parent material andtopography. Global Change Biology 6:19–34. DOI:10.1046/j.1365-2486.2000.06010.x.
Zazula GD, Mackay G, Andrews TD, ShapiroB, Letts B, Brock F. 2009. A late Pleisto-cene steppe bison (Bison priscus) partialcarcass from Tsiigehtchic, Northwest Terri-tories, Canada. Quaternary Science Reviews28: 2734–2742. DOI:10.1016/j.quascirev.2009.06.012.
Zhang T. 2005. Influence of the seasonalsnow cover on the ground thermal regime:an overview. Reviews of Geophysics 43:1–23. DOI:10.1029/2004RG000157.
Permafrost and Periglac. Process., (2015)
ccess and read them immediately.