estimation of near-ground propagation conditions using
TRANSCRIPT

Estimation of Near-Ground Propagation Conditions Using Radar Ground Echo Coverage
SHINJU PARK AND FREDERIC FABRY
Department of Atmospheric and Oceanic Sciences, McGill University, Montreal, Quebec, Canada
(Manuscript received 25 May 2010, in final form 6 October 2010)
ABSTRACT
The vertical gradient of refractivity (dN/dh) determines the path of the radar beam; namely, the larger the
negative values of the refractivity gradient, the more the beam bends toward the ground. The variability of
the propagation conditions significantly affects the coverage of the ground echoes and, thus, the quality of the
scanning radar measurements. The information about the vertical gradient of refractivity is usually obtained
from radiosonde soundings whose use, however, is limited by their coarse temporal and spatial resolution.
Because radar ground echo coverage provides clues about how severe the beam bending can be, we have
investigated a method that uses radar observations to infer propagation conditions with better temporal
resolution than the usual soundings.
Using the data collected during the International H2O Project (IHOP_2002), this simple method has shown
some skill in capturing the propagation conditions similar to these estimated from soundings. However, the
evaluation of the method has been challenging because of 1) the limited resolution of the conventional
soundings in time and space, 2) the lack of other sources of data with which to compare the results, and 3) the
ambiguity in the separation of ground from weather echoes.
1. Introduction
Propagation conditions of radar waves depend on
the vertical gradient of refractivity [dN/dh, where N 5
(n 2 1) 3 106 and n is refractive index of air] that varies
with atmospheric pressure, temperature, and humidity
(Bean and Dutton 1968). For example, when N decreases
with height (h) for a spherically stratified atmosphere, the
radar rays passing through different layers of N bend
according to Snell’s law. The curvature of the bent rays
can be approximated with the vertical gradient of re-
fractivity (e.g., Doviak and Zrnic 1993). Hence, it is dN/dh
that controls the trajectory of the radar beam. Consid-
ering the earth’s curvature (;157 ppm km21), propaga-
tion conditions are often classified in the following four
categories; ducting (dN/dh , 2157 km21; i.e., the
beam gets ‘‘trapped’’ and bends toward the ground),
superrefraction (2157 km21 , dN/dh , 279 km21),
normal refraction (279 km21 , dN/dh , 0 km21), and
subrefraction [dN/dh . 0 km21 (see, e.g., Barclay 2003)].
The occurrence of superrefractive conditions is usually
associated with the following situations: (i) nocturnal
radiation (triggering cool and moist air at the ground
level), (ii) a gust front at the leading edge of a thunder-
storm, and (iii) evaporation over the sea (Battan 1973;
Atkinson and Zhu 2005). On the other end, subrefraction
occurs when the air density contrast is weak, for example,
with cold air passing over a warm sea near the Arctic, or
warm and moist air passing over cold and dry land surface
(Battan 1973; Babin 1995).
Such propagation conditions affect scanning radar
observations, particularly at low elevations:
(i) The determination of the beam height at which
weather/ground echoes are located: The use of vol-
umetric radar observations for either quantitative
precipitation estimation (QPE) or assimilation into
numerical weather prediction (NWP) models (e.g.,
Pellarin et al. 2002; Bellon et al. 2007; Berenguer
and Zawadzki 2008), or beam blockage mitigation/
simulation methods for data quality control (Bech
et al. 2003; Kucera et al. 2004), require an estimation
of the radar beam height, especially in mountainous
areas (Germann et al. 2006). According to Doviak
and Zrnic (1993), the beam height can be computed
with a given dN/dh. However, because of the lack
of measurements of dN/dh, normal propagation
Corresponding author address: Shinju Park, 805 Sherbrooke
W #945, Department of Atmospheric and Oceanic Sciences,
Montreal QC H3A 2K6, Canada.
E-mail: [email protected]
FEBRUARY 2011 P A R K A N D F A B R Y 165
DOI: 10.1175/2010JTECHA1500.1
� 2011 American Meteorological SocietyUnauthenticated | Downloaded 01/10/22 12:58 PM UTC

conditions (dN/dh 5 240 km21 under the standard
atmosphere) have been mostly used in those appli-
cations above.
(ii) Contamination by ground echoes: The more neg-
ative dN/dh becomes, the more the beam bends
toward the surface and the more ground targets
are reflected in radar measurements. As a result,
the observed radar echo coverage at a low eleva-
tion angle tends to increase. This can interfere with
weather echoes near the ground that are often used
for precipitation estimation. In this sense, the de-
tection of ground clutter is a fundamental step in the
chain of quality control algorithms applied to radar
measurements in order to guarantee their mete-
orological relevance. However, the detection of
ground clutter is a well-known challenge in the
radar community and has been an active research
area: ground detection and removal can be based
either on the signal processing of raw data (e.g.,
Moisseev and Chandrasekar 2009) or on data pro-
cessing of reflectivity data (e.g., Moszkowicz et al.
1994; Steiner and Smith 2002), and/or together with
measurements of Doppler velocity (e.g., Berenguer
et al. 2006; Cho et al. 2006; Hubbert et al. 2009).
However, none of the works cited above included
information about the propagation conditions in
their methods for ground echo elimination.
(iii) The quality of radar refractivity retrievals: The radar
refractivity retrieval algorithm is used to estimate
moisture fields with high resolution in time and
space (Fabry et al. 1997; Weckwerth et al. 2005).
This technique has been utilized to understand
thunderstorm initiation (Fabry 2006; Wilson and
Roberts 2006; Roberts et al. 2008; Wakimoto and
Murphey 2009). However, the quality of its perfor-
mance could be somewhat affected by propagation
conditions that determine ray trajectories to ground
targets over complex terrain (Park and Fabry 2010).
Hence, there is a certain need for better knowledge of
propagation conditions as far as radar data quality is
concerned. As mentioned above, however, very few
instruments measure/estimate the vertical gradient of
refractivity. Radiosonde soundings can provide useful
estimates of propagation conditions, but their availability
is limited in terms of temporal and spatial distribution
(generally there are two per day at point sites separated
by hundreds of kilometers). Additionally, their estimates
in the first few meters above the ground are often missing
or unreliable because of instrumental, operator, or rep-
resentativeness errors. Also, as we will show in this work,
propagation conditions very close to the surface are
critical in determining the trajectory of radar beams.
To compensate for the lack of availability of conven-
tional soundings, several studies have explored the use of
different sources of information to estimate and/or pro-
vide the propagation conditions, such as (i) NWP model
outputs to modify the refractivity profile observed at a
given point (Bech et al. 2007), and (ii) radar reflectivity
patterns of free precipitation observed under anomalous
propagation (AP) in order to isolate the AP in the radar
precipitation estimation (Moszkowicz et al. 1994). Also,
different methods have been suggested to obtain propa-
gation conditions for a given sounding in terms of (i)
a multilayer ray-tracing algorithm in the simulation of
beam trajectory that affects radar volume and power
distribution (Fornasiero et al. 2006), (ii) the parabolic
equations in some sea clutter studies (Babin and Dockery
2002), and (iii) the objective function composed of re-
flectivity at multiple elevation angles combined with
Monin–Obukhov similarity theory (Gerstoft et al. 2003).
These studies were, nevertheless, limited to marine at-
mosphere, involved expensive computations in the sim-
ulation of radar echo intensity, and required an initial
sounding whose N would be modified.
The purpose of this paper is, therefore, to investigate
an alternative method to characterize propagation con-
ditions. During the field experiment of International H2O
Project (IHOP_2002) held in Oklahoma, the S-band
dual-polarization Doppler radar (S-Pol) collected ground
echo intensity maps at the 0.08 elevation angle (see sec-
tion 2). For given propagation conditions, section 2 also
describes how we can simulate the height of detectable
ground targets and ground echo coverage. The compar-
ison of measured and simulated ground coverage forms
the basis of the proposed method to extract near-ground
propagation conditions (section 3). Section 4 discusses
the verification challenges by analyzing ground echo
coverage together with soundings available during the
entire experiment. Selected results and analysis of their
impact on beam height error are presented in section 5.
2. Measured and simulated ground echo coverage
a. Observation of ground echoes and propagationconditions
Radar ground echo intensity maps and soundings were
collected over the domain of the S-Pol radar (up to
a maximum range of 60 km) during early summer 2002
(Weckwerth et al. 2004). Figure 1a shows the orography
map around the radar generated from the National Ele-
vation Dataset of the U.S Geological Survey (with a res-
olution of 1 arc sec). To enhance the contribution of
ground echoes, we have used the norm of the in-phase
and quadrature vector NIQ, which is a measure of echo
strength defined as
166 J O U R N A L O F A T M O S P H E R I C A N D O C E A N I C T E C H N O L O G Y VOLUME 28
Unauthenticated | Downloaded 01/10/22 12:58 PM UTC

NIQi5 10 log( X
i
�� ��)(dB), (1)
where Xi 5�M
k51xi,k, the sum of the M samples of the
complex signal xi,k(I, Q) received by the radar at the ith
range gate. This parameter is referred to more rigorously
in the literature with different names later, such as the
phase quality indicator (PQI; Nicol et al. 2009) or the
nominator of the clutter phase alignment (CPA; Hubbert
et al. 2009). Figures 1b,c show the NIQ fields observed at
different times on 14 June 2002. Both events had no pre-
cipitation within the radar domain, and yet the coverage of
NIQ shows distinct differences. The large echo coverage
in Fig. 1b is possibly due to nocturnal radiative cooling
(moist and cold air near the ground) before sunrise, pro-
viding favorable conditions for superrefraction (or duct-
ing). Less coverage is present in the NIQ field of Fig. 1c.
This may be the result of subrefractive conditions caused
by surface heating.
Meanwhile, propagation conditions can be estimated
from sounding measurements. According to Bean and
Dutton (1968), N is a function of pressure P (hPa),
temperature T (K), and water vapor pressure e (hPa),
such as
N 5 77.6P
T1 373 000
e
T2. (2)
Then, the vertical gradient of N dictates the propagation
conditions. During IHOP_2002, soundings over the radar
domain were obtained with the following instruments
(Weckwerth et al. 2004): the Integrated Sounding System
(ISS), the Atmospheric Emitted Radiance Interferometer
(AERI), mobile sounding stations, and aircraft. Unlike
FIG. 1. (a) Orography map within a range of 60 km. Areas are flat overall, yet the northwest area is higher than the
east area. Also shown the NIQ fields at the 0.08 elevation measured in (b) superrefractive (1012 UTC or 0412 LST)
and (c) subrefractive (1528 UTC) conditions on 14 Jun 2002. (d) Vertical profile of dN/dh obtained from the In-
tegrated Sounding System corresponding to the cases of (b) and (c).
FEBRUARY 2011 P A R K A N D F A B R Y 167
Unauthenticated | Downloaded 01/10/22 12:58 PM UTC

mobile and aircraft soundings, radiosonde soundings from
the ISS and retrievals with the AERI were from a fixed
site (Fig. 1a). Figure 1d presents the ISS soundings of
dN/dh at the times corresponding to the radar scans of
Figs. 1b,c. To remove small-scale fluctuations in the
vertical, we have smoothed N estimates over 80 m in
height (corresponding to 10;20 s in time for the ra-
diosonde) and plotted data every 40 m up to 200 m
above the ground. Here, dN/dh at very low levels (less
than 80 m) is not plotted because near-ground sounding
measurements are often missing or inaccurate. Then, it
would be the nearest-ground propagation condition that
mostly affects the radar returns from ground targets.
Therefore, we focus on the first value of the soundings.
For example, about 282 km21 from the thick line in
Fig. 1d indicates superrefractive conditions, which co-
incides with the larger coverage of ground echoes in
radar scans.
b. Simulation of ground targets seen by the radar
Meanwhile, we can simulate the expected ground echo
coverage by determining the areas where the radar beam
intercepts ground targets for given propagation con-
ditions. This requires determining the radar horizon for
a given terrain height. According to Doviak and Zrnic
(1993), ray height can be computed as a function of dN/dh,
h(r) 5 [r2 1 (Re)2
1 2rRe
sinu]1/2 � Re1 H
r,
Re5
(R 1 Hr)
1 1 (R 1 Hr) 10�6
dN
dh
� � , (3)
where r is the radar measurable range, u is the elevation
angle of the ray considered, and Hr is the radar height.
Here, Re is the equivalent earth radius and is obtained
FIG. 2. (a) Illustration of the lowest ray height with the range for two different dN/dh. Below are the associated maps
of detectable ground target heights (Ht) for (b) superrefraction and (c) subrefraction conditions.
168 J O U R N A L O F A T M O S P H E R I C A N D O C E A N I C T E C H N O L O G Y VOLUME 28
Unauthenticated | Downloaded 01/10/22 12:58 PM UTC

from both the earth radius (R) and the vertical gradient
of refractive index. Note that (3) can and will be used not
only for the center of the beam, but also for all of the
rays in the main lobes as well as the sidelobes. Then,
using (3), the radar horizon is obtained by computing the
lowest unblocked ray height as a function of dN/dh.
Figure 2a shows two examples of the lowest ray heights
along the range over the terrain at the azimuth of the ISS
soundings seen in Fig. 1a. In superrefractive conditions
(e.g., dN/dh 5 2120 km21), the lowest rays bend more
toward the ground and thus intercept the ground over a
wider area than in subrefractive conditions (e.g., dN/dh 5
20 km21). The minimum height of ground targets Ht,
which can be detected by the radar for a given dN/dh, will
be the height between the terrain and the lowest rays
reaching the target’s location. The black areas shown in
Figs. 2b,c correspond to the areas where radar beams hit
the surface. Otherwise, for a target to be observed by the
radar in either the gray or white area, its height should be
higher than the indicated values. Because the study area
is relatively flat and agricultural, ground targets are vir-
tually lower than 100 m above the ground (as discussed in
Park and Fabry 2010).
3. Estimating dN/dh using radar ground echoobservation
We have seen that the NIQ fields reflect the location
of ground targets and show a clear dependence on
propagation conditions. On the other hand, we have
demonstrated how the height of visible ground targets
can be simulated as a function of dN/dh. In Figs. 1 and 2,
we can see certain correspondence between the cover-
age of high values of NIQ and the areas in which short
targets are visible for different propagation conditions.
Hence, the method proposed will retrieve the average
dN/dh that results in the best match between the observed
NIQ maps and the simulations of height of ground targets
detectable by the radar.
a. Parameterization
For the comparison, we must realize that the observed
and simulated variables are of significantly different
natures (i.e., echo intensity and height above the ground,
respectively), not to mention the lack of knowledge on
the real distribution of ground targets within the radar
domain (as discussed in Park and Fabry 2010). The NIQ
observations are the primary source that determine where
ground targets are; and the ground targets are supposed
to be solid (e.g., railways, power poles, and the terrain).
However, in reality, the NIQ observations also include
echoes from moving targets, such as precipitation, vege-
tation swaying from winds, and/or irrigators rotating
whenever the farmers need. Thus, we have character-
ized the solid targets as those with NIQ values over
a threshold of 220 dB. This value is somewhat arbi-
trary, but it is good enough to discriminate fixed targets
from moving targets and precipitation echoes without
any additional constraint such as ‘‘zero’’ radial velocity.
Now, one may assign 1 (ground targets detected) to the
echoes with NIQ exceeding the threshold, and 0 (no
ground targets detected) for NIQ values below the
threshold. Instead, we have opted for a fuzzier target
likelihood index fobs, defined as
fobs
(NIQ) 510(NIQ/m)
10(NIQ/m) 1 k(10(NIQ thresh/m)), (4)
where NIQ_thresh is set to 220 dB. Here, m and k are
the weighting factors that determine the smoothness in
the transition from ‘‘no ground target detected’’ to
‘‘ground target detected.’’ For example, shown in Fig. 3a,
in this study, we chose the values of k 5 8 and m 5 6 to
fuzzy the transition between ‘‘definitely a ground target’’
and ‘‘definitely not a ground target’’ given the partially
overlapping NIQ values in precipitation and in the
ground targets. Then, from a real-time radar scan, we
FIG. 3. Target likelihood indices: (a) fobs derived from observa-
tions as a function of NIQ, and (b) fsim used in the simulation as
a function of Ht. For 17 low-level scans from 1330 to 1500 UTC
14 Jun 2002, the results of fsim (gray diamonds) and their average
(gray thick line) are shown. Also shown is the fit of this average,
which constitutes our parameterization of fsim as a function of Ht
(black line).
FEBRUARY 2011 P A R K A N D F A B R Y 169
Unauthenticated | Downloaded 01/10/22 12:58 PM UTC

have used (4) to convert the observed NIQ field into the
field of the ground target detection index.
Now, when it comes to parameterizing the possibility
of detecting ground targets from the simulation, the
challenge lies in how to define a target likelihood index
fsim to be comparable to and compatible with fobs. We
know that the observed coverage of ground targets
would be influenced by the distribution of target heights.
However, because such distribution is unknown, it is
difficult to input proper target heights into the simula-
tion of the ground target coverage. One must remember
that the simulation computes only the height of the
lowest detectable target (Ht) as a function of dN/dh for
a given terrain map. Therefore, we need to use and,
hence, determine a function to map Ht into the field of
the target likelihood index for observing a target. To do
this, we chose a period when dN/dh was known and
constant. This allowed us to compute Ht for every radar
bin (i.e., the size of 150 m in range and 18 in azimuth over
60 km in range) and compare it with the measured fobs.
From the two maps of Ht and fobs, we formulated fsim as
a function of Ht,
fsim
[H] 5 h f *obsi
H, (5)
where H is the increment of Ht that is Hi , (H 5 Ht) ,
Hi 1 DHt, with the interval size DHt 5 1 m; f obs* is de-
fined as a set of fobs during a period of known propaga-
tion conditions; and h iH is the average of f obs* over radar
bins satisfying H. Once this target likelihood index is
determined, fsim will be used as a ‘‘reference’’ to com-
pute maps of expected target coverage from the simu-
lated maps of Ht for all of the propagation conditions.
For example, the gray diamonds in Fig. 3b show fsim as
a function of the minimum target heights (Ht) computed
with cases chosen from the tethered atmospheric ob-
servation during IHOP_2002 when the values of dN/dh
are between 250 and 260 km21 from 1330 to 1500 UTC
14 June 2002 (see section 4b for further detail of the
case). Statistics of the echo occurrence were computed
for Ht up to 80 m above the ground. In Fig. 3b, the gray
line is the average for all of the cases and the black line is
the fit of this average that can be used as the reference
target height statistic. We also assumed that these height
statistics within the radar domain remained constant
during the entire period of IHOP_2002. Therefore, fsim is
in fact independent of dN/dh for each radar bin and
a function of only Ht. However, because Ht changes for
any dN/dh, a target likelihood index can be finally as-
signed to a radar bin corresponding to Ht.
b. Optimization
We have parameterized the detectable ground targets
in terms of indices introduced as (4) and (5) for both the
observation and simulation maps. To find the best match
between two fields, we first tried to simply minimize the
differences in terms of the least squares on a pixel-by-
pixel basis. However, this approach did not show clear
minima in the least squares estimates because we only
know the likelihood of observing a target, not their ac-
tual locations. Hence, we chose to minimize the differ-
ences in the fields of target likelihood indices in terms of
Ht and formulated a cost function as
JdN
dh
� �� �5 �
79
i50fh f
obs(NIQ)i
Hi� f
sim(H
i)g2A(H
i),
(6)
where A(Hi) indicates the number of radar bins satis-
fying the increment of Ht being Hi , Ht , Hi 1 DHt,
with the interval size DHt 5 1 m. Then, the optimization
of (6) has been performed numerically with a quick
downhill simplex method (Press et al. 1999).
FIG. 4. (a) Time series of ground echo coverage with NIQ larger than 220 dB within 60-km range (%). (b) Histogram
of the ground echo coverage shown in (a) during IHOP_2002.
170 J O U R N A L O F A T M O S P H E R I C A N D O C E A N I C T E C H N O L O G Y VOLUME 28
Unauthenticated | Downloaded 01/10/22 12:58 PM UTC

4. Validation challenges
Before we look at the results obtained with the method
presented above, the following should be addressed re-
garding the validation of dN/dh estimates:
(i) We have seen in section 2 that the proposed method
was inspired by a few good agreements between the
observed coverage of ground echoes (targets) and
the simulated target heights given the propagation
conditions. How often do we actually observe such
good agreement?
(ii) Soundings often provide the estimation of dN/dh at
a point location, whereas radar estimates are ob-
tained over the ground echo domain. How trustwor-
thy are point measurements to verify radar estimates?
To answer these questions, we analyzed the available
data for the entire period of the IHOP_2002 experi-
ments (for 45 days from 11 May to 26 June 2002).
a. Observations of ground echo coverage versussounding estimations of dN/dh
First, we plotted radar ground echo coverage (Fig. 4a)
observed with a time resolution of about 5 min. The
ordinate of this plot is the percentage of area (within
60 km in range) with NIQ values exceeding 220 dB. As
discussed previously, this threshold does not fully guar-
antee the complete removal of weather echoes, especially
in those areas where clutter is embedded within pre-
cipitation and/or is affected by heavy rainfalls. The do-
main size of 60 km in range is relatively small compared
to the usual operational radar domain (either 120 or
240 km in range). However, it shows better sensitivity to
propagation conditions and, thus, results in a wide range
of clutter coverage (the larger the size of the domain, the
smaller the ground echo coverage). Note that the evolu-
tion of the ground echo coverage in Fig. 4a presents
a strong diurnal cycle independent of how low or high the
FIG. 5. Comparison of (a) estimated N, (b) pressure, (c) temperature, and (d) water vapor pressure between the
AERI and ISS variables at 87 m AGL. High correlation coefficients (Corr.) suggest that AERI and ISS at this level
agree well with each other.
FEBRUARY 2011 P A R K A N D F A B R Y 171
Unauthenticated | Downloaded 01/10/22 12:58 PM UTC

percentage of coverage is. Yet, this does not mean that
large coverage always occurs at night or early morning
(i.e., when ducting conditions are favorable). In fact, only
about 10% of the radar scans during the entire period of
the experiment show large echo coverage (see Fig. 4b).
Because of this reduced number of samples, it is quite
challenging to investigate how the evolution of the ground
echo coverage matches the observed propagation condi-
tions (dN/dh) in the context of the proposed method.
Second, the estimates of dN/dh obtained from ISS
observations during IHOP_2002 were usually limited in
time and space and often uncertain near the surface (i.e.,
at levels below 100 m). To overcome the difficulties re-
sulting from the low temporal resolution of the radio
soundings, we have used the AERI retrievals of pressure,
temperature, and water vapor pressure sampled at a time
resolution of 10 min or better (Feltz et al. 2003). Con-
veniently, the AERI was located at the same site as the
ISS (Fig. 1a) and the retrievals were obtained whenever
there was no rain. These soundings are retrieved through
the radiative transfer equation provided with an initial
guess based on the available measurements of the AERI,
surface stations, Rapid Update Cycle (RUC) model, and
ceilometers. We have interpolated the low-level profiles
of atmospheric variables from the AERI at 80 m and
smoothed them over 30 min. Figure 5 shows the com-
parison between AERI and ISS soundings (at around
80 m AGL) matched within a 5-min time window. As we
can see from the scatterplots, all of the variables agree
fairly well. That being said, if we try to retrieve the height
derivative of N from these measurements, small height-
dependent biases can strongly affect the outcome. Most
of the scatter in the N comparisons can be due to the
differences in the humidity measurements (Fig. 5d). How-
ever, we are not fully certain about which instrument is
better at measuring humidity and, thus, we have used
the AERI humidity measurements as retrieved.
For the comparison between radar coverage and low-
level propagation conditions estimated from soundings,
we average 5-min AERI dN/dh measurements as a
function of the 10% intervals of ground echo coverage in
Fig. 4b. The result is shown as points in Fig. 6. The lines
present the expected (simulated) area fraction within
the radar domain where the lowest ray does not exceed
a certain height AGL (e.g., 0, 5, 10, and 15 m, depending
on the maximum height allowed for the ground seen by
the radar) as a function of dN/dh. We can see clearly that
smaller coverage corresponds well to the subrefraction,
and the coverage becomes larger as dN/dh decreases
more. However, the dN/dh values observed together
with large echo coverage are significantly lower than
expected. This could be attributed to the small number
of superrefractive cases and possibly biased AERI
retrievals near the ground resulting from erroneous first-
guess information. Also, for some scans where a fraction
of the area is affected by heavy rain, either the precipi-
tation echo coverage could be misclassified as ground
echo coverage or the rain could locally affect dN/dh
while AERI retrieval is still available.
b. Uncertainty in dN/dh measurements fromsoundings
As we mentioned earlier, the proposed radar estima-
tion is representative for the entire domain, whereas
sounding observations are available at only single loca-
tions. This scale mismatch may create some discrepancy
in the comparison of the two estimates. Hence, we have
quantified the representativeness error of dN/dh mea-
surements by using continuous soundings, such as those
provided by the Tethered Atmospheric Observation
System (TAOS; Weckwerth et al. 2004), which is avail-
able nearby the location of AERI. TAOS provides
measurements of atmospheric variables every second
from each sensor suspended at certain heights up to 1 km
AGL (see Fig. 7a). This means that the temporal fluctu-
ation of dN/dh observations from TAOS can be approx-
imately used to estimate the spatial variability of dN/dh
over the radar domain using the Taylor ‘‘frozen turbu-
lence’’ hypothesis and the effect of random measurement
errors on dN/dh estimates combined. Unfortunately,
TAOS worked only for 3 days during IHOP_2002 (12, 14,
FIG. 6. Comparison between the observed radar ground cover-
age and the estimated dN/dh from AERI sounding observation
during 45 days. The data points and bars are the average and
standard deviation of 5-min AERI dN/dh estimates over each 10%
interval of ground echo coverage. The lines present the expected
(simulated) area fraction as a function of dN/dh where the lowest
ray does not exceed a certain height AGL; e.g., Ht 5 0 (gray solid
line), Ht , 5 m (short dashed line), Ht , 10 m (solid line), and Ht ,
15 m (dashed line).
172 J O U R N A L O F A T M O S P H E R I C A N D O C E A N I C T E C H N O L O G Y VOLUME 28
Unauthenticated | Downloaded 01/10/22 12:58 PM UTC
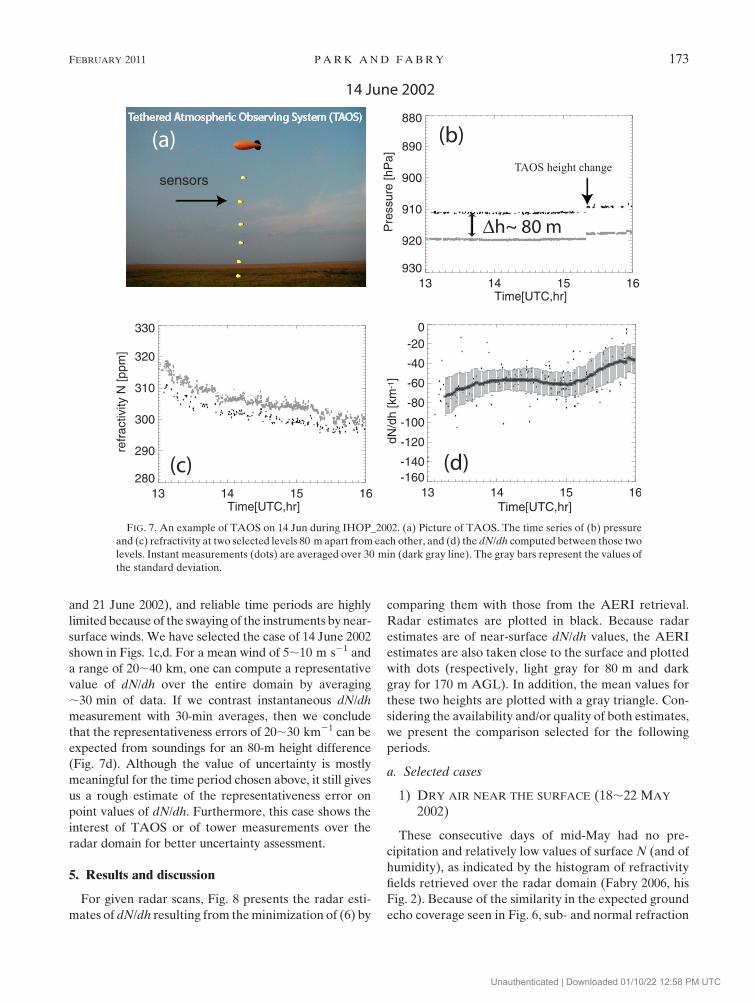
and 21 June 2002), and reliable time periods are highly
limited because of the swaying of the instruments by near-
surface winds. We have selected the case of 14 June 2002
shown in Figs. 1c,d. For a mean wind of 5;10 m s21 and
a range of 20;40 km, one can compute a representative
value of dN/dh over the entire domain by averaging
;30 min of data. If we contrast instantaneous dN/dh
measurement with 30-min averages, then we conclude
that the representativeness errors of 20;30 km21 can be
expected from soundings for an 80-m height difference
(Fig. 7d). Although the value of uncertainty is mostly
meaningful for the time period chosen above, it still gives
us a rough estimate of the representativeness error on
point values of dN/dh. Furthermore, this case shows the
interest of TAOS or of tower measurements over the
radar domain for better uncertainty assessment.
5. Results and discussion
For given radar scans, Fig. 8 presents the radar esti-
mates of dN/dh resulting from the minimization of (6) by
comparing them with those from the AERI retrieval.
Radar estimates are plotted in black. Because radar
estimates are of near-surface dN/dh values, the AERI
estimates are also taken close to the surface and plotted
with dots (respectively, light gray for 80 m and dark
gray for 170 m AGL). In addition, the mean values for
these two heights are plotted with a gray triangle. Con-
sidering the availability and/or quality of both estimates,
we present the comparison selected for the following
periods.
a. Selected cases
1) DRY AIR NEAR THE SURFACE (18;22 MAY
2002)
These consecutive days of mid-May had no pre-
cipitation and relatively low values of surface N (and of
humidity), as indicated by the histogram of refractivity
fields retrieved over the radar domain (Fabry 2006, his
Fig. 2). Because of the similarity in the expected ground
echo coverage seen in Fig. 6, sub- and normal refraction
FIG. 7. An example of TAOS on 14 Jun during IHOP_2002. (a) Picture of TAOS. The time series of (b) pressure
and (c) refractivity at two selected levels 80 m apart from each other, and (d) the dN/dh computed between those two
levels. Instant measurements (dots) are averaged over 30 min (dark gray line). The gray bars represent the values of
the standard deviation.
FEBRUARY 2011 P A R K A N D F A B R Y 173
Unauthenticated | Downloaded 01/10/22 12:58 PM UTC

cases are difficult to distinguish. However, Fig. 8a shows
the excellent agreement between the dN/dh estimated
from radar NIQ coverage using the method described
above and the AERI observations; for example, there is
about 16 km21 RMS difference with the mean values for
both AERI heights for the period between 1200 UTC
18 May and 2400 UTC 22 May. Also, we can see radar
and AERI estimates reproducing the diurnal cycle in
this period.
2) SURFACE MOISTENING (18 MAY AND
12;16 JUNE 2002)
In the presence of precipitation outflows, air trans-
ported from the Gulf of Mexico, or nocturnal radiative
cooling, more negative vertical gradients of refractivity
are expected near the ground. Hence, greater ground
target coverage can be observed by the radar, which
helps the performance of estimating propagation con-
ditions as coverage changes with dN/dh increases in
superrefraction conditions (see Fig. 6). Good examples
are the superrefractive cases presented in Fig. 1b
(14 June 2002) for which there is a good coincidence
between the radar best estimate and AERI and ISS es-
timates (see Fig. 8b and Fig. 9). However, if the surface
is partially affected by rain within the radar domain, the
comparison becomes more challenging. For example,
Fig. 10a shows the reflectivity field observed at 0404 UTC
18 May 2002 showing locally intense rainfall in the
southwestern part of the radar domain. Reflectivity data
are clutter filtered using the default notch filter on S-Pol
(Kessinger et al. 1998). However, if we look at the ter-
rain maps in these areas, the echoes are certainly con-
taminated by the ground targets at the 0.08 elevation
angle as seen in Fig. 10b. On the other hand, it is also
possible that the NIQ measurements were contaminated
by precipitation, though the linear texture of clutter
suggests otherwise, and the radar estimation resulted in
almost ducting (dN/dh , 2150 km21). Because of such
locally biased events, the point AERI retrieval can still
FIG. 8. The dN/dh comparisons between radar estimations
and AERI observations on (a) ;18–22 May and (b) ;12–16 Jun
2002. Radar estimation (black) and AERI estimations are at two
different levels (dots): 80 m AGL (light gray) and 170 m AGL
(dark gray). The mean of these two is shown (gray triangle).
FIG. 9. The dN/dh comparison between the radar estimation and
the ISS observation on 1014 UTC 14 Jun 2002 seen in Fig. 1. The
gray error bars in the profile are based on the result presented
in Fig. 7d.
174 J O U R N A L O F A T M O S P H E R I C A N D O C E A N I C T E C H N O L O G Y VOLUME 28
Unauthenticated | Downloaded 01/10/22 12:58 PM UTC

be obtained if it is deployed in a nonprecipitating area.
Hence, this situation can cause difficulty in the com-
parison and certainly requires better rejection of rainfall
echoes contaminating ground clutter NIQ values.
3) MIXING IN THE AFTERNOON
In addition to the uncertainty in the interpretation
of radar echoes, we have also noticed systematic mis-
matches in the comparison resulting from suspicious
AERI retrievals. One such mismatch occurred in the
afternoon when sudden decreases in low-level estimates
of dewpoint temperature created peaks of subrefraction
conditions (e.g., in the afternoon on 22 May 2002 and
12–16 June 2002; indicated with circles in Fig. 8b). To
verify how realistic these estimates are, we have com-
puted the expected dN/dh by differentiating each term
in (2) with respect to height. If we assume a well-mixed
boundary layer (considering, e.g., the frequent case of
a windy afternoon in the Southern Great Plains), the
lapse rate of water vapor pressure (de/dh) is expected to
be very small. For example, given typical values of
pressure (920 hPa), water vapor pressure (10 hPa), and
temperature lapse rate (9.88C km21), dN/dh can be
computed as a function of de/dh for different tempera-
tures. Note the gray shade in Fig. 11 indicating that the
small vertical changes in water vapor pressure (de/dh ,
62 hPa km21) result in the normal conditions no matter
what the temperature is. In other words, the high peaks
of dN/dh in AERI data appear suspicious. Thus, our
conclusion is that those data require further quality
checks in such periods. In fact, the AERI data have been
useful so far in providing boundary layer information
away from the surface and have not been used much
below a few hundred meters. This suggests that there is
room to extend the usage of AERI data if their un-
certainty is better known.
b. Applications of the radar-estimated dN/dh
Despite several uncertain factors in the estimation
and validation, the results show some ability to estimate
the propagation conditions by using radar observations.
How useful could these be? We have mentioned earlier
in the paper that normal refraction conditions are mostly
FIG. 10. Maps of (a) clutter-filtered reflectivity (dBZ) and (b) unfiltered NIQ (dB) over the same study domain on
0404 UTC 18 May 2002. High reflectivities (above 35 dBZ) occur in regions of moderate to heavy precipitation.
FIG. 11. Expected dN/dh computed with given conditions of
pressure (P; 920 hPa), temperature (T; 08, 208, and 408C), and water
vapor pressure (e; 10 hPa) assuming a dry-adiabatic lapse rate
(Gd; 9.88C km21). Gray-shaded values are expected for well-mixed
air, suggesting that values of dN/dh around 0;40 km21 should be
observed.
FEBRUARY 2011 P A R K A N D F A B R Y 175
Unauthenticated | Downloaded 01/10/22 12:58 PM UTC

used to compute beam height for radar data quality
control and many radar applications. In fact, several
studies have used propagation conditions computed
with real soundings (Steiner and Smith 2002; Bech et al.
2007). However, very low-level conditions have not
been really considered. Because our method provides
near-ground estimates of dN/dh, we have evaluated how
sensitive the beam height is to small changes in near-
ground dN/dh. This is done by computing the difference
(or error) between the beam height determined by true
soundings and those found by using four different dN/dh
soundings approximations: (i) a constant profile of
normal propagation conditions (dN/dh 5 240 km21),
(ii) the true average dN/dh between the surface and
1 km AGL (ITU 2003) and dN/dh 5 240 km21 above,
(iii) the true average dN/dh for the bottom 500 m AGL
(Steiner and Smith 2002) and dN/dh 5 240 km21
above, and (iv) a modified sounding using the observed
dN/dh value up to 100 m and dN/dh 5 240 km21 above.
The last modified profile was tested because we could
FIG. 12. Absolute center beam height differences (errors) at the 0.08 elevation angle between the beam height computed with true
soundings selected from ISS measurements and those computed with the following assumed dN/dh profiles: a normal condition of
dN/dh 5 240 km21 (solid line), a modified sounding by replacing the normal condition below 100 m by the true sounding value that could
be estimated by radar (dashed–dotted line), one where the bottom 1-km dN/dh is replaced by the true average over that layer of dN/dh (short-
dashed line), and one where the bottom 500-m dN/dh is replaced by the true average over that layer of dN/dh (long-dashed line). Three ISS
soundings were considered at (a) 1014 (superrefraction), (b) 1331 (normal refraction), and (c) 1528 (subrefraction) UTC 14 Jun 2002.
FIG. 13. As in Fig. 12, but at the 2.58 elevation angle.
176 J O U R N A L O F A T M O S P H E R I C A N D O C E A N I C T E C H N O L O G Y VOLUME 28
Unauthenticated | Downloaded 01/10/22 12:58 PM UTC

replace the low-level dN/dh values by what we are es-
timating with the proposed method using radar obser-
vations.
Figures 12 and 13 present the results at the 0.08 and the
2.58 elevation angles, respectively. We have chosen low-
level soundings from ISS measured on 14 June during
IHOP_2002 under conditions of (i) superrefraction, (ii)
normal refraction, and (iii) subrefraction. We computed
the beam height differences by subtracting the beam
heights obtained with the true sounding from those with
the four dN/dh approaches described above. From Fig. 12,
independent of the real propagation conditions, the
dash–dotted line shows the smallest errors in simulated
beam heights compared to those obtained with the true
sounding. This certainly shows the value of better knowing
the low-level propagation conditions compared to using
FIG. 14. Mean absolute error (black lines) of the center beam height at the 0.08 elevation angle as a function of
range based on ARM soundings sampled 4 times a day (a) 0500, (b) 1100, (c) 1700, and (d) 2300 UTC at Lamont
during IHOP_2002. In the inset, a frequency distribution of the soundings providing low-level propagation conditions
is shown.
FEBRUARY 2011 P A R K A N D F A B R Y 177
Unauthenticated | Downloaded 01/10/22 12:58 PM UTC

the average value of dN/dh over a deeper layer at a low
elevation angle. On the other hand, at the high elevation
angle (see Fig. 13), the errors are generally smaller and
similar for the four conditions. The dash–dotted line
(radar modified) is almost superimposed with the long-
dashed line (500-m average) for the superrefraction
and with solid lines (normal) for both normal and sub-
refraction conditions. Because these results were from
only one sounding for each propagation condition, we
performed a similar analysis for additional soundings.
Because the ISS soundings observed a very small sample
of superrefraction/ducting conditions, we have used
sounding measurements collected by the Atmospheric
Radiation Measurement (ARM) Central Facility near
Lamont, Oklahoma, also during IHOP_2002. Although
this site is out of the S-Pol radar domain, more frequent
radiosoundings were available during the experiment,
4 times a day or even more, as well as at regular time
intervals. As a result, Figs. 14 and 15 show the statistical
mean (in black lines) of the center beam height errors
as a function of range at the 0.08 and the 2.58 elevation
angles, respectively. At different times, that is, (i) 0500,
FIG. 15. As in Fig. 14, but at the 2.58 elevation angle.
178 J O U R N A L O F A T M O S P H E R I C A N D O C E A N I C T E C H N O L O G Y VOLUME 28
Unauthenticated | Downloaded 01/10/22 12:58 PM UTC

(ii) 1100, (iii) 1700, and (iv) 2300 UTC, between 22 and
28 soundings were available. For each time, the upper-
right corner of each panel shows the frequency of dN/dh
values with bars. Although the total number of samples
is still small, we can see that near-surface ducting oc-
curred more frequently at 0500 and 1100 UTC than at
1700 and 2300 UTC. This is because the location would
likely experience either nocturnal storm outflows around
0500 UTC or radiative cooling. We chose not to com-
bine cases by their propagation conditions given the
small sample size for all of the anomalous conditions.
However, we can clearly see the impact of near-ground
propagation on beam height errors; that is, the smallest
errors are shown with the dash–dotted lines at 0.08 ele-
vation angle. The largest error of the beam heights at
100 km away from the radar in the range is about 100 m
when an average dN/dh is computed between 1 km and
near the ground (the short-dashed line). Is this absolute
error significant? The answer should be dependent on
the application. One thing, however, is clear: knowledge
of low-level propagation conditions (the goal of this
study, i.e., shown with the dash-dotted lines) would
result in a more than 50% reduction of the errors in
beam height compared with the other methods for low
elevation angles. Meanwhile, the beam height errors at
2.58 elevation angle are not as large as those at the 0.08
elevation angle (Fig. 15). At high elevation angles, the
influence of low-level propagation conditions on the
beam height errors was very small. This result is not
surprising because the beam trajectory will be elevated
before they are influenced by the propagation condi-
tions within 100 m, resulting in a much smaller chance
to bend toward the ground. In fact, the results are practi-
cally the same as those for normal conditions. Contrarily,
using dN/dh averages over the deeper layer (500 m and
1 km), there is an improvement in computed beam
heights, and thus the errors are reduced with respect to
the true propagation conditions.
6. Conclusions
Propagation conditions (dN/dh) play an important
role in the quality control of scanning radar observations
and their final applications in precipitation estimation
and forecasting. The echo intensity map returned from
ground targets shows coverage changes associated with
the changes of low-level dN/dh. At the same time, it is
possible to simulate the map of detectable ground target
heights as a function of dN/dh based on ray tracing. In
the present work, we have compared the coverage of high
NIQ observations with dN/dh estimated from soundings
available during IHOP_2002. This comparison suggests
that ground echo coverage increases consistently with
larger negative values of the gradient of refractivity.
Based on that, this study proposed a method to estimate
low-level dN/dh values within the radar domain (;60 km
in range) based on the observation of NIQ.
Several difficulties in the verification of the results
were found because of 1) a limited number of soundings
compared to the number of radar scans, 2) the repre-
sentativeness of radar estimates of dN/dh (obtained
based on area matching) compared with point soundings
observations, and 3) unclear separation of radar ground
echoes from weather echoes in the presence of anoma-
lous propagations resulting from precipitation outflows.
However, the method showed an ability in capturing the
near-ground gradient of refractivity at low-level elevation
angles. We also showed how retrieving such information
could help to better predict the height sampled by radar
at all ranges.
Acknowledgments. This work was made possible thanks
to the support of the Canadian Foundation for Climate and
Atmospheric Sciences. The authors thank Prof. Isztar
Zawadzki for his fundamental and critical questions on the
subject. We are very grateful to Dr. Marc Berenguer for his
valuable comments and insightful review of the first man-
uscript. Also, the review of the manuscript by Dr. Radha
Krishna was helpful.
REFERENCES
Atkinson, B. W., and M. Zhu, 2005: Radar-duct and boundary-
layer characteristics over the Gulf area. Quart. J. Roy. Meteor.
Soc., 131, 1923–1953.
Babin, S. M., 1995: A case study of subrefractive conditions at
Wallops Island, Virginia. J. Appl. Meteor., 34, 1028–1038.
——, and G. D. Dockery, 2002: LKB-based evaporation duct
model comparison with buoy data. J. Appl. Meteor., 41,
434–446.
Barclay, L. W., 2003: Propagation of Radiowaves. 2nd ed. The In-
stitution of Electrical Engineers, 460 pp.
Battan, L. J., 1973: Radar Observations of the Atmosphere. Uni-
versity of Chicago Press, 324 pp.
Bean, B. R., and E. J. Dutton, 1968: Radio Meteorology. National
Bureau of Standards Monogr., No. 92, U.S. Government Printing
Office, 435 pp.
Bech, J., B. Codina, J. Lorente, and D. Bebbington, 2003: The sensi-
tivity of single polarization weather radar beam blockage cor-
rection to variability in the vertical refractivity gradient. J. Atmos.
Oceanic Technol., 20, 845–855.
——, U. Gjertsen, and G. Haase, 2007: Modeling weather
radar beam propagation and topographical blockage at
northern high latitudes. Quart. J. Roy. Meteor. Soc., 133,
1191–1204.
Bellon, A., G. W. Lee, A. Kilambi, and I. Zawadzki, 2007: Real-
time comparison of VPR-corrected daily rainfall estimates
with a gauge Mesonet. J. Appl. Meteor. Climatol., 46,
726–741.
FEBRUARY 2011 P A R K A N D F A B R Y 179
Unauthenticated | Downloaded 01/10/22 12:58 PM UTC

Berenguer, M., and I. Zawadzki, 2008: A study of the error co-
variance matrix of radar rainfall estimation in stratiform rain.
Wea. Forecasting, 23, 1085–1101.
——, D. Sempere-Torres, C. Corral, and R. Sanchez-Diezma, 2006:
A fuzzy logic technique for identifying nonprecipitating ech-
oes in radar scans. J. Atmos. Oceanic Technol., 23, 1157–1180.
Cho, Y.-H., G. W. Lee, K.-E. Kim, and I. Zawadzki, 2006: Identi-
fication and removal of ground echoes and anomalous prop-
agation using the characteristics of radar echoes. J. Atmos.
Oceanic Technol., 23, 1206–1222.
Doviak, R. J., and D. S. Zrnic, 1993: Doppler Radar and Weather
Observations. 2nd ed. Academy Press, 562 pp.
Fabry, F., 2006: The spatial structure of moisture near the surface:
Project-long characterization. Mon. Wea. Rev., 134, 79–91.
——, C. Frush, I. Zawadzki, and A. Kilambi, 1997: On the ex-
traction of near-surface index of refraction using radar phase
measurements from ground targets. J. Atmos. Oceanic Tech-
nol., 14, 978–987.
Feltz, W. F., W. L. Smith, H. B. Howell, R. O. Knuteson, H. Woolf,
and H. E. Revercomb, 2003: Near-continuous profiling of tem-
perature, moisture, and atmospheric stability using the Atmo-
spheric Emitted Radiance Interferometer (AERI). J. Appl.
Meteor., 42, 584–597.
Fornasiero, A., P. P. Alberoni, and J. Bech, 2006: Statistical anal-
ysis and modeling of weather radar beam propagation condi-
tions in the Po Valley (Italy). Nat. Hazards Earth Syst. Sci., 6,303–314.
Germann, U., G. Galli, M. Boscacci, and M. Bolliger, 2006: Radar
precipitation measurement in a mountainous region. Quart.
J. Roy. Meteor. Soc., 132, 1669–1692.
Gerstoft, P., L. T. Rodgers, W. S. Hodgkiss, and L. J. Wagner, 2003:
Refractivity estimation using multiple elevation angles. IEEE
Oceanic Eng., 28, 513–525.
Hubbert, J. C., M. Dixon, S. M. Ellis, and G. Meymaris, 2009:
Weather radar ground clutter. Part I: Identification, modeling,
and simulation. J. Atmos. Oceanic Technol., 26, 1165–1180.
ITU, 2003: The radio refractive index: Its formula and refractivity
data. International Telecommunication Union Recommen-
dation ITU-R P.453-9, 27 pp.
Kessinger, C., E. Scott, J. Van Andel, D. Ferraro, and R. J. Keeler,
1998: NEXRAD data quality optimization. NCAR Annual Rep.
FY98, 154 pp. [Available online at http://www.eol.ucar.edu/rsf/
NEXRAD/dq_fy98/index.html.]
Kucera, P. A., W. F. Krajewski, and C. B. Young, 2004: Radar
beam occultation studies using GIS and DEM technology: An
example study of Guam. J. Atmos. Oceanic Technol., 21, 995–
1006.
Moisseev, D. N., and V. Chandrasekar, 2009: Polarimetric spectral
filter for adaptive clutter and noise suppression. J. Atmos.
Oceanic Technol., 26, 215–228.
Moszkowicz, S., G. J. Ciach, and W. F. Krajewski, 1994: Statistical
detection of anomalous propagation in radar reflectivity pat-
terns. J. Atmos. Oceanic Technol., 11, 1026–1034.
Nicol, J., K. Bartholemew, and A. Illingworth, 2009: A technique
for deriving the humidity of air close to the surface using op-
erational rain radar. Proc. Eighth Int. Symp. on Tropospheric
Profiling, Delft, the Netherlands, European COST program
EG-CLIMET: European Ground-Based Observations of Es-
sential Variables for Climate and Operational Meteorology,
RIVM/KNMI/TU-Delft, S13-P03.
Park, S., and F. Fabry, 2010: Simulation and interpretation of
the phase data used by radar refractivity retrieval algorithm.
J. Atmos. Oceanic Technol., 27, 1286–1301.
Pellarin, T., G. Delrieu, G. M. Saulnier, H. Andrieu, B. Vignal, and
J. D. Creutin, 2002: Hydrologic visibility of weather radar
systems operating in mountainous regions: Case study for the
Ardeche catchment (France). J. Hydrometeor., 3, 539–555.
Press, W. H., S. A. Teukolsky, W. T. Vetterling, and B. P. Flannery,
1999: Numerical Recipes, The Art of Scientific Computing.
2nd ed. Cambridge University Press, 994 pp.
Roberts, R. D., and Coauthors, 2008: REFRACTT-2006: Real-time
retrieval of high-resolution, low-level moisture fields from op-
erational NEXRAD and research radars. Bull. Amer. Meteor.
Soc., 89, 1535–1538.
Steiner, M., and J. A. Smith, 2002: Use of three-dimensional re-
flectivity structure for automated detection and removal of
nonprecipitating echoes in radar data. J. Atmos. Oceanic
Technol., 19, 673–686.
Wakimoto, R. M., and H. V. Murphey, 2009: Analysis of a dryline
during IHOP: Implications for convection initiation. Mon. Wea.
Rev., 137, 912–936.
Weckwerth, T. M., and Coauthors, 2004: An overview of the In-
ternational H2O Project (IHOP_2002) and some preliminary
highlights. Bull. Amer. Meteor. Soc., 85, 253–277.
——, C. R. Pettet, F. Fabry, S. Park, M. A. LeMone, and J. W. Wilson,
2005: Radar refractivity retrieval: Validation and application
to short-term forecasting. J. Appl. Meteor., 44, 285–300.
Wilson, J. W., and R. D. Roberts, 2006: Summary of convective
storm initiation and evolution during IHOP: Observational and
modeling perspective. Mon. Wea. Rev., 134, 23–47.
180 J O U R N A L O F A T M O S P H E R I C A N D O C E A N I C T E C H N O L O G Y VOLUME 28
Unauthenticated | Downloaded 01/10/22 12:58 PM UTC