ground motion in anchorage, alaska, from the 2002 · pdf fileground motion in anchorage,...
TRANSCRIPT

S72
Bulletin of the Seismological Society of America, Vol. 94, No. 6B, pp. S72–S84, December 2004
Ground Motion in Anchorage, Alaska, from the 2002 Denali Fault
Earthquake: Site Response and Displacement Pulses
by David M. Boore
Abstract Data from the 2002 Denali fault earthquake recorded at 26 sites in andnear Anchorage, Alaska, show a number of systematic features important in studiesof site response and in constructing long-period spectra for use in earthquake engi-neering. The data demonstrate that National Earthquake Hazards Reduction Program(NEHRP) site classes are a useful way of grouping stations according to site ampli-fication. In general, the sites underlain by lower shear-wave velocities have higheramplification. The amplification on NEHRP class D sites exceeds a factor of 2 relativeto an average of motions on class C sites. The amplifications are period dependent.They are in rough agreement with those from previous studies, but the new data showthat the amplifications extend to at least 10 sec, periods longer than considered inprevious studies. At periods longer than about 14 sec, all sites have motion of similaramplitude, and the ground displacements are similar in shape, polarization, and am-plitude for all stations.
The displacement ground motion is dominated by a series of four pulses, whichare associated with the three subevents identified in inversion studies (the first pulseis composed of P waves from the first subevent). Most of the high-frequency groundmotion is associated with the S waves from subevent 1. The pulses from subevents1 and 2, with moment releases corresponding to M 7.1 and 7.0, are similar to thepulse of displacement radiated by the M 7.1 Hector Mine earthquake. The signaturefrom the largest subevent (M 7.6) is more subdued than those from the first twosubevents. The two largest pulses produce response spectra with peaks at a periodof about 15 sec. The spectral shape at long periods is in good agreement with therecent 2003 NEHRP code spectra but is in poor agreement with the shape obtainedfrom Eurocode 8.
Introduction
Anchorage, Alaska, is built on the edge of a deep sed-imentary basin at the foot of the Chugach Mountains. Themaximum thickness of the Quaternary and early middle Ter-tiary basin sediments is more than 7 km at a point about150 km southwest of Anchorage, and the basin thicknessexceeds 1 km in the western part of the city (Hartman et al.,1974). The Quaternary deposits under Anchorage includePleistocene glacial deposits and the silt and clay of the Boot-legger Cove formation (Dutta et al., 2001). Shear-wave ve-locities, measured at 36 sites in the basin (Nath et al., 1997;Dutta et al., 2000), show that most of the city is built ondeposits that fall within National Earthquake Hazards Re-duction Program (NEHRP) site classes C and D (Fig. 1)(NEHRP site classes are defined in terms of the time-averaged velocities of shear waves to 30 m, as follows: A,greater than 1500 m/sec; B, between 1500 and 760 m/sec;C, between 760 and 360 m/sec; D, between 360 and 180m/sec; E, less than 180 m/sec). The combination of the low-
velocity sediments and the metamorphic bedrock is ideal forthe amplification of seismic waves, and a number of empir-ical site-amplification studies have been published for theAnchorage area. These studies include generalized inversion(Dutta et al., 2001) and horizontal-to-vertical spectral ratios(Nath et al., 2002) of weak-motion data from a temporarynetwork of stations. A permanent network of strong- andweak-motion stations was installed after the success of thetemporary network. Several studies of site response usingweak- and strong-motion recordings from the new networkhave been published, including the use of spectral ratios(Martirosyan et al., 2002) and generalized inversion (Duttaet al., 2003). These last two studies computed site responseat the basin stations relative to a reference site in the nearbyChugach Mountains. All of the studies focused on site re-sponse within the 0.5 to 11 Hz frequency range, and notsurprisingly, all of the studies found significant frequency-dependent site amplifications on the sediments beneath the

Ground Motion in Anchorage, Alaska, from the 2002 Denali Fault Earthquake S73
K2-16
1741
K2-03
K2-06K2-09
K2-11K2-12
K2-14
K2-22
1744
1751
K2-02
K2-13
1734
1737
K2-01
K2-04
K2-05
K2-07
K2-19
1397
1731
1736
K2-08
K2-20K2-21
-150 -149.8
61.1
61.2
Longitude (oE)
Latit
ude
(o N)
D
C/D C
Chu
gach
Mts
.Figure 1. Location of stations and NEHRP siteclasses (site classes and base map from Fig. 12 byMartirosyan et al., 2002). The C/D class is interme-diate between NEHRP classes C and D and is definedby Martirosyan et al. (2002) by the average shear-wave velocity to 30 m being between 320 and 410 m/sec.
city. Although the detailed site-specific findings differamongst the studies, they all find on average that the largestsite amplifications are on the lower-velocity class D sites,with average amplifications around 3 at low frequencies (0.5–2.5 Hz) and around 1.5 at higher frequencies (3.0–7.0 Hz).
The 2002 M 7.9 Denali fault earthquake was well re-corded on digital strong-motion instruments deployed in theAnchorage metropolitan area. These recordings provide anopportunity to compare site amplifications with those fromthe earlier studies, which used data from many events, andmore importantly, are rich enough in low-frequency contentthat the site amplifications can be computed at lower fre-quencies than in the previous studies. I find that site ampli-fication extends to periods of about 14 sec.
In addition to studies of site amplification, I discuss theindividual pulses of ground displacement on the records. Thedisplacement pulses are similar to those from the muchsmaller M 7.1 Hector Mine, California, earthquake. Thepulses are of long-enough period to be relatively insensitiveto local variations in site geology, and they produce a localincrease in response spectra at periods between 10 and 20sec. In addition, the pulses show site-independent but pulse-dependent polarizations. Interestingly, most of the high-frequency content in the ground motion is carried by the S-wave pulse produced by subevent 1. These observations areconsistent with the results of Frankel (2004).
Data Processing and Characteristics
The data analyzed in this article were obtained on force-balance accelerometers whose response is flat to acceleration
from 0 to 50 Hz. The sensor output was recorded on data-loggers with 114 db dynamic range at 200 samples per sec-ond. The data were provided by the U.S. Geological Survey(USGS) and the University of Alaska and are available fromnsmp.wr.usgs.gov. The stations are plotted in Figure 1. Al-most all data had drifts in displacement derived from doubleintegration of the acceleration trace. To eliminate thesedrifts, the data were processed using simple baseline correc-tions and low-cut filtering with a second-order acausal 0.02Hz butterworth filter; similar results were obtained usinglonger-period filters.
The three components of ground displacement at twosites underlain by very different materials are shown in Fig-ure 2. The station K2-20 has a strong broadband site re-sponse centered at about 0.2 Hz, which leads to the increasedchatter as compared to the recordings at K2-16 (see graycurves in Fig. 2). By filtering out high frequencies to elim-inate this chatter, it is clear that the longer-period motionsat these two dissimilar sites are comparable (see black curvesin Fig. 2). The displacements are composed of four burstsof energy at times near 35, 70, 100, and 170 sec, labeled inFigure 2 as pulses 1, 2, 3, and 4, respectively. The wave-forms do not have the dispersed character associated withwaves traveling across thick sedimentary basins (e.g., Boore,1999). Pulses 1 and 2 correspond to the P- and S-wave ar-rivals from what has been termed by Frankel (2004) as “sub-event 1,” interpreted as the thrust fault initiating the earth-quake (the Susitna Glacier fault). Pulses 3 and 4 correspondto S waves from the strike-slip subevents 2 and 3 (Eberhart-Phillips et al., 2003; Frankel, 2004). Subevent 2 was a con-centrated zone of moment release on the portion of theDenali fault near the crossing of the Trans-Alaska Pipeline;subevent 3 occurred farther east. The moment releases onthe three subevents corresponded to moment magnitudes7.1, 7.0, and 7.6, respectively (Frankel, 2004).
Hodograms of the high-cut-filtered horizontal displace-ments at the two stations K2-20 and K2-16 are shown inFigures 3a and b for the four pulses identified in Figure 2.The polarizations are very similar for the same pulses on thetwo stations (and for the other stations, although not shownhere), and the polarizations show a systematic clockwise ro-tation from pulse 2 through pulse 4. Frankel (2004) identifiespulses 1 and 2 as coming from subevent 1. The polarizationfor pulse 1 is consistent with P waves from that subevent,but pulse 2 is almost pure transverse motion, which at firstseems inconsistent with radiation from an almost pure thrustfault (as found by Frankel, 2004). The S-wave radiation pat-tern for Frankel’s fault orientation for the subevent 1-to-Anchorage azimuth (about 205�), however, is pure SH fortakeoff angles of 15� and 105�. Because the actual wavescomposing the motion at Anchorage are probably made upof a series of arrivals corresponding to different takeoff an-gles, I am not sure if the values of the radiation pattern fora specific ray can be used to predict the polarization of therelatively long-period ground displacements. A more con-vincing argument for the consistency of the subevent 1

S74 D. M. Boore
-4
-2
0
2
4 K2-16, NS
1 2 3 4
0 50 100 150 200 250
-4
-2
0
2
4
Time (s)
K2-16, EW
-2-101 K2-16, UP
-4
-2
0
2
4D
ispl
acem
ent
(cm
)K2-20, NS
0 50 100 150 200 250
-4
-2
0
2
4
Time (s)
Dis
plac
emen
t(c
m) K2-20, EW
-2-101
Dis
plac
emen
t(c
m)
K2-20, UP
Figure 2. Displacements at stations K2-16 and K2-20, showing the strong (anddiffering) polarization of the four dominant displacement pulses. The vertical gray linesindicate the windows used in constructing hodograms (they are not at the same timesfor the two stations because the amount of pre-event motion was slightly different atthe two stations; the record at K2-16 started 1 sec after that at K2-20, and I did notshift the records to align arrivals). Station K2-20 is on lower velocity materials and hasmore high frequency motion than does station K2-16. The numbers below the K2-16,NS trace label the pulses referred to in the text. Gray curves have been low-cut filteredat 0.02 Hz; black curves have been low-cut filtered at 0.02 Hz and high-cut filtered at0.08 Hz.
mechanism and the observed polarization of pulse 2 is Fran-kel’s waveform modeling, which produces a good fit to pulse2 on both horizontal components in Anchorage, using thenearly-pure-thrust mechanism for subevent 1. The clockwiserotation of the polarization from pulse 3 to pulse 4 is con-sistent with SH waves being radiated from portions of theDenali fault at points progressively to the east and the south-east of the hypocenter (subevent 1). If composed of SH bodyand surface waves, pulse 4 seems to be coming from anazimuth of about 60� to 70� clockwise from north, whichputs its source southeast of Frankel’s subevent 3, possiblealong the Totschunda fault. Because his interpretations arebased on careful study of a number of records obtained fromvarious locations in Alaska, it is unlikely that subevent 3 hasbeen mislocated by Frankel (2004). His waveform modelingunderestimates the peak motions on the north–south com-ponent at Anchorage by about 20%, and thus the polarizationfor his model is counterclockwise relative to the observedpolarization in Figure 3 and is consistent with SH polariza-
tion from subevent 3. This suggests that lateral refractiondue to lateral changes in crustal structure may be producingsmall rotations in the observed polarization for certain travelpaths.
Site Response
As indicated in the introduction, a number of previousstudies have found significant and systematic site responsein the Anchorage area, and therefore it will be no surpriseto find the same for records of the Denali fault earthquake.The first indication of site response is in differences of peakacceleration, velocity, and displacements for the various sta-tions. The corresponding time series are shown in Figure 4for the same two stations used in the previous figures—K2-20 and K2-16 (the station in the Chugach Mountains). Asnoted before, these two stations are underlain by dissimilarnear-surface materials. Note the increase of all three mea-sures of ground shaking at K2-20 compared to K2-16, with

Ground Motion in Anchorage, Alaska, from the 2002 Denali Fault Earthquake S75
-2 -1 0 1 2
-2
-1
0
1
2
Nor
th
24--54 s to s.e. 1
-4 -2 0 2 4
-4
-2
0
2
4
East
Nor
th
94--124 s
to s.e. 2
-4 -2 0 2 4
-4
-2
0
2
4
East
Nor
th
154--194 s
to s.e. 3
-4 -2 0 2 4
-4
-2
0
2
4
Nor
th
54--84 s to s.e. 1
(a)
Figure 3. Hodograms of horizontal displacements in centimeters (bandpass filteredas in Figure 2) at (a) station K2-20 and (b) at station K2-16 for the four time windowsindicated on Figure 2, showing the strong (and differing) polarization of the dominantdisplacement pulses. The azimuth from the station to the point of maximum momentrelease per km of faulting for each indicated subevent (s.e.) is shown, as well as thetransverse direction to this azimuth. A 42.6� correction (U. Dutta, oral comm., 2003)has been applied to the orientation of the horizontal components. Note that the scalefor the graph showing the displacements in the first time window is half that of theother graphs. (continued)
the greatest difference being for the higher-frequency mo-tions. Also seen is something not obvious from plots of peakmotions alone: the highest accelerations are associated withpulse 2, with little or no increase of accelerations at the ar-rival times of pulses 3 and 4 (I show later the influence ofthis difference on response spectra). This was noted by Fran-kel (2004) in his interpretation of envelopes of high-frequency ground motions.
Variation by NEHRP Site Class
Figure 5 shows plots of ratios of peak acceleration, peakvelocity, and peak displacement relative to the average ofmotions recorded at class C sites. The amplifications for in-dividual stations on different site classes are indicated by the
symbol used in the plot. An average of class C motions wasused as the reference rather than the motions at station K2-16, on bedrock in the Chugach Mountains, because the K2-16 site seems to have its own amplification at frequenciesabove 7 to 8 Hz (Martirosyan and Biswas, 2002; Martirosyanet al., 2002). As measured by the ratios of peak motionshown in Figure 5, the site amplification exists for all threemeasures of ground motion, but the amplification is clearlymore sensitive to site class for peak acceleration than forpeak displacement. There are consistent differences in themean amplifications within each site class, with larger am-plifications for sites underlain by lower-velocity materials.Much scatter, however, remains for the amplifications withineach class, particularly for peak acceleration. The large

S76 D. M. Boore
-2 -1 0 1 2
-2
-1
0
1
2
Nor
th
23--53 s to s.e. 1
-4 -2 0 2 4
-4
-2
0
2
4
East
Nor
th
93--123 sto s.e. 2
-4 -2 0 2 4
-4
-2
0
2
4
East
Nor
th
153--193 s
to s.e. 3
-4 -2 0 2 4
-4
-2
0
2
4
Nor
th
53--83 s to s.e. 1
(b)
Figure 3. Continued.
station-to-station variability of ground motions within agiven site class is a common finding in many studies.
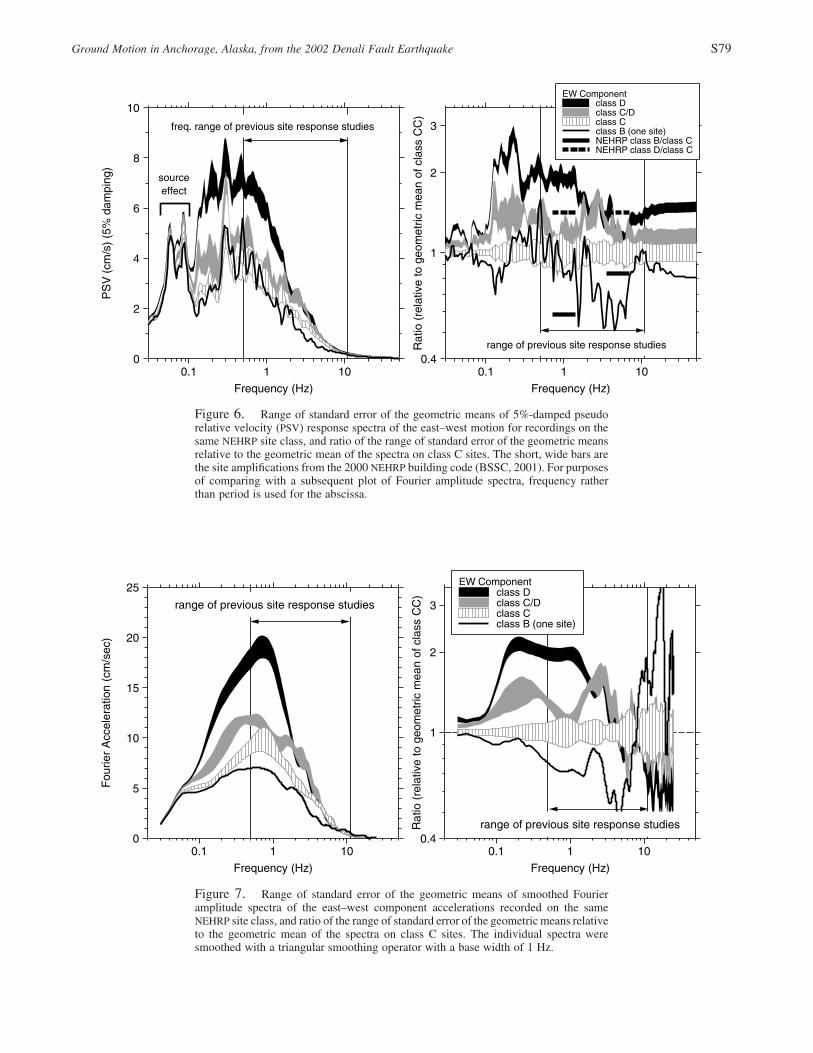
NEHRP classes are also an effective way of groupingthe amplifications given both by response spectra (Fig. 6)and by Fourier spectra (Fig. 7), and more information aboutthe periods corresponding to the site amplifications are givenby such amplifications than in amplifications correspondingto peak ground acceleration, velocity, and displacement. Aswith the ratios of peak motions, the amplifications shown inFigures 6 and 7 are clearly separated by site class. At fre-quencies less than about 2 Hz the amplification is largest forsite class D, and the deamplification at higher frequencies isalso largest for site class D. This is qualitatively expected asthe result of the trade-off between increased amplificationand increased attenuation for the lower-velocity materialscharacterizing class D sites. Of particular interest are thelarge site amplifications at periods much longer than used inprevious studies of site amplification in Anchorage (therange of the previous studies is shown by the double-sidedarrows in Figures 6 and 7); these amplifications persist to
periods of about 14 sec and are observable because of therelatively large radiation at long periods for the Denali faultearthquake. Comparisons are given in Figure 6 of the ob-served amplification with those in the 2000 NEHRP buildingcode. Although the increase or decrease relative to unity isthe same for the observed and the NEHRP amplifications, thevalues of the amplifications are in poor agreement with thelonger-period motions at both class D and class B sites, be-ing underpredicted by the NEHRP code relative to motionson class C sites (class D relative to class C at short periodsbeing an exception).
Although engineers often characterize site response asratios of response spectra, caution is needed in the interpre-tation of response spectral amplifications, particularly atshort oscillator periods where the actual ground motion maybe devoid of energy. Because the short-period asymptote ofa response spectrum is controlled by the peak ground accel-eration, the ratios of response spectra at short periods willequal the ratios of the peak accelerations, and the apparentamplification may not represent true high-frequency ground-

Ground Motion in Anchorage, Alaska, from the 2002 Denali Fault Earthquake S77
Figure 4. Accelerations, velocities, and displacements at stations K2-20 and K2-16for the east–west component.
motion amplification if the peak accelerations are controlledby frequencies less than the oscillator frequencies. In thepresent results this is clearly seen by comparing the responsespectral and Fourier spectral amplifications at frequenciesabove about 8 Hz (Figs. 6, 7). The class C/D and class Dresponse spectra show an apparent amplification at higherfrequencies, consistent with the peak acceleration ratiosshown in Figure 5. But they should not be interpreted asindicating greater site amplification at high frequencies forlower-velocity sites. In fact, as Figure 7 shows, the oppositeis true: there is a deamplification at frequencies greater than8 Hz for class D sites.
Spatial Variation
The previous figures showing site amplifications havelargely dealt with amplifications within site classes. But whatof spatial variation? Given the relatively large number ofstations in the Anchorage area, and the nonrandom distri-
bution of site classes, it is possible to construct a map of siteamplifications. This has been done for amplifications of mo-tions at four frequencies, ranging from 0.2 to 14 Hz; theresults are shown in Figure 8. Although some of the variationis clearly controlled by a single station, these maps showsystematic trends not captured by simply looking at ampli-fications in a site class. In particular, note the increase ofamplification toward the west for low-frequency motions.The trend for the 0.2 Hz motions roughly corresponds toincreasing depth to bedrock. The spatial variations at higherfrequencies may be due to local variations in near-surfacegeology, as discussed in some detail by Dutta et al. (2001),Martirosyan et al. (2002, 2004), Nath et al. (2002), and Duttaet al. (2003).
Comparison with Previous Studies
For periods common both to previous studies and to thisstudy I made quantitative comparisons of the site amplifi-

S78 D. M. Boore
0.5
1
1.5
2
2.5
PG
A(s
tatio
n)/P
GA
(C) class B
class Cclass C/Dclass D
0.5
1
1.5
2
2.5
PG
V(s
tatio
n)/P
GV
(C) class B
class Cclass C/Dclass D
0.5
1
1.5
2
2.5
PG
D(s
tatio
n)/P
GD
(C) class B
class Cclass C/Dclass D
Figure 5. Peak accelerations, velocities, and dis-placements, relative to the geometric mean of motionson class C sites, grouped by site class. All motionsare oriented east–west.
cations. Figure 9 shows a comparison of site amplificationfrom Martirosyan et al. (2002) at two stations, relative toK2-16. The amplification has been computed both from Fou-rier spectra and response spectra. Focusing only on the Fou-rier spectra amplification, the comparison is relatively goodfor station K2-01 in that the frequencies of amplificationpeaks coincide, as does the general level of amplification.The comparison for K2-02 is not as good, particularly above2 Hz. Figure 10 shows another comparison, in this case ofaverages of Fourier spectra over two frequency bands. Theamplifications are more compatible for the lower-frequencyband (0.5–2.5 Hz) than for the higher-frequency band (3.0–7.0 Hz), although there is much scatter within each band. Itis not surprising to see this scatter, as many studies findsignificant event-to-event variation for a single station pairand station-to-station variation for a single event (see, e.g.,the review by Boore, 2004).
Displacement Pulses
Comparison with Pulses from 1999 Hector Mine,California, Earthquake
One of the interesting features of the recordings in An-chorage is the displacement pulses. This section discusses afew things associated with these pulses: the differing fre-quency content of the pulses, the similarity to pulses from asmaller earthquake occurring in California, and the contri-bution of the pulses to the long-period response spectralshape.
As noted before, the maximum accelerations are asso-ciated with pulse 2. The consequence of this is clearly seenby comparing response spectra for the whole record withthose computed for the portions of the records correspondingto the two largest displacement pulses (pulses 2 and 3). Theresults are shown in Figure 11 for stations K2-20 and K2-16. Nearly all of the response at periods shorter than 1 secand 4 sec is contributed by pulse 2 for stations K2-20 andK2-16, respectively, but both pulses contribute essentiallyequally to the peak in the spectra between 10 and 20 sec.The richness of high-frequency radiation of subevent 1 (cor-responding to pulse 2) relative to subevents 2 and 3 wasnoted by Frankel (2004); my results illustrate the same con-clusion using a different measure of ground motion.
I was struck with the similarity of the displacementpulses in Anchorage from the M 7.9 Denali fault earthquakewith the pulse radiated by the M 7.1 1999 Hector Mine,California, earthquake (see Boore et al., 2002). To make aquantitative comparison of the pulses, two copies of a rep-resentative pulse from the Hector Mine earthquake are su-perposed on the K2-03 record of the Denali fault earthquakein Figure 12. The Hector Mine motion is the transverse dis-placement from a station at an azimuth approximately nor-mal to the strike-slip faulting in the Hector Mine earthquake(see Fig. 1 by Boore et al., 2002); the displacement pulsewas shifted to match the arrival times of the Denali earth-quake pulses, and its amplitude was multiplied by 0.38 tocorrect for differences in propagation distances. The factorof 0.38 was obtained by evaluating the ground-motion pre-diction equations of Sadigh et al. (1997) for magnitude 7.1and for the closest source-to-station distances for the 1999and 2002 earthquakes. The Sadigh et al. (1997) equationswere chosen because they were used by Wesson et al. (1999)in constructing probabilistic hazard maps for Alaska. Theacceleration times series leading to the displacements wereprocessed in identical ways for both earthquakes (note thatthe results of Boore et al., 2002, used a causal low-cut filterrather than the acausal low-cut filter used here; the displace-ment waveforms can be quite different for the two types offilters). The waveforms and amplitudes for the two eventsare similar, consistent with the finding of Frankel (2004) thatpulses 2 and 3 correspond to subevents of moment magni-tude similar to that of the 1999 earthquake (7.1 and 7.0,compared to 7.1 for the Hector Mine earthquake). Although
Ground Motion in Anchorage, Alaska, from the 2002 Denali Fault Earthquake S79
0.1 1 100
2
4
6
8
10
Frequency (Hz)
PS
V(c
m/s
)(5
%da
mpi
ng)
freq. range of previous site response studies
0.1 1 100.4
1
2
3
Frequency (Hz)
Rat
io(r
elat
ive
toge
omet
ricm
ean
ofcl
ass
CC
)
EW Componentclass Dclass C/Dclass Cclass B (one site)NEHRP class B/class CNEHRP class D/class C
range of previous site response studies
sourceeffect
Figure 6. Range of standard error of the geometric means of 5%-damped pseudorelative velocity (PSV) response spectra of the east–west motion for recordings on thesame NEHRP site class, and ratio of the range of standard error of the geometric meansrelative to the geometric mean of the spectra on class C sites. The short, wide bars arethe site amplifications from the 2000 NEHRP building code (BSSC, 2001). For purposesof comparing with a subsequent plot of Fourier amplitude spectra, frequency ratherthan period is used for the abscissa.
0.1 1 100
5
10
15
20
25
Frequency (Hz)
Fou
rier
Acc
eler
atio
n(c
m/s
ec)
range of previous site response studies
0.1 1 100.4
1
2
3
Frequency (Hz)
Rat
io(r
elat
ive
toge
omet
ricm
ean
ofcl
ass
CC
)
EW Componentclass Dclass C/Dclass Cclass B (one site)
range of previous site response studies
Figure 7. Range of standard error of the geometric means of smoothed Fourieramplitude spectra of the east–west component accelerations recorded on the sameNEHRP site class, and ratio of the range of standard error of the geometric means relativeto the geometric mean of the spectra on class C sites. The individual spectra weresmoothed with a triangular smoothing operator with a base width of 1 Hz.

S80 D. M. Boore
Figure 8. Maps of site amplifications in the sediments to the west of the ChugachMountains, relative to the geometric mean of motions on class C sites (the brown areashows the location of the Chugach Mountains; it is not site response). The amplifica-tions were smoothed over short frequency intervals surrounding the center frequenciesof 0.2, 1.0, 5.0, and 14.0 Hz. The stations used in constructing the map are shown bytriangles; they are included to help in judging if amplification patterns are controlledby a single station (as is the case for the high amplifications near the Chugach Moun-tains for 14 Hz).
the displacement pulses are similar, close inspection showsthat the pulses from the Denali fault earthquake have a some-what longer duration. This leads to relatively more long-period content in the response spectra for the Denali faultmotions (Fig. 13), although for both earthquakes the dis-placement response spectra are peaked for periods longerthan 10 sec. It is important to note that the peaks are mostlikely due to the source and not to local site response. Arethe large, long-period motions affected by source directivity(e.g., Somerville et al., 1997)? Probably not, at least for theHector Mine recording and pulses 2 and 3 for the Anchoragerecordings from the Denali fault earthquake. In these casesthe angle between the direction of fault rupture and the di-rection from the fault to the station is close to 90�, adirectivity-neutral direction (the angle from the rupture di-rection to station K2-16 is 96� and 121� from subevents 2and 3, respectively). The azimuth to Anchorage from sub-event 1 is 66� from the strike of the subevent, but Frankel(2004) modeled the subevent as a point source, with no rup-
ture propagation. For this reason I cannot assess the relativeimportance of directivity for displacement pulse 2.
Pulses, Displacement Spectra, and Code Spectra
The relatively broad peaks in the displacement responsespectra from about 8 to 15 sec is a feature not included inmost spectra used for engineering design (e.g., Bommer andElnashai, 1999). Many code spectra assume an increasewithout limit at long periods, whereas others impose a con-stant level for periods longer than about 2 to 4 sec. As shownby the comparisons in Figure 14, neither assumption is inagreement with the spectra in Anchorage from the Denalifault earthquake (and with reference to Fig. 13, the HectorMine earthquake). Of course the observation of enhancedsource-related long-period peaks in response spectra fromonly two earthquakes is not enough to produce a change inschemes for constructing engineering design spectra. Recentstudies of data from the increasing number of modern broad-

Ground Motion in Anchorage, Alaska, from the 2002 Denali Fault Earthquake S81
0.1 0.2 1 2 10
1
2
34
Frequency (Hz)
Am
plifi
catio
n
Martirosyan et al., from RSMartirosyan et al., from FSDenali, from RSDenali, from FS
K2-01/K2-16
0.1 0.2 1 2 10
1
2
34
Frequency (Hz)
Martirosyan et al., from RSMartirosyan et al., from FSDenali, from RSDenali, from FS
K2-02/K2-16
Figure 9. Site response at nearby stations K2-01 and K2-02, relative to K2-16,computed from Fourier amplitude spectra (FS) and response spectrum (RS). (K2-01 issite class D, whereas K2-02 is site class C/D). Shown are the site responses from theDenali fault earthquake ground motion and from the averages of 46 events, as deter-mined by Martirosyan et al. (2002) (rms of the two horizontal components). The east–west component of motion was used for the Denali fault earthquake recordings. TheFourier spectra were smoothed before computing the ratios.
0.5 1 1.5 2 2.5 30.5
1
1.5
2
2.5
3
From Martirosyan et al. (2002)
Fro
mD
enal
iFau
ltea
rthq
uake
,rec
orde
din
Anc
hora
ge
Site response, relative to K2-16avg FAS: 0.5--2.5 Hz (0.4--2.0 s)avg FAS: 3.0--7.0 Hz (0.14--0.33 s)
Figure 10. Comparison of site responses (relativeto station K2-16) from smoothed Fourier amplitudespectra (FAS), as determined from the Denali faultearthquake data (east–west component) and fromMartirosyan et al. (2002) (rms of the two horizontalcomponents).
band digital recorders, as well as simulations of ground mo-tion, have led to the introduction of a transition period in the2003 NEHRP code that determines where the design spectraldisplacement becomes flat. This transition period is amapped quantity and varies spatially in a way that roughlydepends on the magnitude of the dominant earthquake for agiven location determined from disaggregation of a proba-bilistic seismic hazard map. The transition period is 16 secfor recordings in Anchorage and 8 sec for the Hector Minerecording. Using the new code to construct the design mo-tions for Anchorage results in a spectrum remarkably similarto the observed spectrum (Fig. 14), and the agreement withthe Hector Mine spectrum, although not shown, would beequally good (the Anchorage recordings of the Denali faultearthquake were not used in constructing the transition-period maps (C. B. Crouse, personal comm., 2004)).
Summary
This purely observational study of digital strong-motiondata from the 2002 Denali fault earthquake recorded in andnear Anchorage, Alaska, finds a number of systematic fea-tures in the ground motion. In agreement with previous stud-ies, the data show significant ground-motion amplification.The amplifications are well differentiated by NEHRP siteclass, with the class D amplification exceeding a factor of 2relative to an average of motions on class C sites. New tothis study is the finding that the site amplification extends toperiods of at least 10 sec.

S82 D. M. Boore
0.1 1 10 1000
2
4
6
8
10
12
Period (s)
PS
V(c
m/s
)(5
%da
mpi
ng)
K2-20: EW Comp.whole recordpulse 2pulse 3
0.1 1 10 1000
1
2
3
4
5
6
Period (s)
K2-16: EW Comp.whole recordpulse 2pulse 3
Figure 11. 5%-damped pseudo relative velocity (PSV) response spectrum for theeast–west component at stations K2-20 and K2-16, from the whole record and fromwindows that include separately the two large displacement pulses (pulses 2 and 3 inFig. 2). The portions of the accelerograms have different influences on the responsespectra. From the acceleration trace (Fig. 4), it is clear that most of the energy at highfrequencies is carried in pulse 2, so the response spectra from that pulse is essentiallyequal to the whole record response spectrum at shorter periods. Conversely, for thisrecord pulses 2 and 3 contribute about equally to the longer-period response.
1 10 100
0.1
0.2
1
2
10
20
Period (s)
SD
(cm
)(5
%da
mpi
ng)
Denali: class C/DDenali: class CHector Mine, station 596
Figure 13. Displacement response spectrum (SD)for the Denali fault earthquake recordings and for thetransverse component of the 1999 Hector Mine, Cali-fornia, earthquake (after dividing the Hector Minespectrum by 2.6 to correct for the different distancesto the earthquakes). All records were low-cut filteredwith a low-order acausal butterworth filter with a cor-ner at 0.02 Hz (the filter response goes as f 4 for lowfrequencies).
50 100 150
-5
0
5
10
Time (s)
Dis
plac
emen
t(c
m)
Denali Fault eq (M 7.9), sta. K2-03, EW comp.Hector Mine eq (M 7.1), sta. 596, trans. comp.As above, repeated with time shift
Figure 12. East–West displacements from stationK2-03 from the Denali fault earthquake. Super-imposed are two copies, shifted in time, of the trans-verse displacements from the instrument 596 record-ing of the Hector Mine (HM) earthquake. The HMmotions have been divided by 2.6 to correct for thedifferent distances to the earthquakes. The factor of2.6 came from the ground-motion prediction equa-tions of Sadigh et al. (1997). All records were low-cut filtered with a low-order acausal butterworth filterwith a corner at 0.02 Hz (the filter response goes asf 4 for low frequencies).

Ground Motion in Anchorage, Alaska, from the 2002 Denali Fault Earthquake S83
0.1 1 10 1000.001
0.01
0.1
1
10
Period (s)
SD
(cm
)(5
%da
mpi
ng)
Denali: class C/DDenali: class CNEHRP: 2000 (fit to SD at 1.0 sec)NEHRP: 2003 (fit to SD at 1.0 sec)Eurocode 8 (fit to SD at 1.0 sec)
PGD
Figure 14. Comparison of observed displacementresponse spectrum (SD) for class C/D and C sites inAnchorage to the spectra constructed following theprocedures for the following building codes: 2000NEHRP (BSSC, 2001), 2003 NEHRP (BSSC, 2004),and Eurocode 8 (CEN, 1998). Also shown is the peakground displacement (PGD) for the Anchorage mo-tions; the displacement response spectrum will byasymptotic to this value at suffciently long periods.For NEHRP, the mapped values of spectral responseat 0.2 and 1.0 sec were used, but to emphasize theshape, the spectra for the three codes have been nor-malized to a representative value of the data at 1.0 sec.
The long-period ground displacements are characterizedby a series of distinct pulses, corresponding to the subeventsalong the fault identified in source inversion studies (e.g.,Frankel, 2004). The two largest pulses are similar in shapeand amplitude to the pulse radiated by the 1999 Hector Mine,California, earthquake. The moment magnitude of that earth-quake (7.1) is similar to the moment magnitudes inferred forsubevents 1 and 2 of the Denali fault earthquake (7.1 and7.0, respectively [Frankel, 2004]). These pulses produce alocalized long-period peak in response spectra, with the peakfor the Denali recordings being at a somewhat longer periodthan for the Hector Mine earthquake recordings. The pulseshave polarizations that are similar for all stations and showa systematic clockwise rotation from pulse 2 to pulse 4, con-sistent with SH waves radiated from localized sources alongthe fault progressively to the east of the hypocenter. As notedby Frankel (2004), most of the high-frequency motion iscarried by the S-wave pulse from subevent 1; the other sub-events apparently radiated relatively little high-frequencyenergy. The design spectra from the well-known 2000NEHRP and the Eurocode 8 building codes disagree with thedisplacement response spectrum from both the Hector Mineand the Denali fault earthquakes in completely differentways: the 2000 NEHRP displacement spectrum increases
without limit, whereas the Eurocode 8 displacement spec-trum is constant or decreases for periods longer than 2 sec;the observed spectra for the two earthquakes studied hereflatten at periods slightly in excess of 10 sec. The Denalifault spectrum is, however, in good agreement with the re-cently adopted 2003 NEHRP building code.
Acknowledgments
I am greatly indebted to Chris Stephens for providing data and in-sightful conversations and to Rod Combellick, Utpal Dutta, and Artak Mar-tirosyan for sending me important information about stations and geology.I also thank Art Frankel for some of his results in advance of publicationand Julian Bommer and E. V. Leyendecker for information regarding theEurocode 8 and 2003 NEHRP codes, respectively. Reviews by Art Frankel,Artak Martirosyan, Charlotte Rowe, Chris Stephens, and two anonymousreviewers were very helpful.
References
Bommer, J. J., and A. S. Elnashai (1999). Displacement spectra for seismicdesign, J. Earthquake Eng. 3, 1–32.
Boore, D. M. (1999). Basin waves on a seafloor recording of the 1990Upland, California, earthquake: implications for ground motions froma larger earthquake, Bull. Seism. Soc. Am. 89, 317–324.
Boore, D. M. (2004). Can site response be predicted? J. Earthquake Eng.8, Special Issue 1, 1–41.
Boore, D. M., C. D. Stephens, and W. B. Joyner (2002). Comments onbaseline correction of digital strong-motion data: examples from the1999 Hector Mine, California, earthquake, Bull. Seism. Soc. Am. 92,1543–1560.
Building Seismic Safety Council (BSSC) (2001). NEHRP RecommendedProvisions for Seismic Regulations for New Buildings and OtherStructures, 2000 Edition, Part 1: Provisions, report prepared by theBuilding Seismic Safety Council for the Federal Emergency Man-agement Agency (Report No. FEMA 368), Washington, D.C. Avail-able from www.bssconline.org/NEHRP2000/comments/provisions/(last accessed December 2004).
Building Seismic Safety Council (BSSC) (2004). NEHRP RecommendedProvisions for Seismic Regulations for New Buildings and otherStructures, 2003 Edition, Part 1: Provisions; Part 2: Commentary,report prepared by the Building Seismic Safety Council for the Fed-eral Emergency Management Agency (Report No. FEMA 450),Washington, D.C. Available from www.bssconline.org/ (last accessedDecember 2004).
Dutta, U., N. Biswas, A. Martirosyan, S. Nath, M. Dravinski, A. Papa-georgiou, and R. Combellick (2000). Delineation of spatial variationof shear-wave velocity with high frequency Rayleigh wave, Geophys.J. Int. 143, 365–376.
Dutta, U., N. Biswas, A. Martirosyan, A. Papageorgiou, and S. Kinoshita(2003). Estimation of earthquake source parameters and site responsein Anchorage, Alaska, from strong-motion network data using gen-eralized inversion method, Phys. Earth Planet. Interiors 137, 13–29.
Dutta, U., A. Martirosyan, N. Biswas, A. Papageorgiou, and R. Combellick(2001). Estimation of S-wave site response in Anchorage, Alaska,from weak-motion data using generalized inversion method, Bull.Seism. Soc. Am. 91, 335–346.
Eberhart-Phillips, D., P. J. Haeussler, J. T. Haeussler, J. T. Freymueller,A. D. Frankel, C. M. Rubin, P. Craw, N. A. Ratchkovski, G. Ander-son, G. A. Carver, A. J. Crone, T. E. Dawson, H. Fletcher, R. Hansen,E. L. Harp, R. A. Harris, D. P. Hill, S. Hreinsdottir, R. W. Jibson,L. M. Jones, R. Kayen, D. K. Keefer, C. F. Larsen, S. C. Moran, S. F.Personius, G. Plafker, B. Sherrod, K. Sieh, N. Sitar, and W. K. Wal-lace (2003). The 2002 Denali fault earthquake, Alaska: a large mag-nitude, slip-partitioned event, Science 300, 1113–1118.

S84 D. M. Boore
European Committee for Standardization (CEN) (2002). Eurocode 8: De-sign of structures for earthquake resistance, Draft No. 5, CEN DocCEN/TC250/SC8/N317 (prEN 1998-1:200X), Brussels.
Frankel, A. (2004). Rupture process of the M 7.9 Denali fault, Alaska,earthquake: Subevents, directivity, and scaling of high-frequencyground motions, Bull. Seism. Soc. Am. 94, no. 6B, S234–S255.
Hartman, D. C., G. H. Pessel, and D. L. McGee (1974). Stratigraphy of theKenai group, Cook Inlet, Alaska Div. Geol. Geophys. Surv. Open-FileRept. 49. Available at www.dggs.dnr.state.ak.us/pubs/pubs?reqtype�citation&ID�149 (last accessed December 2004).
Martirosyan, A., and N. Biswas (2002). Site response at a rock site inAnchorage, Alaska from borehole strong-motion records (abstract),Seism. Res. Lett. 73, 267.
Martirosyan, A., N. Biswas, U. Dutta, D. Cole, and A. Papageorgiou (2004).Ground motion analysis in the Anchorage basin: 1-D approach, J.Earthquake Eng. 7, 251–274.
Martirosyan, A., U. Dutta, N. Biswas, A. Papageorgiou, and R. Combellick(2002). Determination of site response in Anchorage, Alaska, on thebasis of spectral ratio methods, Earthquake Spectra 18, 85–104.
Nath, S. K., D. Chatterjee, N. N. Biswas, M. Dravinski, D. A. Cole, A.Papageorgiou, J. A. Rodriguez, and C. J. Poran (1997). Correlationstudy of shear-wave velocity in near-surface geological formations inAnchorage, Alaska, Earthquake Spectra 13, 55–75.
Nath, S. K., N. N. Biswas, M. Dravinski, and A. S. Papageorgiou (2002).Determination of S-wave site response in Anchorage, Alaska, in the1–9 Hz frequency band, Pure Appl. Geophys. 159, 2673–2698.
Sadigh, K., C.-Y. Chang, J. A. Egan, F. Makdisi, and R. R. Youngs (1997).Attenuation relationships for shallow crustal earthquakes based onCalifornia strong motion data, Seism. Res. Lett. 68, 180–189.
Somerville, P. G., N. F. Smith, R. W. Graves, and N. A. Abrahamson(1997). Modification of empirical strong ground motion attenuationrelations to include the amplitude and duration effects of rupture di-rectivity, Seism. Res. Lett. 68, 199–222.
Wesson, R. L., A. D. Frankel, C. S. Mueller, and S. C. Harmsen (1999).Probabilistic seismic hazard maps of Alaska, U.S. Geol. Surv. Open-File Rept. 99-36, 20 pp.
U.S. Geological Survey, MS 977345 Middlefield RoadMenlo Park, California [email protected]
Manuscript received 7 January 2004.