greenpoint-williamsburg rezoning eis
TRANSCRIPT
16-1
Greenpoint-Williamsburg Rezoning EIS
CHAPTER 16: TRAFFIC AND PARKING
A. INTRODUCTION
This chapter of the EIS describes the traffic and parking characteristics and potential impacts associated
with the proposed action, which affects an approximately 184-block area in Greenpoint and Williamsburg,
bounded generally by Newtown Creek to the north, the East River to the west, the Williamsburg Bridge
to the south, and McGuinness Boulevard and the Brooklyn-Queens Expressway to the east (see Figure
1-1 in Chapter 1, “Project Description”). As described in detail in earlier chapters of this EIS, the
proposed action would allow existing manufacturing zoning and special mixed use district designations
to be changed to permit residential use on the waterfront, residential and mixed use on most of the upland
area, and to restrict certain areas currently zoned M3 to light industrial uses. Additionally, under Scenario
A, the worst case transportation condition, a 27.8 acre waterfront park would be mapped to the west of
Kent Avenue from Bushwick Inlet on the north to North 9 Street on the south.th
Typically, CEQR assessments of large area-wide zoning proposals not associated with specific
development projects assume a 10-year build period. This is the time frame that can be reasonably
predicted into the foreseeable future without engaging in highly speculative projections. Thus, the
transportation analyses in this EIS address a development program that could reasonably be constructed
by 2013 as described in the reasonable worst case development scenario (RWCDS) section of Chapter
1. The traffic and parking analyses consider auto, taxi and truck trips, as well as parking demand and
changes in supply related to these “projected” development sites. The locations of these sites and their
anticipated uses are shown in Figure 1-6 and listed in Table 1-1 in Chapter 1.
The study area selected for the traffic analysis is shown in Figure 16-1. The study area was selected to
encompass the principal roadways most likely to be used by the majority of persons and goods traveling
by vehicle to and from the projected development sites. The traffic study area is bounded on the north by
Newtown Creek, on the south by Broadway, on the west by the East River, and on the east by
McGuinness Boulevard, Meeker Avenue, and Union Avenue. Seventy-four intersections are analyzed for
vehicular traffic for the weekday 8:00-9:00 AM, 12:00-1:00 PM (midday) and 5:00-6:00 PM peak hours,
the periods when demand from these predominantly residential development sites would be heaviest. Of
these intersections, 31 are signalized and 43 are unsignalized.
This chapter describes in detail the existing traffic and parking conditions in the study area. Future
conditions in the year 2013 without the proposed action (the No-Action condition) are then determined,
including additional transportation-system demand and any changes in the roadways and parking supply
expected by the year 2013. The increase in travel demand resulting from the proposed action is then
projected and added to the No-Action condition to develop the 2013 future with the proposed action (the
With-Action condition). Significant adverse impacts from project generated trips are then identified.

Greenpoint-Williamsburg Rezoning EIS Chapter 16: Traffic and Parking
16-2
B. EXISTING CONDITIONS
Data Collection
Manual turning movement counts were conducted at 66 locations in the Greepoint and Williamsburg
study areas in June, 2002, with the remaining eight counted in September, 2002. Vehicle classification
counts and speed surveys were also conducted at that time, as were field surveys of parking regulations,
lane configurations and other physical and operational characteristics of the street network. In addition,
ATR (Automatic Traffic Recorder) counts were conducted at key locations along major roadway
corridors. A one percent background growth rate was applied to data collected in 2002 to reflect base year
2003 conditions for this EIS. Signal timing plans for signalized intersections within the study area were
obtained from the New York City Department of Transportation (NYCDOT) where available. Subsequent
to publication of the DEIS, an updated signal timing plan for the intersection of Greenpoint Avenue and
McGuinness Boulevard was provided by NYCDOT, and the analysis of this intersection has been revised
to reflect this updated data. Weekday on-street parking utilization within ¼-mile of the proposed action
area was surveyed in June 2002, and supplemented with additional data collected in June 2004.
The New York City Department of Design and Construction (NYCDDC) is proposing to undertake a
major capital project (HWK693W) on behalf of NYCDOT to reconstruct Kent Avenue/Franklin Street
in Williamsburg and Greenpoint. The project is approximately three miles in length from the Brooklyn-
Queens Expressway to the south to Commercial Street at the north end of Franklin Street. In conjunction
with that project, this EIS coordinated detailed traffic data collection and balanced transportation
networks along the corridor at approximately 54 intersections. The 2003 existing conditions data in this
EIS reflects the 2002 network from the NYCDDC project expanded by one percent to reflect background
growth for the single year. Further, as will be discussed later in this chapter, the future No-Action
conditions reflect NYCDOT traffic improvements that are expected to be implemented by NYCDDC as
part of that reconstruction project.
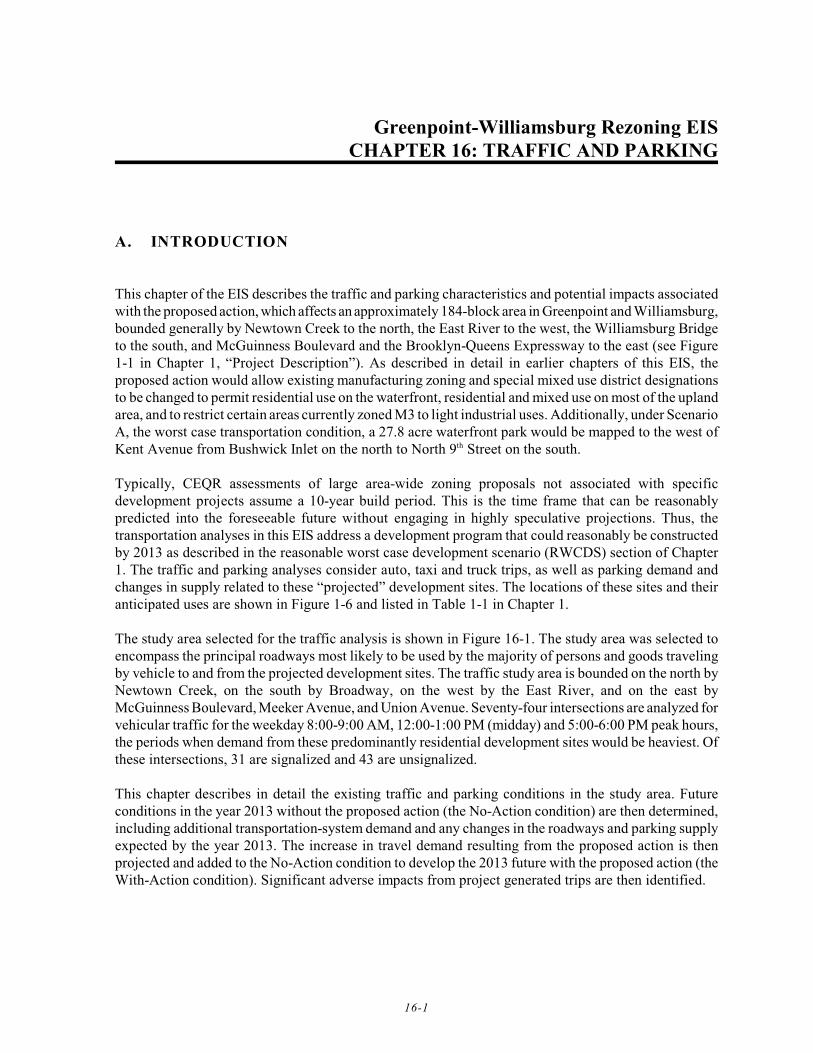
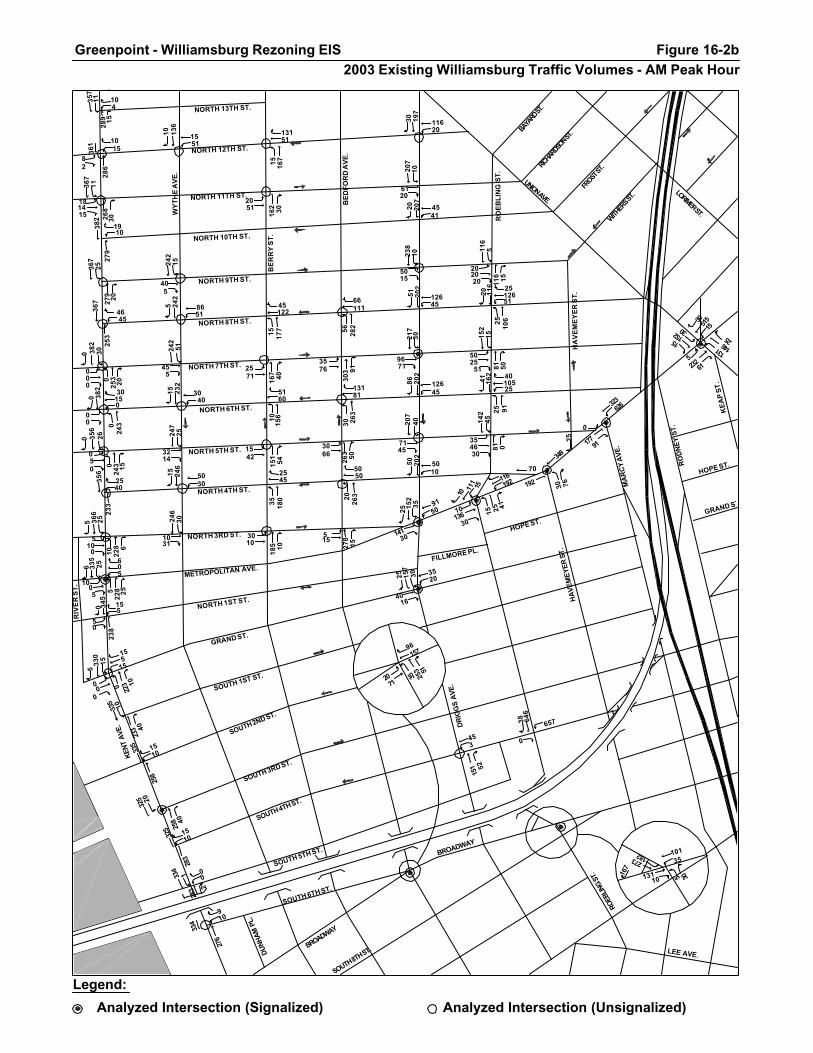
Figures 16-2 through 16-4 show the 2003 base traffic volumes in the AM, midday, and PM peak hours,
respectively.
Vehicular Traffic
Study Area Street Network
The project study area encompasses two street networks: that of Greenpoint to the north, and
Williamsburg to the south, separated roughly by North 14 Street. The areas within one block to the eastth
and west of Manhattan Avenue are primarily residential, while the area west of Franklin Street contains
a mix of industrial and residential buildings, and the area east of McGuinness Boulevard is characterized
by light and heavy industrial uses. The street network runs north-south and east-west and primarily carries
local traffic; major arterials through Greenpoint are McGuinness Boulevard, which connects northern
Brooklyn with Long Island City via the Pulaski Bridge, and Franklin Street/Kent Avenue, which links
Greenpoint with Williamsburg to the south. Manhattan Avenue and Greenpoint Avenue are heavily-used
local arterials within the study area.


ASH ST.
BOX ST.
CLAY ST.
DUPONT ST.
EAGLE ST.
FREEMAN ST.
GREEN ST.
HURON ST.
INDIA ST.
KENT ST.
JAVA ST.
COMMERCIAL ST.
GREENPOINT AVE.
PAIDGE AVE.
MILTON ST.
NOBLE ST.
WE
ST
ST
.P
RO
VO
ST
ST
.
MC
GU
INN
ES
S B
LV
D.
OAK ST.
QUAY ST.
CLIFFO
RD
PL.
GU
ER
NS
EY
ST.
LOR
IME
R S
T.
MA
NH
ATTA
N A
VE.
LEO
NA
RD
ST.
EC
KFO
RD
ST.
NE
WE
L ST.
DIA
MO
ND
ST.
JEW
EL S
T.
MO
ULTR
IE S
T.
BA
NK
ER
CALYER ST.
MESEROLE AVE.
3516235
25 121
30
30 152 61
20172
20
4517296
81 944
45
5111
77 45
81116
45
1045 40
1202 6671
12661
351113571 10
35
3512
33
4556116
8 170
29
17 167
123
56017
511020
3 10 55
10 25 17
510
0
5 68 1510 61 10
550
10 65 10
10 61 10
555
10035
0 45
5 61
55
0 35 510 36 30
01010
540
36
152
10
136
66
515
5
153041
5 121
10 131
116
30
45 101
53010
75 10
35 25
3155
10035
5 40
10 56
510
540
10 61
15 5
152
40
192
45
205120
121
30
141
86
209051
86 10
136 35
5530
81 15
91 35
151015
990
30
1242 81
812530
1101
51
1379 20
1412045
45 15
40 30
52535
4515
10 5
15 20 10
3546
30
25 217
126
7622
766
7620
2535
25
192151
1 156
718
3
19920
15 284
34 326
217
7
10613
0 7066
55
202576
10 7010 40
192
1518
532
51015
291
1230
6 39
6
2
39
304
2125
333
101010
10 86
25 116
457645
10 106
12635
40
30
10 162
25 187
51
40
20
10 162
35 197
46
1
8
MEEKER AVE.
MEEKER AVE.
(EAST-BOUND)
(WEST-BOUND)
BROOKLYN-QUEENS
EXPRESSWAY
MCGUINESS
BLVD.
126424
5
10288
96217
682157
6154525
75751
HERBERT ST.
GRAHAM AVE.
LE
ON
AR
D S
T.
MANHATTAN AVE.
DRIGGS AVE.
91237
7645
9610
FR
AN
KL
IN S
T.
ST.
GE
M S
T.
NORTH 15TH ST.
362
791
294
53136
8
270
1135
7
289
15
104
Figure 16-2a 2003 Existing Greenpoint Traffic Volumes - AM Peak Hour
Greenpoint - Williamsburg Rezoning EIS
Legend:
Analyzed Intersection (Signalized) Analyzed Intersection (Unsignalized)
NORTH 13TH ST.
NORTH 12TH ST.
NORTH 11TH ST.
NORTH 10TH ST.
NORTH 9TH ST.
NORTH 8TH ST.
NORTH 7TH ST.
NORTH 6TH ST.
NORTH 5TH ST.
NORTH 4TH ST.
NORTH 3RD ST.
NORTH 1ST ST.
METROPOLITAN AVE.
WY
TH
E A
VE
.
BE
RR
Y S
T.
BE
DF
OR
D A
VE
.
RO
EB
LIN
G S
T.
HA
VE
ME
YE
R S
T.
UNION AVE.
BAYA
RD ST
.RIC
HARD
SON S
T.
FROST
ST.
WITH
ERS S
T.
LORIMER ST.
GRAND ST
HOPE ST.
MA
RC
Y A
VE
.
RO
DN
EY
ST.
KE
AP
ST
.
HOPE ST.
GRAND ST.
SOUTH 1ST ST.
SOUTH 2ND ST.
SOUTH 3RD ST.
FILLMORE PL.
SOUTH 4TH ST.
SOUTH 5TH ST.
LEE AVE.
BROADWAY
ROEB
LING
ST.
SOUTH 8TH ST.BROADWAY
DU
NH
AM
PL.
SOUTH 6TH ST.
HA
VE
ME
YE
R S
T.
DR
IGG
S A
VE
.
KEN
T A
VE.
RIV
ER
ST
.
116192
1011
115
15 25 4110136
30
30 76
348
192
915025 15
235
14130
626
17791
323
30515
1515
15230
13114625
523261
207
40
7145
217
30
9671
238
10
5015
11620
30 197
5050
2026
3
13181
30 263
66111
56 282
185 10
3010
151
54
1542
167 40
2571
162 30
2051
242
15
405
8651
5 242
3040
15 232
5030
15 246
13151
15 167
367
2527
9 20
382
300
253
4645
367
253
382
243
30
0
0
356
233
2540
366
2510 22
8
5
6
335
25
522
8
6
25
05
330
15
223
5
10
155
15
325 20
258 40
334
276
910
2071
13110 5 30
10135
167
273 182
82
361
286
1015
268
30
367
11
181415
382
279
1910
356
26
243 15
352025 15
730
4016
35 253 51
1551
136
10
0
000
150
00
200
50
510
0
10
5
000
0
15796
0
0
6
2
11357
289 15
104
455
242
51
3214
247
25
1031
246
30
2545
35 180
5160
1015
6
45122
15 177
345
515
2380
5
233 40
10335
1015
258
335
325
283
1015
334
128
3 2
151 52
345
207
10
6120
4541
20 207
12645
51 202
12645
86 202
5010
50 202
303 91
3576
263 50
3066
278
15
515
116 15
202020
116
525
106
20 116
12651
25
81 50
5025
51
152
1525 91
41 162
10525
40
81
142
45
354630
38 646
657
0
0
0
0
00
70
25
0
Analyzed Intersection (Signalized)
Legend:
Analyzed Intersection (Unsignalized)
2003 Existing Williamsburg Traffic Volumes - AM Peak Hour Figure 16-2bGreenpoint - Williamsburg Rezoning EIS
FR
AN
KL
IN S
T.
ST.
GE
M S
T.
NORTH 15TH ST.
346
533
277
3335
17
145
1027
2
353
15
55
LE
ON
AR
D S
T.
MANHATTAN AVE.
DRIGGS AVE.
7661
10115
146157
MEEKER AVE.
MEEKER AVE.
(EAST-BOUND)
(WEST-BOUND)
BROOKLYN-QUEENS
EXPRESSWAY
MCGUINESS
BLVD.
116
4445
15328
131217
465
81419
20
55625
HERBERT ST.
GRAHAM AVE.
107
ASH ST.
BOX ST.
CLAY ST.
DUPONT ST.
EAGLE ST.
FREEMAN ST.
GREEN ST.
HURON ST.
INDIA ST.
KENT ST.
JAVA ST.
COMMERCIAL ST.
GREENPOINT AVE.
PAIDGE AVE.
MILTON ST.
NOBLE ST.
WE
ST
ST
.P
RO
VO
ST
ST
.
MC
GU
INN
ES
S B
LV
D.
OAK ST.
QUAY ST.
CLIFFO
RD
PL.
GU
ER
NS
EY
ST.
LOR
IME
R S
T.
MA
NH
ATTA
N A
VE.
LEO
NA
RD
ST.
EC
KFO
RD
ST.
NE
WE
L ST.
DIA
MO
ND
ST.
JEW
EL S
T.
MO
ULTR
IE S
T.
BA
NK
ER
CALYER ST.
MESEROLE AVE.
6619776
46 111
35
30 141 81
15146
30
45217152
86 889
51
61 722 61
303556
1020
77
803 6641
11666
30912076 10
10
45 839
6650157
10 132
25
10 192
136
103010
151045
0 35 25
10 66 20
05
10
5 60 1010 66
5
500
0 60 15
5 66 25
055
10530
5 40
5 61
55
0 40 55 25 46
055
545
25
136
10
121
61
1030
5
251535
5 111
2510
6
111
25
65 66
645
5
80 10
35 46
2010
0
15525
0 45
20 35
1020
1040
15 5
152
10
137 56
205625
137
35
96 66
159625
86 5
101 25
101541
66 5
76 35
52510
934
45
808 20
363551
934
56
803 40
1063061
15 228
7030
245
76
530 5
35 10
2525
30
3020
5 5
3035 40 40 25
1025
50 5 40
25
4515
25
251546
5 136
2515
7
15510
15 270
25 345
228
5
25515
5 6071
00
203066
10 7010 61
162
2018
286
010
5
279
20
253351
3
6
1928
280
255
326
202020
5 71
20 91
309650
5 122
961530
25
25 137
25 132
25
41
45
25 152
015
2
61
203066
10 7010 61
Analyzed Intersection (Signalized)
Legend:
Analyzed Intersection (Unsignalized)
2003 Existing Greenpoint Traffic Volumes - MD Peak HourFigure 16-3aGreenpoint - Williamsburg Rezoning EIS

NORTH 13TH ST.
NORTH 12TH ST.
NORTH 11TH ST.
NORTH 10TH ST.
NORTH 9TH ST.
NORTH 8TH ST.
NORTH 7TH ST.
NORTH 6TH ST.
NORTH 5TH ST.
NORTH 4TH ST.
NORTH 3RD ST.
NORTH 1ST ST.
METROPOLITAN AVE.
WY
TH
E A
VE
.
BE
RR
Y S
T.
BE
DF
OR
D A
VE
.
RO
EB
LIN
G S
T.
HA
VE
ME
YE
R S
T.
UNION AVE.
BAYA
RD ST
.RIC
HARD
SON S
T.
FROST
ST.
WITH
ERS S
T.
LORIMER ST.
GRAND ST
HOPE ST.
MA
RC
Y A
VE
.
RO
DN
EY
ST.
KE
AP
ST
.
HOPE ST.
GRAND ST.
SOUTH 1ST ST.
SOUTH 2ND ST.
SOUTH 3RD ST.
FILLMORE PL.
SOUTH 4TH ST.
SOUTH 5TH ST.
LEE AVE.
BROADWAY
ROEB
LING
ST.
SOUTH 8TH ST.BROADWAY
DU
NH
AM
PL.
SOUTH 6TH ST.
HA
VE
ME
YE
R S
T.
DR
IGG
S A
VE
.
KEN
T A
VE.
RIV
ER
ST
.
162177
5 73 20
5 20 405167
30
35 96
384
227
116
5620 121
30
17225
601
242111
348
40359
1010
18735
106152
40
1030361
182
25
6660
172
25
8686
172
10
7151
12625
66 131
5071
45 298
8191
35 318
5676
56 287
25
3045
71 25
30106
121
20
6596
106 15
3556
247
20
4010
4086
10 247
2561
25 222
3045
10 192
7180
20 121
278
3029
3 20
258
35
278
40
3515
278
278
258
293
25
25
5
258
298
2020
105
273
55
288
20
238
30
10 252
5
66
61
30
253
15
308 15
1010
303 10
283 5
303
278
1010
2086
126
16776 25 15
10645
177
126 293
1015
277
308
5012
298 20
264
40
1059
273
293
2535
258
25
293 25
401515 14
120
4020
35 232 81
5
5
55
5
5
5
5743
5 119
0
0
0
000
00
00
0
0
0
0
091
3
10272
353 15
55
263
015
3135
0
5
328 5
5263
5050
283
263
303
278
1010
303
10
278 10
6015
232
101
2530
172
111
255
187
50
5676
50 136
6561
25 76
5165
10 45
298 10
14571
303 45
5081
328 5
1530
141
15
5651
5120
30 162
7630
56 167
8635
86 172
147 55
335
86 20
253125
71 1040 86
10 86 5640
20
81 10
453135
116
1015 66
35 116
7120
25
66
106
30
156610
5
455
76 166
38 455
414
15
0
0
00
75
36
30
0
0
00
Analyzed Intersection (Signalized)
Legend:
Analyzed Intersection (Unsignalized)
2003 Existing Williamsburg Traffic Volumes - MD Peak HourFigure 16-3bGreenpoint - Williamsburg Rezoning EIS

FR
AN
KL
IN S
T.
ST.
GE
M S
T.
NORTH 15TH ST.
390
12411
471
52
135
349
251046
6
366 9
85
LE
ON
AR
D S
T.
MANHATTAN AVE.
DRIGGS AVE.
152258
11166
8120
MEEKER AVE.
MEEKER AVE.
(EAST-BOUND)
(WEST-BOUND)
BROOKLYN-QUEENS
EXPRESSWAY
MCGUINESS
BLVD.
HERBERT ST.
GRAHAM AVE. 71545
25
121
6215
131414
490113
58130
52010
ASH ST.
BOX ST.
CLAY ST.
DUPONT ST.
EAGLE ST.
FREEMAN ST.
GREEN ST.
HURON ST.
INDIA ST.
KENT ST.
JAVA ST.
COMMERCIAL ST.
GREENPOINT AVE.
PAIDGE AVE.
MILTON ST.
NOBLE ST.
WE
ST
ST
.P
RO
VO
ST
ST
.
MC
GU
INN
ES
S B
LV
D.
OAK ST.
QUAY ST.
CLIFFO
RD
PL.
GU
ER
NS
EY
ST.
LOR
IME
R S
T.
MA
NH
ATTA
N A
VE.
LEO
NA
RD
ST.
EC
KFO
RD
ST.
NE
WE
L ST.
DIA
MO
ND
ST.
JEW
EL S
T.
MO
ULTR
IE S
T.
BA
NK
ER
CALYER ST.
MESEROLE AVE.
1540
1015 5
55550 55
5 50
515
35
95 10
40 40
1525
5
205
10
65 96
10615
203051
5 205
10 141
231
25
146
84
52515
8160167
5 237
30
10 217
138
55622
1 335
9651
224
126
351525
5 99 38
5 86 35
01010
5 137
55
96 20
505
5 121
10
15 76 35
505
5535
0 91
0 81
510
5 86 150 40 51
010
5
5106
40
89 5
66 30
02510
119
5
106 30
102540
192
40
119 71
15122
30
202
40
172 40
209420
5622256
56 128
40
30 172 96
20167
37
351113581 13
43
35 944
1358
76
909 7061
21266
45253131
141
1242
71
56 788
126
56172
61
1510
25
879 45
665355
1566
66
949 20
1534040
1561 5
15 5
2535
40
7140
10 5
3030 51 25 30
030
90 0 51
251545
4 242
1720
5
28915
9 395
20 363
335
11
15516
0 126
101
105
1086135
20 805 70
262
2521
786
51010
396
3035
9 32
46
8
1321
410
251
345
51530
5 94
25 91
3018591
18 141
10628
28
40
20 202
30 162
51
20
45
43 179
17 192
25
Analyzed Intersection (Signalized)
Legend:
Analyzed Intersection (Unsignalized)
2003 Existing Greenpoint Traffic Volumes - PM Peak HourFigure 16-4aGreenpoint - Williamsburg Rezoning EIS

NORTH 13TH ST.
NORTH 12TH ST.
NORTH 11TH ST.
NORTH 10TH ST.
NORTH 9TH ST.
NORTH 8TH ST.
NORTH 7TH ST.
NORTH 6TH ST.
NORTH 5TH ST.
NORTH 4TH ST.
NORTH 3RD ST.
NORTH 1ST ST.
METROPOLITAN AVE.
WY
TH
E A
VE
.
BE
RR
Y S
T.
BE
DF
OR
D A
VE
.
RO
EB
LIN
G S
T.
HA
VE
ME
YE
R S
T.
UNION AVE.
BAYA
RD ST
.RIC
HARD
SON S
T.
FROST
ST.
WITH
ERS S
T.
LORIMER ST.
GRAND ST
HOPE ST.
MA
RC
Y A
VE
.
RO
DN
EY
ST.
KE
AP
ST
.
HOPE ST.
GRAND ST.
SOUTH 1ST ST.
SOUTH 2ND ST.
SOUTH 3RD ST.
FILLMORE PL.
SOUTH 4TH ST.
SOUTH 5TH ST.
LEE AVE.
BROADWAY
ROEB
LING
ST.
SOUTH 8TH ST.BROADWAY
DU
NH
AM
PL.
SOUTH 6TH ST.
HA
VE
ME
YE
R S
T.
DR
IGG
S A
VE
.
KEN
T A
VE.
RIV
ER
ST
.
192237
25 61 20
15 40 61
10237
35
51 121
495
318
151
8120 187
45
23730
975
348126
429
3051
030
25212
35
10681
45
1042486
253
20
5640
242
20
5072
247
15
7526
9125
51 232
6650
35 338
8686
71 333
6171
35 358
151
15
2545
166 35
2061
202 15
2081
182 61
2076
293
40
3625
4061
15 303
4581
20 298
1545
20 328
9161
10 192
453
3532
7 26
458
30
338 25
1540
453
338
458
318
50
15
438
333
1520
5
15
428
2510 32
8
5
15
408
30
031
3
5
36
030
433
15
324
5
10
10520
447 15
333 20
453
312
235
25101
222
1110
471
330
348
323 23
454
35
767
461
327
1927
465725 28
820
5811
51 242 71
5
5
505
433
30
313 2015
10
05
10
10
3635
6 188
2
25 20
13676
20756
328
556 182
197
0
00
00
000
0
40
034
10466
366 9
85
438
1015
3345
0
0
344 10
19444
1821
333
444
447
323
1530
453
9
323 12
4015
303
61
3020
328
51
2515
328
45
3076
25 197
56101
25 161
4045
15 161
348 71
4551
374 30
3066
353
10
2040
242
15
10635
4525
40 237
8140
51 222
10130
71 243
6510
51 242
195 65
423
126 10
154530
121
1020 11
1
30 121
7130
25
101
10
301030
131
2020 91
25 136
8620
20
96
106
50
155110
5
45 621
404
10
0
00
66
35
0
115
Analyzed Intersection (Signalized)
Legend:
Analyzed Intersection (Unsignalized)
2003 Existing Williamsburg Traffic Volumes - PM Peak HourFigure 16-4bGreenpoint - Williamsburg Rezoning EIS

Greenpoint-Williamsburg Rezoning EIS Chapter 16: Traffic and Parking
16-3
The Williamsburg portion of the study area contains a number of industrial businesses, and the local street
network serves truck traffic associated with these uses. The street grid is oriented northeast-southwest
(referred to herein as “north-south”) and northwest-southeast (“east-west”). In addition to Kent Avenue,
major arterials in the Williamsburg study area are Meeker Avenue, which functions as service roads for
the Brooklyn-Queens Expressway at the eastern edge of the project study area, Metropolitan Avenue, and
Broadway. The Williamsburg Bridge passes through the study area near its southern boundary. Local
traffic is distributed throughout the local street network.
The major arterials in Greenpoint and Williamsburg are under computerized signal control by NYCDOT,
while the signalized intersections of local streets are fixed-time. Several signalized intersections in the
study area are semi-actuated. A discussion of the street network within the study area is provided below.
Greenpoint
The major arterial connecting Greenpoint with Williamsburg is Franklin Street/Kent Avenue, which
extends from Commercial Street in Greenpoint to the north to DeKalb Avenue in Clinton Hill to the
south. The street is known as Franklin Street north of North 14 Street, and Kent Avenue south of Northth
14 Street. Within the study area, the roadway is 40 feet wide and carries one northbound and oneth
southbound lane of traffic; it is a designated local truck route along its entire length. Parking is generally
permitted on both sides of the street. South of Greenpoint Avenue, Franklin Street carries two-way traffic
volumes of approximately 610 vph in the AM peak hour, 640 vph in the midday peak hour, and 790 vph
in the PM peak hour.
Another major north-south arterial in Greenpoint is McGuinness Boulevard, which begins at Newtown
Creek to the north and extends south to the Brooklyn-Queens Expressway. South of Freeman Street,
McGuinness Boulevard is 78 feet wide and carries two northbound and three southbound lanes of traffic,
separated by a ten-foot-wide raised median. Left turn pockets are provided at most intersections where
a left turn in permitted. North of Freeman Street, the roadway consists of three moving lanes in each
direction, separated by a concrete barrier; the two inner lanes connect with the Pulaski Bridge to Long
Island City, while the outer lanes continue north to Newtown Creek as two distinct one-way, 30-foot-wide
streets alongside the bridge. South of the Pulaski Bridge, parking is permitted on the east (northbound)
side of the street only. The entire length of McGuinness Boulevard is a designated local truck route. South
of Green Street, McGuinness Boulevard typically carries two-way traffic volumes of 2,545 vph, 1,840
vph, and 2,575 vph in the AM, midday, and PM peak hours, respectively.
Manhattan Avenue is a local arterial extending from Newtown Creek in Greenpoint to Broadway in East
Williamsburg. Within the study area, the roadway is 50 feet wide and carries one northbound and one
southbound lane of traffic. Metered parking is provided on both sides of the street along much of its
length. The IND Crosstown Line (“G”) subway runs beneath Manhattan Avenue from Newtown Creek
to Driggs Avenue; stations are located at Greenpoint Avenue and Nassau Avenue. North of Greenpoint
Avenue, Manhattan Avenue is a designated local truck route. The B43 and B61 bus routes, operated by
New York City Transit, run on Manhattan Avenue between Box Street and Engert Avenue and between
Freeman Street and Driggs Avenue, respectively. In the vicinity of Greenpoint Avenue, Manhattan
Avenue typically carries two-way traffic volumes of 385 vph in the AM peak hour, 415 vph in the midday
peak hour, and 475 vph in the PM peak hour.
Greenpoint Avenue is an east-west arterial extending from the East River in Greenpoint to Queens
Boulevard in Sunnyside, Queens, via the Greenpoint Avenue Bridge. Within the study area, Greenpoint
Avenue carries local traffic and is a designated local truck route. The roadway is 50 feet wide between
Greenpoint-Williamsburg Rezoning EIS Chapter 16: Traffic and Parking
16-4
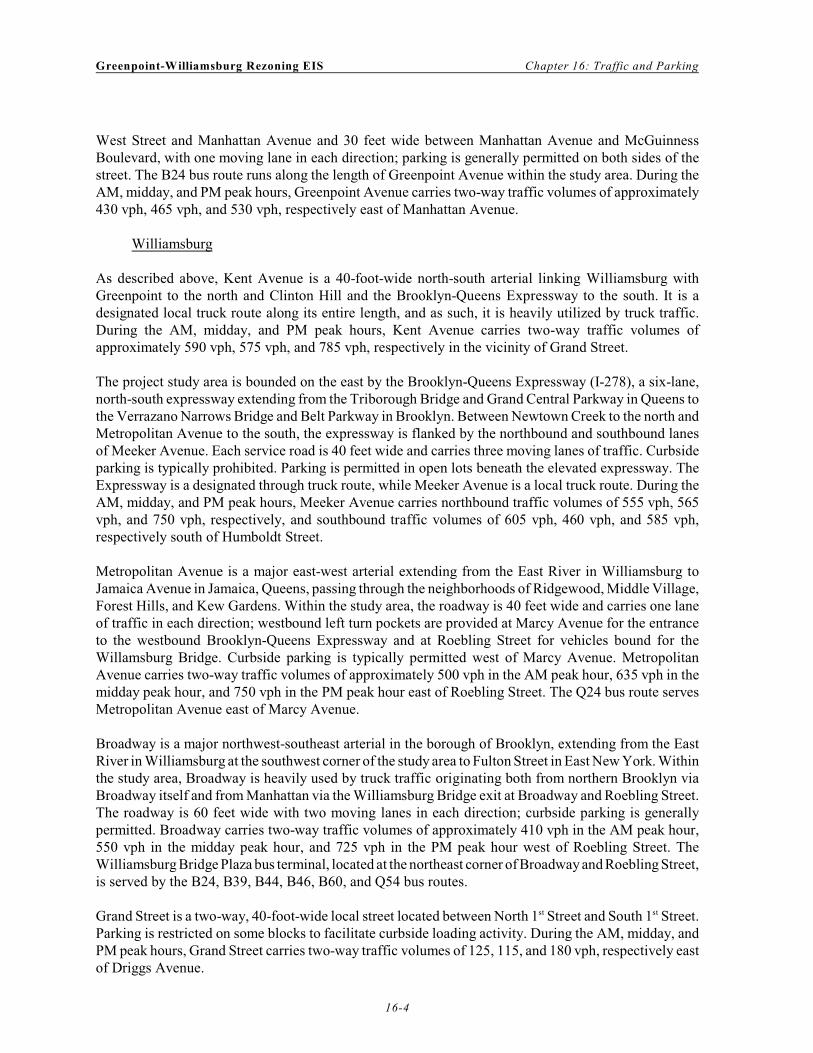
West Street and Manhattan Avenue and 30 feet wide between Manhattan Avenue and McGuinness
Boulevard, with one moving lane in each direction; parking is generally permitted on both sides of the
street. The B24 bus route runs along the length of Greenpoint Avenue within the study area. During the
AM, midday, and PM peak hours, Greenpoint Avenue carries two-way traffic volumes of approximately
430 vph, 465 vph, and 530 vph, respectively east of Manhattan Avenue.
Williamsburg
As described above, Kent Avenue is a 40-foot-wide north-south arterial linking Williamsburg with
Greenpoint to the north and Clinton Hill and the Brooklyn-Queens Expressway to the south. It is a
designated local truck route along its entire length, and as such, it is heavily utilized by truck traffic.
During the AM, midday, and PM peak hours, Kent Avenue carries two-way traffic volumes of
approximately 590 vph, 575 vph, and 785 vph, respectively in the vicinity of Grand Street.
The project study area is bounded on the east by the Brooklyn-Queens Expressway (I-278), a six-lane,
north-south expressway extending from the Triborough Bridge and Grand Central Parkway in Queens to
the Verrazano Narrows Bridge and Belt Parkway in Brooklyn. Between Newtown Creek to the north and
Metropolitan Avenue to the south, the expressway is flanked by the northbound and southbound lanes
of Meeker Avenue. Each service road is 40 feet wide and carries three moving lanes of traffic. Curbside
parking is typically prohibited. Parking is permitted in open lots beneath the elevated expressway. The
Expressway is a designated through truck route, while Meeker Avenue is a local truck route. During the
AM, midday, and PM peak hours, Meeker Avenue carries northbound traffic volumes of 555 vph, 565
vph, and 750 vph, respectively, and southbound traffic volumes of 605 vph, 460 vph, and 585 vph,
respectively south of Humboldt Street.
Metropolitan Avenue is a major east-west arterial extending from the East River in Williamsburg to
Jamaica Avenue in Jamaica, Queens, passing through the neighborhoods of Ridgewood, Middle Village,
Forest Hills, and Kew Gardens. Within the study area, the roadway is 40 feet wide and carries one lane
of traffic in each direction; westbound left turn pockets are provided at Marcy Avenue for the entrance
to the westbound Brooklyn-Queens Expressway and at Roebling Street for vehicles bound for the
Willamsburg Bridge. Curbside parking is typically permitted west of Marcy Avenue. Metropolitan
Avenue carries two-way traffic volumes of approximately 500 vph in the AM peak hour, 635 vph in the
midday peak hour, and 750 vph in the PM peak hour east of Roebling Street. The Q24 bus route serves
Metropolitan Avenue east of Marcy Avenue.
Broadway is a major northwest-southeast arterial in the borough of Brooklyn, extending from the East
River in Williamsburg at the southwest corner of the study area to Fulton Street in East New York. Within
the study area, Broadway is heavily used by truck traffic originating both from northern Brooklyn via
Broadway itself and from Manhattan via the Williamsburg Bridge exit at Broadway and Roebling Street.
The roadway is 60 feet wide with two moving lanes in each direction; curbside parking is generally
permitted. Broadway carries two-way traffic volumes of approximately 410 vph in the AM peak hour,
550 vph in the midday peak hour, and 725 vph in the PM peak hour west of Roebling Street. The
Williamsburg Bridge Plaza bus terminal, located at the northeast corner of Broadway and Roebling Street,
is served by the B24, B39, B44, B46, B60, and Q54 bus routes.
Grand Street is a two-way, 40-foot-wide local street located between North 1 Street and South 1 Street.st st
Parking is restricted on some blocks to facilitate curbside loading activity. During the AM, midday, and
PM peak hours, Grand Street carries two-way traffic volumes of 125, 115, and 180 vph, respectively east
of Driggs Avenue.

Greenpoint-Williamsburg Rezoning EIS Chapter 16: Traffic and Parking
16-5
Local north-south traffic in the Williamsburg portion of the study area is distributed relatively evenly over
the local street grid. Berry Street and Bedford Avenue are one-way northbound, Wythe Avenue and
Driggs Avenue are one-way southbound; each is 30 feet wide and carries one moving lane of traffic.
Curbside parking is typically permitted along both curbs on local streets within the study area, with the
exception of Berry Street between North 5 and North 7 Streets, where parking is prohibited betweenth th
the hours of 4:00 AM and 4:00 PM to facilitate curbside loading activities. The B61 bus route operates
northbound on Bedford Avenue and southbound on Driggs Avenue. Combined, Berry Street and Bedford
Avenue carry approximately 500, 495, and 620 vph northbound in the AM, midday, and PM peak hours,
respectively, while Wythe and Driggs Avenues carry approximately 485, 465, and 615 vph southbound
in the respective AM, midday, and PM periods. Driggs Avenue is a designated local truck route between
South 4 Street and Broadway.th
Local east-west traffic in the Williamsburg study area is carried on the numbered street grid, from North
12 Street to South 6 Street. Typically, even-numbered streets run west, and odd-numbered streets runth th
east, the exception being North 1 Street, which is one-way westbound. Each street is 30 feet wide andst
carries one moving lane of traffic, with parking typically permitted on both sides of the street. The BMT
Canarsie Line (“L”) subway runs beneath North 7 Street and has a stop located at Bedford Avenue.th
Between Bedford Avenue and Driggs Avenue, eastbound streets typically carry between 65 and 165 vph
in the AM peak hour, between 125 and 175 vph in the midday peak hour, and between 95 and 120 vph
in the PM peak hour; westbound streets carry traffic volumes in the range of 100 to 200 vph in the AM
peak hour, 120 to 175 vph in the midday peak hour, and 115 to 175 vph in the PM peak hour. North 10th
and North 11 Streets are designated local truck routes.th
Truck Routes
As noted above, the primary through-truck route for trucks traversing the study area is the Brooklyn-
Queens Expressway. An extensive system of local streets has also been designated for local truck access.
As shown in Figure 16-5, the primary local truck routes serving the study area include Franklin
Street/Kent Avenue, Manhattan Avenue (north of Greepoint Avenue), McGuinness Boulevard, Provost
Street, Meeker Avenue, Ash and Box Streets, Paidge Avenue, Greenpoint Avenue, North 10 and Northth
11 Streets, Metropolitan Avenue, and Broadway. Also designated as local truck routes are segments ofth
Freeman, Green, Rodney, Havemeyer, Roebling, South 3 and South 4 streets, Marcy and Driggsrd th
avenues, and Grand Street Extension. As previously discussed, many of these local truck routes are
narrow local streets, typically with one moving lane in each direction. The volume of truck traffic
dependent on these local streets often leads to congestion, causing trucks to divert from designated truck
routes onto residential streets. Additionally, curbside deliveries and trucks backing into loading docks
frequently block moving lanes or entire roadways. NYCDOT has recently initiated a citywide study of
existing truck routes, that will examine enhancing operation, management, and enforcement.
Bicycle Facilities
Three types of bicycle facilities can be found within the study area. Bike paths, which are shared use
(bicycle/pedestrian) paths separated from traffic and delineated by pavement markings; on-street bicycle
lanes, which are part of the roadway and delineated by pavement markings and regulatory signage; and
signed bicycle routes which involve shared use of the roadway and are typically designated with
informational signs. Within the study area, an on-street bike lane is provided along Berry Street from
Broadway to North 14 Street, and a pedestrian/bike path is provided on the Pulaski Bridge to Longth
Greenpoint-Williamsburg Rezoning EIS Chapter 16: Traffic and Parking
16-6
Island City. A pedestrian/bike path is also present on the north side of the Williamsburg Bridge providing
access to and from Manhattan. This path is reached via a ramp at the intersection of South 4 Street andth
Driggs Avenue. In addition, the NYCDOT 2003 NYC Cycling Map identifies a number of recommended
bicycle routes within the study area. As shown in Figure 16-6, these include portions of Calyer, Eagle,
Franklin, Freeman, Grand, Leonard, Oak, South 2 , South 4 , South 5 and West streets; Driggs, Kentnd th th
and Manhattan avenues, and Broadway. Greenpoint Avenue east of Leonard Street and Broadway east
of Driggs Avenue are designated as cautionary bicycle routes, so labeled due to narrow street width
and/or heavy vehicular traffic.
Intersection Capacity Analyses
Methodology
The capacity analyses at study area intersections are based on the methodology presented in the Highway
Capacity Manual (HCM) Software 2000 Release 4.1c. Traffic data required for these analyses include
volumes on each approach and various other physical and operational characteristics. As previously
discussed, traffic volumes used for these analyses are based on manual turning movement and ATR
counts conducted in June 2002, and also reflect the 2002 network developed for NYCDDC’s planned
reconstruction of Kent Avenue/Franklin Street. Signal timing plans for each signalized intersection were
obtained from the New York City Department of Transportation (NYCDOT). Field inventories were
conducted to document curbside parking regulations, vehicle classifications, shared lane usage, and other
relevant characteristics needed for the analysis.
The HCM methodology provides a volume-to-capacity (v/c) ratio for each signalized intersection
approach. The v/c ratio represents the ratio of traffic volumes on an approach to the approach’s carrying
capacity. A ratio of less than 0.90 is generally considered to be non-congested conditions in dense urban
areas; when higher than this value, congestion increases. At a v/c ratio of between 0.95 and 1.0, near-
capacity conditions are reached and delays can become substantial. Ratios of greater than 1.0 indicate
saturated conditions with queuing.
The HCM methodology also expresses quality of flow in terms of level of service (LOS), which is based
on the amount of delay that a driver typically experiences at an intersection. Levels of service range from
A, with minimal delay (10 seconds or less per vehicle), to F, which represents long delays (greater than
80 seconds per vehicle).
For unsignalized intersections, the HCM methodology generally assumes that major street traffic is not
affected by minor street flows. Left turns from the major street are assumed to be affected by the
opposing, or oncoming major street flow. Minor street traffic is obviously affected by all conflicting
movements. Similar to signalized intersections, the HCM methodology expresses the quality of flow at
unsignalized intersections in terms of level of service based on the amount of delay that a driver
experiences. This relationship differs somewhat from the criteria used for signalized intersections,
primarily because drivers expect different levels of performance from the two different kinds of
transportation facilities. For unsignalized intersections, levels of service range from A, with minimal
delay (10 seconds or less per vehicle), to F, which represents long delays (over 50 seconds per vehicle).
Table 16-1 shows the LOS/delay relationship for signalized and unsignalized intersections using the HCM
methodology. Levels of service A, B and C generally represent highly favorable to fair levels of traffic
flow; at LOS D the influence of congestion becomes noticeable; LOS E is considered to be the limit of

FRA
NK
LIN
ST.
ST.
DO
BB
IN S
T.
GE
M S
T.
NORTH 15TH ST.
LE
ON
AR
D S
T.
MANHATTAN AVE.
DRIGGS AVE.MEEKER AVE.
MEEKER AVE.
(EAST-BOUND)
(WEST-BOUND)
BROOKLYN-QUEENS
EXPRESSWAY
MCGUINESS
BLVD.
HERBERT ST.
GRAHAM AVE.
ASH ST.
BOX ST.
CLAY ST.
DUPONT ST.
EAGLE ST.
FREEMAN ST.
GREEN ST.
HURON ST.
INDIA ST.
KENT ST.
JAVA ST.
COMMERCIAL ST.
GREENPOINT AVE.
PAIDGE AVE.
MILTON ST.
NOBLE ST.
WE
ST
ST
.
PR
OV
OS
T S
T.
MC
GU
INN
ES
S B
LV
D.
OAK ST.
QUAY ST.
CLIFFO
RD
PL.
GU
ER
NS
EY
ST.
LOR
IME
R S
T.
MA
NH
ATTA
N A
VE
.
LEO
NA
RD
ST.
EC
KFO
RD
ST.
NE
WE
L ST.
DIA
MO
ND
ST.
JEW
EL S
T.
MO
ULTR
IE S
T.
BA
NK
ER
CALYER ST.
MESEROLE AVE.
HU
MB
OL
DT
ST
.Designated Truck Routes
Figure 16-5aGreenpoint - Williamsburg Rezoning EIS
Legend;
Designated Truck Route Designated Through Truck Route

NORTH 13TH ST.
NORTH 12TH ST.
NORTH 11TH ST.
NORTH 10TH ST.
NORTH 9TH ST.
NORTH 8TH ST.
NORTH 7TH ST.
NORTH 6TH ST.
NORTH 5TH ST.
NORTH 4TH ST.
NORTH 3RD ST.
NORTH 1ST ST.
METROPOLITAN AVE.
WY
TH
E A
VE
.
BE
RR
Y S
T.
BE
DF
OR
D A
VE
.
RO
EB
LIN
G S
T.
HA
VE
ME
YE
R S
T.
UNION AVE.
BAYA
RD ST
.RIC
HARDSON ST
.
FROST
ST.
WITH
ERS S
T.
LORIMER ST.
GRAND S
HOPE ST.
MA
RC
Y A
VE
.
RO
DN
EY
ST
.
KE
AP
ST
.
HOPE ST.
GRAND ST.
SOUTH 1ST ST.
SOUTH 2ND ST.
SOUTH 3RD ST.
FILLMORE PL.
SOUTH 4TH ST.
SOUTH 5TH ST.
LEE AVE.
BROADWAY
ROEB
LING
ST.
8TH ST.BROADWAY
DU
NH
AM
PL.
SOUTH 6TH ST.
HA
VE
ME
YE
R S
T.
DR
IGG
S A
VE
.
KEN
T A
VE.
RIV
ER
ST
.
Greenpoint - Williamsburg Rezoning EISDesignated Truck Routes
Figure 16-5b
Designated Truck Route
Legend;
Designated Through Truck Route

TRAFFIC STUDY AREA BOUNDARY
LEGEND:
RECOMMENDED BICYCLE ROUTE
BIKE PATH
ON-STREET BIKE LANE
Study Area Bicycle FacilitiesFigure 16-6Greenpoint-Williamsburg Rezoning EIS

Greenpoint-Williamsburg Rezoning EIS Chapter 16: Traffic and Parking
16-7
acceptable delay; and LOS F is considered to be unacceptable to most drivers. In this study, a signalized
lane grouping operating at LOS E or F or a v/c ratio of 0.90 or above is identified as congested. For
unsignalized intersections, a movement with LOS E or worse is also identified as congested.
TABLE 16-1
Roadway Level of Service Criteria
Level of Service
(LOS)
Average Delay per Vehicle
(seconds)
Signalized Intersections Unsignalized Intersections
A less than 10.1 less than 10.1
B 10.1 to 20.0 10.1 to 15.0
C 20.1 to 35.0 15.1 to 25.0
D 35.1 to 55.0 25.1 to 35.0
E 55.1 to 80.0 35.1 to 50.0
F greater than 80.0 greater than 50.0
Source: 2000 Highway Capacity Manual
Tables 16-2 and 16-3 show the results of the capacity analysis at the 31 signalized and 43 unsignalized
intersections, respectively, in the three peak hours analyzed. The tables highlight those intersection
movements that operate at LOS E or F and/or have a high v/c ratio (generally above 0.90 and above). The
following describes conditions at those intersections experiencing congestion in one or more peak hours.
Signalized Intersections
Table 16-2 shows that nine of the 31 signalized intersections analyzed have at least one congested
movement in one or more peak hours. As shown in the table, four analyzed intersections experience
congestion during the weekday AM peak hour, three during the midday peak hour, and eight in the PM
peak hour.
At the intersection of Franklin Street and Greenpoint Avenue, the westbound approach is congested with
LOS E conditions in the AM, midday, and PM peak hours, and v/c ratios of 0.98, 1.02, and 1.03 during
these hours, respectively.
Along the McGuinness Boulevard corridor, the southbound left-turn movement on McGuinness
Boulevard at Green Street operates at LOS E in the AM peak hour. In the PM peak hour, the eastbound
Calyer Street approach to McGuinness Boulevard is also congested with LOS E conditions, as is the
westbound approach at McGuinness Boulevard and Meserole Avenue. The southbound through
movement on McGuinness Boulevard at Meeker Avenue is congested with LOS E conditions in the PM
peak hour, while the southbound approach at the intersection of McGuinness Boulevard/Humboldt Street
and Meeker Avenue operates at LOS F conditions and a v/c ratio of 1.03 in the PM.
Along the Metropolitan Avenue corridor, the westbound exclusive left-turn movement at the intersection
with Marcy Avenue experiences congestion in the AM and PM peak hours, with LOS D conditions and
a v/c ratio of 0.99 in the AM, and LOS E conditions and a v/c ratio of 1.03 in the PM. At Union Avenue,
the northbound approach is congested with LOS E conditions in all peak hours.
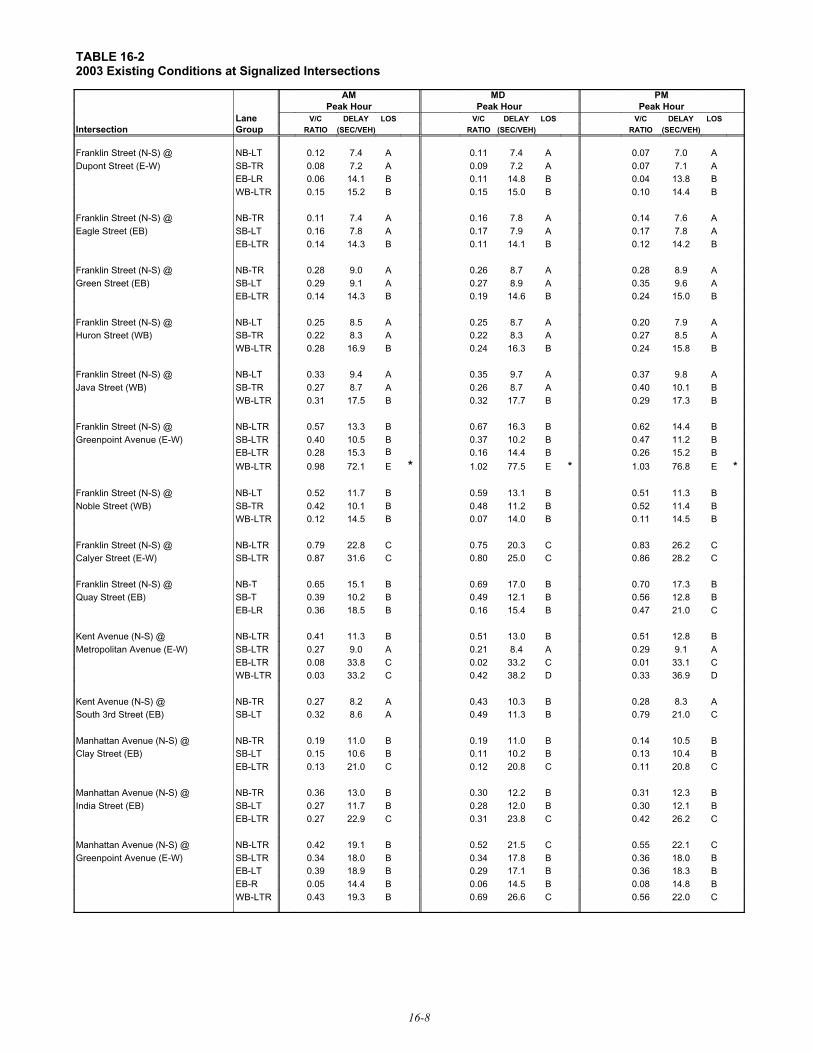
TABLE 16-2 2003 Existing Conditions at Signalized Intersections
PMMDAMPeak HourPeak HourPeak Hour
LOSDELAYV/CLOSDELAYV/CLOSDELAYV/CLane(SEC/VEH)RATIO(SEC/VEH)RATIO(SEC/VEH)RATIOGroupIntersection
A7.00.07A7.40.11A7.40.12NB-LTFranklin Street (N-S) @A7.10.07A7.20.09A7.20.08SB-TRDupont Street (E-W)B13.80.04B14.80.11B14.10.06EB-LRB14.40.10B15.00.15B15.20.15WB-LTR
A7.60.14A7.80.16A7.40.11NB-TRFranklin Street (N-S) @A7.80.17A7.90.17A7.80.16SB-LTEagle Street (EB)B14.20.12B14.10.11B14.30.14EB-LTR
A8.90.28A8.70.26A9.00.28NB-TRFranklin Street (N-S) @A9.60.35A8.90.27A9.10.29SB-LTGreen Street (EB)B15.00.24B14.60.19B14.30.14EB-LTR
A7.90.20A8.70.25A8.50.25NB-LTFranklin Street (N-S) @A8.50.27A8.30.22A8.30.22SB-TRHuron Street (WB)B15.80.24B16.30.24B16.90.28WB-LTR
A9.80.37A9.70.35A9.40.33NB-LTFranklin Street (N-S) @B10.10.40A8.70.26A8.70.27SB-TRJava Street (WB)B17.30.29B17.70.32B17.50.31WB-LTR
B14.40.62B16.30.67B13.30.57NB-LTRFranklin Street (N-S) @B11.20.47B10.20.37B10.50.40SB-LTRGreenpoint Avenue (E-W)B15.20.26B14.40.16B15.30.28EB-LTR
*E76.81.03*E77.51.02*E72.10.98WB-LTR
B11.30.51B13.10.59B11.70.52NB-LTFranklin Street (N-S) @B11.40.52B11.20.48B10.10.42SB-TRNoble Street (WB)B14.50.11B14.00.07B14.50.12WB-LTR
C26.20.83C20.30.75C22.80.79NB-LTRFranklin Street (N-S) @C28.20.86C25.00.80C31.60.87SB-LTRCalyer Street (E-W)
B17.30.70B17.00.69B15.10.65NB-TFranklin Street (N-S) @B12.80.56B12.10.49B10.20.39SB-TQuay Street (EB)C21.00.47B15.40.16B18.50.36EB-LR
B12.80.51B13.00.51B11.30.41NB-LTRKent Avenue (N-S) @A9.10.29A8.40.21A9.00.27SB-LTRMetropolitan Avenue (E-W)C33.10.01C33.20.02C33.80.08EB-LTRD36.90.33D38.20.42C33.20.03WB-LTR
A8.30.28B10.30.43A8.20.27NB-TRKent Avenue (N-S) @C21.00.79B11.30.49A8.60.32SB-LTSouth 3rd Street (EB)
B10.50.14B11.00.19B11.00.19NB-TRManhattan Avenue (N-S) @B10.40.13B10.20.11B10.60.15SB-LTClay Street (EB)C20.80.11C20.80.12C21.00.13EB-LTR
B12.30.31B12.20.30B13.00.36NB-TRManhattan Avenue (N-S) @B12.10.30B12.00.28B11.70.27SB-LTIndia Street (EB)C26.20.42C23.80.31C22.90.27EB-LTR
C22.10.55C21.50.52B19.10.42NB-LTRManhattan Avenue (N-S) @B18.00.36B17.80.34B18.00.34SB-LTRGreenpoint Avenue (E-W)B18.30.36B17.10.29B18.90.39EB-LTB14.80.08B14.50.06B14.40.05EB-RC22.00.56C26.60.69B19.30.43WB-LTR
16-8
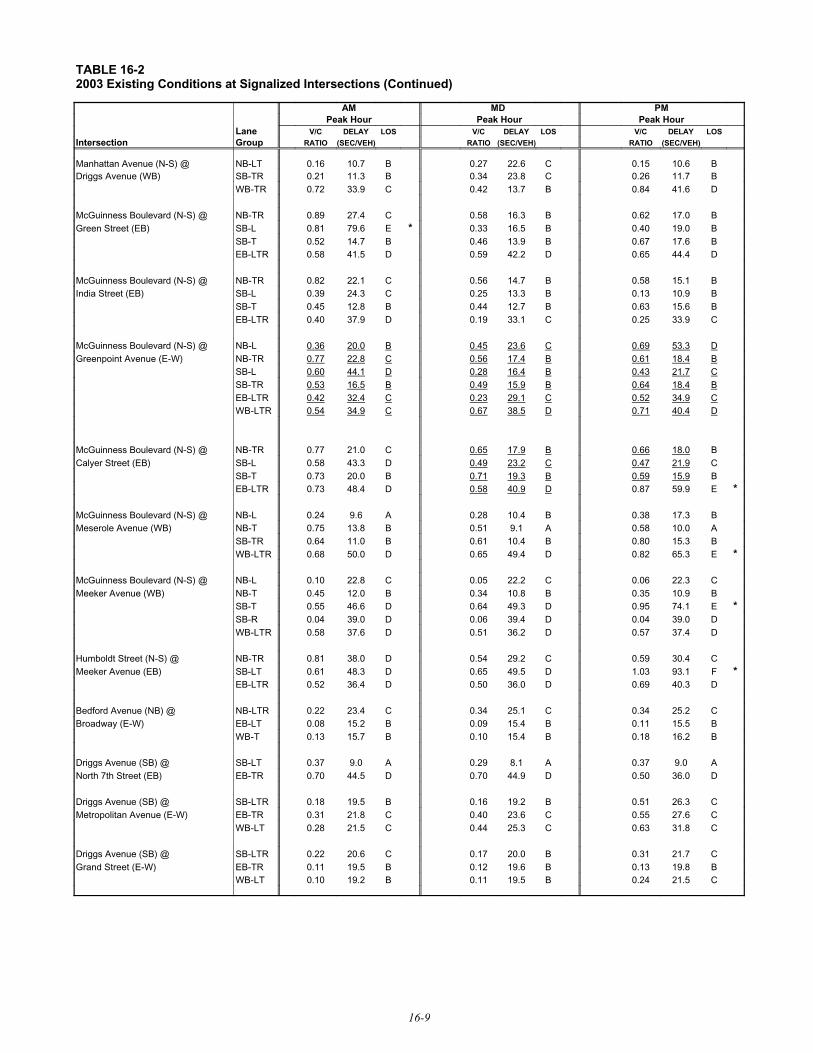
TABLE 16-2 2003 Existing Conditions at Signalized Intersections (Continued)
PMMDAMPeak HourPeak HourPeak Hour
LOSDELAYV/CLOSDELAYV/CLOSDELAYV/CLane(SEC/VEH)RATIO(SEC/VEH)RATIO(SEC/VEH)RATIOGroupIntersection
B10.60.15C22.60.27B10.70.16NB-LTManhattan Avenue (N-S) @B11.70.26C23.80.34B11.30.21SB-TRDriggs Avenue (WB)D41.60.84B13.70.42C33.90.72WB-TR
B17.00.62B16.30.58C27.40.89NB-TRMcGuinness Boulevard (N-S) @B19.00.40B16.50.33*E79.60.81SB-LGreen Street (EB)B17.60.67B13.90.46B14.70.52SB-TD44.40.65D42.20.59D41.50.58EB-LTR
B15.10.58B14.70.56C22.10.82NB-TRMcGuinness Boulevard (N-S) @B10.90.13B13.30.25C24.30.39SB-LIndia Street (EB)B15.60.63B12.70.44B12.80.45SB-TC33.90.25C33.10.19D37.90.40EB-LTR
D53.30.69C23.60.45B20.00.36NB-LMcGuinness Boulevard (N-S) @B18.40.61B17.40.56C22.80.77NB-TRGreenpoint Avenue (E-W)C21.70.43B16.40.28D44.10.60SB-LB18.40.64B15.90.49B16.50.53SB-TRC34.90.52C29.10.23C32.40.42EB-LTRD40.40.71D38.50.67C34.90.54WB-LTR
B18.00.66B17.90.65C21.00.77NB-TRMcGuinness Boulevard (N-S) @C21.90.47C23.20.49D43.30.58SB-LCalyer Street (EB)B15.90.59B19.30.71B20.00.73SB-T
*E59.90.87D40.90.58D48.40.73EB-LTR
B17.30.38B10.40.28A9.60.24NB-LMcGuinness Boulevard (N-S) @A10.00.58A9.10.51B13.80.75NB-TMeserole Avenue (WB)B15.30.80B10.40.61B11.00.64SB-TR
*E65.30.82D49.40.65D50.00.68WB-LTR
C22.30.06C22.20.05C22.80.10NB-LMcGuinness Boulevard (N-S) @B10.90.35B10.80.34B12.00.45NB-TMeeker Avenue (WB)
*E74.10.95D49.30.64D46.60.55SB-TD39.00.04D39.40.06D39.00.04SB-RD37.40.57D36.20.51D37.60.58WB-LTR
C30.40.59C29.20.54D38.00.81NB-TRHumboldt Street (N-S) @*F93.11.03D49.50.65D48.30.61SB-LTMeeker Avenue (EB)
D40.30.69D36.00.50D36.40.52EB-LTR
C25.20.34C25.10.34C23.40.22NB-LTRBedford Avenue (NB) @B15.50.11B15.40.09B15.20.08EB-LTBroadway (E-W)B16.20.18B15.40.10B15.70.13WB-T
A9.00.37A8.10.29A9.00.37SB-LTDriggs Avenue (SB) @D36.00.50D44.90.70D44.50.70EB-TRNorth 7th Street (EB)
C26.30.51B19.20.16B19.50.18SB-LTRDriggs Avenue (SB) @C27.60.55C23.60.40C21.80.31EB-TRMetropolitan Avenue (E-W)C31.80.63C25.30.44C21.50.28WB-LT
C21.70.31B20.00.17C20.60.22SB-LTRDriggs Avenue (SB) @B19.80.13B19.60.12B19.50.11EB-TRGrand Street (E-W)C21.50.24B19.50.11B19.20.10WB-LT
16-9

TABLE 16-2 2003 Existing Conditions at Signalized Intersections (Continued)
PMMDAMPeak HourPeak HourPeak Hour
LOSDELAYV/CLOSDELAYV/CLOSDELAYV/CLane(SEC/VEH)RATIO(SEC/VEH)RATIO(SEC/VEH)RATIOGroupIntersection
C27.30.24C26.10.14C26.60.18NB-LTRRoebling Street (N-S) @C26.50.17C26.80.20C27.50.26SB-LTMetropolitan Avenue (E-W)C25.30.06C24.80.01C25.00.03SB-RB15.90.37B14.70.28B14.50.26EB-LTRD37.50.85C28.90.74C25.00.67WB-LTR
C28.90.37C27.80.28C27.40.25NB-LRHavemeyer Street (NB) @B16.70.41B14.80.29B14.70.28EB-TMetropolitan Avenue (E-W)C20.60.60B18.50.51B14.30.27WB-T
D40.50.63D41.50.63D37.30.47EB-TRMarcy Avenue (SB) @*E59.21.03C24.10.79*D52.60.99WB-LMetropolitan Avenue (E-W)
A0.50.31A0.70.33A0.70.32WB-TR
*E68.20.87*E67.20.90*E66.20.90NB-LTRUnion Avenue (N-S) @C34.80.36D45.80.66D42.20.58SB-LTRMetropolitan Avenue (E-W)B19.30.69B16.10.56B14.00.47EB-LTRB19.70.71B16.80.60C28.60.84WB-LTR
B18.30.19B15.50.10B14.40.02NB-LRoebling Street (N-S) @B14.60.04B14.40.03B14.80.07NB-RBroadway (E-W)C22.70.66B17.80.38B18.30.42SB-LT
*E67.70.93*E58.70.87C35.00.50EB-TR*F90.50.86WB-DfLC30.00.33C28.80.26WB-LT
C32.10.41WB-T
ABBREVIATION: EB-Eastbound, WB-Westbound, NB-Northbound, SB-Southbound L-Left, T-Through, R-Right, E-W: East-West Roadway, N-S: North-South Roadway V/C Ratio - Volume to Capacity Ratio SEC/VEH - Seconds per Vehicle LOS - Level of Service * - Denotes Congested Location (LOS E or F, or v/c ratio > 0.90)
16-10

TABLE 16-3 2003 Existing Conditions at Unsignalized Intersections
PMMDAMPeak HourPeak HourPeak Hour
LOSDELAYV/C LOSDELAYV/C LOSDELAYV/CLane(SEC/VEH)RATIO(SEC/VEH)RATIO(SEC/VEH)RATIOGroupIntersection
A9.20.12A9.10.06A9.20.05WB-LRWest Street (N-S) @Freeman Street (WB)
A7.40.00A7.50.00A7.40.01NB-LTRWest Street (N-S) @A7.50.01A7.60.00A7.60.00SB-LTRGreen Street (E-W)A10.00.02A9.70.01A9.30.03EB-LTR
A7.40.00A7.50.00A7.40.00NB-LTWest Street (N-S) @A9.30.02A9.40.01A9.00.01EB-LRHuron Street (E-W)B10.30.07A9.50.06A9.80.06WB-LTR
A7.50.01A7.60.00A7.50.01NB-LTRWest Street (N-S) @A7.60.01A7.70.01A7.40.01SB-LTRIndia Street (E-W)A9.90.01A10.00.02A9.80.02EB-LTR
A7.60.00A7.70.01A7.40.01NB-LTRWest Street (N-S) @A7.50.00A7.60.01A7.50.01SB-LTRKent Street (E-W)A10.00.01A9.90.01B10.20.02EB-LTR
A7.50.00A7.60.01A7.40.01NB-LTRWest Street (N-S) @A7.60.03A7.70.02A7.40.04SB-LTRGreenpoint Avenue (E-W)B11.60.01B10.70.00B10.80.02EB-LTA9.90.02A9.10.01B10.30.01EB-TRB11.70.06B10.80.08B11.00.04WB-LTA9.60.06A9.40.03A9.40.07WB-TR
A9.30.01A7.40.01A9.40.01NB-LFranklin Street (N-S) @A8.60.06A9.50.03A8.70.07NB-RCommercial Street (E-W)A7.50.03A9.40.06A7.50.03WB-LT
A7.90.02A7.80.01A7.80.01SB-LTFranklin Street (N-S) @B13.30.10B12.20.09B11.90.05EB-LTRIndia Street (EB)
A8.50.05A8.70.04A8.20.03SB-LTFranklin Street (N-S) @B13.30.04B12.40.04B10.70.05WB-LRNorth 14th Street (E-W)
A8.70.00A8.20.00A8.30.00NB-LTKent Avenue (N-S) @B12.70.09B12.40.13C15.10.08WB-LTRNorth 12th Street (E-W)C17.70.07B13.60.06C16.40.03EB-LR
A8.20.03A8.60.04A8.20.01SB-LTKent Avenue (N-S) @C17.60.07B14.50.06C16.10.14EB-LTRNorth 11th Street (E-W)
A8.30.03A8.30.03A8.30.03SB-LTKent Avenue (N-S) @North 9th Street (EB)
C19.80.16WB-LB13.80.04WB-LB14.70.22WB-LRKent Avenue (N-S) @B10.90.03WB-RB10.50.06WB-RNorth 8th Street (WB)
A8.70.01A8.00.00A8.50.00NB-LTRKent Avenue (N-S) @A8.30.03A8.40.04A8.20.03SB-LTRNorth 7th Street (E-W)C18.10.01B13.40.01C15.70.01EB-LTR
A8.60.00A8.00.00A8.50.00NB-LTKent Avenue (N-S) @C16.80.01B12.30.00B15.00.01EB-LRNorth 6th Street (E-W)B14.20.16B14.50.13B13.10.11WB-LTR
16-11

TABLE 16-3 2003 Existing Conditions at Unsignalized Intersections (Continued)
PMMDAMPeak HourPeak HourPeak Hour
LOSDELAYV/C LOSDELAYV/C LOSDELAYV/CLane(SEC/VEH)RATIO(SEC/VEH)RATIO(SEC/VEH)RATIOGroupIntersection
A8.60.02A8.00.00A8.40.00NB-LTRKent Avenue (N-S) @A8.20.03A8.30.03A8.20.03SB-LTRNorth 5th Street (E-W)C16.50.03B14.60.02C16.60.02EB-LTR
C18.00.07B15.00.06C15.90.12WB-LKent Avenue (N-S) @B10.90.03B11.10.04B10.30.04WB-RNorth 4th Street (WB)
A8.60.01A8.10.00A8.50.01NB-LTRKent Avenue (N-S) @A8.20.02A8.30.00A8.10.02SB-LTRNorth 3rd Street (E-W)B14.10.05B14.10.04C17.50.06EB-LTR
A8.60.01A8.00.00A8.40.00NB-LTRKent Avenue (N-S) @A8.20.01A8.40.02A8.00.01SB-LTRGrand Street (E-W)C15.10.05B13.80.04B14.60.01EB-LTRC20.40.14C15.70.06B14.30.09WB-LTR
C16.80.02B13.80.03C15.30.03WB-LKent Avenue (N-S) @B10.60.04B10.20.02B10.50.02WB-RSouth 6th Street (WB)
A7.60.00A7.60.00A7.70.01SB-LTManhattan Avenue (N-S) @B11.10.06EB-LTB10.60.04EB-LTA9.50.05EB-LTREagle Street (EB)A9.20.05EB-RA9.10.05EB-R
A7.80.03A7.80.03A7.90.03SB-LTManhattan Avenue (N-S) @C17.40.39B14.30.29B14.20.32EB-LTRGreen Street (EB)
A7.5(a)A7.5(a)A7.5(a)NB-LTRMcGuiness Boulevard (NB) @A7.6(a)A7.5(a)A7.9(a)EB-LTPaidge Avenue (E-W)A7.5(a)A7.2(a)A7.3(a)WB-TR
A7.6(a)A7.5(a)A7.5(a)SB-LTMcGuiness Boulevard (SB) @A7.5(a)A7.2(a)A7.6(a)EB-TRBox Street (E-W)A7.8(a)A7.6(a)A7.7(a)WB-L
A7.7(a)A7.8(a)A7.5(a)NB-LTRMcGuiness Boulevard (NB) @A7.7(a)A7.7(a)A7.7(a)EB-LTClay Street (E-W)
A7.30.00A7.30.00A7.30.01SB-LTMcGuinness Boulevard (SB) @A9.70.08A9.40.08A9.40.08EB-TRClay Street (E-W)B10.20.08A9.80.06A9.90.04WB-L
B10.60.11B10.50.15B10.10.09WB-LTWythe Avenue (SB) @North 12th Street (WB)
A7.40.03A7.40.01A7.40.01SB-LTWythe Avenue (SB) @B12.20.12B11.50.09B12.00.09EB-TRNorth 9th Street (EB)
B12.40.19B12.10.22B13.00.26WB-LTWythe Avenue (SB) @North 8th Street (WB)
B12.20.19B10.80.12B11.20.10WB-LTWythe Avenue (SB) @B11.80.05B10.90.02B11.30.03WB-TNorth 6th Street (WB)
B10.20.08B11.10.10B11.60.10WB-LTWythe Avenue (SB) @B11.90.02B11.20.03B11.60.05WB-TNorth 4th Street (WB)
16-12
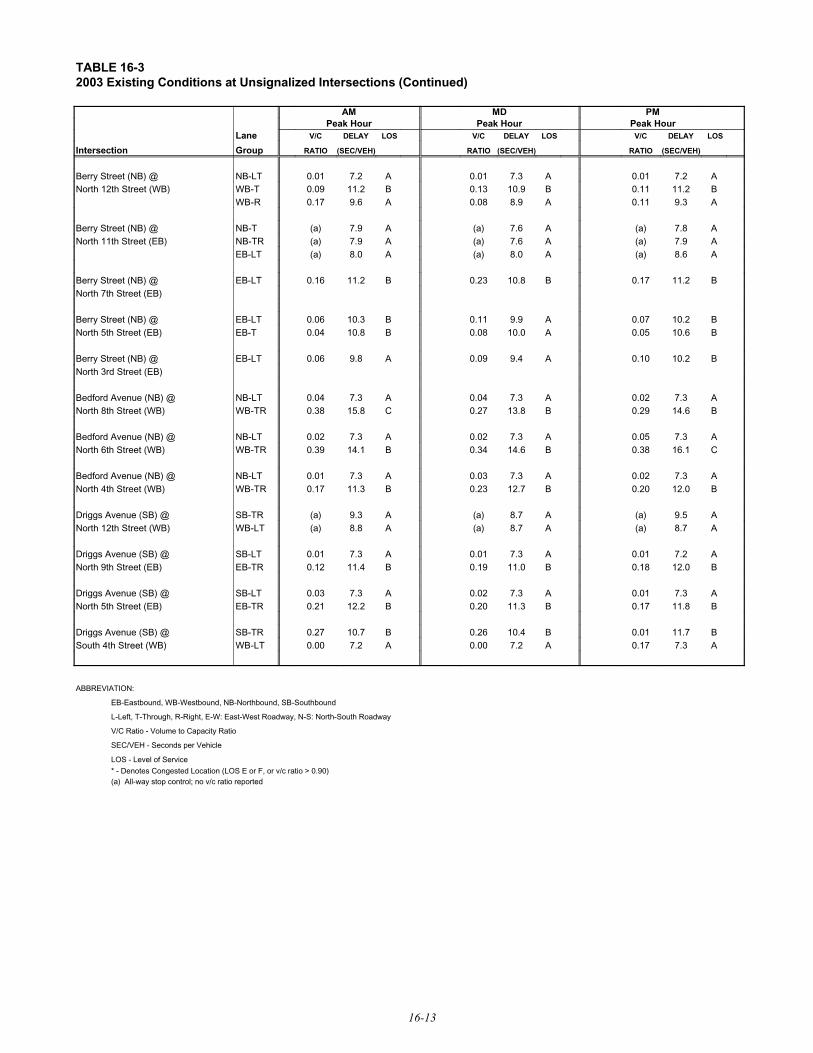
TABLE 16-3 2003 Existing Conditions at Unsignalized Intersections (Continued)
PMMDAMPeak HourPeak HourPeak Hour
LOSDELAYV/C LOSDELAYV/C LOSDELAYV/CLane
(SEC/VEH)RATIO(SEC/VEH)RATIO(SEC/VEH)RATIOGroupIntersection
A7.20.01A7.30.01A7.20.01NB-LTBerry Street (NB) @B11.20.11B10.90.13B11.20.09WB-TNorth 12th Street (WB)A9.30.11A8.90.08A9.60.17WB-R
A7.8(a)A7.6(a)A7.9(a)NB-TBerry Street (NB) @A7.9(a)A7.6(a)A7.9(a)NB-TRNorth 11th Street (EB)A8.6(a)A8.0(a)A8.0(a)EB-LT
B11.20.17B10.80.23B11.20.16EB-LTBerry Street (NB) @North 7th Street (EB)
B10.20.07A9.90.11B10.30.06EB-LTBerry Street (NB) @B10.60.05A10.00.08B10.80.04EB-TNorth 5th Street (EB)
B10.20.10A9.40.09A9.80.06EB-LTBerry Street (NB) @North 3rd Street (EB)
A7.30.02A7.30.04A7.30.04NB-LTBedford Avenue (NB) @B14.60.29B13.80.27C15.80.38WB-TRNorth 8th Street (WB)
A7.30.05A7.30.02A7.30.02NB-LTBedford Avenue (NB) @C16.10.38B14.60.34B14.10.39WB-TRNorth 6th Street (WB)
A7.30.02A7.30.03A7.30.01NB-LTBedford Avenue (NB) @B12.00.20B12.70.23B11.30.17WB-TRNorth 4th Street (WB)
A9.5(a)A8.7(a)A9.3(a)SB-TRDriggs Avenue (SB) @A8.7(a)A8.7(a)A8.8(a)WB-LTNorth 12th Street (WB)
A7.20.01A7.30.01A7.30.01SB-LTDriggs Avenue (SB) @B12.00.18B11.00.19B11.40.12EB-TRNorth 9th Street (EB)
A7.30.01A7.30.02A7.30.03SB-LTDriggs Avenue (SB) @B11.80.17B11.30.20B12.20.21EB-TRNorth 5th Street (EB)
B11.70.01B10.40.26B10.70.27SB-TRDriggs Avenue (SB) @A7.30.17A7.20.00A7.20.00WB-LTSouth 4th Street (WB)
ABBREVIATION:
EB-Eastbound, WB-Westbound, NB-Northbound, SB-Southbound
L-Left, T-Through, R-Right, E-W: East-West Roadway, N-S: North-South Roadway
V/C Ratio - Volume to Capacity Ratio
SEC/VEH - Seconds per Vehicle
LOS - Level of Service
* - Denotes Congested Location (LOS E or F, or v/c ratio > 0.90) (a) All-way stop control; no v/c ratio reported
16-13

Greenpoint-Williamsburg Rezoning EIS Chapter 16: Traffic and Parking
16-14
Lastly, at the intersection of Roebling Street and Broadway, the eastbound approach is congested with
LOS E conditions in the midday and PM peak hours. The westbound left-turn movement at this
intersection also experiences congestion, with LOS F conditions in the PM peak hour.
Unsignalized Intersections
As shown in Table 16-3, of the 43 unsignalized intersections analyzed, none were found to experience
congestion in any peak hour under Existing conditions.
Parking
Off-Street Parking
There are no licensed public parking facilities in the study area. While some businesses and housing
developments provide on-site accessory parking, most residents and workers in Greenpoint and
Williamsburg must rely on available curbside parking.
On-Street Parking
Curbside parking regulations within ¼-mile of the projected development sites were surveyed in June,
2002 and are shown in Figure 16-7. As shown in Figure 16-7, curbside parking is permitted throughout
much of the study area, with restrictions in place to facilitate street cleaning. Within the industrial areas
in the western portion of the study area, parking restrictions are in effect weekdays to provide for curbside
access for pick-up/drop-off activity and truck loading and unloading during certain periods of the day.
Metered curbside parking spaces are available on some blocks to accommodate the short-term parking
needs of adjacent commercial land uses. Much of the metered parking in the study area is concentrated
on Manhattan Avenue between Dupont Street and Greenpoint Avenue, and on Bedford Avenue between
North 5 and North 9 Streets, and on the side streets adjoining those blocks.th th
Field surveys of weekday utilization of on-street parking capacity were conducted in June 2004. The
surveys focused on the weekday overnight and midday periods, and included all legal curbside spaces
within ¼-mile of the proposed action area. During the weekday overnight period, the number of curbside
parking spaces within this area totals approximately 21,350. Utilization during this period was found to
be approximately 76 percent, with an average of approximately 5,100 spaces available. During the
weekday midday, there are approximately 21,050 spaces available for curbside parking. Utilization in the
midday was observed to reach approximately 82 percent, with about 3,800 spaces available within ¼-mile
of the proposed action area. (It should be noted that the number of available spaces fluctuates somewhat
by time of day and day of week, depending on the prevailing parking regulations. The capacities quoted
here are typical for the time periods examined.) Available spaces during both periods were distributed
throughout the study area, however, overnight utilization was typically observed to be higher in
residential areas than in areas with predominantly commercial uses. This is a common pattern as
residential parking demand typically peaks overnight and parking demand from commercial uses peaks
in the midday.

ASH ST.
BOX ST.
CLAY ST.
DUPONT ST.
EAGLE ST.
FREEMAN ST.
GREEN ST.
HURON ST.
INDIA ST.
KENT ST.
JAVA ST.
COMMERCIAL ST.
GREENPOINT AVE.
PAIDGE AVE.
MILTON ST.
NOBLE ST.
WE
ST
ST
.
FR
AN
KL
IN S
T.
MA
NH
AT
TA
N A
VE
.
PR
OV
OS
T S
T.
MC
GU
INN
ES
S B
LV
D.
OAK ST.
QUAY ST.
FRA
NK
LIN
ST.
CLIFFO
RD
PL.
GU
ER
NS
EY
ST.
LOR
IME
R S
T.
MA
NH
ATTA
N A
VE
.
LEO
NA
RD
ST.
EC
KFO
RD
ST.
MC
GU
INN
ESS BLVD
.
NE
WE
L ST.
DIA
MO
ND
ST.
JEW
EL S
T.
MO
ULTR
IE S
T.
BA
NK
ER ST.
DO
BB
IN S
T.
GE
M S
T.
CALYER ST.
MESEROLE AVE.
NORMAN AVE.
NASSAU AVE.
HU
MB
OL
DT
ST
.
RU
SS
EL
L S
T.
GREENPOINT AVE.
NORT
H HE
NRY
ST.
KINGSLAND AVE.
NO
RT
H H
EN
RY
ST
.
MO
NIT
OR
ST
.
KIN
GS
LA
ND
AV
E.
SU
TTON
ST.
MO
RG
AN
AV
E.
NORMAN AVE.
NASSAU AVE.
NORTH 15TH ST.
NORTH 14TH ST.NORTH 13TH ST.NORTH 12TH ST.
NORTH 11TH ST.NORTH 10TH ST.
NORTH 9TH ST.NORTH 8TH ST.NORTH 7TH ST.
NORTH 6TH ST.NORTH 5TH ST.
NORTH 4TH ST.NORTH 3RD ST.
NORTH 1ST ST.
METROPOLITAN AVE.
KENT
AVE.
WYTHE
AVE.
BERR
Y ST.
BEDF
ORD AV
E.
ROEB
LING S
T.
HAVE
MEYER
ST.
UN
ION
AV
E.
BAYARD ST.
RICHARDSON ST.
FROST ST.
WITHERS ST.
LE
ON
AR
D S
T.
EC
KF
OR
D S
T.
GR
AH
AM
AV
E.
DRIGGS AVE.
HU
MB
OL
DT
ST
.
RU
SS
EL
L S
T.
NO
RT
H H
EN
RY
ST
.
ENGERT AVE.
MEEKER AVE.
BAYARD ST.
NEWTON ST.
MCGUINNESS BLVD.
MEEKER AVE.
BROOKLYN-QUEENS
EXPWY.
HERBERT ST.
HERBERT ST.
NO
RT
H H
EN
RY
ST
.
FROST ST.
WITHERS ST.
JACKSON ST.
SKILLMAN AVE.
CONSELYEA ST.
RICHARDSON ST.
MO
NIT
OR
ST
.
GR
AN
DP
AR
EN
TS
AV
E.
LO
RIM
ER
ST
.
HU
MB
OL
DT
ST
.
WO
OD
POIN
T RD
.
DE
BE
VO
ISE
AV
E.
DE
BE
VO
ISE
A
M
GR
AH
AM
AV
E.
MA
NH
AT
TA
N A
VE
.
LE
ON
AR
D S
T.
LO
RIM
ER
ST
.
LE
ON
AR
D S
T.
METROPOLITAN AVE.
DEVOE ST.
AINSLIE ST.
POWERS ST.
GRAND ST.
MAUJER ST.
SCHOLES ST.
MESEROLE ST.
MONTROSE AVE.
JOHNSON AVE
TEN EYCK ST.
STAGG ST.
OLI
VE
ST.
JUD
GE
ST.
UN
ION
AV
E.
S. 1ST ST.
SOUTH 2ND ST.
SOUTH 3RD ST.
SOUTH 4TH ST.
SOUTH 5TH ST.
GRAND ST.
HOPE ST.
BORINQUEN PL.
UN
ION
AV
E.
HEW
ES ST
.
HOOP
ER S
T.
KEAP
ST.
RODN
EY S
T.
MAR
CY A
VE.
MAR
CY A
VE.
RODN
EY S
T.
KEAP
ST.
HOPE ST.
GRAND ST.
SOUTH 1ST ST.
SOUTH 2ND ST.
SOUTH 3RD ST.
FILLMORE PL.
SOUTH 4TH ST.
SOUTH 5TH ST.
HOOPER ST.
KEAP ST.
RODNEY ST. DIVISION AVE.
HARRISON AVE.
MARCY
LEE AVE.
BEDFORD AVE.
T
ROSS ST.
WILSON ST.
TAYLOR ST.
CLYMER ST.
MORTON ST.
MORTON ST.
RUSH ST.
W
DIVISION AVE.
SOUTH 9TH ST.
BROADWAY
SOUTH 10TH ST.
SOUTH 11TH ST.
SOUTH 8TH ST.
BROADWAY
BE
DFO
RD
AV
E.
BE
RR
Y S
T.
WY
THE
AV
E.
KE
NT
AV
E.
DU
NH
AM
PL.
SOUTH 6TH ST.
HAVE
MEYE
R ST
.
ROEB
LING
ST.DRIG
GS A
VE.
BERRY ST.
WYTHE AVE.
KEN
T AVE.
RIVER
ST.
MANHATTAN AVE.
DRIGGS AVE.
BEDF
ORD
AVE.
82
69
6982
6982
82 26
89
77
89
77
77
77
77 89
89
89
7789
68
82
82
89
89
89
89
77
77
77
73
77
69
89
68
68
93
81
93
81
89
77
89
77
89
77
89
77
8968
6982
26
69
82 26
82
26
55
77 89
77 89
77 89
77 89
89
77
89
77
77 77
8989 68
68
82
82
68
68 82
68 69
89
77
82
69
82
69
89
60
5582
5582
82 55
18
40 82
8269
51
69 82
69 82
5582
26
7426
74
87
7487
29
7487
82 82
82
26
69
89 77
89 77
54
82
69
82
68
87
87
87
87
87
87
55
68
29
74
74
74
74
74
74
74
74
74
74
74
69
6982
82
87
87
87
87
87
87
8774
8774
87
2619
7487
7487
7487
7487
7487
74
87
74
87
7487
74
87
7487
7487
7487
74
87
8774
8774
8774
6968
6982
6968 69
827468
74
66
6887
7487
74
87
57
57
57
601 1
7426 87
6887
6887
74
748726
7487
7487
26
7777
29
7789
7729
89
7789
19
48 26
623
6262
8977
8977
8774
68
68
6874
47
75103
87
74
8774
68
75
87
95
87
26
87
74
87
74
87
74 1
264
82
69
8269 68
8268
6983
72
8372
8372
8372
8368
83
72
83
72
8372
831
72
83
26
89
14
72
14
1472
72
14
83
83
26
26
72
14
72
14
6968
69
686968
82
82
6982
82
6968
7789
6968
68
82
69
74
87
74
6868
6982
69
82
6982
7487
7487
7487
688774
87
7411
74
8774
68
7463
6982
68
82
69
8268
82
69
6968
82
7487
7487
8745
87
74
74
26
8722
87
74
8774
87
74
7468
7487
8768
7890
78
90
7890
7890
7890
7890
9490
29
7890 68
68 78
1
8178
90
7890 29
26
7890
7890
7890
2626
7890
2690
7857
90
78
9497
82
82
68
6869
69
68
90
90
78
78
7826
9026
90
6890
2678
29
90
7890
26
26 69
68
7868
7890
6868
90
7868
6890
78
6878
90
7878
7878
1
90
78
1
2652
7868
90
78
90
10323 10
78
60
90
6090
8383
90
60
90
60
9060
2626
9060
1
1
8282
83
26
77
68
89
89
2935
77
14100
6399
60
94
97
77
89
77
90
26
2
90
78
68
39
60
7487
6014
2
70
83
68
70
83
78
90
7559
7590
90
6878
6878
78
90
78
90
78
90
3
26
3
7595
3
3
3
75 68
75
90
78
2689
89
77
89
14
28
6370
6378
7463
90
26
10776
7774
89
1
1
1
1
1
126
26
26
74
74
74 87
7487 90
9078
90
90
78
90
78
7890
87
78
7487
107
21
79
9179
26
2691
79
87
74
26
19 48
26
1
1
26
87
26
87
26
87
8193 9381
8977
93
81
93
81 26
6982
9381
61
8193
6982
6982
93 81
81
9326
93
9381
29
8193
81
93
81
93
93
81
26
85
26
93
20
81
93
93
8269
29
69
82
69
82
69
82
89
77
77
89
77
89
89
77 26
93
26
89
2 89
77 2
89
77
89
7763
77
69 82
6982
89
77
34
9334
37
93
34
34
37
39
35
39
1948
89
48
89
89
74
87
74
87
74
87
7487
90
90
90
90
90
4848
1948
89
8989
89
89
89
89
89
89
11
1
26
1948
1948
1948
77
78
77
77
77
77
77
78
78
78
7878
48
48
87
74
8774
87
26
26
29 29
12
77
77
8774
19
33
779
107
107 115
115
115
115
5049
104
105
50
49104
105
5049
104
105
50
49104
105
78
78
7878
78
78
78
90
90
90
9090
90
90
90
90 7747
26
13
56
13
56
13
81
93
9393
93
93
93
93
93
93
93
93
93
93
93
93
93
93
93
93
93 93
93
93
5151
1
8181
8181
81
81
81
81
81
81
81
81
1
78
78
78
78
78
1
1
26
26
2649
104
49112
48 116
48116
48 116
49 112
26
50113
89
71
84
66 105
6610564104
64 104
80 80
1
50
114
26
26
49
112102
64
80
811
78
78
1
80
5050
105
105
52
64104
78
92
92
78
78
1
26
90
90
90
50
50
50
1
26
7874
7474
74
74
74
74
89
8715
15
106105
105
77112
26
2626
44
26
80
80
80 80
8092 92
92
92
9
29841
84
871
87
87
87
87
87
87
87
87
87
87
87
87
87
87
87
87
87
87
87
87
87
87
77
90 9090
9090 90
90
90
90
2978
2978
78
78
78
78
87
87
87
87
87
87
87
8715
15
15
71
71
65
74
7474
7474
7474
7474
7474
74
7474
74
7474
74 74
74
89
74
74
74
74
74
74
74
74
74
74
74
74
74
7448
91
79
91
79
89
89
8989
89
29
77
77
77
77
29
2689
7777
501045010450104
49105
49105
49105
36
36
36
36
36
36
3636
36
36 36
36
36 36
3636
36
36
36
36
36
33 33
33
33
33
33
33
33
33
3333 33
33
333333
36 51
8719
8719
29
10619 38 19 38 19 38 19 38
29 29
3317
17 17 17 17
34 34 34
34
34 3434
3433
37
37
37
34
34
37
37
3434
39
39
37
37
37
37
37
37
37
37
37
373737
26
93
39
39
39
39
39
39
39
39
9328
35
35
35
3535
3535
35
35
35
3526
26
34
34
34
34
34
35
35
35
35
35
3535
35
35
35
35
35
35
35
3535
35
3539
3939
39
39
39
39
39
39
39
39
39
39
39
39
39
3939
39
39
39
39
39
93
93
93
93
93
93
93
9393
93
93
93
93
93
93
93
9393939393
93
35 35
35
35
39
29
10449 115 50105
39
39
39
39
39
35
81
81
8181
81
8181
81
81
8181
81
81
81
81
81
81
81
8181
81
74
87
74
87 87 68
6868
82
82
82
82
69
69
69
6969
22
93
82
82
8282
8282
8282
82
82182
82
82
8282
82 11
26
26
11 82
26
26
26
26
55
55
55
55
5555
1
93
93
93
93
1
93
93
93
93
93
93
2
2
8268
81
81
81
81
81 27 81
121
63
63
63
63
414
27
26
26
26
81
81
81
81
81
81
81
81
81
81
81
93
93
93
93
93
93
93
93
1
1
1
26
26
26
2626
26
26
26
26
26
19
19
19
19
19
26 1926 2649 109
49
4926
118118
26
49 118
49118
49 118
49 118
51
49 118
86
86
73
73
73
49118
89
88
89
77
77
77
50119
50119
50119
50119
50119
51
50110
26
77 26 77 120
49118
2650
110
89 26 89 120 50110
120772677
89 26 89
49109
9326
1
26
49
109
81
81
93
93
93
93
93
93
93
93
93
93
93
93
93
93
93 93
8181
8181
8181
81
81
81
81
81
81
81
1922
49
109120
2
2
81
93
93
12089 50
1102674
9191
2674
913
79
79 7926 79
89 7474
77
7768
8968
71
71 69
82
8284
84
84 681
69
69
26
82 82
82
82
82
8282
82
82
82
82
82
82
82
82
82
68
68
68
68
69
69
69
69
69
69
6969
69
69
69
68
68
26
27
2626
69
69
87 2
87
87
74
74
74
74
2
87
87
87
87
87
8787
7474
74
74
74
2
7979
7987
87
87
87
1
22
2
69262
9191
91
79
5
5
2
229
2967
8
9497
49118
50
50
110
10555
68
5
5
91
91
50
110
50
110
120
120
120
120
120
26
2
291
5149
109
49
109
9179
79
91
9191
9191
79
79
79
7979
91
91
9191919191
919191
9179
79
79 7979
7979
79 79
87
87
87
87
8787 87
74
74
7474
7474
87 8787
74 74 7429
26
26
2
65
1
1
1
49109
26
26
50
119
26
129
8229
1
82
82
82
83
83
72
6982
6982
83
69
72
8269
82
69
82
69
82
69
8269
6060
6060
1
173
89
77
89
77
91
79
91
79
Greenpoint-Williamsburg Rezoning EIS On-Street Parking Regulations
Figure 16-7a
Parking Regulation21Legend: 1/4 Mile Radius From Projected Development Sites
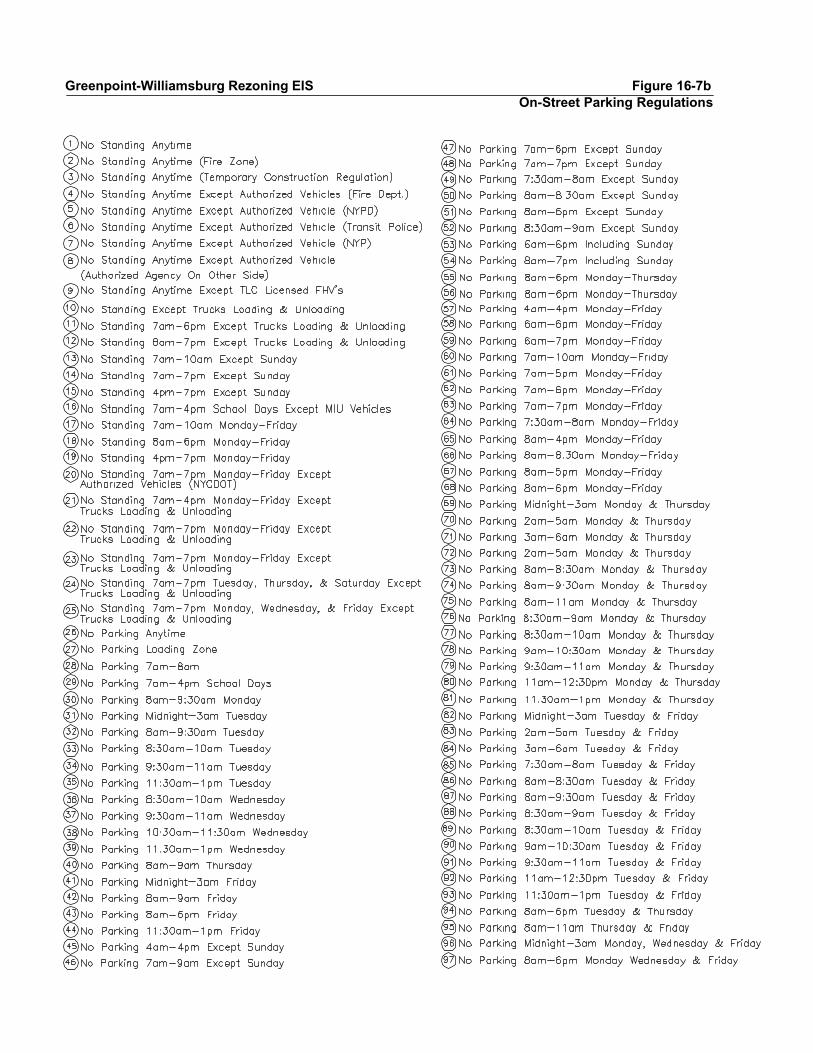
Greenpoint-Williamsburg Rezoning EIS Figure 16-7b On-Street Parking Regulations

On-Street Parking RegulationsFigure 16-7cGreenpoint-Williamsburg Rezoning EIS

Greenpoint-Williamsburg Rezoning EIS Chapter 16: Traffic and Parking
16-15
C. THE FUTURE WITHOUT THE PROPOSED ACTION (NO-ACTION)
Between 2003 and 2013, it is expected that traffic and parking demands in the study area would increase
due to long-term background growth as well as development that could occur pursuant to existing zoning
or approved BSA variances on 30 of the 76 projected development sites. Truck traffic is likely to decrease
in keeping with the long-term downward trend in industrial activity in the area. Development on projected
development sites is expected to consist of a total of approximately 866 new dwelling units and 68,500
square feet of new commercial/retail space. In order to forecast the future conditions without the proposed
action (the No-Action condition), any residential development project with 200 or more new housing
units and any development with a retail/commercial component listed in Table 1-1 in Chapter 1, “Project
Description,” and Table 2-3 and shown in Figure 2-6 in Chapter 2, “Land Use, Zoning and Public Policy,”
were considered, in addition to an annual background growth rate of one percent per year applied to
existing traffic and parking demand for the 2003 through 2013 period. This background growth rate is
applied to account for smaller projects and general increases in travel demand not attributable to specific
development projects. Individual sites which would introduce fewer than 200 new dwelling units to the
study area and have no retail component are assumed to be included in background growth. Although
none of the projected development sites would include 200 or more new dwelling units, five sites have
a proposed retail/commercial component and are considered separate No-Action sites. These include:
! On Site 3, located on the west side of West Street between Freeman and Green Streets, it is
anticipated that a portion of the site would be developed with a 15,000 square-foot catering
hall.
! Site 55, an L-shaped parcel in Greenpoint occupying the entire west side of Franklin Street
between Kent Street and Greenpoint Avenue and approximately three-quarters of the block
frontage on the north side of Greenpoint Avenue from Franklin Street toward West Street. At
this location, approximately 12,000 square feet of an existing light manufacturing facility
would be converted to retail.
! Site 102, located on the north side of North 11 Street mid-block between Driggs Avenue andth
Roebling Street in Williamsburg, where a 10,000 square foot warehousing facility would be
converted for retail use. An existing 2,500 square foot auto care center on this site would
remain in operation.
! Site 130, occupying the entire east side of Union Avenue between Richardson Street and Frost
Street in Williamsburg, where an existing 27,500 square foot vacant industrial building would
be converted for retail use.
! Site 207, located on the north side of North 6 Street east of Berry Street in Williamsburg,th
where an existing 4,000 square foot warehousing facility would be converted to retail use.
In addition to development on projected development sites, NYCDCP has identified four No-Action
projects that are within the traffic study area or would generate vehicular traffic that would traverse the
study area. These projects, described below, would introduce 1,596 new dwelling units and 70,399 square
feet of new retail space.
! The Kedem Winery and Schaefer Brewery sites on the waterfront along Kent Avenue between
South 8 and South 10 Streets would be redeveloped into mixed-use residential and retailth th
Greenpoint-Williamsburg Rezoning EIS Chapter 16: Traffic and Parking
16-16
uses. The development of the Kedem site would consist of 450 new dwelling units and 26,900
square feet of retail/commercial space, while the Schaefer site would consist of 350 dwelling
units and 12,400 square feet of retail/commercial space.
! The Domsey clothing warehouse at 431 Kent Avenue between South 8 and South 11 Streetsth th
would be redeveloped into 540 dwelling units.
! 184 Kent Avenue, an existing 400,000 square foot partially converted industrial building within
the proposed action area at Kent Avenue and North 3 Street in Williamsburg, would be furtherrd
converted to 256 dwelling units, approximately 27,124 square feet of retail/commercial space,
and an accessory parking garage.
Traffic generated by these four No-Action development sites and by the five projected development sites
discussed above was combined with existing traffic volumes and background growth for the 2003 through
2013 period to yield a 2013 No-Action traffic network. Figures 16-8 through 16-10 show the resulting
AM, midday and PM peak hour traffic volumes at study area intersections in the 2013 future without the
proposed action.
No-Action Changes to the Street Network
The New York City Department of Transportation has identified the need for the reconstruction of the
Franklin Street/Kent Avenue corridor through Greenpoint and Williamsburg. The New York City
Department of Design and Construction is the agency responsible for the design and construction of
Franklin Street/Kent Avenue, and this project would likely be implemented during the 2003 to 2013
period. Therefore, the physical and operational changes to this corridor that would result from the
reconstruction project, as identified in the NYCDDC/USDOT Kent Avenue/Franklin Street
Reconstruction Design Report, have been incorporated into the 2013 No-Action traffic network. These
changes, which affect two analyzed intersections, are described below.
! At the intersection of Franklin Street and Greenpoint Avenue, the existing westbound shared
left-turn/through/right-turn lane would be split into an exclusive left-turn lane and a shared
through-right turn lane. Parking would be eliminated on the north side of Greenpoint Avenue
east and west of Franklin Street to facilitate this improvement.
! At the intersection of Franklin Street and Calyer Street, the southbound approach would be
daylighted (i.e., curbside parking would be prohibited) in the AM peak hour, and the
northbound approach would be daylighted in the PM peak hour. The following sections
describe traffic and parking conditions in the future without the proposed action.
It should be noted that the New York State Department of Transportation (NYSDOT) is planning the
reconstruction or replacement of the Kosciuszko Bridge. Several alternatives are currently being
evaluated, some of which could result in changes to the street network. However, as the bridge and its
approaches are located outside the study area for Greenpoint-Williamsburg, and as a preferred alternative
has not yet been selected and the earliest possible start date for construction is in 2009, this project is not
included in this analysis.

ASH ST.
BOX ST.
CLAY ST.
DUPONT ST.
EAGLE ST.
FREEMAN ST.
GREEN ST.
HURON ST.
INDIA ST.
KENT ST.
JAVA ST.
COMMERCIAL ST.
GREENPOINT AVE.
PAIDGE AVE.
MILTON ST.
NOBLE ST.
WE
ST
ST
.P
RO
VO
ST
ST
.
MC
GU
INN
ES
S B
LV
D.
OAK ST.
QUAY ST.
CLIFFO
RD
PL.
GU
ER
NS
EY
ST.
LOR
IME
R S
T.
MA
NH
ATTA
N A
VE.
LEO
NA
RD
ST.
EC
KFO
RD
ST.
NE
WE
L ST.
DIA
MO
ND
ST.
JEW
EL S
T.
MO
ULTR
IE S
T.
BANKER ST
CALYER ST.
MESEROLE AVE.
3917639
28 134
33
32 168 67
22191
22
50189106
88 1046
50
5513
12 50
89129
50
1157 45
1326 7391
14067
391223980 11
44
3913
60
4761128
9 187
32
1918
413
6
66719
5512
22
3 11 6211 28 19
6110
5 76 17
12 66 11
660
11 73 11
12 66 11
665
10039
0 51
6 66
65
0 39 811 38 33
01112
647
38
167
11
150
73
616
6
173245
6 133
1114
5
128
33
5011
2
63511
83 11
39 28
3465
11039
6 44
11 626
11
644
11
17 6
68
168
44
212 50
225622
134
33
156 95
22102
56
95 11
150 39
66
33
89 17
100 39
171117
1096
33
1384 89
892833
1217
56
1536 22
1572251
50 17
44 33
62839
5017
11 6
1722 11
3951
34
28 240
139
84 251
87
8422
2839
28
212356
1 172
820
2
211022
16 314
38 360
240
8
7278
66
11714
11 45
11 77 223184
204
36
211
17
61117
338 43
321
13
129
368
336
743
2328
95 111111
28 128
11
3913
9
117
11 508750
455533
2820
6
11 179
445022
11 179
39 218
0
55
MEEKER AVE.
MEEKER AVE.
(EAST-BOUND)
(WEST-BOUND)
BROOKLYN-QUEENS
EXPRESSWAY
MCGUINESS
BLVD.
139468
6
11318
106240
751173
6760228
83456
HERBERT ST.
GRAHAM AVE.
LE
ON
AR
D S
T.
MANHATTAN AVE.
DRIGGS AVE.
101262
8450
10611
FR
AN
KL
IN S
T.
T.
GE
M S
T.
NORTH 15TH ST.
414
8101
339
53440
8
300
39612
33317
114
Figure 16-8a 2013 No-Action Greenpoint Traffic Volumes - AM Peak Hour
Greenpoint - Williamsburg Rezoning EIS
Analyzed Intersection (Unsignalized)Analyzed Intersection (Signalized)
Legend:No-Action Sites55

NORTH 13TH ST.
NORTH 12TH ST.
NORTH 11TH ST.
NORTH 10TH ST.
NORTH 9TH ST.
NORTH 8TH ST.
NORTH 7TH ST.
NORTH 6TH ST.
NORTH 5TH ST.
NORTH 4TH ST.
NORTH 3RD ST.
NORTH 1ST ST.
METROPOLITAN AVE.
WY
TH
E A
VE
.
BE
RR
Y S
T.
BE
DF
OR
D A
VE
.
RO
EB
LIN
G S
T.
HA
VE
ME
YE
R S
T.
UNION AVE.
BAYA
RD ST
.RIC
HARD
SON S
T.
FROST
ST.
WITH
ERS S
T.
LORIMER ST.
GRAND ST.
HOPE ST.
MA
RC
Y A
VE
.
MA
RC
Y A
VE
.
RO
DN
EY
ST.
KE
AP
ST
.
HOPE ST.
GRAND ST.
SOUTH 1ST ST.
SOUTH 2ND ST.
SOUTH 3RD ST.
FILLMORE PL.
SOUTH 4TH ST.
SOUTH 5TH ST.
LEE AVE.
BROADWAY
ROEB
LING
ST.
ST.
BROADWAY
DRIG
GS A
VE.
BEDF
ORD
AVE.
T.
DU
NH
AM
PL.
SOUTH 6TH ST.
HA
VE
ME
YE
R S
T.
DR
IGG
S A
VE
.
KEN
T A
VE.
RIV
ER
ST
.
133212
11 123 17
17 28 4511173
34
33 84
389
235
1065528
169
39
17933
691
219100
362
33 574
1717
16833
14516128
727669
230
44
7850
241
33
10678
263
11
5517
12821
33 218
5555
22 289
14588
32 290
73122
62 310
204 12
3318
166 60
1746
184 44
2877
179 33
2256
267
17
446
9556
6 267
3344
17 256
5533
17 271
14556
1718
4
407
28
322 22
424
330
293
5150
407
293
424
282
33
0
0
395
271
2844
406
2811 26
1
5
7
384
286
261
6
44
011
384
17
271
6
11
176
17
370 30
310 81
380
366
1011
2292
15911
6 33
11439
188
302 201
92
400
330
1117
310 33
407
12
201517
424
322
2111
395
29
282 17
392228 17
333
4418
39 279 56
1756
150
11
0
000
170
00
22
0
50
101812
1106
0000
181104
0
0
7
3
42 750
0
726
128 16
6128
2222
22
128
22
28 116
28
56139
89 55
16168
2856
55
179
45
28 100
44
28115
5033
39
89 0
50157
3373
289 55
305 17
624
229
10
6622
5045
22 229
13950
56 224
13850
95 224
5511
55 225
396
1233
317
114
288
401
60
6170
282 45
389 12
310
389
1711
370
374
1711
374 2
380
156
496
267
271
33
3518
50134
1719
5
5666
1117
2
2849
39 198
334
101
3883
272
28
3516
57 175
350
207
77
0
27
Greenpoint - Williamsburg Rezoning EIS 2013 No-Action Williamsburg Traffic Volumes - AM Peak Hour
Figure 16-8b
Legend:Analyzed Intersection (Signalized)Analyzed Intersection (Unsignalized)
No-Action Sites207

FR
AN
KL
IN S
T.
T.
GE
M S
T.
NORTH 15TH ST.
385
636
308
3639
18
156
30212
39317
66
LE
ON
AR
D S
T.
MANHATTAN AVE.
DRIGGS AVE.
8467
11217
161174
MEEKER AVE.
MEEKER AVE.
(EAST-BOUND)
(WEST-BOUND)
BROOKLYN-QUEENS
EXPRESSWAY
MCGUINESS
BLVD.
128490
6
17362
144240
517
89463
22
61728
HERBERT ST.
GRAHAM AVE.11
8
ASH ST.
BOX ST.
CLAY ST.
DUPONT ST.
EAGLE ST.
FREEMAN ST.
GREEN ST.
HURON ST.
INDIA ST.
KENT ST.
JAVA ST.
COMMERCIAL ST.
GREENPOINT AVE.
PAIDGE AVE.
MILTON ST.
NOBLE ST.
WE
ST
ST
.P
RO
VO
ST
ST
.
MC
GU
INN
ES
S B
LV
D.
OAK ST.
QUAY ST.
CLIFFO
RD
PL.
GU
ER
NS
EY
ST.
LOR
IME
R S
T.
MA
NH
ATTA
N A
VE.
LEO
NA
RD
ST.
EC
KFO
RD
ST.
NE
WE
L ST.
DIA
MO
ND
ST.
JEW
EL S
T.
MO
ULTR
IE S
T.
BANKER ST
CALYER ST.
MESEROLE AVE.
7322484
51 123
39
33 156 89
17167
35
50241168
98 985
56
69 801 67
364064
1132 85
890 7347
12973
331022285 11
20
50 930
8055173
11 147
35
1121
315
0
113411
0 38 2811 73 22
06
11
6 66 11
11 736
600
0 66 17
6 73 28
066
12633
6 44
6 67
66
0 44 66 28 51
066
650
28
150
11
134 67
1134
6
281738
6 123
2811
7
123
28
72 73
750
6
88 11
39 51
22110
17627
0 50
22 391122
1144
17 6
168
11
151 62
226228
151
39
106 73
17106
28
96 4
112 27
111745
73 6
84 39
62811
1038
50
899 22
403956
1038
62
893 44
1173467
17 253
7733
272
86
633 6
39 11
2828
33
3322
6 6
3439
44 44 28
12
28
55 6
44
170 50
281751
6 150
28 173
17611
17 299
28 382
253
6
7866
00
28617
6
12 67
11 77 223374
201
95
179
22
011
6
371 28
309
22
317
361
310
2131
286
78 222222
22 101
6
1710
6
135
6 3310655
332828
2714
6
28 151
456750
28 168
016
8
551711
50
Greenpoint - Williamsburg Rezoning EIS 2013 No-Action Greenpoint Traffic Volumes - MD Peak Hour
Figure 16-9a
Legend:Analyzed Intersection (Signalized)Analyzed Intersection (Unsignalized)
No-Action Sites55

72
NORTH 13TH ST.
NORTH 12TH ST.
NORTH 11TH ST.
NORTH 10TH ST.
NORTH 9TH ST.
NORTH 8TH ST.
NORTH 7TH ST.
NORTH 6TH ST.
NORTH 5TH ST.
NORTH 4TH ST.
NORTH 3RD ST.
NORTH 1ST ST.
METROPOLITAN AVE.
WY
TH
E A
VE
.
BE
RR
Y S
T.
BE
DF
OR
D A
VE
.
RO
EB
LIN
G S
T.
HA
VE
ME
YE
R S
T.
UNION AVE.
BAYA
RD ST
.RIC
HARD
SON S
T.
FROST
ST.
WITH
ERS S
T.
LORIMER ST.
GRAND ST.
HOPE ST.
MA
RC
Y A
VE
.
MA
RC
Y A
VE
.
RO
DN
EY
ST.
KE
AP
ST
.
HOPE ST.
GRAND ST.
SOUTH 1ST ST.
SOUTH 2ND ST.
SOUTH 3RD ST.
FILLMORE PL.
SOUTH 4TH ST.
SOUTH 5TH ST.
LEE AVE.
BROADWAY
ROEB
LING
ST.
ST.
BROADWAY
DRIG
GS A
VE.
BEDF
ORD
AVE.
T.
DU
NH
AM
PL.
SOUTH 6TH ST.
HA
VE
ME
YE
R S
T.
DR
IGG
S A
VE
.
KEN
T A
VE.
RIV
ER
ST
.
180196
6 52 226 22 446
18633
39 106
426
252
1306222 13
433
19228
665
269123
386
45 399
1111
20739
11716844
1133767
201
28
7366
190
28
9595
191
11
7856
13928
73 146
5580
50 330
89101
39 352
6284
62 318
28
3351
78 28
34117
134 22
72106
117 17
3962
273
22
4411
4495
11 273
2867
28 245
3550
11 212
7888
2213
4
309
33
327 22
287
390
310
3917
309
310
287
326
28
28
5
287
332
2224
127
304
69
320 22
268
3311
284
5
74
67
34
285
17
343 17
1111
339 13
316 10
339
314
1111
2298
142
18784 28 17
11850
200
139 324
1117
308
344
5513
333 22
294
44
116
10
304
327
2838
287
28
326 28
441717 15
622
4422
39 257 89
6
6
666
6
6
6347
5 131
0
44
0
0
000
00
00
1
3
0
0
1
0103
3
42 509
17
457
95 22
1180
3428
28
9711
44 95
22
4462
89 11
11130
3439
50
130
39
17 73
28
2278
7311
17
736
33119
5589
336 49
363 6
1734
157
17
6356
5622
33 180
8433
62 185
9539
95 190
516
84 183
302
1239
317
66
349
297
06
0205
339
315
1111
256
112
6617
123
3328
190
207
55
629
6284
56 150
67
28 84
5674
11 50
330
112
5078
61 164
339
207
83
34
40
0
366 5
297 5
297
316
5555
339 11
315 10
Figure 16-9b 2013 No-Action Williamsburg Traffic Volumes - MD Peak Hour
Greenpoint-Williamsburg Rezoning EIS
Analyzed Intersection (Signalized)Legend:
Analyzed Intersection (Unsignalized)No-Action Sites207

FR
AN
KL
IN S
T.
T.
GE
M S
T.
NORTH 15TH ST.
52411
432
13712
529
57
146
388
28
40611
105
LE
ON
AR
D S
T.
MANHATTAN AVE.
DRIGGS AVE.
168287
12373
8922
MEEKER AVE.
MEEKER AVE.
(EAST-BOUND)
(WEST-BOUND)
BROOKLYN-QUEENS
EXPRESSWAY
MCGUINESS
BLVD.
HERBERT ST.
GRAHAM AVE. 7860228
134686
6
145457
545125
64633
57411
ASH ST.
BOX ST.
CLAY ST.
DUPONT ST.
EAGLE ST.
FREEMAN ST.
GREEN ST.
HURON ST.
INDIA ST.
KENT ST.
JAVA ST.
COMMERCIAL ST.
GREENPOINT AVE.
PAIDGE AVE.
MILTON ST.
NOBLE ST.
WE
ST
ST
.P
RO
VO
ST
ST
.
MC
GU
INN
ES
S B
LV
D.
OAK ST.
QUAY ST.
CLIFFO
RD
PL.
GU
ER
NS
EY
ST.
LOR
IME
R S
T.
MA
NH
ATTA
N A
VE.
LEO
NA
RD
ST.
EC
KFO
RD
ST.
NE
WE
L ST.
DIA
MO
ND
ST.
JEW
EL S
T.
MO
ULTR
IE S
T.
BANKER ST
CALYER ST.
MESEROLE AVE.
1744
1117
6 61
660 61
7 556
17
39
106
11
45 44
1728
5
227
11
7310
6
1166
6
223456
6 227
1115
7
255
28
162
93
62717
9368184
6 261
34
1124
015
2
66124
1 370
106
5624
714
1
6 109
416 95 39
01111
6 150
6
610
7 22
606
6 133
11
17 85 39
505
7539
0 100
0 90
511
5 94 160 46 56
0116
6115
46
104
6
73 33
61733
131
6
117 33
112844
212
44
132 78
17133
3322
344
190 44
22104
22
6224962
62 141
44
34 190
106
22184
41
391243998 14
91
3910
46
1516 84
1007 7869
23473
50280145
158
1388
78
63 874
139
62190
67
1686
28
975 50
735861
1748
73
1051 22
1674444
1767 6
16 6
2838
44
7844
11 6
3334
56 28 33
033
99 0
56
281750
5 267
19 227
311017
10 436
22 401
370
12
113
138
116
17618
6 78
22 89 1193149
240 95
289
28
61111
397 35
437
32
649
381
453
1423
281
28 100
6
3211
7
155
20 33201101
315744
3317
9
22 223
222950
47 198
19 212
98
2812
554017
28
2013 No-Action Greenpoint Traffic Volumes - PM Peak HourGreenpoint - Williamsburg Rezoning EIS Figure 16-10a
Legend:Analyzed Intersection (Signalized)Analyzed Intersection (Unsignalized)
No-Action Sites55

NORTH 13TH ST.
NORTH 12TH ST.
NORTH 11TH ST.
NORTH 10TH ST.
NORTH 9TH ST.
NORTH 8TH ST.
NORTH 7TH ST.
NORTH 6TH ST.
NORTH 5TH ST.
NORTH 4TH ST.
NORTH 3RD ST.
NORTH 1ST ST.
METROPOLITAN AVE.
WY
TH
E A
VE
.
BE
RR
Y S
T.
BE
DF
OR
D A
VE
.
RO
EB
LIN
G S
T.
HA
VE
ME
YE
R S
T.
UNION AVE.
BAYA
RD ST
.RIC
HARD
SON S
T.
FROST
ST.
WITH
ERS S
T.
LORIMER ST.
GRAND ST.
HOPE ST.
MA
RC
Y A
VE
.
MA
RC
Y A
VE
.
RO
DN
EY
ST.
KE
AP
ST
.
HOPE ST.
GRAND ST.
SOUTH 1ST ST.
SOUTH 2ND ST.
SOUTH 3RD ST.
FILLMORE PL.
SOUTH 4TH ST.
SOUTH 5TH ST.
LEE AVE.
BROADWAY
ROEB
LING
ST.
ST.
BROADWAY
DRIG
GS A
VE.
BEDF
ORD
AVE.
ST.
DU
NH
AM
PL.
SOUTH 6TH ST.
HA
VE
ME
YE
R S
T.
DR
IGG
S A
VE
.
KEN
T A
VE.
RIV
ER
ST
.
228262
28 97 2217 22 6711
26339
56 134
571
352
1848922
207
50
26333
1078
385139
498
35 584
3328
23439
11989
50
1146995
285
22
6244
272
22
5480
278
17
8328
10129
56 262
7368
39 376
9595
79 370
6778
39 398
166 17
2851
182 39
2267
222 17
2289
201
67
2284
323
44
4028
4467
17 334
4988
22 329
3050
22 361
10168
1121
2
509
39
363 29
515
33
375 28
1744
509
375
515
353
54
17
493
370
1735
6
18
482
2825 36
4
18
17
461
330
362
6
40
049
504
17
360
6
11
11622
518 18
370 30
525
355
256
28122
289
1211
529
367
389
359 25
524
11
878
518
363
2130
516328 31
822
6412
56 271 78
4
5
506
487
33
348 2217
12
0611
11
4039
7 208
2
28 22
16584
23962
402
614 201
229
1
000
00
000
0
44
0
3
50 696
11
446
152
28
5611
22 101
17
106 6
55119
22
2295
112 11
22147
1033
33
136
33
22 123
28
3378
139 12
11136
5130
16
3373
416 33
393 11
2246
19
39
272
11939
5028
44 267
8944
56 250
11233
78 274
8011
61 268
406 11
105
371
510
06
11310
382 11
516 21
370
516
2320
518
367
3317
367 13
525
10
334
67
4417
361
56
2233
361
50
1729
3384
27 217
62110
27 177
4463
17 177
387 78
5056
510
39
72 216
346
207
135
38
73
Figure 16-10b 2013 No-Action Williamsburg Traffic Volumes - PM Peak Hour
Greenpoint-Williamsburg Rezoning EIS
Analyzed Intersection (Signalized)Analyzed Intersection (Unsignalized)
No-Action SitesLegend:
207
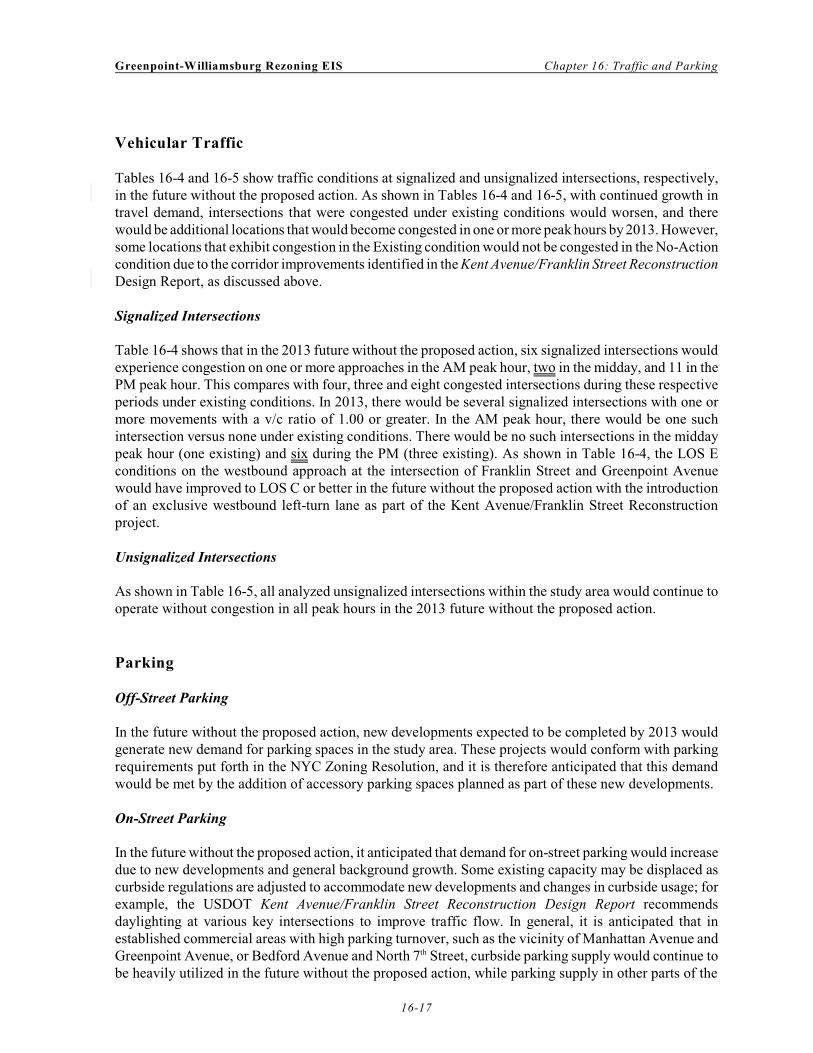
Greenpoint-Williamsburg Rezoning EIS Chapter 16: Traffic and Parking
16-17
Vehicular Traffic
Tables 16-4 and 16-5 show traffic conditions at signalized and unsignalized intersections, respectively,
in the future without the proposed action. As shown in Tables 16-4 and 16-5, with continued growth in
travel demand, intersections that were congested under existing conditions would worsen, and there
would be additional locations that would become congested in one or more peak hours by 2013. However,
some locations that exhibit congestion in the Existing condition would not be congested in the No-Action
condition due to the corridor improvements identified in the Kent Avenue/Franklin Street Reconstruction
Design Report, as discussed above.
Signalized Intersections
Table 16-4 shows that in the 2013 future without the proposed action, six signalized intersections would
experience congestion on one or more approaches in the AM peak hour, two in the midday, and 11 in the
PM peak hour. This compares with four, three and eight congested intersections during these respective
periods under existing conditions. In 2013, there would be several signalized intersections with one or
more movements with a v/c ratio of 1.00 or greater. In the AM peak hour, there would be one such
intersection versus none under existing conditions. There would be no such intersections in the midday
peak hour (one existing) and six during the PM (three existing). As shown in Table 16-4, the LOS E
conditions on the westbound approach at the intersection of Franklin Street and Greenpoint Avenue
would have improved to LOS C or better in the future without the proposed action with the introduction
of an exclusive westbound left-turn lane as part of the Kent Avenue/Franklin Street Reconstruction
project.
Unsignalized Intersections
As shown in Table 16-5, all analyzed unsignalized intersections within the study area would continue to
operate without congestion in all peak hours in the 2013 future without the proposed action.
Parking
Off-Street Parking
In the future without the proposed action, new developments expected to be completed by 2013 would
generate new demand for parking spaces in the study area. These projects would conform with parking
requirements put forth in the NYC Zoning Resolution, and it is therefore anticipated that this demand
would be met by the addition of accessory parking spaces planned as part of these new developments.
On-Street Parking
In the future without the proposed action, it anticipated that demand for on-street parking would increase
due to new developments and general background growth. Some existing capacity may be displaced as
curbside regulations are adjusted to accommodate new developments and changes in curbside usage; for
example, the USDOT Kent Avenue/Franklin Street Reconstruction Design Report recommends
daylighting at various key intersections to improve traffic flow. In general, it is anticipated that in
established commercial areas with high parking turnover, such as the vicinity of Manhattan Avenue and
Greenpoint Avenue, or Bedford Avenue and North 7 Street, curbside parking supply would continue toth
be heavily utilized in the future without the proposed action, while parking supply in other parts of the
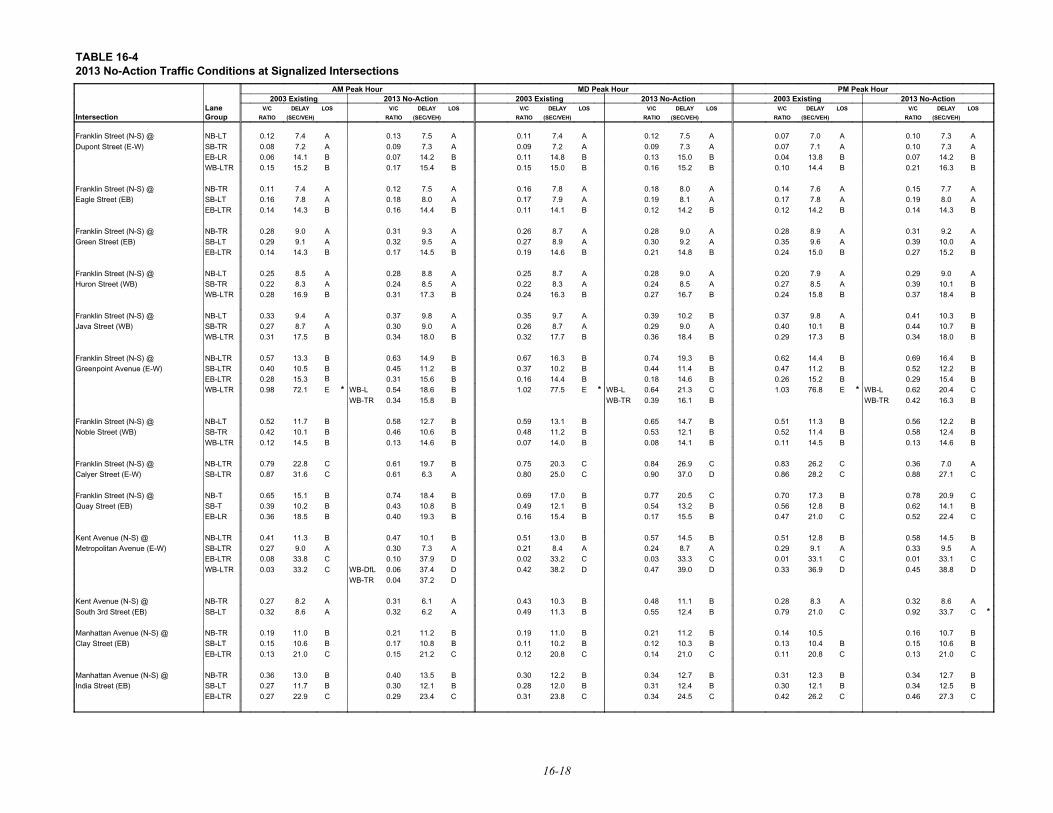
TABLE 16-42013 No-Action Traffic Conditions at Signalized Intersections
B15.30.28
PM Peak HourMD Peak HourAM Peak Hour2013 No-Action2003 Existing2013 No-Action2003 Existing2013 No-Action2003 Existing
LOSDELAYV/CLOSDELAYV/CLOSDELAYV/CLOSDELAYV/CLOSDELAYV/CLOSDELAYV/CLane(SEC/VEH)RATIO(SEC/VEH)RATIO(SEC/VEH)RATIO(SEC/VEH)RATIO(SEC/VEH)RATIO(SEC/VEH)RATIOGroupIntersection
A7.30.10A7.00.07A7.50.12A7.40.11A7.50.13A7.40.12NB-LTFranklin Street (N-S) @A7.30.10A7.10.07A7.30.09A7.20.09A7.30.09A7.20.08SB-TRDupont Street (E-W)B14.20.07B13.80.04B15.00.13B14.80.11B14.20.07B14.10.06EB-LRB16.30.21B14.40.10B15.20.16B15.00.15B15.40.17B15.20.15WB-LTR
A7.70.15A7.60.14A8.00.18A7.80.16A7.50.12A7.40.11NB-TRFranklin Street (N-S) @A8.00.19A7.80.17A8.10.19A7.90.17A8.00.18A7.80.16SB-LTEagle Street (EB)B14.30.14B14.20.12B14.20.12B14.10.11B14.40.16B14.30.14EB-LTR
A9.20.31A8.90.28A9.00.28A8.70.26A9.30.31A9.00.28NB-TRFranklin Street (N-S) @A10.00.39A9.60.35A9.20.30A8.90.27A9.50.32A9.10.29SB-LTGreen Street (EB)B15.20.27B15.00.24B14.80.21B14.60.19B14.50.17B14.30.14EB-LTR
A9.00.29A7.90.20A9.00.28A8.70.25A8.80.28A8.50.25NB-LTFranklin Street (N-S) @B10.10.39A8.50.27A8.50.24A8.30.22A8.50.24A8.30.22SB-TRHuron Street (WB)B18.40.37B15.80.24B16.70.27B16.30.24B17.30.31B16.90.28WB-LTR
B10.30.41A9.80.37B10.20.39A9.70.35A9.80.37A9.40.33NB-LTFranklin Street (N-S) @B10.70.44B10.10.40A9.00.29A8.70.26A9.00.30A8.70.27SB-TRJava Street (WB)B18.00.34B17.30.29B18.40.36B17.70.32B18.00.34B17.50.31WB-LTR
B16.40.69B14.40.62B19.30.74B16.30.67B14.90.63B13.30.57NB-LTRFranklin Street (N-S) @B12.20.52B11.20.47B11.40.44B10.20.37B11.20.45B10.50.40SB-LTRGreenpoint Avenue (E-W)B15.40.29B15.20.26B14.60.18B14.40.16B15.60.31EB-LTRC20.40.62WB-L*E76.81.03C21.30.64WB-L*E77.51.02B18.60.54WB-L*E72.10.98WB-LTRB16.30.42WB-TRB16.10.39WB-TRB15.80.34WB-TR
B12.20.56B11.30.51B14.70.65B13.10.59B12.70.58B11.70.52NB-LTFranklin Street (N-S) @B12.40.58B11.40.52B12.10.53B11.20.48B10.60.46B10.10.42SB-TRNoble Street (WB)B14.60.13B14.50.11B14.10.08B14.00.07B14.60.13B14.50.12WB-LTR
A7.00.36C26.20.83C26.90.84C20.30.75B19.70.61C22.80.79NB-LTRFranklin Street (N-S) @C27.10.88C28.20.86D37.00.90C25.00.80A6.30.61C31.60.87SB-LTRCalyer Street (E-W)
C20.90.78B17.30.70C20.50.77B17.00.69B18.40.74B15.10.65NB-TFranklin Street (N-S) @B14.10.62B12.80.56B13.20.54B12.10.49B10.80.43B10.20.39SB-TQuay Street (EB)C22.40.52C21.00.47B15.50.17B15.40.16B19.30.40B18.50.36EB-LR
B14.50.58B12.80.51B14.50.57B13.00.51B10.10.47B11.30.41NB-LTRKent Avenue (N-S) @A9.50.33A9.10.29A8.70.24A8.40.21A7.30.30A9.00.27SB-LTRMetropolitan Avenue (E-W)C33.10.01C33.10.01C33.30.03C33.20.02D37.90.10C33.80.08EB-LTRD38.80.45D36.90.33D39.00.47D38.20.42D37.40.06WB-DfLC33.20.03WB-LTR
D37.20.04WB-TR
A8.60.32A8.30.28B11.10.48B10.30.43A6.10.31A8.20.27NB-TRKent Avenue (N-S) @*C33.70.92C21.00.79B12.40.55B11.30.49A6.20.32A8.60.32SB-LTSouth 3rd Street (EB)
B10.70.1610.50.14B11.20.21B11.00.19B11.20.21B11.00.19NB-TRManhattan Avenue (N-S) @B10.60.15B10.40.13B10.30.12B10.20.11B10.80.17B10.60.15SB-LTClay Street (EB)C21.00.13C20.80.11C21.00.14C20.80.12C21.20.15C21.00.13EB-LTR
B12.70.34B12.30.31B12.70.34B12.20.30B13.50.40B13.00.36NB-TRManhattan Avenue (N-S) @B12.50.34B12.10.30B12.40.31B12.00.28B12.10.30B11.70.27SB-LTIndia Street (EB)C27.30.46C26.20.42C24.50.34C23.80.31C23.40.29C22.90.27EB-LTR
16-18
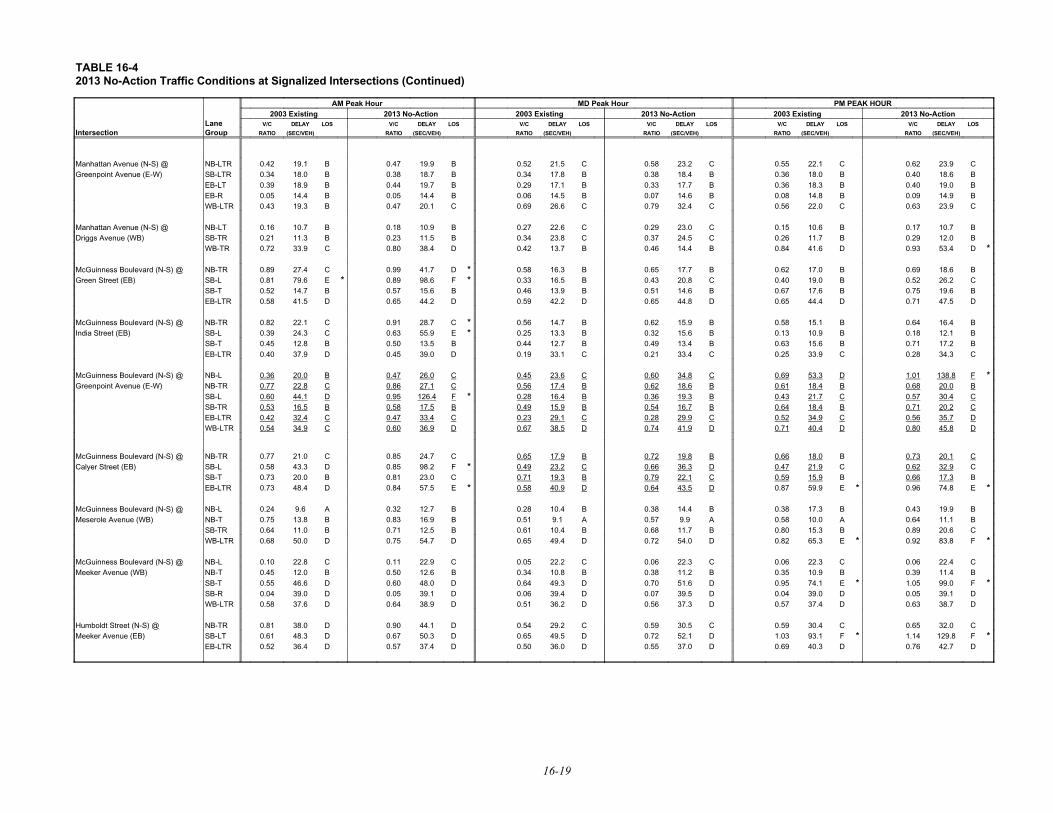
TABLE 16-42013 No-Action Traffic Conditions at Signalized Intersections (Continued)
PM PEAK HOURMD Peak HourAM Peak Hour2013 No-Action2003 Existing2013 No-Action2003 Existing2013 No-Action2003 Existing
LOSDELAYV/CLOSDELAYV/CLOSDELAYV/CLOSDELAYV/CLOSDELAYV/CLOSDELAYV/CLane(SEC/VEH)RATIO(SEC/VEH)RATIO(SEC/VEH)RATIO(SEC/VEH)RATIO(SEC/VEH)RATIO(SEC/VEH)RATIOGroupIntersection
C23.90.62C22.10.55C23.20.58C21.50.52B19.90.47B19.10.42NB-LTRManhattan Avenue (N-S) @B18.60.40B18.00.36B18.40.38B17.80.34B18.70.38B18.00.34SB-LTRGreenpoint Avenue (E-W)B19.00.40B18.30.36B17.70.33B17.10.29B19.70.44B18.90.39EB-LTB14.90.09B14.80.08B14.60.07B14.50.06B14.40.05B14.40.05EB-RC23.90.63C22.00.56C32.40.79C26.60.69C20.10.47B19.30.43WB-LTR
B10.70.17B10.60.15C23.00.29C22.60.27B10.90.18B10.70.16NB-LTManhattan Avenue (N-S) @B12.00.29B11.70.26C24.50.37C23.80.34B11.50.23B11.30.21SB-TRDriggs Avenue (WB)
*D53.40.93D41.60.84B14.40.46B13.70.42D38.40.80C33.90.72WB-TR
B18.60.69B17.00.62B17.70.65B16.30.58*D41.70.99C27.40.89NB-TRMcGuinness Boulevard (N-S) @C26.20.52B19.00.40C20.80.43B16.50.33*F98.60.89*E79.60.81SB-LGreen Street (EB)B19.60.75B17.60.67B14.60.51B13.90.46B15.60.57B14.70.52SB-TD47.50.71D44.40.65D44.80.65D42.20.59D44.20.65D41.50.58EB-LTR
B16.40.64B15.10.58B15.90.62B14.70.56*C28.70.91C22.10.82NB-TRMcGuinness Boulevard (N-S) @B12.10.18B10.90.13B15.60.32B13.30.25*E55.90.63C24.30.39SB-LIndia Street (EB)B17.20.71B15.60.63B13.40.49B12.70.44B13.50.50B12.80.45SB-TC34.30.28C33.90.25C33.40.21C33.10.19D39.00.45D37.90.40EB-LTR
*F138.81.01D53.30.69C34.80.60C23.60.45C26.00.47B20.00.36NB-LMcGuinness Boulevard (N-S) @B20.00.68B18.40.61B18.60.62B17.40.56C27.10.86C22.80.77NB-TRGreenpoint Avenue (E-W)C30.40.57C21.70.43B19.30.36B16.40.28*F126.40.95D44.10.60SB-LC20.20.71B18.40.64B16.70.54B15.90.49B17.50.58B16.50.53SB-TRD35.70.56C34.90.52C29.90.28C29.10.23C33.40.47C32.40.42EB-LTRD45.80.80D40.40.71D41.90.74D38.50.67D36.90.60C34.90.54WB-LTR
C20.10.73B18.00.66B19.80.72B17.90.65C24.70.85C21.00.77NB-TRMcGuinness Boulevard (N-S) @C32.90.62C21.90.47D36.30.66C23.20.49*F98.20.85D43.30.58SB-LCalyer Street (EB)B17.30.66B15.90.59C22.10.79B19.30.71C23.00.81B20.00.73SB-T
*E74.80.96*E59.90.87D43.50.64D40.90.58*E57.50.84D48.40.73EB-LTR
B19.90.43B17.30.38B14.40.38B10.40.28B12.70.32A9.60.24NB-LMcGuinness Boulevard (N-S) @B11.10.64A10.00.58A9.90.57A9.10.51B16.90.83B13.80.75NB-TMeserole Avenue (WB)C20.60.89B15.30.80B11.70.68B10.40.61B12.50.71B11.00.64SB-TR
*F83.80.92*E65.30.82D54.00.72D49.40.65D54.70.75D50.00.68WB-LTR
C22.40.06C22.30.06C22.30.06C22.20.05C22.90.11C22.80.10NB-LMcGuinness Boulevard (N-S) @B11.40.39B10.90.35B11.20.38B10.80.34B12.60.50B12.00.45NB-TMeeker Avenue (WB)
*F99.01.05*E74.10.95D51.60.70D49.30.64D48.00.60D46.60.55SB-TD39.10.05D39.00.04D39.50.07D39.40.06D39.10.05D39.00.04SB-RD38.70.63D37.40.57D37.30.56D36.20.51D38.90.64D37.60.58WB-LTR
C32.00.65C30.40.59C30.50.59C29.20.54D44.10.90D38.00.81NB-TRHumboldt Street (N-S) @*F129.81.14*F93.11.03D52.10.72D49.50.65D50.30.67D48.30.61SB-LTMeeker Avenue (EB)
D42.70.76D40.30.69D37.00.55D36.00.50D37.40.57D36.40.52EB-LTR
16-19

TABLE 16-42013 No-Action Traffic Conditions at Signalized Intersections (Continued)
PM Peak HourMD Peak HourAM Peak Hour2013 No-Action2003 Existing2013 No-Action2003 Existing2013 No-Action2003 Existing
LOSDELAYV/CLOSDELAYV/CLOSDELAYV/CLOSDELAYV/CLOSDELAYV/CLOSDELAYLane(SEC/VEH)RATIO(SEC/VEH)RATIO(SEC/VEH)RATIO(SEC/VEH)RATIO(SEC/VEH)RATIO(SEC/VEH)GroupIntersection
C25.70.38C25.20.34C25.70.37C25.10.34C23.70.24C23.40.22NB-LTRBedford Avenue (NB) @B15.70.13B15.50.11B15.50.11B15.40.09B15.40.10B15.20.08EB-LTBroadway (E-W)B16.80.23B16.20.18B15.50.11B15.40.10B15.90.15B15.70.13WB-T
A9.60.42A9.00.37A8.50.32A8.10.29A9.50.41A9.00.37SB-LTDriggs Avenue (SB) @D37.70.55D36.00.50D50.30.77D44.90.70D49.70.77D44.50.70EB-TRNorth 7th Street (EB)
C27.80.56C26.30.51B19.40.17B19.20.16B19.70.20B19.50.18SB-LTRDriggs Avenue (SB) @C29.70.62C27.60.55C24.70.45C23.60.40C23.10.38C21.80.31EB-TRMetropolitan Avenue (E-W)D41.30.78C31.80.63C27.00.50C25.30.44C22.40.33C21.50.28WB-LT
C22.20.34C21.70.31C20.20.19B20.00.17C20.90.24C20.60.22SB-LTRDriggs Avenue (SB) @B20.00.15B19.80.13B19.70.13B19.60.12B19.70.13B19.50.11EB-TRGrand Street (E-W)C22.00.27C21.50.24B19.70.12B19.50.11B19.40.11B19.20.10WB-LT
C27.60.27C27.30.24C26.20.15C26.10.14C26.80.20C26.60.18NB-LTRRoebling Street (N-S) @C26.70.19C26.50.17C27.10.22C26.80.20C27.90.29C27.50.26SB-LTMetropolitan Avenue (E-W)C25.40.07C25.30.06C24.90.02C24.80.01C25.00.03C25.00.03SB-RB16.60.41B15.90.37B15.20.31B14.70.28B15.30.32B14.50.26EB-LTR
*E65.51.00D37.50.85D37.70.84C28.90.74C32.20.78C25.00.67WB-LTR
C29.40.40C28.90.37C28.20.31C27.80.28C27.80.28C27.40.25NB-LRHavemeyer Street (NB) @B17.50.46B16.70.41B15.20.32B14.80.29B15.60.34B14.70.28EB-TMetropolitan Avenue (E-W)C23.50.70C20.60.60B19.80.56B18.50.51B14.60.31B14.30.27WB-T
D42.70.70D40.50.63D44.10.70D41.50.63D39.40.56D37.30.47EB-TRMarcy Avenue (SB) @*F97.21.14*E59.21.03C30.90.88C24.10.79*F83.71.09*D52.60.99WB-LMetropolitan Avenue (E-W)
A0.60.35A0.50.31A0.90.37A0.70.33A0.80.36A0.70.32WB-TR
*F87.60.97*E68.20.87*F86.80.99*E67.20.90*F85.80.99*E66.20.90NB-LTRUnion Avenue (N-S) @D35.50.40C34.80.36D49.70.73D45.80.66D44.70.64D42.20.58SB-LTRMetropolitan Avenue (E-W)C22.60.76B19.30.69B17.90.63B16.10.56B15.80.55B14.00.47EB-LTRC25.10.81B19.70.71B19.00.67B16.80.60*D41.40.94C28.60.84WB-LTR
C20.90.26B18.30.19B17.70.18B15.50.10B14.90.05B14.40.02NB-LRoebling Street (N-S) @B14.60.05B14.60.04B14.50.04B14.40.03B14.90.08B14.80.07NB-RBroadway (E-W)C24.00.72C22.70.66C21.60.61B17.80.38C22.50.65B18.30.42SB-LT
*F100.61.06*E67.70.93*E77.00.97*E58.70.87D38.50.61C35.00.50EB-TR*F193.91.19WB-DfL*F90.50.86C31.20.40C30.00.33C29.50.31C28.80.26WB-LT
C34.20.50WB-TC32.10.41
ABBREVIATION: EB-Eastbound, WB-Westbound, NB-Northbound, SB-Southbound L-Left, T-Through, R-Right, E-W: East-West Roadway, N-S: North-South Roadway V/C Ratio - Volume to Capacity Ratio SEC/VEH - Seconds per Vehicle LOS - Level of Service * - Denotes Congested Location (LOS E or F, or v/c ratio > 0.90)
16-20

TABLE 16-52013 No-Action Traffic Conditions at Unsignalized Intersections
PM Peak HourMD Peak HourAM Peak Hour2003 Existing2003 Existing2003 Existing 2013 No-Action2013 No-Action2013 No-Action
LOSDELAYV/CLOSDELAYV/CLOSDELAYV/CLOSDELAYV/CLOSDELAYV/CLOSDELAYLane(SEC/VEH)RATIO(SEC/VEH)RATIO(SEC/VEH)RATIO(SEC/VEH)RATIO(SEC/VEH)RATIO(SEC/VEH)GroupIntersection
A9.30.14A9.20.12A9.10.07A9.10.06A9.20.06A9.20.05WB-LRWest Street (N-S) @Freeman Street (WB)
A7.40.00NB-LTA7.40.00NB-LTA7.50.00A7.50.00A7.40.01A7.40.01NB-LTRWest Street (N-S) @A7.50.01A7.50.01A7.60.00A7.60.00A7.70.01A7.6SB-LTRGreen Street (E-W)B10.20.03A10.00.02A9.70.02A9.70.01A9.40.03A9.30.03EB-LTR
A7.40.00A7.40.00A7.50.00A7.50.00A7.50.00A7.4NB-LTWest Street (N-S) @A9.30.02A9.30.02A9.50.01A9.40.01A9.10.01A9.00.01EB-LRHuron Street (E-W)B10.50.08B10.30.07A9.60.07A9.50.06A10.00.07A9.80.06WB-LTR
A7.60.01A7.50.01A7.60.00A7.60.00A7.50.01A7.50.01NB-LTRWest Street (N-S) @A7.50.01A7.60.01A7.70.01A7.70.01A7.40.01A7.40.01SB-LTRIndia Street (E-W)B10.10.02A9.90.01B10.20.02A10.00.02A10.00.02A9.80.02EB-LTR
A7.60.00A7.60.00A7.70.01A7.70.01A7.50.01A7.40.01NB-LTRWest Street (N-S) @A7.50.00A7.50.00A7.60.01A7.60.01A7.60.01A7.50.01SB-LTRKent Street (E-W)B10.10.02A10.00.01A10.00.01A9.90.01B10.40.02B10.20.02EB-LTR
A7.50.00A7.50.00A7.60.01A7.60.01A7.40.01A7.40.01NB-LTRWest Street (N-S) @A7.60.03A7.60.03A7.70.02A7.70.02A7.50.05A7.40.04SB-LTRGreenpoint Avenue (E-W)B12.00.01B11.60.01B11.00.01B10.70.00B11.10.02B10.80.02EB-LTA10.00.02A9.90.02A9.30.02A9.10.01B10.60.01B10.30.01EB-TRB12.20.07B11.70.06B11.10.10B10.80.08B11.40.05B11.00.04WB-LTA9.80.06A9.60.06A9.50.03A9.40.03A9.50.08A9.40.07WB-TR
A9.40.01A9.30.01A7.40.01A7.40.01A9.50.01A9.40.01NB-LFranklin Street (N-S) @A8.70.06A8.60.06A9.60.03A9.50.03A8.80.07A8.70.07NB-RCommercial Street (E-W)A7.50.03A7.50.03A9.50.07A9.40.06A7.50.03A7.50.03WB-LT
A7.90.02A7.90.02A7.90.01A7.80.01A7.90.01A7.80.01SB-LTFranklin Street (N-S) @B14.10.12B13.30.10B12.80.11B12.20.09B12.20.06B11.90.05EB-LTRIndia Street (EB)
A8.70.06A8.50.05A8.90.04A8.70.04A8.30.03A8.20.03SB-LTFranklin Street (N-S) @B14.80.05B13.30.04B13.20.05B12.40.04B11.20.06B10.70.05WB-LRNorth 14th Street (E-W)
A8.90.00A8.7A8.30.00A8.20.00A8.40.00A8.3NB-LTKent Avenue (N-S) @B13.70.11B12.70.09B13.20.15B12.40.13C16.80.10C15.10.08WB-LTRNorth 12th Street (E-W)C19.90.09C17.70.07B14.60.08B13.60.06C18.30.04C16.40.03EB-LR
A8.40.04A8.20.03A8.70.05A8.60.04A8.40.01A8.20.01SB-LTKent Avenue (N-S) @C20.10.09C17.60.07C15.90.08B14.50.06C18.10.17C16.10.14EB-LTRNorth 11th Street (E-W)
A8.50.04A8.30.03A8.50.03A8.30.03A8.50.03A8.30.03SB-LTKent Avenue (N-S) @North 9th Street (EB)
C23.10.20WB-LC19.80.16WB-LB14.80.05WB-LB13.80.04C16.70.28B14.70.22WB-LRKent Avenue (N-S) @B11.30.03WB-RB10.90.03WB-RB10.80.07WB-RB10.50.06North 8th Street (WB)
A8.90.01A8.70.01A8.10.00A8.00.00A8.70.00A8.50.00NB-LTRKent Avenue (N-S) @A8.50.03A8.30.03A8.50.04A8.40.04A8.40.03A8.20.03SB-LTRNorth 7th Street (E-W)C20.30.01C18.10.01B14.30.01B13.40.01C17.30.01C15.70.01EB-LTR
A8.80.00A8.60.00A8.10.00A8.00.00A8.70.00A8.50.00NB-LTKent Avenue (N-S) @C19.00.01C16.80.01B13.10.01B12.30.00C16.50.01B15.00.01EB-LRNorth 6th Street (E-W)C15.80.20B14.20.16C15.80.16B14.50.13B14.20.13B13.10.11WB-LTR
16-21
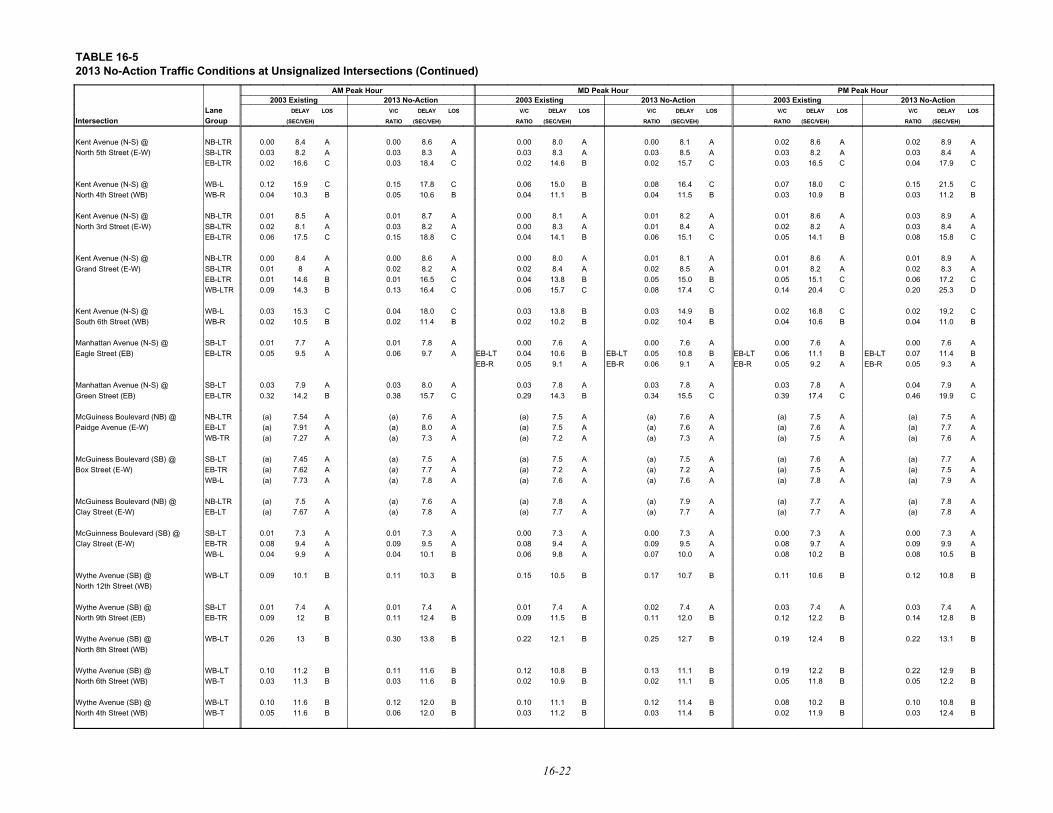
TABLE 16-52013 No-Action Traffic Conditions at Unsignalized Intersections (Continued)
AM Peak Hour2003 Existing2003 Existing2003 Existing
PM Peak HourMD Peak Hour2013 No-Action2013 No-Action2013 No-Action
LOSDELAYV/CLOSDELAYV/CLOSDELAYV/CLOSDELAYV/CLOSDELAYV/CLOSDELAYLane(SEC/VEH)RATIO(SEC/VEH)RATIO(SEC/VEH)RATIO(SEC/VEH)RATIO(SEC/VEH)RATIO(SEC/VEH)GroupIntersection
A8.90.02A8.60.02A8.10.00A8.00.00A8.60.00A8.40.00NB-LTRKent Avenue (N-S) @A8.40.03A8.20.03A8.50.03A8.30.03A8.30.03A8.20.03SB-LTRNorth 5th Street (E-W)C17.90.04C16.50.03C15.70.02B14.60.02C18.40.03C16.60.02EB-LTR
C21.50.15C18.00.07C16.40.08B15.00.06C17.80.15C15.90.12WB-LKent Avenue (N-S) @B11.20.03B10.90.03B11.50.04B11.10.04B10.60.05B10.30.04WB-RNorth 4th Street (WB)
A8.90.03A8.60.01A8.20.01A8.10.00A8.70.01A8.50.01NB-LTRKent Avenue (N-S) @A8.40.03A8.20.02A8.40.01A8.30.00A8.20.03A8.10.02SB-LTRNorth 3rd Street (E-W)C15.80.08B14.10.05C15.10.06B14.10.04C18.80.15C17.50.06EB-LTR
A8.90.01A8.60.01A8.10.01A8.00.00A8.60.00A8.40.00NB-LTRKent Avenue (N-S) @A8.30.02A8.20.01A8.50.02A8.40.02A8.20.02A80.01SB-LTRGrand Street (E-W)C17.20.06C15.10.05B15.00.05B13.80.04C16.50.01B14.60.01EB-LTRD25.30.20C20.40.14C17.40.08C15.70.06C16.40.13B14.30.09WB-LTR
C19.20.02C16.80.02B14.90.03B13.80.03C18.00.04C15.30.03WB-LKent Avenue (N-S) @B11.00.04B10.60.04B10.40.02B10.20.02B11.40.02B10.50.02WB-RSouth 6th Street (WB)
A7.60.00A7.60.00A7.60.00A7.60.00A7.80.01A7.70.01SB-LTManhattan Avenue (N-S) @B11.40.07EB-LTB11.10.06EB-LTB10.80.05EB-LTB10.60.04EB-LTA9.70.06A9.50.05EB-LTREagle Street (EB)A9.30.05EB-RA9.20.05EB-RA9.10.06EB-RA9.10.05EB-R
A7.90.04A7.80.03A7.80.03A7.80.03A8.00.03A7.90.03SB-LTManhattan Avenue (N-S) @C19.90.46C17.40.39C15.50.34B14.30.29C15.70.38B14.20.32EB-LTRGreen Street (EB)
A7.5(a)A7.5(a)A7.6(a)A7.5(a)A7.6(a)A7.54(a)NB-LTRMcGuiness Boulevard (NB) @A7.7(a)A7.6(a)A7.6(a)A7.5(a)A8.0(a)A7.91(a)EB-LTPaidge Avenue (E-W)A7.6(a)A7.5(a)A7.3(a)A7.2(a)A7.3(a)A7.27(a)WB-TR
A7.7(a)A7.6(a)A7.5(a)A7.5(a)A7.5(a)A7.45(a)SB-LTMcGuiness Boulevard (SB) @A7.5(a)A7.5(a)A7.2(a)A7.2(a)A7.7(a)A7.62(a)EB-TRBox Street (E-W)A7.9(a)A7.8(a)A7.6(a)A7.6(a)A7.8(a)A7.73(a)WB-L
A7.8(a)A7.7(a)A7.9(a)A7.8(a)A7.6(a)A7.5(a)NB-LTRMcGuiness Boulevard (NB) @A7.8(a)A7.7(a)A7.7(a)A7.7(a)A7.8(a)A7.67(a)EB-LTClay Street (E-W)
A7.30.00A7.30.00A7.30.00A7.30.00A7.30.01A7.30.01SB-LTMcGuinness Boulevard (SB) @A9.90.09A9.70.08A9.50.09A9.40.08A9.50.09A9.40.08EB-TRClay Street (E-W)B10.50.08B10.20.08A10.00.07A9.80.06B10.10.04A9.90.04WB-L
B10.80.12B10.60.11B10.70.17B10.50.15B10.30.11B10.10.09WB-LTWythe Avenue (SB) @North 12th Street (WB)
A7.40.03A7.40.03A7.40.02A7.40.01A7.40.01A7.40.01SB-LTWythe Avenue (SB) @B12.80.14B12.20.12B12.00.11B11.50.09B12.40.11B120.09EB-TRNorth 9th Street (EB)
B13.10.22B12.40.19B12.70.25B12.10.22B13.80.30B130.26WB-LTWythe Avenue (SB) @North 8th Street (WB)
B12.90.22B12.20.19B11.10.13B10.80.12B11.60.11B11.20.10WB-LTWythe Avenue (SB) @B12.20.05B11.80.05B11.10.02B10.90.02B11.60.03B11.30.03WB-TNorth 6th Street (WB)
B10.80.10B10.20.08B11.40.12B11.10.10B12.00.12B11.60.10WB-LTWythe Avenue (SB) @B12.40.03B11.90.02B11.40.03B11.20.03B12.00.06B11.60.05WB-TNorth 4th Street (WB)
16-22

TABLE 16-52013 No-Action Traffic Conditions at Unsignalized Intersections (Continued)
AM Peak Hour2003 Existing2003 Existing2003 Existing
PM Peak HourMD Peak hour2013 No-Action2013 No-Action2013 No-Action
LOSDELAYV/CLOSDELAYV/CLOSDELAYV/CLOSDELAYV/CLOSDELAYV/CLOSDELAYLane(SEC/VEH)RATIO(SEC/VEH)RATIO(SEC/VEH)RATIO(SEC/VEH)RATIO(SEC/VEH)RATIO(SEC/VEH)GroupIntersection
A7.20.01A7.20.01A7.30.02A7.30.01A7.20.01A7.20.01NB-LTBerry Street (NB) @B11.50.12B11.20.11B11.20.15B10.90.13B11.40.10B11.20.09WB-TNorth 12th Street (WB)A9.40.12A9.30.11A9.00.09A8.90.08A9.80.19A9.60.17WB-R
A7.9(a)A7.8(a)A7.7(a)A7.6(a)A8.0(a)A7.9(a)NB-TBerry Street (NB) @A8.1(a)A7.9(a)A7.7(a)A7.6(a)A8.0(a)A7.9(a)NB-TRNorth 11th Street (EB)A8.8(a)A8.6(a)A8.2(a)A8.0(a)A8.1(a)A8.0(a)EB-LT
B11.60.19B11.20.17B11.20.26B10.80.23B11.60.18B11.20.16EB-LTBerry Street (NB) @North 7th Street (EB)
B10.40.09B10.20.07A10.00.13A9.90.11B10.40.07B10.30.06EB-LTBerry Street (NB) @B10.90.06B10.60.05B10.10.09A10.00.08B11.10.04B10.80.04EB-TNorth 5th Street (EB)
B10.40.12B10.20.10A9.40.10A9.40.09B10.10.08A9.80.06EB-LTBerry Street (NB) @North 3rd Street (EB)
A7.30.03A7.30.02A7.30.04A7.30.04A7.30.04A7.30.04NB-LTBedford Avenue (NB) @C16.10.34B14.60.29B15.00.32B13.80.27C17.80.45C15.80.38WB-TRNorth 8th Street (WB)
A7.30.05A7.30.05A7.30.03A7.30.02A7.30.02A7.30.02NB-LTBedford Avenue (NB) @C18.40.45C16.10.38C16.10.40B14.60.34C15.50.44B14.10.39WB-TRNorth 6th Street (WB)
A7.30.03A7.30.02A7.30.03A7.30.03A7.30.02A7.30.01NB-LTBedford Avenue (NB) @B13.40.27B12.00.20B13.60.27B12.70.23B11.70.19B11.30.17WB-TRNorth 4th Street (WB)
B10.2(a)A9.5(a)A9.0(a)A8.7(a)A9.8(a)A9.3(a)SB-TRDriggs Avenue (SB) @A9.0(a)A8.7(a)A8.9(a)A8.7(a)A9.0(a)A8.8(a)WB-LTNorth 12th Street (WB)
A7.20.01A7.20.01A7.30.01A7.30.01A7.30.01A7.30.01SB-LTDriggs Avenue (SB) @B12.60.21B12.00.18B11.40.21B11.00.19B11.80.14B11.40.12EB-TRNorth 9th Street (EB)
A7.30.02A7.30.01A7.30.02A7.30.02A7.30.03A7.30.03SB-LTDriggs Avenue (SB) @B12.40.20B11.80.17B11.80.23B11.30.20B12.80.25B12.20.21EB-TRNorth 5th Street (EB)
B12.30.40B11.70.01B10.70.29B10.40.26B11.10.31B10.70.27SB-TRDriggs Avenue (SB) @A7.30.30A7.30.17A7.20.00A7.20.00A7.20.00A7.20.00WB-LTSouth 4th Street (WB)
ABBREVIATION: EB-Eastbound, WB-Westbound, NB-Northbound, SB-Southbound L-Left, T-Through, R-Right, E-W: East-West Roadway, N-S: North-South Roadway V/C Ratio - Volume to Capacity Ratio SEC/VEH - Seconds per Vehicle LOS - Level of Service * - Denotes Congested Location (LOS E or F, or v/c ratio > 0.90) (a) All-way stop control; no v/c ratio reported
16-23
Greenpoint-Williamsburg Rezoning EIS Chapter 16: Traffic and Parking
16-24
study area, characterized mainly by low-density residential or industrial uses, would continue to amply
satisfy the parking demand throughout the day. Overall, it is estimated that weekday overnight demand
for on-street parking within ¼-mile of the proposed action area would increase to approximately 83
percent of capacity, primarily due to increased residential development. During the weekday midday
period, it is estimated that demand would reach approximately 89 percent of capacity primarily as the
result of new commercial/retail development and general background growth. There would be
approximately 3,600 on-street parking spaces available overnight, and 2,300 available in the midday in
the 2013 future without the proposed action.
D. THE FUTURE WITH THE PROPOSED ACTION (WITH-ACTION)
This section provides an analysis of traffic and parking conditions in the future with the proposed action
(the With-Action condition). As discussed in Chapter 1, “Project Description,” the proposed action is
projected to stimulate approximately 7.8 million square feet of new residential and retail/commercial
development under both Scenario A and Scenario B. Additionally, under Scenario A, the worst case
transportation condition, a 27.8 acre waterfront park would be mapped to the west of Kent Avenue from
Bushwick Inlet on the north to North 9 Street on the south. Scenario B would provide a smaller parkth
(approximately 15.9 acres). As described in Chapter 1, “Project Description,” Scenarios A and B are very
similar, except that under Scenario B, a 1,100 megawatt power plant is assumed to be an approved No-
Action development occupying the Bayside Fuel site, and this power plant would remain in the future
with the proposed action. Therefore, the net change in residential and retail/commercial development for
Scenario B would be the same as for Scenario A, only the proposed park would be smaller. As Scenario
A includes a larger, regional, park, it constitutes the worst-case transportation condition for traffic
analysis purposes.
As discussed in Chapter 1, “Project Description,” projected new developments are located on 76 sites
within the study area. Land uses that would be present on 37 of these development sites in the No-Action
condition would be displaced in the future with the proposed action. Accessory parking as required under
the New York City Zoning Resolution would be provided at each site. The analyses in this section
examine future traffic and parking conditions in the year 2013 with the full build-out of the projected
development sites under Scenario A.
Trip Generation
Under Scenario A, the proposed action is expected to result in approximately 7,391 dwelling units, and
approximately 253,698 square feet of retail/commercial space on the 76 projected development sites, and
result in the mapping of a 27.8-acre waterfront park. The trip generation rates and mode choice factors
used to estimate the travel demand that would be generated by this new development were based on
accepted CEQR criteria, standard professional references, and studies that have been done for similar uses
in Brooklyn. These sources were supplemented by 2000 Census data and recent data from other sources.
The trip generation rates and modal split factors used in forecasting the travel demand from projected
development sites are presented in Tables 16-6 and 16-7.
As noted above, the developments projected to occur as a result of the proposed action would displace
land uses on 37 of the 76 sites. In the No-Action condition, these uses would occupy a total of
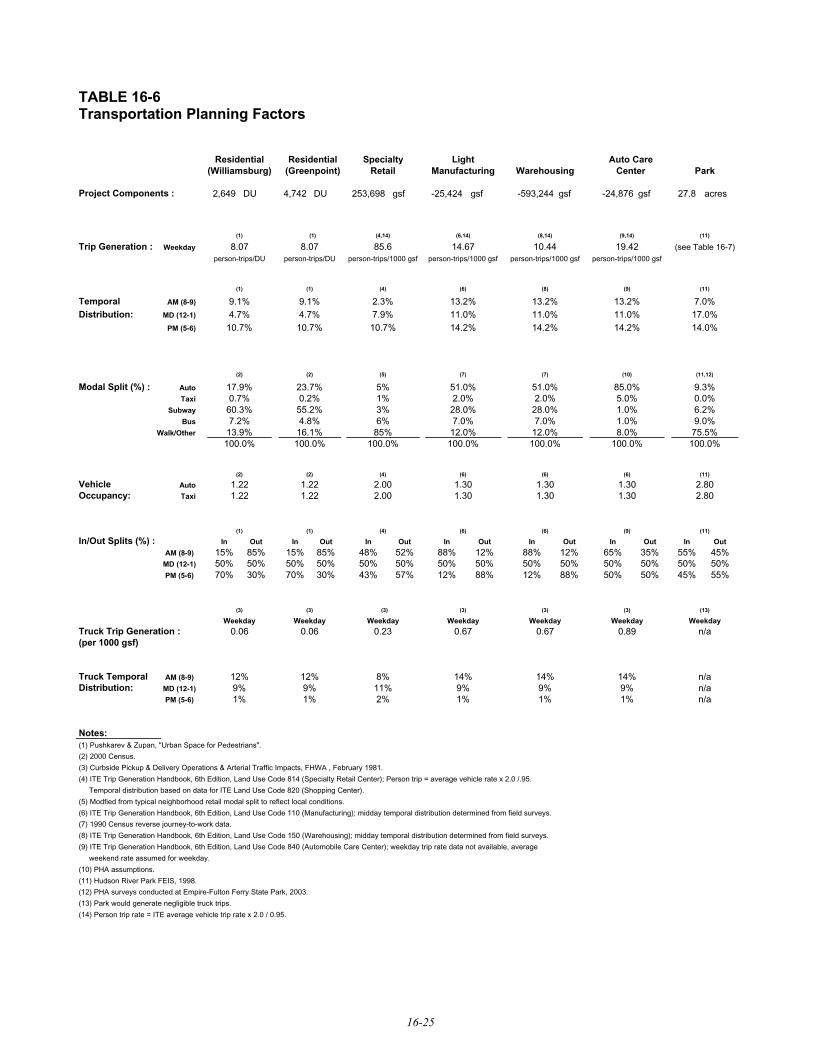
TABLE 16-6Transportation Planning Factors
Auto CareLightSpecialtyResidentialResidentialParkCenterWarehousingManufacturingRetail(Greenpoint)(Williamsburg)
acres27.8gsf-24,876gsf-593,244gsf-25,424gsf253,698DU4,742DU2,649Project Components :
(11)(9,14)(8,14)(6,14)(4,14)(1)(1)
(see Table 16-7)19.4210.4414.6785.68.078.07WeekdayTrip Generation :person-trips/1000 gsfperson-trips/1000 gsfperson-trips/1000 gsfperson-trips/1000 gsfperson-trips/DUperson-trips/DU
(11)(9)(8)(6)(4)(1)(1)
7.0%13.2%13.2%13.2%2.3%9.1%9.1%AM (8-9)Temporal17.0%11.0%11.0%11.0%7.9%4.7%4.7%MD (12-1)Distribution:14.0%14.2%14.2%14.2%10.7%10.7%10.7%PM (5-6)
(11,12)(10)(7)(7)(5)(2)(2)
9.3%85.0%51.0%51.0%5%23.7%17.9%AutoModal Split (%) :0.0%5.0%2.0%2.0%1%0.2%0.7%Taxi
6.2%1.0%28.0%28.0%3%55.2%60.3%Subway
9.0%1.0%7.0%7.0%6%4.8%7.2%Bus
75.5%8.0%12.0%12.0%85%16.1%13.9%Walk/Other
100.0%100.0%100.0%100.0%100.0%100.0%100.0%
(11)(6)(6)(6)(4)(2)(2)
2.801.301.301.302.001.221.22AutoVehicle2.801.301.301.302.001.221.22TaxiOccupancy:
(11)(9)(6)(6)(4)(1)(1)
OutInOutInOutInOutInOutInOutInOutInIn/Out Splits (%) :45%55%35%65%12%88%12%88%52%48%85%15%85%15%AM (8-9)
50%50%50%50%50%50%50%50%50%50%50%50%50%50%MD (12-1)
55%45%50%50%88%12%88%12%57%43%30%70%30%70%PM (5-6)
(13)(3)(3)(3)(3)(3)(3)
WeekdayWeekdayWeekdayWeekdayWeekdayWeekdayWeekday
n/a0.890.670.670.230.060.06Truck Trip Generation :(per 1000 gsf)
n/a14%14%14%8%12%12%AM (8-9)Truck Temporaln/a9%9%9%11%9%9%MD (12-1)Distribution:n/a1%1%1%2%1%1%PM (5-6)
Notes:(1) Pushkarev & Zupan, "Urban Space for Pedestrians".
(2) 2000 Census.
(3) Curbside Pickup & Delivery Operations & Arterial Traffic Impacts, FHWA , February 1981.
(4) ITE Trip Generation Handbook, 6th Edition, Land Use Code 814 (Specialty Retail Center); Person trip = average vehicle rate x 2.0 /.95.
Temporal distribution based on data for ITE Land Use Code 820 (Shopping Center).
(5) Modfied from typical neighborhood retail modal split to reflect local conditions.
(6) ITE Trip Generation Handbook, 6th Edition, Land Use Code 110 (Manufacturing); midday temporal distribution determined from field surveys.
(7) 1990 Census reverse journey-to-work data.
(8) ITE Trip Generation Handbook, 6th Edition, Land Use Code 150 (Warehousing); midday temporal distribution determined from field surveys.
(9) ITE Trip Generation Handbook, 6th Edition, Land Use Code 840 (Automobile Care Center); weekday trip rate data not available, average
weekend rate assumed for weekday.
(10) PHA assumptions.
(11) Hudson River Park FEIS, 1998.
(12) PHA surveys conducted at Empire-Fulton Ferry State Park, 2003.
(13) Park would generate negligible truck trips.
(14) Person trip rate = ITE average vehicle trip rate x 2.0 / 0.95.
16-25

TABLE 16-7Transportation Planning Factors for the Proposed Park (Site 211)
1½-2 miles1-1½ miles½-1 mile¼-½ mile0-¼ mileDistance from Park:
(1)(1)(1)(1)(1)
41,50049,10083,80031,70010,100Residents in Study Area:
(2)(2)(2)(2)(2)
19.0626.3441.7292.02203.64SundayTrip Generation :10.6714.7523.3651.53114.04Weekday
(Person-trips/1000 residents)
(2)(2)(2)(2)(2)
7.0%7.0%7.0%7.0%7.0%AM (8-9)Peak Hours Trips :17.0%17.0%17.0%17.0%17.0%MD (12-1)
14.0%14.0%14.0%14.0%14.0%PM (5-6)
(2,3)(2,3)(2,3)(2,3)(2,3)
22.0%13.0%5.0%1.0%0.0%AutoModal Split (%) :0.0%0.0%0.0%0.0%0.0%Taxi
14.0%8.0%4.0%1.0%0.0%Subway
22.0%12.0%5.0%1.0%0.0%Bus
42.0%67.0%86.0%97.0%100.0%Walk/Other
100.0%100.0%100.0%100.0%100.0%
(2)(2)(2)(2)(2)
2.802.802.802.802.80AutoVehicle Occupancy :
(2)(2)(2)(2)(2)
OutInOutInOutInOutInOutInIn/Out Splits (%) :45%55%45%55%45%55%45%55%45%55%AM (8-9)
50%50%50%50%50%50%50%50%50%50%MD (12-1)
55%45%55%45%55%45%55%45%55%45%PM (5-6)
SundayWeekdayPerson Trips :OutInOutIn
1721Auto1012AutoAM00Taxi00Taxi
1215Subway78Subway
1721Bus911Bus
286350Walk/Other160196Walk/Other
332406TOTAL186228TOTAL
4646Auto2626AutoMD00Taxi00Taxi
3333Subway1818Subway
4545Bus2525Bus
773773Walk/Other433433Walk/Other
897897TOTAL502502TOTAL
4234Auto2419AutoPM00Taxi00Taxi
3024Subway1714Subway
4134Bus2319Bus
700573Walk/Other392321Walk/Other
813665TOTAL455372TOTALVehicle Trips :
68Auto34AutoAM
1717Auto99AutoMD
1512Auto87AutoPM
Sources:(1) 2000 Census data, projected to 2013.
(2) Hudson River Park FEIS, 1998.
(3) PHA surveys conducted at Brooklyn Heights Promenade and Empire-Fulton Ferry State Park, 2003.
16-26
Greenpoint-Williamsburg Rezoning EIS Chapter 16: Traffic and Parking
16-27
approximately 1.8 million square feet of existing built floor area and include approximately 1.14 million
square feet of manufacturing and warehousing space, approximately 642,686 square feet of vehicle and
open storage, and approximately 24,876 square feet of automobile service uses. The trip generation rates
and modal split factors utilized for forecasting travel demand eliminated due to the displacement of No-
Action land uses on each site are also shown in Table 16-6. These trip generation rates and modal split
factors were based on accepted CEQR criteria and standard professional references with the exception
of Sites 3 (Greenpoint Lumber Exchange) and 211 (Bayside Fuel), for which existing demand was
determined using field surveys. The change in travel demand resulting from the proposed action is the
net difference between the demand that would be generated by land uses on each site in the No-Action
condition, and the travel demand that would be generated by the projected development on that site.
The trip generation rates and modal split assumptions for the proposed park on Site 211 (the Bayside Fuel
site) are shown in Table 16-7, and are based on surveys conducted at Riverbank State Park and North
River State Park for the 1998 Hudson River Park FEIS, and more recent studies conducted at Empire-
Fulton Ferry State Park and the Brooklyn Heights Promenade. The surveys conducted for the Hudson
River Park FEIS found that the park trip generation rate for a population (e.g., a census tract) diminishes
the farther that population is from the park entrance. The formula developed from these surveys,
i iU =, 0.23 + 20.63 x 1/D ,1.15
igives average summer Sunday park usage per 1,000 residents (U ) as a function of distance, in miles, from
ithe park entrance (D ); the further one gets from the park, the fewer trips per resident are generated.
Average weekday park usage was found to be 56 percent of Sunday usage. Mode choice for park users
also varies based on distance from the park, with the proportion of walk trips increasing the closer the
point of origin is to the park.
It should be noted that, although the new park would generate its highest use on a summer Sunday, this
period is not analyzed as the peak summer Sunday demand generated by residential and local retail uses
is relatively low, and the overall local transportation network is much less used on Sundays than on
weekdays. It is therefore very unlikely that the project would have a unique Sunday impact location which
would not have already been impacted in the more heavily-traveled weekday peak periods.
The total travel demand from projected developments and the estimated travel credit from the
displacement of No-Action land uses on each site are shown in Tables 16-8 and 16-9, respectively. Table
16-10 shows the resulting net travel demand in person trips and vehicle trips for the AM, midday and PM
peak hours.
As shown in Table 16-8, the projected developments resulting from the proposed action, including the
proposed park, would generate a total of 206 inbound and 880 new outbound vehicle trips in the AM peak
hour (auto, taxi and truck), 318 new inbound and 318 new outbound vehicle trips in the midday, and 851
new inbound and 409 new outbound vehicle trips in the PM peak hour. The displacement of land uses that
would be present on projected development sites in the No-Action condition would eliminate a total of
215 inbound and 137 outbound vehicle trips in the AM peak hour, 110 inbound and 164 outbound in the
midday, and 55 inbound and 252 outbound vehicle trips in the PM, as shown in Table 16-9. The resulting
net project increment, shown in Table 16-10, would total -9 inbound and 743 outbound vehicle trips in
the AM peak hour, 208 inbound and 154 outbound vehicle trips in the midday, and 796 inbound and 157
outbound vehicle trips in the PM peak hour.

TABLE 16-8Total Weekday Peak Hour Travel Demand From Projected Development
Total TripsGreenpointWilliamsburgParkRetailResidentialRetailResidential
n/aacre27.8gsf129,500DU4,742gsf124,198DU2,649Project Component :
OutInOutInOutInOutInOutInOutInPerson Trips :1,0202001012767011246629652Auto
20500116111122Taxi
2,64648078441,63428844997176SubwayAM2867191187142258711921Bus
1,0885251601961131044778410810023041Walk/Other
5,0601,2821862281331222,9605221271181,654292TOTAL
3723722626222221321321219090Auto
14140044224444Taxi
844844181813134974971313303303SubwayMD15515525252626434325253636Bus
1,3771,3774334333723721451453573577070Walk/Other
2,7622,762502502437437900900420420503503TOTAL
5041,034241934252916793224123287Auto
202700752665511Taxi
1,1482,591171420156781,5821915414965SubwayPM2113322319413159138392949115Bus
1,8111,85539232157543319846255141695223Walk/Other
3,6935,8384553726775091,2282,8676474896861,601TOTAL
OutInOutInOutInOutInOutInOutInVehicle Trips :82815534435751023324343Auto
2120002266221111TaxiAM313100111919111010Truck
88020634766001276626464TOTAL
28028099111117517511117474Auto
14140033333355TaxiMD2424002213132277Truck
31831899161619119116168686TOTAL
3818248717132395571612101235Auto
25240066555599TaxiPM330000220011Truck
4098518723192465642117111245TOTAL
In+OutIn+OutIn+OutIn+OutIn+Out1,0861372712328AM (8-9)Total6363238232172MD (12-1)Vehicle Trips :
1,2604281038356PM (5-6)
16-28

TABLE 16-9Total Weekday Peak Hour Travel Demand From No-Action Land Useson Projected Development Sites
Total TripsGreenpointWilliamsburgAuto CareLightAuto CareLight
CenterWarehousingManufacturingCenterWarehousingManufacturing
(2)(1)
n/agsf23,000gsf209,701gsf10,610gsf1,876gsf523,593gsf14,814Project Components :
OutInOutInOutInOutInOutInOutInOutInPerson Trips :472391833643191319138213Auto
210120200001501Taxi
15112003241500107617SubwayAM4280016010031902Bus
75123110020043303Walk/Other
75440213811852171337271326TOTAL
119119212120204422666666Auto
55111100003300Taxi
52520011112200363633SubwayMD1414003311009911Bus
242422551100151511Walk/Other
2142142424404088221291291111TOTAL
2485827274661012214920142Auto
113222000006110Taxi
12016002535100821181SubwayPM2940061100020320Bus
54933111200035530Walk/Other
46290323290111822229240283TOTAL
Vehicle Trips :381831425533171215106210Auto
77221100003311TaxiAM92251123130000671011Truck
13721517282947171285119412TOTAL
9292161615153322515155Auto
44111100002200TaxiMD681411127000055600Truck
1641101818282333221085955TOTAL
192462121355812211515112Auto
33220000001100TaxiPM57600155000042100Truck
2525523235010812215817112TOTAL
In+OutIn+OutIn+OutIn+OutIn+OutIn+OutIn+Out35245768320416AM (8-9)Total27436516416710MD (12-1)Vehicle Trips :30746609417513PM (5-6)
Notes:(1) Truck credit for Site 211 determined from field counts (0 in, -57 out in AM; 0 in, -49 out in MD, 0 in, -41 out in PM).
(2) Truck credit for Site 3 determined from field counts (-10 in, -20 out in AM; -5 in, -10 out in MD, -5 in, -15 out in PM).
16-29
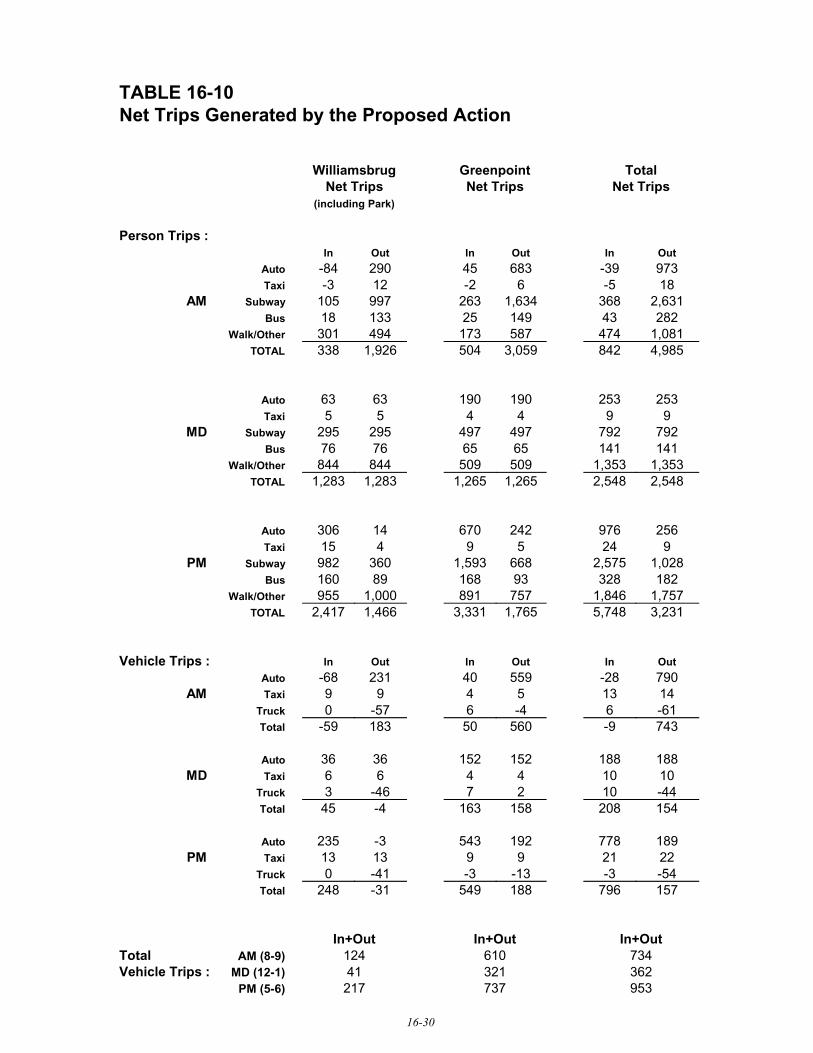
TABLE 16-10Net Trips Generated by the Proposed Action
TotalGreenpointWilliamsbrugNet TripsNet TripsNet Trips
(including Park)
Person Trips :OutInOutInOutIn
973-3968345290-84Auto
18-56-212-3Taxi
2,6313681,634263997105SubwayAM282431492513318Bus
1,081474587173494301Walk/Other
4,9858423,0595041,926338TOTAL
2532531901906363Auto
994455Taxi
792792497497295295SubwayMD14114165657676Bus
1,3531,353509509844844Walk/Other
2,5482,5481,2651,2651,2831,283TOTAL
25697624267014306Auto
92459415Taxi
1,0282,5756681,593360982SubwayPM1823289316889160Bus
1,7571,8467578911,000955Walk/Other
3,2315,7481,7653,3311,4662,417TOTAL
OutInOutInOutInVehicle Trips :790-2855940231-68Auto
14135499TaxiAM-616-46-570Truck
743-956050183-59Total
1881881521523636Auto
10104466TaxiMD-441027-463Truck
154208158163-445Total
189778192543-3235Auto
2221991313TaxiPM-54-3-13-3-410Truck
157796188549-31248Total
In+OutIn+OutIn+Out734610124AM (8-9)Total36232141MD (12-1)Vehicle Trips :953737217PM (5-6)
16-30

Greenpoint-Williamsburg Rezoning EIS Chapter 16: Traffic and Parking
16-31
Net project-generated trips by subway would total 368 inbound and 2,631 outbound in the AM peak hour,
792 inbound and 792 outbound in the midday, and 2,575 inbound and 1,028 outbound in the PM peak
hour. Trips by local bus would total 43 inbound and 282 outbound in the AM peak hour, 141 inbound and
141 outbound trips in the midday, and 328 inbound and 182 outbound in the PM. Trips by walking only,
bicycle or other non-vehicular modes would total 474 inbound and 1,081 outbound in the AM peak hour,
1,353 inbound and 1,353 outbound trips in the midday, and 1,846 inbound and 1,757 outbound in the PM.
The probable impacts of the proposed action on the subway, bus and pedestrian modes are discussed in
detail in Chapter 17, “Transit and Pedestrians.”
Trip Assignment
Figures 16-11 through 16-13 show the assignment of net project increment traffic (autos, taxis and trucks)
to the study area street network during the weekday AM, midday and PM peak hours, respectively. Auto
and taxi trips en route to and from projected developments were assigned to study area portals based on
census origin/destination survey data. Auto and taxi trips were then assigned via the most direct routes
to and from the entrances to each development site. Truck trips were assigned to designated truck routes
within the study area, then via the most direct path on the local street network to and from each
development site.
As shown in Figures 16-11 through 16-13, the primary corridors for traffic en route to and from the
projected developments would be Kent Avenue/Franklin Street, Metropolitan Avenue, and McGuinness
Boulevard. To the north, McGuinness Boulevard would provide access for project trips utilizing the
Pulaski Bridge and the Brooklyn-Queens Expressway (BQE) from Queens. Kent Avenue would be used
by trips to and from points south. Metropolitan Avenue would serve vehicles en route to and from
northern Brooklyn and would also serve as a secondary corridor for access to and from the BQE. Trips
originating from Manhattan would travel via the Williamsburg Bridge and would access sites in
Williamsburg via Broadway, Bedford Avenue, and Kent Avenue; Williamsburg Bridge traffic bound for
Greenpoint would likely use McGuinness Boulevard via the BQE. Outbound trips to the Williamsburg
Bridge were assigned via the ramp at Roebling Street and South 5 Place for trips originating inth
Williamsburg, and to the ramp from the westbound BQE via McGuinness Boulevard for trips originating
in Greenpoint.
Vehicular Traffic
Figures 16-14 through 16-16 show the AM, midday, and PM peak hour traffic networks in the 2013 future
with the proposed action. The volumes shown are the combination of the net incremental traffic generated
by the proposed action and the 2013 No-Action traffic network.
Impact Analysis Methodology
According to CEQR criteria, if levels of service deteriorate from LOS A, B or C in the No-Action
condition to marginally unacceptable mid-LOS D or unacceptable LOS E or F in the With-Action
condition, then a significant traffic impact has occurred. CEQR criteria further specify that for a No-
Action LOS A, B or C which declines to mid-LOS D (45 seconds of delay for signalized intersections and
30 seconds of delay for unsignalized intersections) or worse in the With-Action condition, mitigation to
mid-LOS D is required. For No-Action LOS D, an increase of five or more seconds in a lane group in the
With-Action condition should be considered significant if the With-Action delay exceeds mid-LOS D.

Greenpoint-Williamsburg Rezoning EIS Chapter 16: Traffic and Parking
16-32
For No-Action LOS E, an increase in delay of four seconds should be considered significant. For No-
Action LOS F, three seconds of delay should be considered significant, however, if the No-Action LOS
F condition already has delays in excess of 120 seconds, an increase of one second in delay should be
considered significant, unless the proposed action would generate fewer than five vehicles through that
intersection in the peak hour (signalized intersections) or fewer than five passenger car equivalents (PCE)
in the peak hour along the critical approach (unsignalized intersections). In addition, for unsignalized
intersections, for the minor street approach to generate a significant impact, 90 PCEs must be identified
in the With-Action condition in any peak hour.
Tables 16-11 and 16-12 show the AM, midday, and PM peak hour volume-to-capacity ratios, delays and
levels of service at signalized and unsignalized study area intersections, respectively, in the 2013 future
with the proposed action. The tables also identify those locations that would be impacted based on the
criteria discussed above. A summary of significantly impacted intersections is provided in Table 16-13.
Signalized Intersections
As shown in Table 16-11, the PM peak hour would have the highest number of impacted intersections
with eight, followed by the AM and the midday, with three and four each, respectively. Intersections with
one or more movements operating above capacity (i.e., a v/c ratio of 1.0 or greater) would total eleven
in the PM (versus six in the future without the proposed action), three in the AM, and two in the midday
(versus one and none, respectively, in the No-Action condition). The following provides a discussion of
the impacted locations by corridor. Measures to mitigate traffic impacts are presented in Chapter 22,
“Mitigation.”
Franklin Street/Kent Avenue
At the intersection of Franklin and Calyer Streets, the northbound movement would be impacted by
project traffic in the midday peak hour, operating at LOS D (54.7 seconds of delay), versus a No-Action
LOS C (26.9 seconds of delay).
The northbound Franklin Street approach would also be impacted at Quay Street, with LOS E conditions
in the PM peak hour (61.7 seconds of delay), compared with a No-Action LOS C (20.9 seconds of delay).
At Kent Avenue and South 3 Street, project traffic would create an impact on the southbound Kentrd
Avenue approach in the PM peak hour, with operation at LOS D (50.6 seconds of delay) in the With-
Action condition compared to a No-Action LOS C (33.7 seconds of delay).
Manhattan Avenue
At the intersection of Manhattan Avenue and Driggs Avenue, the westbound approach would be impacted
in the PM peak hour, operating at LOS E (70.3 seconds of delay), versus LOS D (53.4 seconds of delay)
in the No-Action.
McGuinness Boulevard
The northbound McGuinness Boulevard approach at Green Street would be impacted in the AM peak
hour, operating at LOS E (64.0 seconds of delay), compared with LOS D (41.7 seconds of delay) in the
No-Action. The eastbound Green Street approach would be impacted in all three peak hours, deteriorating
to LOS F (132.6 seconds of delay) in the AM, LOS D (54.1 seconds of delay) in the midday, and LOS

ASH ST.
BOX ST.
CLAY ST.
DUPONT ST.
EAGLE ST.
FREEMAN ST.
GREEN ST.
HURON ST.
INDIA ST.
KENT ST.
JAVA ST.
COMMERCIAL ST.
GREENPOINT AVE.
PAIDGE AVE.
MILTON ST.
NOBLE ST.
WE
ST
ST
.P
RO
VO
ST
ST
.
MC
GU
INN
ES
S B
LV
D.
OAK ST.
QUAY ST.
CLIFFO
RD
PL.
GU
ER
NS
EY
ST.
LOR
IME
R S
T.
MA
NH
ATTA
N A
VE.
LEO
NA
RD
ST.
EC
KFO
RD
ST.
NE
WE
L ST.
DIA
MO
ND
ST.
JEW
EL S
T.
MO
ULTR
IE S
T.
BA
NK
ER S
CALYER ST.
MESEROLE AVE.
-10
-1
96-13
17 53
-14
47
77
45
285
81 104
28
- 9-2
-29-10
-10
-32
-9
-11
19
17
-11
12
18
- 2
179
58
124
23
120
10143
-16
-9
- 9
20
11
322
1
-10
-10193
1
0
-101
-11
-3 136
29
372
28
22
2
42
1633
10 4
162 20
12 -16
-10
19185
2
2
36
- 119-6
35
1
2-1 2
35
-13
351
2124
2
35
8-2
6
-16
37
113
-16
37
1
-16
3737
720
37
27
36
429
24
32
4-1 2
8-1
14
1
18
18
-13
9 -1
1
8
3
5
335
3
3636
35
1
26-8
0
5948
10
-1
-9
19
26
30
22
32 33
0
45
0
00 0
0
09
0
0
-2
1
-2
11
-26
-3
-11
-21
- 2
0
00
43
-3
2
MEEKER AVE.
MEEKER AVE.
(EAST-BOUND)
(WEST-BOUND)
BROOKLYN-QUEENS
EXPRESSWAY
MCGUINESS
BLVD.
5 HERBERT ST.
GRAHAM AVE.
-3
-3 -4
5
LE
ON
AR
D S
T.
MANHATTAN AVE.
DRIGGS AVE.
-14
17
1
FR
AN
KL
IN S
T.
ST.
GE
M S
T.
NORTH 15TH ST.
3
11
-763
63
-7
27
Figure 16-11aGreenpoint Net Project Generated Traffic - AM Peak Hour
Greenpoint-Williamsburg Rezoning EIS
LEGEND:PROJECTED DEVELOPMENT SITESANALYZED INTERSECTION (POSITIVE INCREMENT)
ANALYZED INTERSECTION (NEGATIVE INCREMENT)

NORTH 13TH ST.
NORTH 12TH ST.
NORTH 11TH ST.
NORTH 10TH ST.
NORTH 9TH ST.
NORTH 8TH ST.
NORTH 7TH ST.
NORTH 6TH ST.
NORTH 5TH ST.
NORTH 4TH ST.
NORTH 3RD ST.
NORTH 1ST ST.
METROPOLITAN AVE.
BE
DF
OR
D A
VE
.
HA
VE
ME
YE
R S
T.
UNION AVE.
BAYA
RD ST
.RIC
HARD
SON S
T.
FROST
ST.
WITH
ERS S
T.
LORIMER ST.
GRAND ST
HOPE ST.
MA
RC
Y A
VE
.
MA
RC
Y A
VE
.
RO
DN
EY
ST.
KE
AP
ST
.
HOPE ST.
GRAND ST.
SOUTH 1ST ST.
SOUTH 2ND ST.
SOUTH 3RD ST.
FILLMORE PL.
SOUTH 4TH ST.
SOUTH 5TH ST.
LEE AVE.
BROADWAY
ROEB
LING
ST.
SOUTH 8TH ST.
BROADWAY
BEDF
ORD
AVE.
DU
NH
AM
PL.
SOUTH 6TH ST.
HA
VE
ME
YE
R S
T.
DR
IGG
S A
VE
.
KEN
T AVE.
RIV
ER
ST
.
-3
4
6
-8
6
-3
-1
-5
10
-18
-3-1810
27
-1
-7
1
96
5
81
5
81
13
0
-10
631
- 8
66
-94
-2-7
-8
- 4
63-7
596
5
96
5
96
81
5
5
81
1
6119
4619
46
4
53
23
56
1779
17
136
80
19
96
85
96
- 1
-3
44
4
- 2-8
-15
-18-14
19 5
31
24
692
19
1 122
-17
80
- 6
-2
-1
0
15
-411
13
3
62
13
4151
54
12-18
-18
-16
5454 - 6
-8
-10
56
25
521
25
- 6
23
3
6 21735
6
-6-5
86
-14
3
361
-8
8
-5 -2
-51 3
-2
1 -21-3
-31-3
1
3-5
- 3
4
3
6
-711-2
0
13-2
13
3
- 9
21
0
35
-3
4
21
-54
11
1
21
-1-2
34
3
-9
160 161
185
199
203
215
224
240
125
171
0
0
0
-2
2
BE
RR
Y S
T.
WY
TH
E A
VE
.
0
0
1
-2
0
12
235230
206
3
-122
RO
EB
LIN
G S
T.
-12
- 2-1
0193
0
-4
5
0
1
-11 00 0
00
0
-35
13
1
3
2
45
1
186
2
2
0
-522
0
0
0
163
-8
2
2
22
5
2 4
-8-6
24
2
314-8
-7
0-1
4
10098
1 0
04
0
23
0
0
0
0
Williamsburg Net Project Generated Traffic - AM Peak Hour Figure 16-11bGreenpoint-Williamsburg Rezoning EIS
ANALYZED INTERSECTION (POSITIVE INCREMENT)
ANALYZED INTERSECTION (NEGATIVE INCREMENT)
LEGEND:PROJECTED DEVELOPMENT SITES

FR
AN
KL
IN S
T.
ST.
GE
M S
T.
NORTH 15TH ST.
36
8
233
3
23
LE
ON
AR
D S
T.
MANHATTAN AVE.
DRIGGS AVE.
6
6
6
MEEKER AVE.
MEEKER AVE.
(EAST-BOUND)
(WEST-BOUND)
BROOKLYN-QUEENS
EXPRESSWAY
MCGUINESS
BLVD.
33 HERBERT ST.
GRAHAM AVE.
-1
33
0
-1
ASH ST.
BOX ST.
CLAY ST.
DUPONT ST.
EAGLE ST.
FREEMAN ST.
GREEN ST.
HURON ST.
INDIA ST.
KENT ST.
JAVA ST.
COMMERCIAL ST.
GREENPOINT AVE.
PAIDGE AVE.
MILTON ST.
NOBLE ST.
WE
ST
ST
.P
RO
VO
ST
ST
.
MC
GU
INN
ES
S B
LV
D.
OAK ST.
QUAY ST.
CLIFFO
RD
PL.
GU
ER
NS
EY
ST.
LOR
IME
R S
T.
MA
NH
ATTA
N A
VE.
LEO
NA
RD
ST.
EC
KFO
RD
ST.
NE
WE
L ST.
DIA
MO
ND
ST.
JEW
EL S
T.
MO
ULTR
IE S
T.
BA
NK
ER S
CALYER ST.
MESEROLE AVE.
29
3
63
33 29
-7 29
1
22
211
1 40
19
- 230
11
2
2546
-19
-20
-15
-4
-5
34
-5
3
34
- 2
2 50
56
37
47
19
2714
41 2
8
-4
38
-1
99
99
13-7
13
-713
-713
13
31
-7
16
32
3
473
-5
63-5
-4
-5
- 6
-1 46
-14
212
2122 2
2
42
106
11 4
62
13 -7
-36
577
13 - 334
1111
- 6
11
11 -202
36
3
-7
11
11
1
91
13
31
- 4
3
-13
3
- 6
3 -4
121
3
14
11
3
10
4
9
19
21
15
132
19
26
30
22
32 33
1
0
0
0
0
45
-3
0
0
00
-2
0-1
0
-1
-1- 18
0
0
00
-11
-10
0
1
-5 -15
-10
0
00
43
0
1
-1
- 1
0
Greenpoint Net Project Generated Traffic - MD Peak HourFigure 16-12aGreenpoint-Williamsburg Rezoning EIS
LEGEND:PROJECTED DEVELOPMENT SITESANALYZED INTERSECTION (POSITIVE INCREMENT)
ANALYZED INTERSECTION (NEGATIVE INCREMENT)
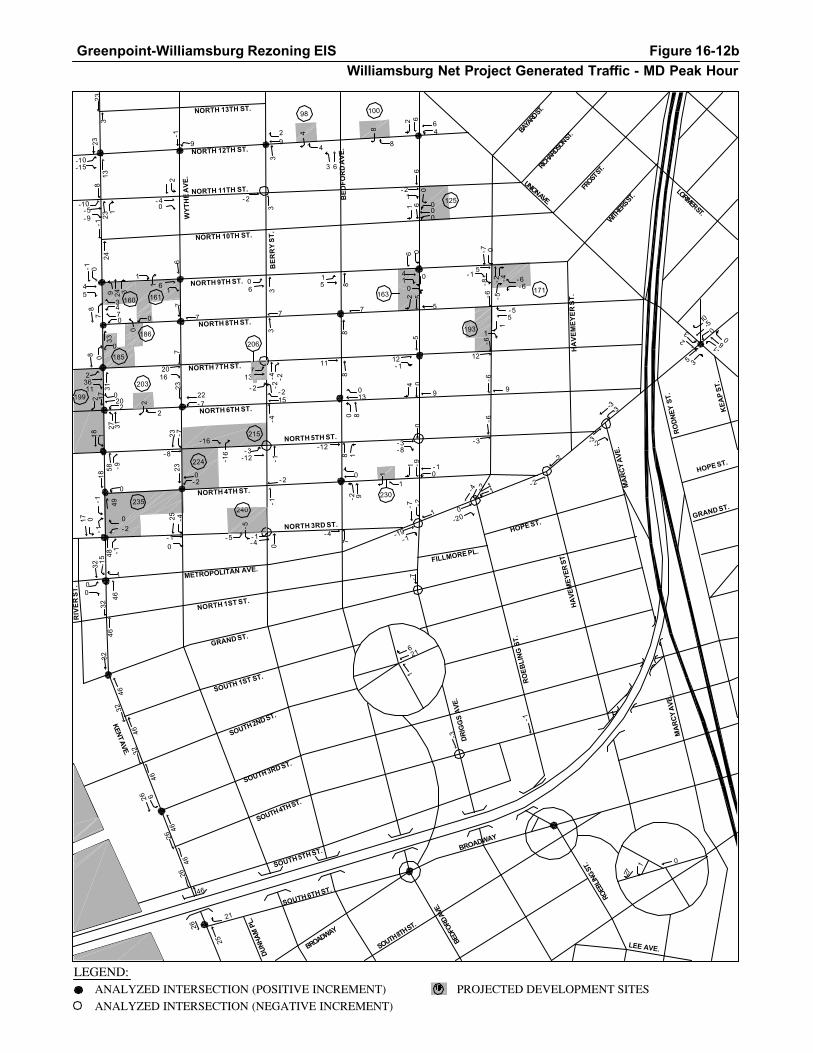
NORTH 13TH ST.
NORTH 12TH ST.
NORTH 11TH ST.
NORTH 10TH ST.
NORTH 9TH ST.
NORTH 8TH ST.
NORTH 7TH ST.
NORTH 6TH ST.
NORTH 5TH ST.
NORTH 4TH ST.
NORTH 3RD ST.
NORTH 1ST ST.
METROPOLITAN AVE.
BE
DF
OR
D A
VE
.
HA
VE
ME
YE
R S
T.
UNION AVE.
BAYA
RD ST
.RIC
HARD
SON S
T.
FROST
ST.
WITH
ERS S
T.
LORIMER ST.
GRAND ST.
HOPE ST.
MA
RC
Y A
VE
.
MA
RC
Y A
VE
.
RO
DN
EY
ST.
KE
AP
ST
.
HOPE ST.
GRAND ST.
SOUTH 1ST ST.
SOUTH 2ND ST.
SOUTH 3RD ST.
FILLMORE PL.
SOUTH 4TH ST.
SOUTH 5TH ST.
LEE AVE.
BROADWAY
ROEB
LING
ST.
SOUTH 8TH ST.
BROADWAY
BEDF
ORD
AVE.
DU
NH
AM
PL.
SOUTH 6TH ST.
HA
VE
ME
YE
R S
T.
DR
IGG
S A
VE
.
KEN
T AVE.
RIV
ER
ST
.
1-4 -2
-20
2
-3
-3
-3
10
-52
3
-1
5
4
6
-28
- 3
22-7
32
46
0
32
6
46
26
25
21
1
27
23
13
-71
46
6
-1
0-6
-6-6
87
6
- 2
9
346
32
46
32
46
32
26
46
46
26
8
238
23-1
24
-1
933
8
31
8
17
220
158
18
49
0
48
1
23 -723
-4
15 13
8
-12
66
55
- 3
9
-6
- 3 -2
-15-10
-10-5-9
24 3
7
362
11
27 31
2
-9
18
-1
-15
26
-1
9
6
61
7
7
7
2016
23
- 8
-2
25
- 1
3
29
3
- 2
7
3
713 -4 -2
-4
- 2
-12 -1-1
- 2
-1-4
7
11
19
- 4
2
1
1
14
2
5
12-1
4
- 8
-91 - 10
-2-7
-19
-3
-7
5
-2
12
1
6
3
0
1
160 161
185
199
203
215
224
240
125
171
0
0
0
0
17
0
6
BE
RR
Y S
T.
WY
TH
E A
VE
.
0
0
0
0
0
-40
-20
45
235230
206
RO
EB
LIN
G S
T.
-1
-55
193186
-6-6-8
-5
1
1
0
0
0
- 5
-5
0
-16
-16
43
7
1
1
0
0
- 2 -2
2
2
1
1
0
0
0
163
10098
84
84
1
3
06
15
6
-40
2
-1
0
-1-1
0-2
0
21
00
3
8 0
0
Figure 16-12bWilliamsburg Net Project Generated Traffic - MD Peak Hour
Greenpoint-Williamsburg Rezoning EIS
ANALYZED INTERSECTION (POSITIVE INCREMENT)
ANALYZED INTERSECTION (NEGATIVE INCREMENT)
LEGEND:PROJECTED DEVELOPMENT SITES
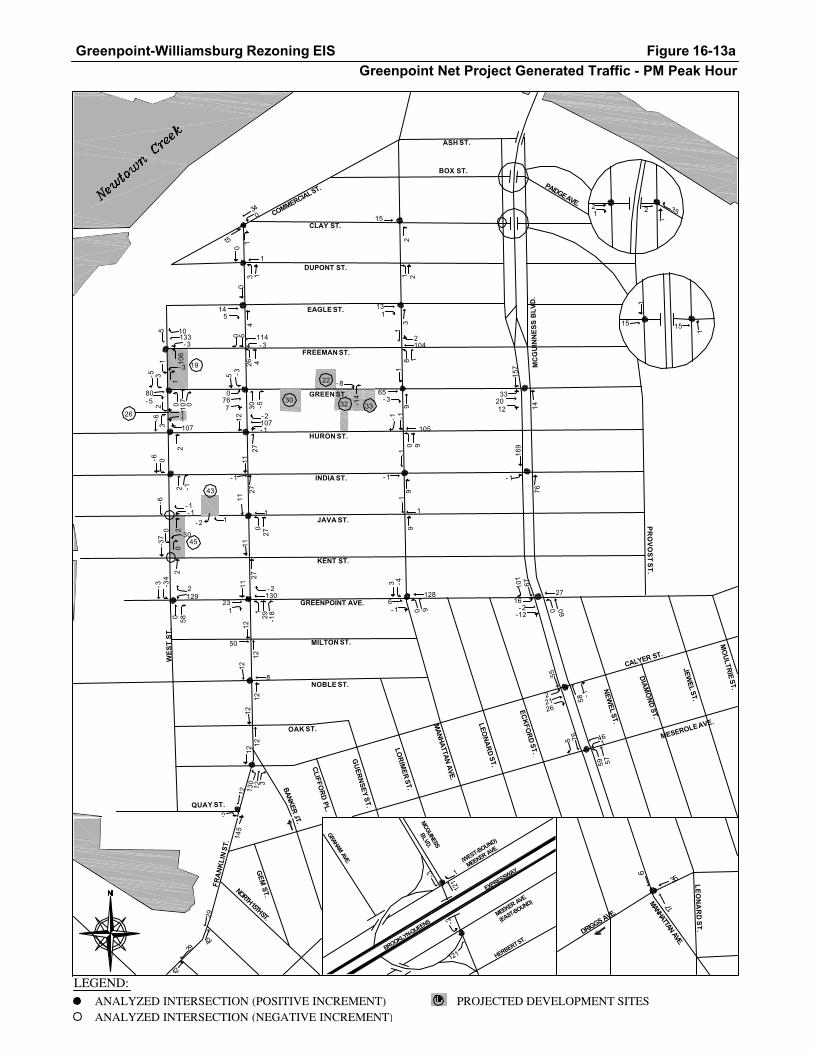
FR
AN
KL
IN S
T.
ST.
GE
M S
T.
NORTH 15TH ST.
29
145
2942
42
9
LE
ON
AR
D S
T.
MANHATTAN AVE.
DRIGGS AVE.
35
6
17
MEEKER AVE.
MEEKER AVE.
(EAST-BOUND)
(WEST-BOUND)
BROOKLYN-QUEENS
EXPRESSWAY
MCGUINESS
BLVD.
HERBERT ST.
GRAHAM AVE.
121
-3 1
121
-2
ASH ST.
BOX ST.
CLAY ST.
DUPONT ST.
EAGLE ST.
FREEMAN ST.
GREEN ST.
HURON ST.
INDIA ST.
KENT ST.
JAVA ST.
COMMERCIAL ST.
GREENPOINT AVE.
PAIDGE AVE.
MILTON ST.
NOBLE ST.
WE
ST
ST
.P
RO
VO
ST
ST
.
MC
GU
INN
ES
S B
LV
D.
OAK ST.
QUAY ST.
CLIFFO
RD
PL.
GU
ER
NS
EY
ST.
LOR
IME
R S
T.
MA
NH
ATTA
N A
VE.
LEO
NA
RD
ST.
EC
KFO
RD
ST.
NE
WE
L ST.
DIA
MO
ND
ST.
JEW
EL S
T.
MO
ULTR
IE S
T.
BA
NK
ER S
CALYER ST.
MESEROLE AVE.
-1
-2130
3
129
22
107
2
-3
128
9-1
15 76
59
55
582
27
101
67
60
169
76
157
14
114
12
105
106
5 10133
107- 5
80
-5 3
-1
-6
2
-6
- 1-1
-37
58
-34
-3 2
1
34
153 1
4
145
26 4
0
30 -5
-35
776
27
12 107-2
2711
- 1
0
1
11
2711
129 -18
11
231
1212
50
12
12
8
1212
12130
12
9
2
15
1 23
131
8 1
2104
19
165
-3
9
-1-1
9-1
- 1
9-1
1
-43
6
1
35221
15
1
1
15
332012
-1
-12-2
16
-1
2126
57
46
19
26
30
22
32 3300
0
45
0
0
- 3
5
0
27
00 0
0
1
-3
1
1 - 8
-14
0
11
2-6
3
0
-30
0
43
1-2
Greenpoint Net Project Generated Traffic - PM Peak HourFigure 16-13aGreenpoint-Williamsburg Rezoning EIS
LEGEND:PROJECTED DEVELOPMENT SITESANALYZED INTERSECTION (POSITIVE INCREMENT)
ANALYZED INTERSECTION (NEGATIVE INCREMENT)
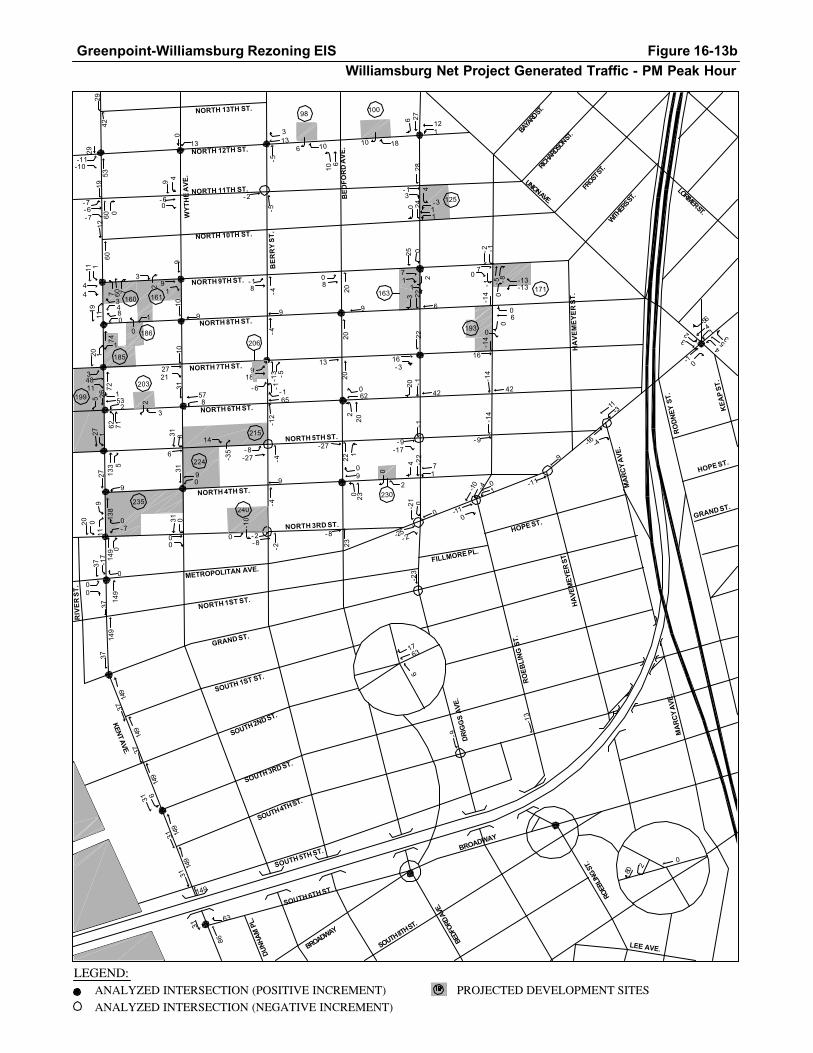
NORTH 13TH ST.
NORTH 12TH ST.
NORTH 11TH ST.
NORTH 10TH ST.
NORTH 9TH ST.
NORTH 8TH ST.
NORTH 7TH ST.
NORTH 6TH ST.
NORTH 5TH ST.
NORTH 4TH ST.
NORTH 3RD ST.
NORTH 1ST ST.
METROPOLITAN AVE.
BE
DF
OR
D A
VE
.
HA
VE
ME
YE
R S
T.
UNION AVE.
BAYA
RD ST
.RIC
HARD
SON S
T.
FROST
ST.
WITH
ERS S
T.
LORIMER ST.
GRAND ST.
HOPE ST.
MA
RC
Y A
VE
.
MA
RC
Y A
VE
.
RO
DN
EY
ST.
KE
AP
ST
.
HOPE ST.
GRAND ST.
SOUTH 1ST ST.
SOUTH 2ND ST.
SOUTH 3RD ST.
FILLMORE PL.
SOUTH 4TH ST.
SOUTH 5TH ST.
LEE AVE.
BROADWAY
ROEB
LING
ST.
SOUTH 8TH ST.
BROADWAY
BEDF
ORD
AVE.
DU
NH
AM
PL.
SOUTH 6TH ST.
HA
VE
ME
YE
R S
T.
DR
IGG
S A
VE
.
KEN
T AVE.
RIV
ER
ST
.
1-10 -4
9
-11
0
-3
-16 -4
11
564
2
4
-1
-9
220
1
27
23
62
220
20
- 8
578
31
7
19
7426
37
6
149
31
86
63
29
5329
6
113
3
149
80
17
62
-13
-14
- 9
-14
42
-14
-14
-1
-27
22
28
- 1
2422
42
-1
4214
937
149
37
149
37
31
149
149
3131 8
31
65
1960
1260
1120
3
20
149
-17
149
23
-11-10
-7
-7-6
60 7
1
8
72
4811
71
5 531
2
5
27
138
27
9
37
31
9
13
91
10
9
10
2721
31
6
9
3
-5
13
-5
- 2
9
-4-1
3 -5
918
-12
- 1
-4-27
-4
9
-2-8
-2
9
20
13
0
1
9
-8
6 12
3
11
325
71
6
16-3
20
-17
-1
17-2
24
-21
-23
-9
2
-5 -8
-2
7
-13
16
-11
533
1
160 161
185
199
203
215
224
240
125
171
0
0
0
0
0
0
BE
RR
Y S
T.
WY
TH
E A
VE
.
0
-25
00
0
00
44
235230
206
RO
EB
LIN
G S
T.
-2
193186
06
-13
0
0
0
0
4
- 3
0
-10
14
-35
34
11
3
2
1
0
1
10
2
0
3
2
-1- 6
163
63
10098
0
610
6 10
4
- 60
9
0
10 18
1
2
0
0-7
119
- 18 -4
80
0
0
0
20
0
-1
Figure 16-13bWilliamsburg Net Project Generated Traffic - PM Peak Hour
Greenpoint-Williamsburg Rezoning EIS
ANALYZED INTERSECTION (NEGATIVE INCREMENT)
ANALYZED INTERSECTION (POSITIVE INCREMENT)
LEGEND:PROJECTED DEVELOPMENT SITES
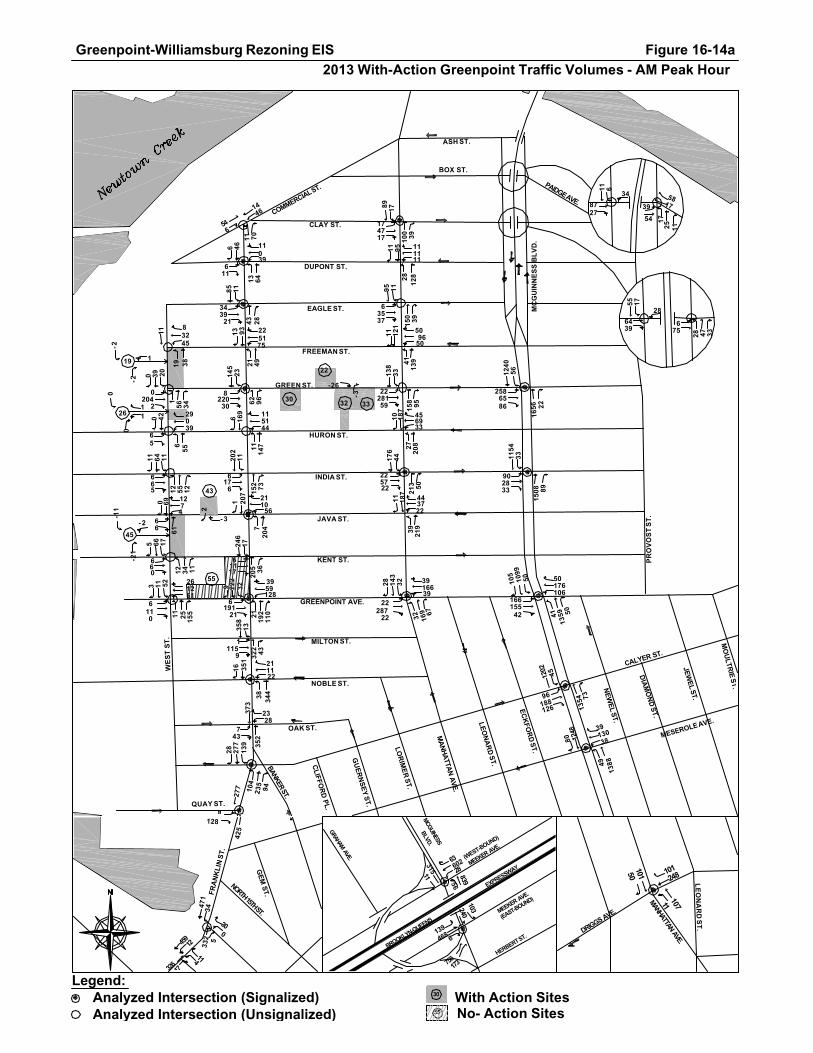
ASH ST.
BOX ST.
CLAY ST.
DUPONT ST.
EAGLE ST.
FREEMAN ST.
GREEN ST.
HURON ST.
INDIA ST.
KENT ST.
JAVA ST.
COMMERCIAL ST.
GREENPOINT AVE.
PAIDGE AVE.
MILTON ST.
NOBLE ST.
WE
ST
ST
.
PR
OV
OS
T S
T.
MC
GU
INN
ES
S B
LV
D.
OAK ST.
QUAY ST.
CLIFFO
RD
PL.
GU
ER
NS
EY
ST.
LOR
IME
R S
T.
MA
NH
ATTA
N A
VE.
LEO
NA
RD
ST.
EC
KFO
RD
ST.
NE
WE
L ST.
DIA
MO
ND
ST.
JEW
EL S
T.
MO
ULTR
IE S
T.
BANKER ST.
CALYER ST.
MESEROLE AVE.
3916639
28 143
32
32 169 67
22287
22
50176106
105
1099
50
4113
59 50
166155
42
1202
45
1354 7396
188126
391303880 12
48
49
1388
3959128
9 222
32
2119
211
0
6191
21
261251
3 11 5211 25 155
6110
5 66 17
12 34 11
660
11 64 1112 55 12
665
29039
0 42
655
65
0 39 201
56 34
0204
2
45
38
202
11
152 73
617
6
115144
6 169
1114
7
145
23
62 96
8220
30
85 11
43 28
3439
21
11039
6 46
13 646
11
1446
11
546
70
176
44
213 50
225722
138
33
158 95
2228159
95 11
150 39
63537
89 17
100 39
174717
1154
33
1508 89
902833
1240
56
1656 22
2586586
55 17
47 33
66439
5817
11 6
1725 11
39
54
34
28 277
139
104
235
94
8727
28
75
28
2110
56
1 207
720
4
211122
16 351
38 344
277
8
6169
66
127
4
21 49
13 93 225175
205 36
246
17
61117
322 43
358
13
1115
9
352
373
743
2328
95 111111
2812
8
11
4113
9
121
11 5096
50
456933
2720
8
10 187
443722
11 187
39 219
0
8
19
26
45
30
22
32 33
11 32
19 1
-2
-2
11
0
0
-26
-3
43
2
- 3-2
-21
-11
55
MEEKER AVE.
MEEKER AVE.
(EAST-BOUND)
(WEST-BOUND)
BROOKLYN-QUEENS
EXPRESSWAY
MCGUINESS
BLVD.
139
468 6
11315
103240
756173
636022883956
HERBERT ST.
GRAHAM AVE.
LE
ON
AR
D S
T.
MANHATTAN AVE.
DRIGGS AVE.
101248
10150
10711
FR
AN
KL
IN S
T.
GE
M S
T.
NORTH 15TH ST.
425
128
332 5
34471
300
45912
32617
114
Figure 16-14a 2013 With -Action Greenpoint Traffic Volumes - AM Peak Hour
Greenpoint-Williamsburg Rezoning EIS
30
Analyzed Intersection (Unsignalized)With Action Sites
Legend:Analyzed Intersection (Signalized)
55 No- Action Sites

NORTH 13TH ST.
NORTH 12TH ST.
NORTH 11TH ST.
NORTH 10TH ST.
NORTH 9TH ST.
NORTH 8TH ST.
NORTH 7TH ST.
NORTH 6TH ST.
NORTH 5TH ST.
NORTH 4TH ST.
NORTH 3RD ST.
NORTH 1ST ST.
METROPOLITAN AVE.
WY
TH
E A
VE
.
BE
RR
Y S
T.
BE
DF
OR
D A
VE
.
RO
EB
LIN
G S
T.
HA
VE
ME
YE
R S
T.
UNION AVE.
BAYA
RD ST
.RIC
HARD
SON S
T.
FROST
ST.
WITH
ERS S
T.
LORIMER ST.
GRAND ST.
HOPE ST.
MA
RC
Y A
VE
.
MA
RC
Y A
VE
.
RO
DN
EY
ST.
KE
AP
ST
.
HOPE ST.
GRAND ST.
SOUTH 1ST ST.
SOUTH 2ND ST.
SOUTH 3RD ST.
FILLMORE PL.
SOUTH 4TH ST.
SOUTH 5TH ST.
LEE AVE.
BROADWAY
ROEB
LING
ST.
SOUTH 8TH ST.
BROADWAY
DU
NH
AM
PL.
SOUTH 6TH ST.
HA
VE
ME
YE
R S
T.
DR
IGG
S A
VE
.
KEN
T A
VE.
RIV
ER
ST
.
130214
1112
7 1717 28 4511
17925
33 84
381
241
10355
28 182
37
17833
686
229100
344
30 556
1717
17243
14016329
7
30380
233
44
8256
238
33
14179
12 260
5817
13120
34 211
5746
17 287
14580
29 291
73125
62 311
204 12
3318
166 60
2354
190 46
45111
204 33
2250
278
17
508
9856
6 280
4526
17 310
4925
17 325
15077
17 209
453
28
341
27
480
33
031
0
5451
460
316
503
299
33
2
0
475
290
2838
502
27
11 269
5
5
480
28
626
6
6
44
011
480
17
276
6
11
17617
451 45
315 81
461
379
211
2292
15911
6 33
11439
178
302 202
10
463
331
1117
329 33
468
12
212
470
341
2111
475
30
318 0
392228 18
633
4418
39 274 56
1777
146
11
0
69224
291
00
22
19
50
101812
1306
0000
173102
0
0
6
3
42 816
0
726
128 14
7119
2522
22
132
22
28 116
16
56141
89 55
16172
6356
55
183
45
28 100
44
28112
5433
39
890
50161
3381
287 57
298 17
624
221
10
6220
5045
23 227
14150
57 221
13550
90 227
4811
53 236
459
1232
6 17114
293
497
60
6170
287 45
485 12
315
485
1711
451
379
1711
379
2
461
156
10047
280
327
23
3416
50137
1721
8
5160
1117
8
2835
39 198
335
101
38119
326
10
1916
503
57 178
160161
186
185
199203
215
224
240
125
171
193
4
235
230
206
163 0
0-4
5
5016
-12
0
0
0
2
-11
1
-35
13
- 7-8
314
0
2
-5
2
2
0
4
52
1
3
207
12
2013 With-Action Williamsburg Traffic Volumes - AM Peak HourFigure 16-14bGreenpoint-Williamsburg Rezoning EIS
Analyzed Intersection (Unsignalized)
Legend:Analyzed Intersection (Signalized)
30 With Action Sites55 No- Action Sites

FR
AN
KL
IN S
T.
GE
M S
T.
NORTH 15TH ST.
421
44
331
3639
4 8
156
32512
39617
66
LE
ON
AR
D S
T.
MANHATTAN AVE.
DRIGGS AVE.
9067
11817
161181
MEEKER AVE.
MEEKER AVE.
(EAST-BOUND)
(WEST-BOUND)
BROOKLYN-QUEENS
EXPRESSWAY
MCGUINESS
BLVD.
128
4906
17361
143240
550
894632265028
HERBERT ST.
GRAHAM AVE.11
8
ASH ST.
BOX ST.
CLAY ST.
DUPONT ST.
EAGLE ST.
FREEMAN ST.
GREEN ST.
HURON ST.
INDIA ST.
KENT ST.
JAVA ST.
COMMERCIAL ST.
GREENPOINT AVE.
PAIDGE AVE.
MILTON ST.
NOBLE ST.
WE
ST
ST
.
PR
OV
OS
T S
T.
MC
GU
INN
ES
S B
LV
D.
OAK ST.
QUAY ST.
CLIFFO
RD
PL.
GU
ER
NS
EY
ST.
LOR
IME
R S
T.
MA
NH
ATTA
N A
VE.
LEO
NA
RD
ST.
EC
KFO
RD
ST.
NE
WE
L ST.
DIA
MO
ND
ST.
JEW
EL S
T.
MO
ULTR
IE S
T.
BANKER ST.
CALYER ST.
MESEROLE AVE.
7325384
51 126
35
32 159 89
17173
34
50244168
131
1014
56
62 830 67
444157
1154 85
911 7348
14592
331172286 11
60
69 951
7885
173
11 158
35
1322
413
0
115913
31196
0 37 911 72 68
06
11
6 46 11
11 58 6
600
0 62 176 68 28
066
46633
6 40
662
66
44 71
62 51
069
0
4751
28
161
11
143 67
1134
6
255136
6 136
2812
6
129
25
85 66
9107
13
90 11
43 51
2221
6
170
0 52
24 411122
2346
296
167
11
154 62
226128
152
39
109 73
17156
24
96 4
113 27
112646
73 6
85 39
63911
1094
50
936 22
403956
1085
62
912 44
1444776
17 266
7774
265
88
6
34 642 11
4028
33
3426
6 6
4439
44 47 28
1239
59 6
44
17 5227
2811
51
6 161
28 182
17911
17 312
28 375
266
6
7462
00
28611
6
23 71
13 83 227171
210 95
190
22
011
6
364 28
322
22
337
7
354
323
2131
286
78 222222
2210
2
6
2010
6
136
6 3413855
335928
2714
9
26 150
456250
28 167
017
1
32
9
26
45
30
22
32 33
3
19
43
-10
-11
2
0
0
1
0
0
0
-1
-1
-15
-10
-5
55
1
2013 With-Action Greenpoint Traffic Volumes - MD Peak HourFigure 16-15aGreenpoint-Williamsburg Rezoning EIS
Analyzed Intersection (Unsignalized)
Legend:Analyzed Intersection (Signalized) 30 With Action Sites
55 No- Action Sites

NORTH 13TH ST.
NORTH 12TH ST.
NORTH 11TH ST.
NORTH 10TH ST.
NORTH 9TH ST.
NORTH 8TH ST.
NORTH 7TH ST.
NORTH 6TH ST.
NORTH 5TH ST.
NORTH 4TH ST.
NORTH 3RD ST.
NORTH 1ST ST.
METROPOLITAN AVE.
WY
TH
E A
VE
.
BE
RR
Y S
T.
BE
DF
OR
D A
VE
.
RO
EB
LIN
G S
T.
HA
VE
ME
YE
R S
T.
UNION AVE.
BAYA
RD ST
.RIC
HARD
SON S
T.
FROST
ST.
WITH
ERS S
T.
LORIMER ST.
GRAND ST.
HOPE ST.
MA
RC
Y A
VE
.
MA
RC
Y A
VE
.
RO
DN
EY
ST.
KE
AP
ST
.
HOPE ST.
GRAND ST.
SOUTH 1ST ST.
SOUTH 2ND ST.
SOUTH 3RD ST.
FILLMORE PL.
SOUTH 4TH ST.
SOUTH 5TH ST.
LEE AVE.
BROADWAY
ROEB
LING
ST.
SOUTH 8TH ST.
BROADWAY
DU
NH
AM
PL.
SOUTH 6TH ST.
HA
VE
ME
YE
R S
T.
DR
IGG
S A
VE
.
KEN
T A
VE.
RIV
ER
ST
.
181197
679 20
6 22 446186
13
39 106
428
250
131
62
2212
731
17327
662
266121
383
55 394
1111
20942
11617444
11
34270
201
28
7058
195
28
10794
197
11
8257
14528
75 152
5580
48 339
89114
39 361
6291
62 326
28
3247
77 28
31105
130 20
79119
120 17
3960
279
22
5012
5295
11 280
5060
28 268
3548
11 234
8097
2213
7
308
33
351 25
295
39
034
1
4617
317
343
304
357
28
30
5
305
381
2224
127
320
6
936
8 21
300
18
1133
0
5
74
68
34
317
17
389 17
1111
365 19
362 10
365
339
3211
2298
163
18784 28
17
11850
227
139 325
12
331
357
5513
356 23
302
44
111
303
351
2838
305
29
384 19
441717 14
9 22
4422
39 258 89
6
6
666
6
6
6356
5 130
0
44
0
0
1136
2
00
20
2
3
0
0
1
0 109
3
42 508
17
457
93 18
1173
3827
28
9111
44 95
17
4467
89 12
11124
4639
50
124
39
17 73
28
2287
7011
17
73 6
33113
5578
344 50
370 6
1730
163
17
6157
5622
34 186
8933
64
190
10439
99 190
506
85 174
325
1239
6 1766
395
329
06
0206
365
361
1111
263
112
8633
116
3320
212
231
51
628
6291
56 153
7082
28 80
5672
11 49
338
112
5089
927
20
412
329
362
329
361
365
61 161
339
160161
186
185
199203
215
224
240
125
171
193
235
230
206
5
5555
5
10
11
0
163
0
0
-5-5
-5
1
1
0
0
-2
- 2
1
1
- 5
-5
-16
-16
- 1
-1 0-2
22
0
0
0
0
74
3
1
1
207
45
-8
Figure 16-15b2013 With-Action Williamsburg Traffic Volumes - MD Peak Hour
Greenpoint-Williamsburg Rezoning EIS
Analyzed Intersection (Unsignalized)
Legend:Analyzed Intersection (Signalized) 30 With Action Sites
55 No- Action Sites

FR
AN
KL
IN S
T.
GE
M S
T.
NORTH 15TH ST.
55311
577
146
558
57
146
430
28
44811
105
LE
ON
AR
D S
T.
MANHATTAN AVE.
DRIGGS AVE.
168327
12973
10622
MEEKER AVE.
MEEKER AVE.
(EAST-BOUND)
(WEST-BOUND)
BROOKLYN-QUEENS
EXPRESSWAY
MCGUINESS
BLVD.
HERBERT ST.
GRAHAM AVE. 7960228
134686
6
143457
666125
76733
57111
ASH ST.
BOX ST.
CLAY ST.
DUPONT ST.
EAGLE ST.
FREEMAN ST.
GREEN ST.
HURON ST.
INDIA ST.
KENT ST.
JAVA ST.
COMMERCIAL ST.
GREENPOINT AVE.
PAIDGE AVE.
MILTON ST.
NOBLE ST.
WE
ST
ST
.
PR
OV
OS
T S
T.
MC
GU
INN
ES
S B
LV
D.
OAK ST.
QUAY ST.
CLIFFO
RD
PL.
GU
ER
NS
EY
ST.
LOR
IME
R S
T.
MA
NH
ATTA
N A
VE.
LEO
NA
RD
ST.
EC
KFO
RD
ST.
NE
WE
L ST.
DIA
MO
ND
ST.
JEW
EL S
T.
MO
ULTR
IE S
T.
BANKER ST.
CALYER ST.
MESEROLE AVE.
5144
2617 6 62
67
0 61
10 566
17
39
106
11
49 44
174210
232
8
103
101
11142
132014155
6 239
1118
4
266
28
189 93
62617
91198
184
6 272
34
12 269
134
68425
1 382
106
186
259
144
4217157
6 106
76
95 97
01111
6 113
6
610
9 22
606
6 127
1117 87 38
505
114539
0 94
092
511
0 94 190
153 56
0911
133112
46
104
6
75 33
617
33
131
6
120 33
114145
213
44
141
78
17198
30
222
44
199 44
22103
22
6237762
62 144
40
34 199
106
22190
40
391704010
315
67
9811
03
1571 84
1065 7771
25599
50307145
259
1455
78
63 934
139
78188
55
1855
28
1051 50
725861
1905
73
1065 22
2006456
17
69 617 6
6338
44
8045
11 6
4834
56 29 33
048
100
0
56
2818
50
5 278
19 254
311817
10 448
22 413
382
12
115
132
116
16617
32 82
22 94 11207146
267 95
300
28
61111
409 35
449
32
654
9
393
465
1423
281
2910
2
6
4011
8
156
20 35305101
3116244
3318
8
21 222
223050
47 197
19 221
98
4312
106
16
26
45
30
22
32 33
5
19
0
43
-8
-14
- 3
1
12
3
11
1
-2
-30
0
0
55
2013 With-Action Greenpoint Traffic Volumes - PM Peak HourFigure 16-16aGreenpoint-Williamsburg Rezoning EIS
Analyzed Intersection (Signalized)Legend:
Analyzed Intersection (Unsignalized)
30 With Action Sites55 No- Action Sites

NORTH 13TH ST.
NORTH 12TH ST.
NORTH 11TH ST.
NORTH 10TH ST.
NORTH 9TH ST.
NORTH 8TH ST.
NORTH 7TH ST.
NORTH 6TH ST.
NORTH 5TH ST.
NORTH 4TH ST.
NORTH 3RD ST.
NORTH 1ST ST.
METROPOLITAN AVE.
WY
TH
E A
VE
.
BE
RR
Y S
T.
BE
DF
OR
D A
VE
.
RO
EB
LIN
G S
T.
HA
VE
ME
YE
R S
T.
UNION AVE.
BAYA
RD ST
.RIC
HARD
SON S
T.
FROST
ST.
WITH
ERS S
T.
LORIMER ST.
GRAND ST.
HOPE ST.
MA
RC
Y A
VE
.
MA
RC
Y A
VE
.
RO
DN
EY
ST.
KE
AP
ST
.
HOPE ST.
GRAND ST.
SOUTH 1ST ST.
SOUTH 2ND ST.
SOUTH 3RD ST.
FILLMORE PL.
SOUTH 4TH ST.
SOUTH 5TH ST.
LEE AVE.
BROADWAY
ROEB
LING
ST.
SOUTH 8TH ST.
BROADWAY
DU
NH
AM
PL.
SOUTH 6TH ST.
HA
VE
ME
YE
R S
T.
DR
IGG
S A
VE
.
KEN
T A
VE.
RIV
ER
ST
.
228263
2859 18
17 44 6711
25621
56 134
580
341
18489
22 186
50
23831
1075
369135
509
91 588
3429
23741
12394
53
11
46895
284
22
5327
294
22
7077
303
17
9029
11330
62 289
7377
39 399
95157
8139
0
6787
3941
8
164 17
2643
178 39
1440
209 12
31107
196 67
2282
332
44
4929
5367
17 344
10696
22 360
3950
22 392
10481
1120
7
520
407
423
534
33
447 28
2544
528
449
541
424
55
19
520
508
1744
6
18
502
28
25 513
18
17
498
16
051
1
6
40
049
541
17
509
6
11
11622
549 24
519 30
556
441
886
28122
352
11
558
420
389
419 25
553
11
111
530
423
2130
516328 29
522
6412
56 277 78
4
5
506
514
34
481 2717
12
0611
11
4052
7 208
2
28 22
16584
23962
482 614 203
246
1
000
00
1148
3
53
44
624
50 683
11
446
138
28
4711
22 101
17
106 6
55105
22
22137
112 11
22133
2633
33
122
33
22 123
28
3384
134 4
10134
5833
16
3346
438 34
416 11
2238
300
19
11842
5129
44 291
9544
59
272
15433
98 273
8712
65 246
448 11
105
520
547
06
11310
531 11
553 21
519
553
2320
549
516
3317
516
13
556
10
344
67
7138
392
64
2239
392
50
1729
3393
27 213
61175
2716
5
4472
17 173
407 78
5069
529
39
36
5
72 207
463
160161
186
185
199203
215
224
240
125
171
193
235
230
206
163
-3
42
1
0
0
-13-13
0
2
0
0-10
14
-35
32
9
110-7
1
1
1
0
3
2
- 6
-1 207
3
411
44
-1
Figure 16-16b2013 With-Action Williamsburg Traffic Volumes - PM Peak Hour
Greenpoint-Williamsburg Rezoning EIS
Analyzed Intersection (Unsignalized)
Legend:Analyzed Intersection (Signalized)
30 With Action Sites55 No- Action Sites
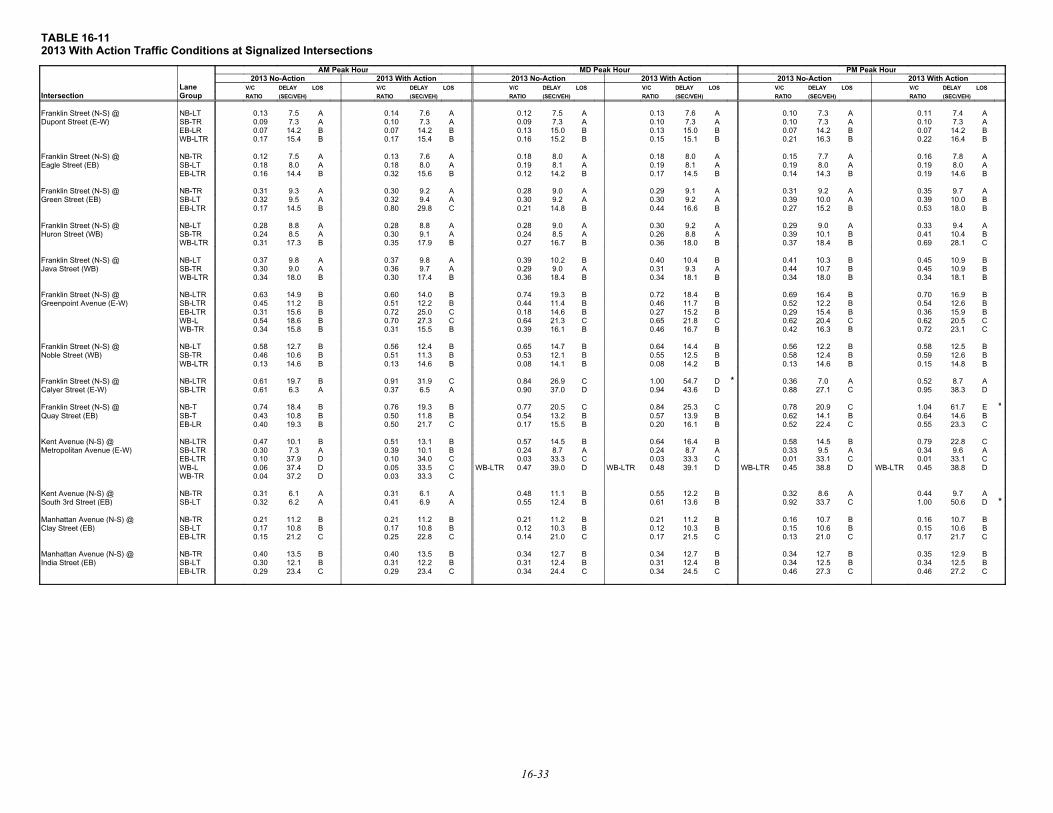
TABLE 16-112013 With Action Traffic Conditions at Signalized Intersections
MD Peak HourAM Peak Hour2013 With Action
PM Peak Hour2013 With Action2013 No-Action2013 With Action2013 No-Action2013 No-Action
LOSDELAYV/CLOSDELAYV/CLOSDELAYV/CLOSDELAYV/CLOSDELAYV/CLOSDELAYV/CLane(SEC/VEH)RATIO(SEC/VEH)RATIO(SEC/VEH)RATIO(SEC/VEH)RATIO(SEC/VEH)RATIO(SEC/VEH)RATIOGroupIntersection
A7.40.11A7.30.10A7.60.13A7.50.12A7.60.14A7.50.13NB-LTFranklin Street (N-S) @A7.30.10A7.30.10A7.30.10A7.30.09A7.30.10A7.30.09SB-TRDupont Street (E-W)B14.20.07B14.20.07B15.00.13B15.00.13B14.20.07B14.20.07EB-LRB16.40.22B16.30.21B15.10.15B15.20.16B15.40.17B15.40.17WB-LTR
A7.80.16A7.70.15A8.00.18A8.00.18A7.60.13A7.50.12NB-TRFranklin Street (N-S) @A8.00.19A8.00.19A8.10.19A8.10.19A8.00.18A8.00.18SB-LTEagle Street (EB)B14.60.19B14.30.14B14.50.17B14.20.12B15.60.32B14.40.16EB-LTR
A9.70.35A9.20.31A9.10.29A9.00.28A9.20.30A9.30.31NB-TRFranklin Street (N-S) @B10.00.39A10.00.39A9.20.30A9.20.30A9.40.32A9.50.32SB-LTGreen Street (EB)B18.00.53B15.20.27B16.60.44B14.80.21C29.80.80B14.50.17EB-LTR
A9.40.33A9.00.29A9.20.30A9.00.28A8.80.28A8.80.28NB-LTFranklin Street (N-S) @B10.40.41B10.10.39A8.80.26A8.50.24A9.10.30A8.50.24SB-TRHuron Street (WB)C28.10.69B18.40.37B18.00.36B16.70.27B17.90.35B17.30.31WB-LTR
B10.90.45B10.30.41B10.40.40B10.20.39A9.80.37A9.80.37NB-LTFranklin Street (N-S) @B10.90.45B10.70.44A9.30.31A9.00.29A9.70.36A9.00.30SB-TRJava Street (WB)B18.10.34B18.00.34B18.10.34B18.40.36B17.40.30B18.00.34WB-LTR
B16.90.70B16.40.69B18.40.72B19.30.74B14.00.60B14.90.63NB-LTRFranklin Street (N-S) @B12.60.54B12.20.52B11.70.46B11.40.44B12.20.51B11.20.45SB-LTRGreenpoint Avenue (E-W)B15.90.36B15.40.29B15.20.27B14.60.18C25.00.72B15.60.31EB-LTRC20.50.62C20.40.62C21.80.65C21.30.64C27.30.70B18.60.54WB-LC23.10.72B16.30.42B16.70.46B16.10.39B15.50.31B15.80.34WB-TR
B12.50.58B12.20.56B14.40.64B14.70.65B12.40.56B12.70.58NB-LTFranklin Street (N-S) @B12.60.59B12.40.58B12.50.55B12.10.53B11.30.51B10.60.46SB-TRNoble Street (WB)B14.80.15B14.60.13B14.20.08B14.10.08B14.60.13B14.60.13WB-LTR
A8.70.52A7.00.36*D54.71.00C26.90.84C31.90.91B19.70.61NB-LTRFranklin Street (N-S) @D38.30.95C27.10.88D43.60.94D37.00.90A6.50.37A6.30.61SB-LTRCalyer Street (E-W)
*E61.71.04C20.90.78C25.30.84C20.50.77B19.30.76B18.40.74NB-TFranklin Street (N-S) @B14.60.64B14.10.62B13.90.57B13.20.54B11.80.50B10.80.43SB-TQuay Street (EB)C23.30.55C22.40.52B16.10.20B15.50.17C21.70.50B19.30.40EB-LR
C22.80.79B14.50.58B16.40.64B14.50.57B13.10.51B10.10.47NB-LTRKent Avenue (N-S) @A9.60.34A9.50.33A8.70.24A8.70.24B10.10.39A7.30.30SB-LTRMetropolitan Avenue (E-W)C33.10.01C33.10.01C33.30.03C33.30.03C34.00.10D37.90.10EB-LTRD38.80.45WB-LTRD38.80.45WB-LTRD39.10.48WB-LTRD39.00.47WB-LTRC33.50.05D37.40.06WB-L
C33.30.03D37.20.04WB-TR
A9.70.44A8.60.32B12.20.55B11.10.48A6.10.31A6.10.31NB-TRKent Avenue (N-S) @*D50.61.00C33.70.92B13.60.61B12.40.55A6.90.41A6.20.32SB-LTSouth 3rd Street (EB)
B10.70.16B10.70.16B11.20.21B11.20.21B11.20.21B11.20.21NB-TRManhattan Avenue (N-S) @B10.60.15B10.60.15B10.30.12B10.30.12B10.80.17B10.80.17SB-LTClay Street (EB)C21.70.17C21.00.13C21.50.17C21.00.14C22.80.25C21.20.15EB-LTR
B12.90.35B12.70.34B12.70.34B12.70.34B13.50.40B13.50.40NB-TRManhattan Avenue (N-S) @B12.50.34B12.50.34B12.40.31B12.40.31B12.20.31B12.10.30SB-LTIndia Street (EB)C27.20.46C27.30.46C24.50.34C24.40.34C23.40.29C23.40.29EB-LTR
16-33

TABLE 16-11 2013 With Action Traffic Conditions at Signalized Intersections (Continued)
PM Peak HourMD Peak HourAM Peak Hour2013 With Action2013 No-Action2013 With Action2013 No-Action2013 With Action2013 No-Action
LOSDELAYV/CLOSDELAYV/CLOSDELAYV/CLOSDELAYV/CLOSDELAYV/CLOSDELAYV/CLane(SEC/VEH)RATIO(SEC/VEH)RATIO(SEC/VEH)RATIO(SEC/VEH)RATIO(SEC/VEH)RATIO(SEC/VEH)RATIOGroupIntersection
C24.30.63C23.90.62C23.30.59C23.20.58B20.00.47B19.90.47NB-LTRManhattan Avenue (N-S) @B18.50.39B18.60.40B18.40.38B18.40.38B18.90.40B18.70.38SB-LTRGreenpoint Avenue (E-W)B19.30.42B19.00.40B17.90.34B17.70.33C24.40.62B19.70.44EB-LTB14.80.09B14.90.09B14.60.07B14.60.07B14.50.06B14.40.05EB-RC32.90.82C23.90.63D37.20.85C32.40.79C20.10.46C20.10.47WB-LTR
B11.00.19B10.70.17C23.20.31C23.00.29B10.90.18B10.90.18NB-LTManhattan Avenue (N-S) @B12.10.29B12.00.29C24.70.38C24.50.37B11.80.26B11.50.23SB-TRDriggs Avenue (WB)
*E70.31.01D53.40.93B14.50.47B14.40.46D36.60.77D38.40.80WB-TR
B18.90.70B18.60.69B18.00.66B17.70.65*E65.01.06D41.70.99NB-TRMcGuinness Boulevard (N-S) @C27.30.54C26.20.52C21.80.44C20.80.43F98.60.89F98.60.89SB-LGreen Street (EB)C22.00.82B19.60.75B14.90.53B14.60.51B15.80.58B15.60.57SB-T
*E64.10.89D47.50.71*D54.10.80D44.80.65*F132.61.15D44.20.65EB-LTR
B17.60.69B16.40.64B16.50.64B15.90.62D41.50.99C28.70.91NB-TRMcGuinness Boulevard (N-S) @B13.00.20B12.10.18B16.60.34B15.60.32E55.90.63E55.90.63SB-LIndia Street (EB)B19.20.78B17.20.71B13.80.52B13.40.49B13.90.53B13.50.50SB-TC34.30.27C34.30.28C33.40.21C33.40.21D39.10.45D39.00.45EB-LTR
*F188.31.15F138.81.01D36.50.59C34.80.60C23.10.39C26.00.47NB-LMcGuinness Boulevard (N-S) @C21.10.71B20.00.68B19.10.64B18.60.62C29.30.89C27.10.86NB-TRGreenpoint Avenue (E-W)D37.30.63C30.40.57C20.30.38B19.30.36F126.40.95F126.40.95SB-LC22.90.80C20.20.71B17.30.58B16.70.54B18.20.62B17.50.58SB-TRD36.30.58D35.70.56C30.40.30C29.90.28D44.30.66C33.40.47EB-LTR
*E62.10.93D45.80.80D42.20.75D41.90.74D35.00.55D36.90.60WB-LTR
C21.40.77C20.10.73C20.30.74B19.80.72C25.80.87C24.70.85NB-TRMcGuinness Boulevard (N-S) @D41.30.69C32.90.62D39.20.68D36.30.66F98.20.85F98.20.85SB-LCalyer Street (EB)B17.80.68B17.30.66C22.70.80C22.10.79C24.70.84C23.00.81SB-T
*F110.61.09E74.80.96D48.40.74D43.50.64*F138.21.16E57.50.84EB-LTR
*F127.01.07B19.90.43C24.00.56B14.40.38C22.20.49B12.70.32NB-LMcGuinness Boulevard (N-S) @B11.80.67B11.10.64B10.10.58A9.90.57B17.90.85B16.90.83NB-TMeserole Avenue (WB)C25.40.94C20.60.89B12.30.70B11.70.68B14.30.77B12.50.71SB-TR
*F147.11.13F83.80.92*E60.50.78D54.00.72E56.80.78D54.70.75WB-LTR
C22.40.06C22.40.06C22.30.06C22.30.06C22.90.11C22.90.11NB-LMcGuinness Boulevard (N-S) @B12.30.47B11.40.39B11.50.40B11.20.38B12.70.50B12.60.50NB-TMeeker Avenue (WB)F97.51.05F99.01.05D51.50.70D51.60.70D47.90.60D48.00.60SB-TD39.10.05D39.00.04D39.50.07D39.50.07D39.10.05D39.10.05SB-RD38.70.63D38.70.63D37.30.56D37.30.56D38.80.64D38.90.64WB-LTR
D35.90.77C32.00.65C31.20.62C31.20.62D44.50.90D44.10.90NB-TRHumboldt Street (N-S) @F128.61.14F129.81.14D52.10.72D52.10.72D50.10.67D50.30.67SB-LTMeeker Avenue (EB)D42.70.76D42.70.76D37.00.55D37.00.55D37.40.57D37.40.57EB-LTR
16-34

TABLE 16-11 2013 With Action Traffic Conditions at Signalized Intersections (Continued)
PM Peak HourMD Peak HourAM Peak hour2013 With Action2013 No-Action2013 With Action2013 No-Action2013 With Action2013 No-Action
LOSDELAYV/CLOSDELAYV/CLOSDELAYV/CLOSDELAYV/CLOSDELAYV/CLOSDELAYV/CLane(SEC/VEH)RATIO(SEC/VEH)RATIO(SEC/VEH)RATIO(SEC/VEH)RATIO(SEC/VEH)RATIO(SEC/VEH)RATIOGroupIntersection
C25.90.39C25.70.38C25.70.37C25.70.37C23.60.24C23.70.24NB-LTRBedford Avenue (NB) @B15.80.13B15.70.13B15.50.11B15.50.11B15.40.10B15.40.10EB-LTBroadway (E-W)B17.40.28B16.80.23B15.70.13B15.50.11B15.80.14B15.90.15WB-T
A10.00.45A9.60.42A8.60.33A8.50.32A9.50.41A9.50.41SB-LTDriggs Avenue (SB) @D39.70.60D37.70.55D54.20.81D50.30.77*E66.90.91D49.70.77EB-TRNorth 7th Street (EB)
C26.60.52C27.80.56B19.30.16B19.40.17B19.80.21B19.70.20SB-LTRDriggs Avenue (SB) @C27.80.56C29.70.62C23.80.41C24.70.45C23.10.38C23.10.38EB-TRMetropolitan Avenue (E-W)D38.50.75D41.30.78C26.80.50C27.00.50C22.30.33C22.40.33WB-LT
C21.90.32C22.20.34C20.10.18C20.20.19C21.00.26C20.90.24SB-LTRDriggs Avenue (SB) @B20.00.15B20.00.15B19.70.13B19.70.13B19.70.13B19.70.13EB-TRGrand Street (E-W)C22.00.27C22.00.27B19.70.12B19.70.12B19.40.11B19.40.11WB-LT
C27.60.27C27.60.27C26.20.15C26.20.15C26.80.20C26.80.20NB-LTRRoebling Street (N-S) @C26.30.16C26.70.19C26.90.21C27.10.22C27.90.30C27.90.29SB-LTMetropolitan Avenue (E-W)C25.40.07C25.40.07C24.90.02C24.90.02C25.00.03C25.00.03SB-RB16.10.38B16.60.41B14.70.28B15.20.31B15.20.32B15.30.32EB-LTRE58.20.98E65.51.00D35.60.83D37.70.84C32.20.78C32.20.78WB-LTR
C29.40.40C29.40.40C28.20.31C28.20.31C27.80.28C27.80.28NB-LRHavemeyer Street (NB) @B17.20.44B17.50.46B15.10.32B15.20.32B15.80.35B15.60.34EB-TMetropolitan Avenue (E-W)C23.90.71C23.50.70B19.80.57B19.80.56B14.60.30B14.60.31WB-T
D41.70.67D42.70.70D43.70.69D44.10.70D39.80.58D39.40.56EB-TRMarcy Avenue (SB) @F96.01.13F97.21.14C30.40.87C30.90.88F80.81.08F83.71.09WB-LMetropolitan Avenue (E-W)A0.60.36A0.60.35A0.90.36A0.90.37A0.80.34A0.80.36WB-TR
*F99.61.02F87.60.97*F90.91.01F86.80.99F84.50.99F85.80.99NB-LTRUnion Avenue (N-S) @D35.60.41D35.50.40D51.00.75D49.70.73D46.60.68D44.70.64SB-LTRMetropolitan Avenue (E-W)C22.60.76C22.60.76B18.30.64B17.90.63B17.40.61B15.80.55EB-LTRC32.40.90C25.10.81B19.30.68B19.00.67D36.30.91D41.40.94WB-LTR
C21.00.26C20.90.26B16.00.13B17.70.18B14.60.03B14.90.05NB-LRoebling Street (N-S) @B14.60.05B14.60.05B14.50.04B14.50.04B14.90.08B14.90.08NB-RBroadway (E-W)C24.10.72C24.00.72B18.30.42C21.60.61B18.90.46C22.50.65SB-LTF100.61.06F100.61.06E77.00.97E77.00.97D38.50.61D38.50.61EB-TRF193.91.19WB-DfLF193.91.19WB-DfLC31.20.40C31.20.40C29.50.31C29.50.31WB-LTC34.20.50WB-TC34.20.50WB-T
ABBREVIATION: EB-Eastbound, WB-Westbound, NB-Northbound, SB-Southbound L-Left, T-Through, R-Right, E-W: East-West Roadway, N-S: North-South Roadway V/C Ratio - Volume to Capacity Ratio SEC/VEH - Seconds per Vehicle LOS - Level of Service
*- Denotes Impacted Location
16-35

TABLE 16-122013 With Action Traffic Conditions at Unsignalized Intersections
PM Peak HourMD Peak HourAM Peak Hour2013 With Action2013 No-Action2013 With Action2013 No-Action2013 With Action2013 No-Action
LOSDELAYV/CLOSDELAYV/CLOSDELAYV/CLOSDELAYV/CLOSDELAYV/CLOSDELAYV/CLane(SEC/VEH)RATIO(SEC/VEH)RATIO(SEC/VEH)RATIO(SEC/VEH)RATIO(SEC/VEH)RATIO(SEC/VEH)RATIOGroupIntersection
A7.60.08NB-LTA7.50.02NB-LTA7.40.01NB-LTWest Street (N-S) @C15.70.45WB-LTRA9.30.14WB-LRB10.40.15A9.10.07WB-LRB10.10.12A9.20.06WB-LRFreeman Street (WB)
A7.40.00A7.40.00A7.50.00A7.50.00A7.40.00A7.40.01NB-LTRWest Street (N-S) @A7.80.02A7.50.01A7.70.01A7.60.00A7.70.02A7.70.01SB-LTRGreen Street (E-W)B13.00.18B10.20.03B11.50.13A9.70.02B12.80.34A9.40.03EB-LTR
A7.40.00A7.40.00A7.50.00A7.50.00A7.40.00A7.5NB-LTWest Street (N-S) @A9.70.02A9.30.02A9.60.02A9.50.01A9.10.01A9.10.01EB-LRHuron Street (E-W)B10.50.21B10.50.08A9.40.10A9.60.07A9.70.09A10.00.07WB-LTR
A7.60.01A7.60.01A7.60.00A7.60.00A7.50.01A7.50.01NB-LTRWest Street (N-S) @A7.50.01A7.50.01A7.70.01A7.70.01A7.40.01A7.40.01SB-LTRIndia Street (E-W)A10.00.02B10.10.02B10.10.02B10.20.02A9.80.02A10.00.02EB-LTR
A7.50.00A7.60.00A7.70.01A7.70.01A7.40.01A7.50.01NB-LTRWest Street (N-S) @A7.50.00A7.50.00A7.60.01A7.60.01A7.50.01A7.60.01SB-LTRKent Street (E-W)A9.90.02B10.10.02A9.80.01A10.00.01B10.10.02B10.40.02EB-LTR
A7.50.00A7.50.00A7.60.01A7.60.01A7.40.01A7.40.01NB-LTRWest Street (N-S) @A7.70.01A7.60.03A7.80.01A7.70.02A7.80.04A7.50.05SB-LTRGreenpoint Avenue (E-W)B11.60.01B12.00.01B10.80.01B11.00.01B11.80.02B11.10.02EB-LTA9.90.02A10.00.02A9.20.02A9.30.02B11.50.01B10.60.01EB-TRB13.70.30B12.20.07B11.40.17B11.10.10B12.30.11B11.40.05WB-LTA9.80.07A9.80.06B10.10.01A9.50.03A10.00.05A9.50.08WB-TR
A9.70.01A9.40.01A7.40.01A7.40.01A9.80.02A9.50.01NB-LFranklin Street (N-S) @A8.80.07A8.70.06A9.80.05A9.60.03A9.00.08A8.80.07NB-RCommercial Street (E-W)A7.60.03A7.50.03A9.70.09A9.50.07A7.60.04A7.50.03WB-LT
A8.00.02A7.90.02A7.90.01A7.90.01A7.90.01A7.90.01SB-LTFranklin Street (N-S) @B14.50.12B14.10.12B13.00.11B12.80.11B12.70.06B12.20.06EB-LTRIndia Street (EB)
A8.80.06A8.70.06A8.90.04A8.90.04A8.30.03A8.30.03SB-LTFranklin Street (N-S) @C15.70.06B14.80.05B13.40.05B13.20.05B11.10.06B11.20.06WB-LRNorth 14th Street (E-W)
A9.00.00A8.90.00A8.30.00A8.30.00A8.60.00A8.40.00NB-LTKent Avenue (N-S) @B14.60.12B13.70.11B13.40.15B13.20.15C18.10.10C16.80.10WB-LTRNorth 12th Street (E-W)C20.10.01B19.90.09B14.00.01B14.60.08C16.50.01C18.30.04EB-LR
A8.60.04A8.40.04A8.80.05A8.70.05A8.40.01A8.40.01SB-LTKent Avenue (N-S) @C20.80.01C20.10.09C16.10.01C15.90.08C16.70.02C18.10.17EB-LTRNorth 11th Street (E-W)
A8.60.01NB-LTRA8.00.01NB-LTRA8.50.00NB-LTRNB-LTRKent Avenue (N-S) @A8.70.04SB-LTA8.50.04A8.60.04SB-LTA8.50.03A8.60.03SB-LTA8.50.03SB-LTNorth 9th Street (EB)C19.00.03WB-LTRB14.00.02WB-LTRB14.10.01WB-LTR
D26.90.23WB-LC23.10.20WB-LC15.50.05B14.80.05WB-LC18.40.31C16.70.28WB-LRKent Avenue (N-S) @B12.20.05WB-RB11.30.03WB-RB11.20.08B10.80.07WB-RNorth 8th Street (WB)
A8.90.00A8.90.01A8.20.00A8.10.00A8.80.00A8.70.00NB-LTRKent Avenue (N-S) @A8.70.04A8.50.03A8.60.04A8.50.04A8.40.03A8.40.03SB-LTRNorth 7th Street (E-W)E38.40.39C20.30.01C18.50.17B14.30.01*D34.20.54C17.30.01EB-LTR
A9.30.08A8.80.00A8.30.03A8.10.00A9.10.02A8.70.00NB-LTKent Avenue (N-S) @E35.30.02B19.00.01B14.90.01B13.10.01C20.50.01C16.50.01EB-LRNorth 6th Street (E-W)
*F54.60.69B15.80.20C21.00.28C15.80.16C19.00.22B14.20.13WB-LTR
16-36
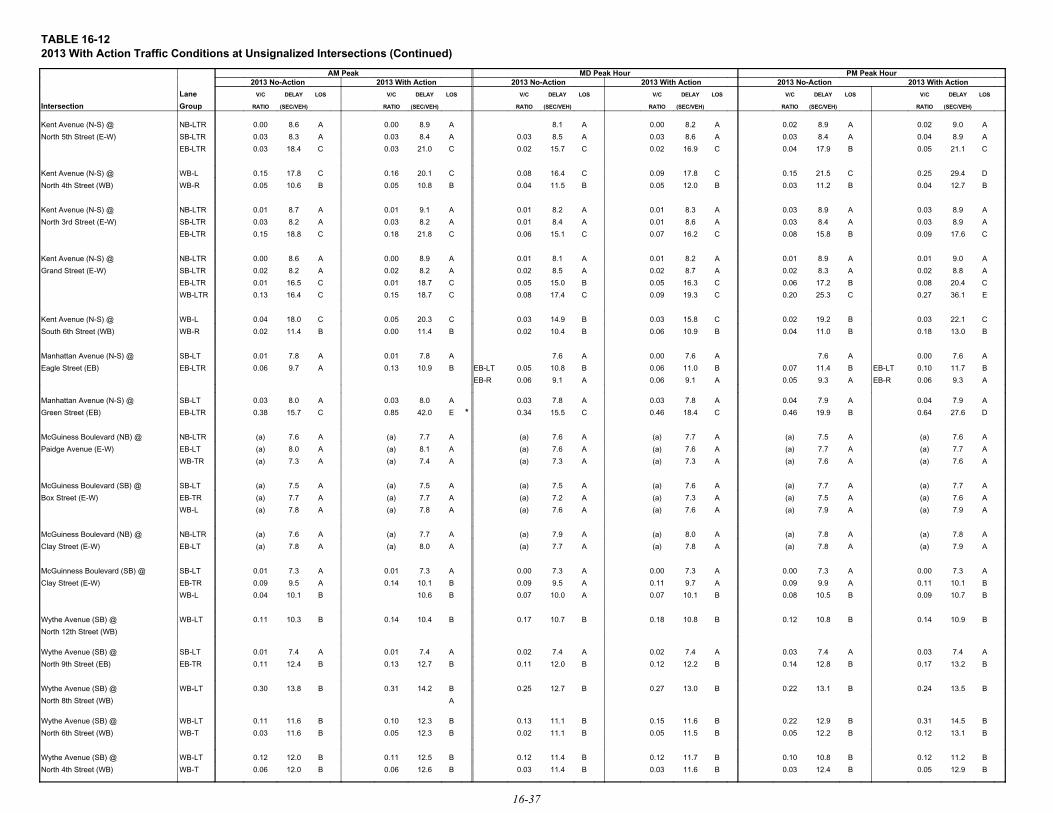
TABLE 16-122013 With Action Traffic Conditions at Unsignalized Intersections (Continued)
PM Peak HourMD Peak HourAM Peak2013 With Action2013 No-Action2013 With Action2013 No-Action2013 With Action2013 No-Action
LOSDELAYV/CLOSDELAYV/CLOSDELAYV/CLOSDELAYV/CLOSDELAYV/CLOSDELAYV/CLane
(SEC/VEH)RATIO(SEC/VEH)RATIO(SEC/VEH)RATIO(SEC/VEH)RATIO(SEC/VEH)RATIO(SEC/VEH)RATIOGroupIntersection
A9.00.02A8.90.02A8.20.00A8.1A8.90.00A8.60.00NB-LTRKent Avenue (N-S) @
A8.90.04A8.40.03A8.60.03A8.50.03A8.40.03A8.30.03SB-LTRNorth 5th Street (E-W)
C21.10.05B17.90.04C16.90.02C15.70.02C21.00.03C18.40.03EB-LTR
D29.40.25C21.50.15C17.80.09C16.40.08C20.10.16C17.80.15WB-LKent Avenue (N-S) @
B12.70.04B11.20.03B12.00.05B11.50.04B10.80.05B10.60.05WB-RNorth 4th Street (WB)
A8.90.03A8.90.03A8.30.01A8.20.01A9.10.01A8.70.01NB-LTRKent Avenue (N-S) @
A8.90.03A8.40.03A8.60.01A8.40.01A8.20.03A8.20.03SB-LTRNorth 3rd Street (E-W)
C17.60.09B15.80.08C16.20.07C15.10.06C21.80.18C18.80.15EB-LTR
A9.00.01A8.90.01A8.20.01A8.10.01A8.90.00A8.60.00NB-LTRKent Avenue (N-S) @
A8.80.02A8.30.02A8.70.02A8.50.02A8.20.02A8.20.02SB-LTRGrand Street (E-W)
C20.40.08B17.20.06C16.30.05B15.00.05C18.70.01C16.50.01EB-LTR
E36.10.27C25.30.20C19.30.09C17.40.08C18.70.15C16.40.13WB-LTR
C22.10.03B19.20.02C15.80.03B14.90.03C20.30.05C18.00.04WB-LKent Avenue (N-S) @
B13.00.18B11.00.04B10.90.06B10.40.02B11.40.00B11.40.02WB-RSouth 6th Street (WB)
A7.60.00A7.6A7.60.00A7.6A7.80.01A7.80.01SB-LTManhattan Avenue (N-S) @
B11.70.10EB-LTB11.40.07B11.00.06B10.80.05EB-LTB10.90.13A9.70.06EB-LTREagle Street (EB)
A9.30.06EB-RA9.30.05A9.10.06A9.10.06EB-R
A7.90.04A7.90.04A7.80.03A7.80.03A8.00.03A8.00.03SB-LTManhattan Avenue (N-S) @
D27.60.64B19.90.46C18.40.46C15.50.34*E42.00.85C15.70.38EB-LTRGreen Street (EB)
A7.6(a)A7.5(a)A7.7(a)A7.6(a)A7.7(a)A7.6(a)NB-LTRMcGuiness Boulevard (NB) @
A7.7(a)A7.7(a)A7.6(a)A7.6(a)A8.1(a)A8.0(a)EB-LTPaidge Avenue (E-W)
A7.6(a)A7.6(a)A7.3(a)A7.3(a)A7.4(a)A7.3(a)WB-TR
A7.7(a)A7.7(a)A7.6(a)A7.5(a)A7.5(a)A7.5(a)SB-LTMcGuiness Boulevard (SB) @
A7.6(a)A7.5(a)A7.3(a)A7.2(a)A7.7(a)A7.7(a)EB-TRBox Street (E-W)
A7.9(a)A7.9(a)A7.6(a)A7.6(a)A7.8(a)A7.8(a)WB-L
A7.8(a)A7.8(a)A8.0(a)A7.9(a)A7.7(a)A7.6(a)NB-LTRMcGuiness Boulevard (NB) @
A7.9(a)A7.8(a)A7.8(a)A7.7(a)A8.0(a)A7.8(a)EB-LTClay Street (E-W)
A7.30.00A7.30.00A7.30.00A7.30.00A7.30.01A7.30.01SB-LTMcGuinness Boulevard (SB) @
B10.10.11A9.90.09A9.70.11A9.50.09B10.10.14A9.50.09EB-TRClay Street (E-W)
B10.70.09B10.50.08B10.10.07A10.00.07B10.6B10.10.04WB-L
B10.90.14B10.80.12B10.80.18B10.70.17B10.40.14B10.30.11WB-LTWythe Avenue (SB) @
North 12th Street (WB)
A7.40.03A7.40.03A7.40.02A7.40.02A7.40.01A7.40.01SB-LTWythe Avenue (SB) @
B13.20.17B12.80.14B12.20.12B12.00.11B12.70.13B12.40.11EB-TRNorth 9th Street (EB)
B13.50.24B13.10.22B13.00.27B12.70.25B14.20.31B13.80.30WB-LTWythe Avenue (SB) @
ANorth 8th Street (WB)
B14.50.31B12.90.22B11.60.15B11.10.13B12.30.10B11.60.11WB-LTWythe Avenue (SB) @
B13.10.12B12.20.05B11.50.05B11.10.02B12.30.05B11.60.03WB-TNorth 6th Street (WB)
B11.20.12B10.80.10B11.70.12B11.40.12B12.50.11B12.00.12WB-LTWythe Avenue (SB) @
B12.90.05B12.40.03B11.60.03B11.40.03B12.60.06B12.00.06WB-TNorth 4th Street (WB)
16-37

TABLE 16-122013 With Action Traffic Conditions at Unsignalized Intersections (Continued)
PM Peak HourMD Peak HourAM Peak Hour2013 With Action2013 No-Action2013 With Action2013 No-Action2013 With Action2013 No-Action
LOSDELAYV/CLOSDELAYV/CLOSDELAYV/CLOSDELAYV/CLOSDELAYV/CLOSDELAYV/CLane(SEC/VEH)RATIO(SEC/VEH)RATIO(SEC/VEH)RATIO(SEC/VEH)RATIO(SEC/VEH)RATIO(SEC/VEH)RATIOGroupIntersection
A7.20.01A7.20.01A7.30.02A7.30.02A7.20.01A7.20.01NB-LTBerry Street (NB) @B11.60.14B11.50.12B11.30.16B11.20.15B12.00.15B11.40.10WB-TNorth 12th Street (WB)A9.40.13A9.40.12A9.00.09A10.00.20A9.80.19WB-R
A7.9(a)A7.9(a)A7.7(a)A7.7(a)A8.1(a)A8.0(a)NB-TBerry Street (NB) @A8.1(a)A8.1(a)A7.7(a)A7.7(a)A8.1(a)A8.0(a)NB-TRNorth 11th Street (EB)A8.8(a)A8.8(a)A8.2(a)A8.2(a)A8.1(a)A8.1(a)EB-LT
B11.70.23B11.60.19B11.40.28B11.20.26B12.40.27B11.60.18EB-LTBerry Street (NB) @North 7th Street (EB)
B10.20.05B10.40.09A9.90.11A10.00.13B10.40.08B10.40.07EB-LTBerry Street (NB) @B10.70.03B10.90.06B10.10.08B10.10.09B11.10.05B11.10.04EB-TNorth 5th Street (EB)
B10.30.10B10.40.12A9.40.10A9.40.10B10.10.08B10.10.08EB-LTBerry Street (NB) @North 3rd Street (EB)
A7.30.03A7.30.03A7.30.04A7.30.04A7.30.04A7.30.04NB-LTBedford Avenue (NB) @C17.20.37B16.10.34C15.50.34B15.00.32C18.00.46C17.80.45WB-TRNorth 8th Street (WB)
A7.40.06A7.30.05A7.30.03A7.30.03A7.30.02A7.30.02NB-LTBedford Avenue (NB) @D27.80.66B18.40.45C17.10.44C16.10.40B15.00.43C15.50.44WB-TRNorth 6th Street (WB)
A7.30.03A7.30.03A7.30.03A7.30.03A7.30.01A7.30.02NB-LTBedford Avenue (NB) @B14.10.30B13.40.27B13.70.27B13.60.27B11.30.18B11.70.19WB-TRNorth 4th Street (WB)
B10.9(a)B10.2(a)A9.2(a)A9.0(a)A9.7(a)A9.8(a)SB-TRDriggs Avenue (SB) @A9.3(a)A9.0(a)A9.1(a)A8.9(a)A9.0(a)A9.0(a)WB-LTNorth 12th Street (WB)
A7.20.01A7.20.01A7.30.01A7.30.21A7.30.01A7.30.01SB-LTDriggs Avenue (SB) @B13.20.23B12.60.21B11.50.22B11.40.00B11.90.14B11.80.14EB-TRNorth 9th Street (EB)
A7.30.02A7.30.02A7.30.02A7.30.23A7.30.03A7.30.03SB-LTDriggs Avenue (SB) @B12.10.15B12.40.20B11.70.21B11.80.00B13.00.26B12.80.25EB-TRNorth 5th Street (EB)
B12.10.38B12.30.40B10.70.28B10.70.29B11.10.32B11.10.31SB-TRDriggs Avenue (SB) @A7.30.03A7.30.30A7.20.00A7.20.00A7.20.00A7.20.00WB-LTSouth 4th Street (WB)
ABBREVIATION: EB-Eastbound, WB-Westbound, NB-Northbound, SB-Southbound L-Left, T-Through, R-Right, E-W: East-West Roadway, N-S: North-South Roadway V/C Ratio - Volume to Capacity Ratio SEC/VEH - Seconds per Vehicle LOS - Level of Service
*- Denotes Impacted Location (a) All-way stop control; no v/c ratio reported
16-38

Greenpoint-Williamsburg Rezoning EIS Chapter 16: Traffic and Parking
16-39
TABLE 16-13
Summary of Impacted Intersections
Signalized Intersections AM MD PM
Franklin Street @ Calyer Street X
Quay Street X
Kent Avenue @ South 3 StreetrdX
Manhattan Avenue @ Driggs Avenue X
McGuinness Boulevard @ Green Street X X X
Greenpoint Avenue X
Calyer Street X X
Meserole Avenue X X
Driggs Avenue @ North 7 StreetthX
Metropolitan Avenue @ Union Avenue X X
Unsignalized Intersections AM MD PM
Kent Avenue @ North 6 StreetthX
North 7 StreetthX
Manhattan Avenue @ Green Street X
X impacts to one or more movements in the peak hour.
E (64.1 seconds of delay) in the PM. This compares to LOS D in the AM, midday and PM peak periods
in the No-Action with delays of 44.2, 44.8 and 47.5 seconds, respectively.
At the intersection of McGuinness Boulevard with Greenpoint Avenue, the northbound left turn
movement would be impacted by project traffic in the PM peak hour, operating at LOS F unchanged from
the No-Action condition; delay would increase to 188.3 seconds from 138.8 seconds with the
implementation of the proposed action. The westbound approach would be impacted in the PM peak hour
with conditions deteriorating to LOS E (62.1 seconds of delay) compared to LOS D (45.8 seconds of
delay) in the No-Action.
The eastbound approach at McGuinness Boulevard and Calyer Street would deteriorate to LOS F with
the proposed action in both the AM and PM peak hours compared to LOS E during these periods in the
No-Action condition. In the AM, delay would increase to 138.2 seconds from 57.5 seconds in the No-
Action; in the PM, delay would increase to 110.6 seconds from 74.8 seconds.
The northbound left turn movement from McGuinness Boulevard to Meserole Avenue would be impacted
by project traffic in the PM peak hour, deteriorating to LOS F (127 seconds of delay) from a No-Action
LOS B (19.9 seconds). The westbound Meserole Avenue approach would be impacted in both the midday
and the PM, operating at LOS E and LOS F, respectively, during these periods compared to LOS D and

Greenpoint-Williamsburg Rezoning EIS Chapter 16: Traffic and Parking
16-40
LOS F, respectively, in the No-Action. Delay would increase from 54 seconds to 60.5 seconds in the
midday, and from 83.8 seconds to 147.1 seconds in the PM.
Driggs Avenue
The eastbound North 7 Street approach at Driggs Avenue would be impacted by project traffic in theth
AM peak hour, operating at LOS E (66.9 seconds) versus a No-Action LOS D (49.7 seconds).
Metropolitan Avenue
The northbound approach at Union and Metropolitan Avenues would be impacted by project traffic in
the midday and PM peak hours, operating at LOS F during these periods both with and without the
proposed action. In the midday, the approach delay would increase to 90.9 seconds from 86.8 seconds in
the No-Action; in the PM peak hour, delay would deteriorate to 99.6 seconds, versus 87.6 seconds in the
No-Action.
Unsignalized Intersections
As shown in Table 16-12, three unsignalized intersections analyzed as part of this study would be
impacted by project generated traffic, two in the AM peak hour and a third in the PM. As in the No-
Action condition, there would be no unsignalized intersections operating at or above capacity (i.e., a v/c
ratio of 1.0 or greater) in the future with the proposed action.
Kent Avenue
As shown in Table 16-12, at the unsignalized intersection of Kent Avenue and North 6 Street, theth
westbound North 6 Street approach would be impacted by project traffic in the PM peak hour. Thisth
approach would deteriorate to LOS F compared to LOS B under No-Action conditions. Delay would
increase to 54.6 seconds compared to 15.8 seconds in the No-Action. Although the eastbound approach
would deteriorate from LOS B to LOS E in the PM peak hour, this approach would not be considered
impacted under CEQR criteria as there would be fewer than 90 vehicles on the approach during this peak
hour.
At the unsignalized intersection of Kent Avenue and North 7 Street, the eastbound North 7 Streetth th
approach would be impacted by project traffic in the AM peak hour. This approach would deteriorate to
LOS D compared to LOS C under No-Action conditions. Delay would increase to 34.2 seconds compared
to 17.3 seconds in the No-Action.
Manhattan Avenue
The eastbound Green Street would be impacted by project generated traffic in the AM peak hour,
deteriorating to LOS E (42.0 seconds of delay) from a No-Action LOS C (15.7 seconds of delay).
Bicycle Facilities
The projected residential and retail/commercial developments are likely to generate some new commuter
trips by bicycle in the peak periods, and the proposed park on Site 211 would generate recreational
bicycle trips primarily during off-peak periods and on weekends. Some of this new demand would likely

Greenpoint-Williamsburg Rezoning EIS Chapter 16: Traffic and Parking
16-41
utilize the on-street bike lane along Berry Street, the paths along the Pulaski and Williamsburg Bridges,
and the routes recommended for bicyclists in the 2003 NYC Cycling Map. In addition to new bicycle
demand, the proposed action would generate new vehicular and pedestrian trips on streets shared with
bicycles. The proposed action would not otherwise affect existing or proposed bicycle facilities in the
study area.
Parking
Off-Street Parking
Based on 2000 Census data, the overall rate of auto ownership in Brooklyn Community District 1, which
encompasses the study area, is approximately 0.37 vehicles per household. As the proposed action does
not include an affordable housing component and assumes the development of predominantly market-rate
housing, the projected auto ownership rate for the new households is expected to be higher than the
average for the area. Based on data on auto ownership by income level reported in the 2000 Census, it
is estimated that the new market-rate housing that would be developed under the proposed action would
have an average auto ownership rate of 0.77 vehicles per household. The 7,391 net dwelling units that
would be developed with the proposed action would therefore introduce approximately 5,691 vehicles
to the study area. Peak parking demand would occur during the overnight hours as is typical for
residential land uses.
Under the proposed zoning, the number of accessory parking spaces required for residential uses would
range from 0.4 to 0.7 spaces per dwelling unit, or an average of approximately 0.44 spaces per dwelling
unit for all of the projected development sites. This estimate assumes that conversion sites provide some
accessory parking (estimated as one-half of that for new construction). In addition, under the proposed
zoning, retail/commercial uses would be required to provide approximately one space per 1,000 square
feet.
Based on an average requirement of approximately 0.44 spaces per dwelling unit, the estimated number
of accessory parking spaces that would be provided for the approximately 7,391 dwelling units developed
under the proposed action would therefore total 3,244. A further 254 accessory spaces would be required
under zoning for the approximately 253,698 square feet of retail/commercial space generated by the
proposed action. As retail/commercial parking demand typically peaks in the midday with little overnight
demand, it is anticipated that these 254 spaces would be available to accommodate overnight residential
demand. Therefore, of the approximately 5,691 vehicles associated with new residential development,
upwards of 3,498 would be accommodated in new accessory parking that would be required under the
proposed action. The remaining residential demand – upwards of 2,193 vehicles during the peak overnight
period – would utilize on-street curbside spaces along the local street system. The potential effect of this
increase in overnight on-street parking demand is evaluated below in the discussion of on-street parking
conditions.
As discussed above, under the proposed zoning, retail/commercial uses would be required to provide
approximately one space per 1,000 square feet, or a total of approximately 254 spaces. In addition, given
the fact that residential parking demand is typically lowest in the midday when retail/commercial demand
peaks, it is likely that from ¼ to a (887 to 1,171) of the accessory residential spaces that would be
required under the proposed action would also be available to accommodate midday retail/commercial
demand. As the commercial uses that would be developed under the proposed action would be
predominantly neighborhood retail and would therefore have a relatively low auto mode share (see Table

Greenpoint-Williamsburg Rezoning EIS Chapter 16: Traffic and Parking
16-42
16-6), it is expected that the accessory off-street parking capacity provided under the proposed action
would be sufficient to accommodate peak retail/commercial demand.
On-Street Parking
As discussed above, it is anticipated that the proposed action would introduce sufficient accessory parking
capacity to accommodate peak retail/commercial demand in the weekday midday. All of the projected
commercial developments would also incorporate sufficient off-street loading facilities to accommodate
delivery and service vehicles. In addition, the proposed action would introduce sufficient new accessory
parking to accommodate approximately 61 percent of the peak overnight demand generated by projected
residential development (3,498 vehicles). The remaining 39 percent of overnight residential parking
demand (upwards of 2,193 vehicles) would therefore need to be accommodated on-street throughout the
study area.
It is estimated that in the future without the proposed action, weekday overnight demand for on-street
parking within ¼-mile of the proposed action area would total approximately 83 percent of capacity, with
approximately 3,600 parking spaces available to accommodate new demand. This would be more than
sufficient to accommodate the estimated 2,193 spaces of overnight on-street parking demand that would
be generated by the proposed action. Therefore, the proposed action is not expected to adversely affect
on-street parking conditions in the study area.
E. SUMMARY
This chapter analyzes the effects of added traffic and parking demand from projected development sites
on the Greenpoint and Williamsburg street network during the weekday AM, midday, and PM peak hours.
The results of the analyses show that project demand would create significant traffic impacts (see Tables
16-11 and 16-12), with the PM peak hour having the most impacts, with nine impacted intersections (eight
signalized, one unsignalized), followed by the AM and the midday, with five (three signalized, two
unsignalized) and four (all signalized) impacted intersections, respectively. Chapter 22, “Mitigation,” of
this EIS provides a description of measures to be developed to mitigate the traffic impacts identified in
this chapter.
It is expected that the accessory off-street parking capacity provided under the proposed action would be
sufficient to accommodate peak retail/commercial demand in the weekday midday, and that the 2,193
spaces of overnight on-street parking demand that would be generated by the proposed action could be
readily accommodated by the available on-street supply. No significant adverse impacts to study area
parking conditions would therefore result from the proposed action.