getting to $100 billion: climate finance … · getting to $100 billion: climate finance scenarios...
TRANSCRIPT
WORKING PAPER | May 2015 | 1
WORKING PAPER
GETTING TO $100 BILLION: CLIMATE FINANCE SCENARIOS AND PROJECTIONS TO 2020 MICHAEL I. WESTPHAL, PASCAL CANFIN, ATHENA BALLESTEROS, AND JENNIFER MORGAN
CONTENTSExecutive Summary....................................................... 1
Introduction....................................................................5
Methodology..................................................................5
Projections to 2020 .....................................................11
Finding A Middle Ground
To Reach $100 Billion .................................................13
Appendices..................................................................15
Endnotes..................................................................... .18
Working Papers contain preliminary research, analysis, findings, and recommendations. They are circulated to stimulate timely discussion and critical feedback and to influence ongoing debate on emerging issues. Most working papers are eventually published in another form and their content may be revised.
Suggested Citation: M.I. Westphal, P. Canfin, A. Ballesteros, and J. Morgan. 2015. “Getting to $100 Billion: Climate Finance Scenarios and Projections to 2020.” Working Paper. Washington, DC: World Resources Institute. Available online at: www.wri.org/publication/getting-to-100-billion.
EXECUTIVE SUMMARYAt Copenhagen in 2009, developed country Parties to the United Nations Framework Convention on Climate Change (UNFCCC) committed to a goal of mobilizing jointly $100 billion a year by 2020 from public and private sources to support climate action in developing countries. More than five years later, the sources, instruments, and channels that should count toward that goal remain ambiguous. As the Parties negotiate a new agreement for the post-2020 period, progress in meeting earlier climate finance commitments is needed to promote trust and confidence in a future climate regime.
This paper contributes to the dialogue about what types of finance could count toward the $100 billion goal. We analyze this question quantitatively by projecting vari-ous finance sources forward to 2020 to demonstrate the scenarios under which reaching the $100 billion goal is possible. Our analysis suggests that a combination of sources, coupled with increased public flows, will likely be needed to meet the $100 billion goal.
The Four ScenariosWe grouped finance sources that might count toward the $100 billion goal into four scenarios, taking care to remove any overlap among them:
Scenario 1 Developed country climate finance only, as contained in countries’ biennial reports to the UNFCCC Scenario 2 Developed country climate finance plus lever-aged private sector investment
2 |
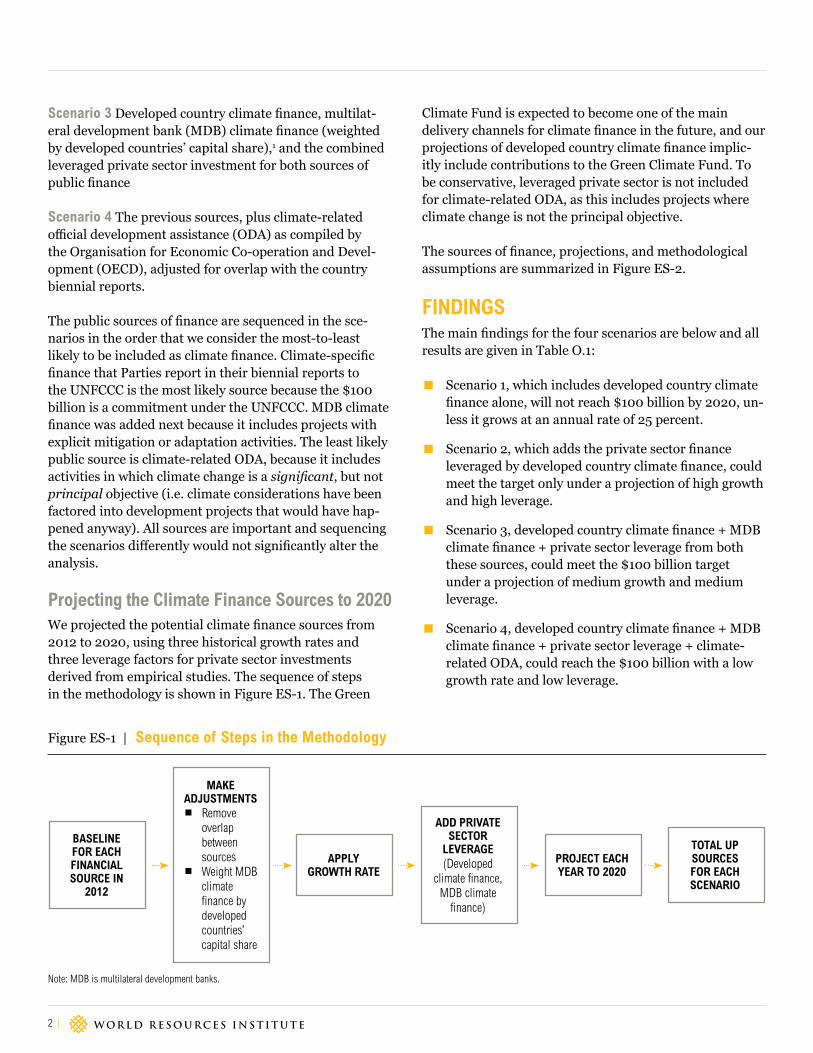
Figure ES-1 | Sequence of Steps in the Methodology
Scenario 3 Developed country climate finance, multilat-eral development bank (MDB) climate finance (weighted by developed countries’ capital share),1 and the combined leveraged private sector investment for both sources of public finance
Scenario 4 The previous sources, plus climate-related official development assistance (ODA) as compiled by the Organisation for Economic Co-operation and Devel-opment (OECD), adjusted for overlap with the country biennial reports.
The public sources of finance are sequenced in the sce-narios in the order that we consider the most-to-least likely to be included as climate finance. Climate-specific finance that Parties report in their biennial reports to the UNFCCC is the most likely source because the $100 billion is a commitment under the UNFCCC. MDB climate finance was added next because it includes projects with explicit mitigation or adaptation activities. The least likely public source is climate-related ODA, because it includes activities in which climate change is a significant, but not principal objective (i.e. climate considerations have been factored into development projects that would have hap-pened anyway). All sources are important and sequencing the scenarios differently would not significantly alter the analysis.
Projecting the Climate Finance Sources to 2020We projected the potential climate finance sources from 2012 to 2020, using three historical growth rates and three leverage factors for private sector investments derived from empirical studies. The sequence of steps in the methodology is shown in Figure ES-1. The Green
Climate Fund is expected to become one of the main delivery channels for climate finance in the future, and our projections of developed country climate finance implic-itly include contributions to the Green Climate Fund. To be conservative, leveraged private sector is not included for climate-related ODA, as this includes projects where climate change is not the principal objective.
The sources of finance, projections, and methodological assumptions are summarized in Figure ES-2.
FINDINGSThe main findings for the four scenarios are below and all results are given in Table O.1:
▪ Scenario 1, which includes developed country climate finance alone, will not reach $100 billion by 2020, un-less it grows at an annual rate of 25 percent.
▪ Scenario 2, which adds the private sector finance leveraged by developed country climate finance, could meet the target only under a projection of high growth and high leverage.
▪ Scenario 3, developed country climate finance + MDB climate finance + private sector leverage from both these sources, could meet the $100 billion target under a projection of medium growth and medium leverage.
▪ Scenario 4, developed country climate finance + MDB climate finance + private sector leverage + climate-related ODA, could reach the $100 billion with a low growth rate and low leverage.
BASELINE FOR EACH FINANCIAL SOURCE IN
2012
MAKE ADJUSTMENTS
▪ Remove overlap between sources
▪ Weight MDB climate finance by developed countries’ capital share
APPLY GROWTH RATE
ADD PRIVATE SECTOR
LEVERAGE(Developed
climate finance, MDB climate
finance)
PROJECT EACH YEAR TO 2020
TOTAL UP SOURCES FOR EACH SCENARIO
Note: MDB is multilateral development banks.

WORKING PAPER | May 2015 | 3
Getting to $100 Billion: Climate Finance Scenarios and Projections to 2020
Figure ES-2 | Four Types of Finance: Projections and Methodological Assumptions
Across the four scenarios, even if the $100 billion is reached, mitigation finance is projected to be much higher than adaptation finance. This is an important point because countries remain concerned about the lack of increase in adaptation finance.
We do not advocate for any specific scenario, but note that a combination of sources—such as leveraged private sector investment (but not all private sector investment), MDB climate finance, and climate-related ODA—will likely be needed to reach the $100 billion target. Many developing countries assign a greater weight to public flows, particu-larly grant-based finance. In contrast, some developed countries consider a larger set of climate finance sources
to be included in their commitments toward the $100 bil-lion goal. To reach agreement on what counts for the $100 billion, countries will have to find a middle ground. This is important not only to resolve accounting issues, but also to demonstrate progress in scaling up climate finance and to build confidence in a future climate regime.
Scenarios 3 and 4, in particular, represent a more expansive set of climate finance. However, this analysis assumes that all three public finance flows will steadily increase from 2012 to 2020. Under the low-growth projection, the increase in developed country climate finance is $10 billion in 2020 compared to 2012, while for (adjusted) MDB climate finance and (adjusted) climate-related ODA, the increase is $9 bil-
SOURCE: Biennial reports to the UNFCCC (Annex 2 Parties)
PROJECTIONS: Three growth rates projecting finance from 2012 to 2020
METHODOLOGICAL NOTES:
▪ Only climate-specific multi-lateral, bilateral and regional finance are included from the biennial reports.
▪ Mitigation and adaptation finance grow at the same rate for each scenario.
▪ The proportion of finance that is mitigation and adaptation in 2012 remains constant to 2020.
▪ The proportion of developed country climate finance counted as ODA in 2012 remains constant to 2020.
AMOUNT ($BILLION, 2012):
17
PROJECTIONS: Three leverage factors (multipliers) are used and applied to public invest-ment (developed country climate finance and MDB climate finance only) each year
METHODOLOGICAL NOTES:
▪ No distinction is made be-tween the concessionality of finance and leverage. Grant and non-grant finance are not treated separately.
▪ Leverage is not considered for climate-related ODA.
AMOUNT ($BILLION, 2012):
26 (low leverage)
42 (medium leverage)
SOURCE: Joint Report on MDB Climate Finance
PROJECTIONS: Three growth rates projecting finance from 2012 to 2020
METHODOLOGICAL NOTES:
▪ Only MDB climate finance from internal resources is included. It is then weighted by the capital share of developed countries (Annex 2 Parties) with contributions to EU countries removed.
▪ Mitigation and adaptation finance grow at the same rate for each scenario.
▪ The proportion of finance that is mitigation and adaptation in 2012 remains constant to 2020.
AMOUNT ($BILLION, 2012):
15
SOURCE: OECD DAC database
PROJECTIONS: Three growth rates projecting finance from 2012 to 2020
METHODOLOGICAL NOTES:
▪ Climate-related is adjusted by subtracting out each year the projected amount of developed country climate finance that is considered as ODA in order to remove double counting.
▪ Mitigation and adaptation finance grow at the same rate for each scenario.
▪ The proportion of finance that is mitigation and adaptation in 2012 remains constant to 2020.
AMOUNT ($BILLION, 2012):
10
DEVELOPED COUNTRY CLIMATE FINANCE
LEVERAGE PRIVATE SECTOR INVESTMENT
MDB CLIMATE FINANCE (ADJUSTED)
CLIMATE-RELATED ODA (ADJUSTED)
Note: UNFCCC is the UN Framework Convention on Climate Change. MDB is multilateral development banks. OECD DAC is the Organisation for Economic Co-operation and Development Assistance Committee. ODA is official development assistance.a. Projections of developed country climate finance implicitly include contributions to the Green Climate Fund, which is expected to become one of the main delivery channels for climate
finance in the future. b. To be conservative, leveraged private sector investment is not included for climate-related ODA, because it includes projects where climate change is not the principal objective.

4 |
Table ES-1 | Current and Projected Levels of Climate Finance Flows for the Four Scenarios
lion and $6 billion, respectively. This low growth rate is the historical growth rate of development assistance. Under the medium-growth projection, the increases are $14 billion, $13 billion, and $8 billion, respectively. For scenario 4, 62 percent of climate finance is projected to come from public sources under the low-growth projection, and 50 percent under the medium-growth projection.
It is possible that developed country climate finance could decline in the future in response to fiscal pressures and austerity measures, but the analysis does not factor in this possibility. In this event, the $100 billion target would not be met. However, even if developed country climate finance does not decline, there is room to question whether developed countries could increase their climate
finance as assumed by our growth rate projections. In this case, developed country climate finance might be supple-mented by new and innovative sources, such as the redi-rection of fossil fuel subsidies, carbon market revenues, financial transaction taxes, export credits, and debt relief.2 Many of these approaches have been used little, if at all, to mobilize climate finance.
The projected finance flows will be made possible through concerted public policy action, including creating the right enabling environments in developing countries, embrac-ing fiscal determination, and coordinating and engaging with the private sector. The Parties will need to exert par-ticular effort to increase adaptation finance to ensure that commitments to a balanced allocation between adaptation
Note: The high-growth, high-leverage projections are not shown for Scenarios 3 and 4.
SCENARIO AND FINANCE SOURCES PROJECTION 2012 2020
SCENARIO 1
Developed Country Climate Finance Low / Medium / High Growth 17 / 17 / 17 27 / 31 / 55
SCENARIO 2
Developed Country Climate Finance Low / Medium / High Growth 17 / 17 / 17 27 / 31 / 55
Leveraged Private Sector Investment Low / Medium / High Leverage 13 / 21 / 40 20 / 39 / 129
High-growth, high-leverage total 57 184
SCENARIO 3
Developed Country Climate Finance Low / Medium Growth 17 / 17 27 / 31
Multilateral Development Bank Climate Finance (adjusted)
Low / Medium Growth 15 / 15 24 / 28
Leveraged Private Sector Investment Low / Medium Leverage 26 / 42 42 / 78
Medium-growth, medium-leverage total 74 137
SCENARIO 4
Developed Country Climate Finance Low / Medium Growth 17 / 17 27 / 31
Multilateral Development Bank Climate Finance (adjusted)
Low / Medium Growth 15 / 15 24 / 28
Leveraged Private Sector Investment Low / Medium Leverage 26 / 42 42 / 78
Climate-related Official Development Assistance (adjusted)
Low / Medium Growth 10 / 10 16 / 18
Low-growth, low-leverage total 68 109
Medium-growth, medium-leverage total 84 155

WORKING PAPER | May 2015 | 5
Getting to $100 Billion: Climate Finance Scenarios and Projections to 2020
and mitigation finance are met.
We hope this work will contribute to a more robust COP decision on the Long-Term Finance work program, includ-ing detailed guidance on further work on accounting and the development of strengthened reporting guidelines.
INTRODUCTIONAt the 15th UNFCCC Conference of the Parties (COP 15) in Copenhagen in 2009, developed country Parties committed “to a goal of mobilizing jointly $100 billion dollars a year by 2020 to address the needs of developing countries.”3, 4 The Parties agreed this funding would come from a “wide vari-ety of sources, public and private, bilateral and multilateral, including alternative sources of finance.” One year later, the Parties endorsed the $100 billion goal at COP 16 in Can-cun,5 and the next year, at COP 17 in Durban, they estab-lished a work program to analyze options for scaling up the mobilization of climate finance.6 In 2012, COP 18 in Doha called on developed country Parties to identify pathways for mobilizing the scaling up of climate finance.7
While the $100 billion target has figured in climate finance discussions since 2009, questions remain about what constitutes climate finance and how it should be measured. First, there is no universally accepted definition of “climate finance.” Recently, based on its review of climate finance definitions, the UNFCCC’s Standing Committee on Finance pointed to a convergence: “Climate finance aims at reduc-ing emissions, and enhancing sinks of greenhouse gases and aims at reducing vulnerability of, and maintaining and increasing the resilience of, human and ecological systems to negative climate change impacts.”8 However, the Parties have not yet collectively endorsed this definition.
Second, the types of financial instruments that should be considered climate finance remains subject to debate. Many developing countries and nongovernmental orga-nizations (NGOs) argue that climate finance—especially adaptation finance—should be delivered primarily as grants. This accords with the view that climate finance should compensate developing countries for costs attrib-utable to developed countries’ historical greenhouse gas (GHG) emissions and thus should not be subject to repay-ment.9 However, during the “fast-start finance” period from 2010 to 2012, a number of contributor countries counted both concessional and nonconcessional loans, as well as capital contributions, guarantees, and insurance as climate finance.10
Third, there is no consensus on whether climate finance
should be measured based on gross or net flows. The United Nations Secretary-General’s High-level Advisory Group on Climate Change Financing (AGF) defines “gross” flows as the total amount of private finance, offset finance, and nonconcessional lending from multilateral develop-ment banks (MDBs). It defines “net” flows as the grant-equivalent transfers from developed countries and the net benefit to the developing countries for nonconcessional public and private flows. This net benefit is essentially the value of the lower return that investors are prepared to accept due to any risk mitigation that they receive through public or quasipublic support.11 Some have argued that only the “incremental” investment cost (i.e., the additional capital cost of low-carbon, more climate-resilient technol-ogies) should be included in climate finance totals, based on an interpretation of article 4 of the United Nations Framework Convention on Climate Change.12
Last, while developed countries pledged to provide $30 billion in new and additional finance during the fast-start finance period, debate continues about whether the $100 billion goal should be new and additional funding, and about how “new and additional” should be defined. Vari-ous proposed definitions have emerged, including only finance above 0.7 percent of a developed country’s gross national income, non-Official Development Assistance (ODA) climate finance, new and innovative sources, or money channeled through the Green Climate Fund.13, 14
Resolving the definitional issues around climate finance is beyond the scope of this paper. Rather, this paper aims to stimulate dialogue on the types of finance that might reasonably count toward the $100 billion a year goal. This paper takes stock of where climate finance stands and suggests conditions under which the developed countries could meet their 2020 commitment. While $100 billion is only a fraction of the finance needed to keep the average global temperature increase to 2°C,15 the $100 billion goal remains politically important as a sign of the Parties com-mitment to scaled-up, predictable, and adequate climate finance in the post-2020 period.
METHODOLOGYIn this paper, we examine an array of finance sources that could be counted toward the $100 billion, projecting them forward from 2012 to 2020, using reasonable historical growth rates and private sector leverage factors derived from empirical studies. We consider four scenarios for what might be counted toward the $100 billion grouped as follows:
6 |
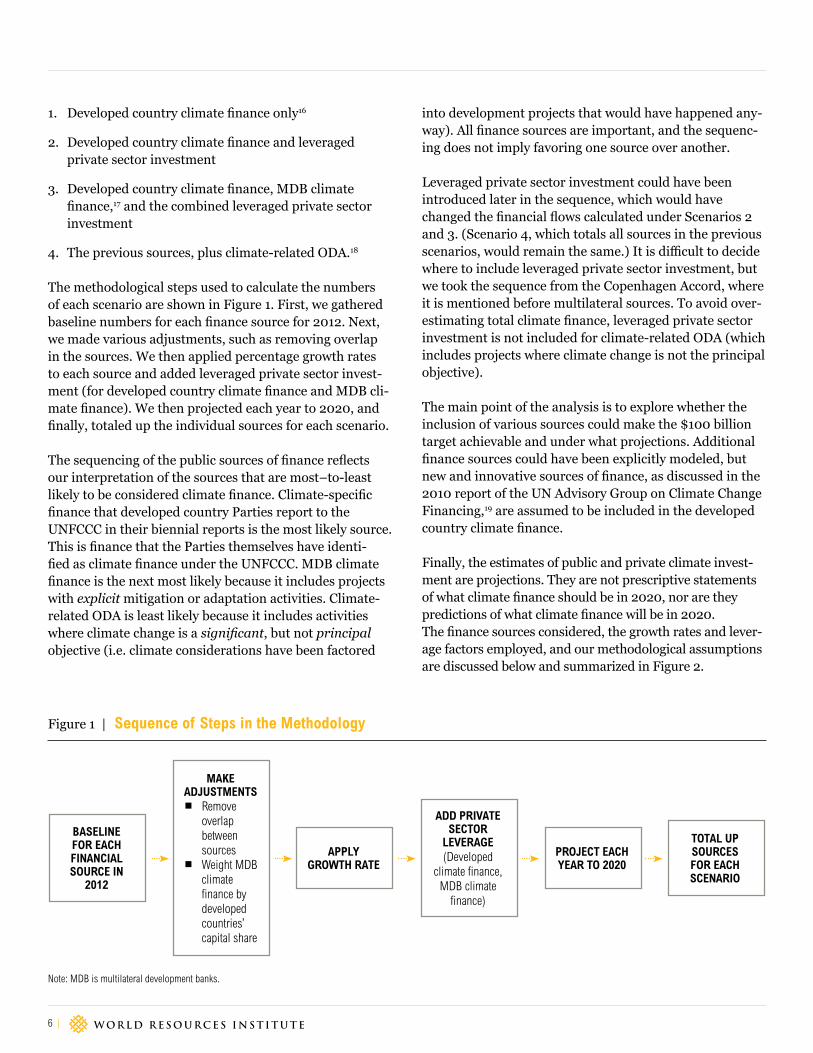
Figure 1 | Sequence of Steps in the Methodology
BASELINE FOR EACH FINANCIAL SOURCE IN
2012
MAKE ADJUSTMENTS
▪ Remove overlap between sources
▪ Weight MDB climate finance by developed countries’ capital share
APPLY GROWTH RATE
ADD PRIVATE SECTOR
LEVERAGE(Developed
climate finance, MDB climate
finance)
1. Developed country climate finance only16
2. Developed country climate finance and leveraged private sector investment
3. Developed country climate finance, MDB climate finance,17 and the combined leveraged private sector investment
4. The previous sources, plus climate-related ODA.18
The methodological steps used to calculate the numbers of each scenario are shown in Figure 1. First, we gathered baseline numbers for each finance source for 2012. Next, we made various adjustments, such as removing overlap in the sources. We then applied percentage growth rates to each source and added leveraged private sector invest-ment (for developed country climate finance and MDB cli-mate finance). We then projected each year to 2020, and finally, totaled up the individual sources for each scenario.
The sequencing of the public sources of finance reflects our interpretation of the sources that are most–to-least likely to be considered climate finance. Climate-specific finance that developed country Parties report to the UNFCCC in their biennial reports is the most likely source. This is finance that the Parties themselves have identi-fied as climate finance under the UNFCCC. MDB climate finance is the next most likely because it includes projects with explicit mitigation or adaptation activities. Climate-related ODA is least likely because it includes activities where climate change is a significant, but not principal objective (i.e. climate considerations have been factored
into development projects that would have happened any-way). All finance sources are important, and the sequenc-ing does not imply favoring one source over another.
Leveraged private sector investment could have been introduced later in the sequence, which would have changed the financial flows calculated under Scenarios 2 and 3. (Scenario 4, which totals all sources in the previous scenarios, would remain the same.) It is difficult to decide where to include leveraged private sector investment, but we took the sequence from the Copenhagen Accord, where it is mentioned before multilateral sources. To avoid over-estimating total climate finance, leveraged private sector investment is not included for climate-related ODA (which includes projects where climate change is not the principal objective).
The main point of the analysis is to explore whether the inclusion of various sources could make the $100 billion target achievable and under what projections. Additional finance sources could have been explicitly modeled, but new and innovative sources of finance, as discussed in the 2010 report of the UN Advisory Group on Climate Change Financing,19 are assumed to be included in the developed country climate finance.
Finally, the estimates of public and private climate invest-ment are projections. They are not prescriptive statements of what climate finance should be in 2020, nor are they predictions of what climate finance will be in 2020. The finance sources considered, the growth rates and lever-age factors employed, and our methodological assumptions are discussed below and summarized in Figure 2.
Note: MDB is multilateral development banks.
PROJECT EACH YEAR TO 2020
TOTAL UP SOURCES FOR EACH SCENARIO

WORKING PAPER | May 2015 | 7
Getting to $100 Billion: Climate Finance Scenarios and Projections to 2020
Figure 2 | Four Types of Finance: Projections and Methodological Assumptions
Scenario 1: Developed country climate financeThe current total level of developed country climate finance used in Scenario 1 is derived from developed coun-try (Annex II) Parties’ biennial reports to the UNFCCC,20 which include finance contributions to multilateral climate change funds and multilateral institutions, and contribu-tions through bilateral, regional, and other channels. For this analysis, only climate-specific contributions are included in the baseline, which totaled $17.1 billion in 2012 (see Appendix A). About $11.8 billion in 201221 was for core support to multilateral institutions, which includes non-climate activities. The OECD has calculated imputed multilateral contributions,22 but these core con-
tributions were excluded from the baseline for developed country climate finance because multilateral development bank climate finance is treated separately.
Of the total developed country climate finance, 69 percent was reported as ODA. Sixty-four percent of the developed country climate finance was provided for mitigation, fol-lowed by 18 percent for cross-cutting activities, 14 percent for adaptation, and 4 percent for projects listed as “other.” For this analysis, which only projects adaptation and mitigation finance to 2020, adaptation includes cross-cutting projects, while mitigation also includes finance in the “other” category.23
Note: UNFCCC is the UN Framework Convention on Climate Change. MDB is multilateral development banks. OECD DAC is the Organisation for Economic Co-operation and Development Assistance Committee. ODA is official development assistance.a. Projections of developed country climate finance implicitly include contributions to the Green Climate Fund, which is expected to become one of the main delivery channels for climate
finance in the future. b. To be conservative, leveraged private sector investment is not included for climate-related ODA, because it includes projects where climate change is not the principal objective.
SOURCE: Biennial reports to the UNFCCC (Annex 2 Parties)
PROJECTIONS: Three growth rates projecting finance from 2012 to 2020
METHODOLOGICAL NOTES:
▪ Only climate-specific multi-lateral, bilateral and regional finance are included from the biennial reports
▪ Mitigation and adaptation finance grow at the same rate for each scenario.
▪ The proportion of finance that is mitigation and adaptation in 2012 remains constant to 2020.
▪ The proportion of developed country climate finance counted as ODA in 2012 remains constant to 2020.
AMOUNT ($BILLION, 2012):
17
PROJECTIONS: Three leverage factors (multipliers) are used and applied to public invest-ment (developed country climate finance and MDB climate finance only) each year
METHODOLOGICAL NOTES:
▪ No distinction is made be-tween the concessionality of finance and leverage. Grant and non-grant finance are not treated separately.
▪ Leverage is not considered for climate-related ODA.
AMOUNT ($BILLION, 2012):
26 (low leverage)
42 (medium leverage)
SOURCE: Joint Report on MDB Climate Finance
PROJECTIONS: Three growth rates projecting finance from 2012 to 2020
METHODOLOGICAL NOTES:
▪ Only MDB climate finance from internal resources is included. It is then weighted by the capital share of developed countries (Annex 2 Parties) with contributions to EU countries removed.
▪ Mitigation and adaptation finance grow at the same rate for each scenario.
▪ The proportion of finance that is mitigation and adaptation in 2012 remains constant to 2020.
AMOUNT ($BILLION, 2012):
15
SOURCE: OECD DAC database
PROJECTIONS: Three growth rates projecting finance from 2012 to 2020
METHODOLOGICAL NOTES:
▪ Climate-related is adjusted by subtracting out each year the projected amount of developed country climate finance that is considered as ODA in order to remove double counting.
▪ Mitigation and adaptation finance grow at the same rate for each scenario.
▪ The proportion of finance that is mitigation and adaptation in 2012 remains constant to 2020.
AMOUNT ($BILLION, 2012):
10
DEVELOPED COUNTRY CLIMATE FINANCE
LEVERAGE PRIVATE SECTOR INVESTMENT
MDB CLIMATE FINANCE (ADJUSTED)
CLIMATE-RELATED ODA (ADJUSTED)

8 |
PROJECTION
COMPOUND ANNUAL GROWTH
RATE (CAGR) MITIGATION (PERCENT)
SOURCE/ ASSUMPTIONS
Low 6.0
Total official development assistance finance (CAGR 2003–12)
Medium 7.9Global Environment Facility funding (CAGR 1991–2013)
High 15.6
Organisation for Economic Co-operation and Development’s Development Assistance Committee mitigation finance (CAGR 2008–12)
Table 1 | Growth Rate Parameters UsedIt is difficult to accurately assess how much developed country climate finance is ultimately given as grants. While much of the developed countries’ contributions to multilateral climate change funds ($2.7 billion) are in the form of grants, these funds can later be disbursed as grants, concessional loans, or guarantees, as in the case of the Climate Investment Funds. Of the climate finance channeled through bilateral and regional channels, 43 percent was in the form of grants and 57 percent was nongrant finance (e.g. concessional and nonconcessional loans, guarantees, or insurance).
In projecting developed country climate finance, we considered three growth rates. The low-growth projection is the historical growth rate for total ODA (compound annual growth rate [CAGR] of 6.0 percent for 2003–12; see Table 1).24 The medium-growth rate projection is the CAGR of Global Environment Facility (GEF) funding from 1991–2013 (pilot phase through GEF-5), or 7.9 percent.25 The high-growth projection is based on data that the OECD tracks on activities by its Development Assistance Committee (DAC) countries targeting the objectives of the three 1992 Rio Conventions covering biodiversity, deserti-fication, and climate change mitigation (“Rio Markers”). OECD DAC countries increased climate change mitigation spending on average by 21 percent from 2002 to 2012, but there was high variance in spending, with decreases in a few years (not unexpected with commitment data). Thus, the rate of increase over the last five years (15.6 percent) is the rate for the high-growth projection.26 Although the high-growth projection represents a significant jump relative to the medium-growth projection, the OECD DAC numbers suggest that this projection is possible. The OECD has compiled estimates of adaptation finance for DAC countries for 2010–13, so the same growth rates are used for both mitigation and adaptation finance.
The growth rates considered here are not exhaustive of the range of possibilities: they are intended only as indicative possibilities based on recent evidence. We are not assert-ing that climate finance should, or will, grow at one of these rates. Nor are we suggesting that developed country climate finance will inevitably increase.
The Green Climate Fund is expected to become one of the main delivery channels for climate finance in the future, and our projections of developed country climate finance implicitly include contributions to the Green Climate Fund. To date, the announced pledges to the Green Climate Fund amount to about $10.2 billion for 2015 to 2018.27
Scenario 2: Developed country climate finance + private sector leverageScenario 2 includes both developed country climate finance and the private sector investment leveraged by these funds. For both mitigation and adaptation finance, we evaluated three projections for leveraged private sector investment. In generic financial terminology, “lever-age” refers to the ratio of debt to equity financing for an investment.28 The Overseas Development Institute defines leveraging in the climate finance context as the process by which private sector capital is mobilized as a conse-quence of the use of public sector finance and financial instruments.
Leverage is usually discussed in the context of leverage factors or ratios. There is no uniform methodology to cal-culate leverage ratios: they can be expressed as the ratio of total funding to public funding, the ratio of private fund-ing to public funding, or the ratio of specific public climate finance to broader public and private finance flows.29, 30
We define leverage as the total amount of private financ-ing that is mobilized per dollar of public or quasi-public support.31, 32
Leverage factors vary considerably across technologies, instruments, and geographies. For example, mitigation leverage factors tend to be higher for established technolo-gies and more capital-intensive projects, and lower for more nascent activities where informational barriers and
WORKING PAPER | May 2015 | 9
Getting to $100 Billion: Climate Finance Scenarios and Projections to 2020
other market perceptions may deter private sector finance. Nevertheless, in the interest of making the analysis trac-table, we used three leverage ratios for all developed-coun-try climate finance, regardless of instrument. Limiting the analysis to three leverage factors allowed us to provide a range of values without overwhelming the analysis with an unwieldy number of projections.
The data on leverage factors are not comprehensive, although there have been some limited assessments, mostly of mitigation projects. The multilateral funds, such as the Global Environment Facility and Climate Investment Funds (CIFs), report high leverage factors, but the factors include mobilized public finance as well. For example, the CIFs as a whole report a leverage factor of roughly 1:7.0 for the first cohort of projects (includ-ing leveraging of both public and private sources). The overall private sector co-leverage factor was 1:1.6; that is, each dollar of CIF investment leveraged $1.60 in private finance. In the CIF private sector projects and programs (almost exclusively the Clean Technology Fund), the private sector leverage factor was 1:3.4, while the leverage factor for the public sector projects was 1:1.1.33
Based on a review of 562 projects, the International Finance Corporation (IFC) has calculated average leverage factors of 4.1 and 4.934 for climate-related35 and renew-able energy investment; however, since the IFC defines leverage ratios as the total project cost to IFC’s portion of financing, each dollar of IFC finance leverages private investment of about $3.1 for climate-related and $3.9 for renewable energy projects.36 The CIF and IFC leverage factors are broadly consistent with the 2010 UN High Level Advisory Group on Climate Change Financing (AGF) report, which estimated that leverage in MDB nonconces-sional lending would be 1:2 to 1:5 on average.37
Data on private sector leverage for adaptation invest-ments are scarcer. Barriers to private sector engagement in adaptation, such as a lack of information on climate and weather risk, can be significant.38 Adaptation projects may have a difficult time attracting private sector invest-ment, because many provide public goods such as flood protection, climate and weather information, or agricul-ture extension services. Mitigation projects, such as clean energy or transportation, are likely to have more favorable risk-return profiles than adaptation projects. The Climate Investment Fund’s Pilot Program for Climate Resilience has not leveraged any private money to date, although there is projected private sector leverage for some projects in the pipeline.39
Based on the above estimates from the CIFs and IFC and taking a conservative approach, the three private sector leverage factors used for mitigation finance are 1.1, 1.6, and 3.0 (Table 2). We did not differentiate between lever-age from concessional and nonconcessional finance. Thus, the leverage factors may be considered low estimates. Concessional lending could have higher leverage factors: the AGF report states that grant funds can have lever-age factors between 1:8 and 1:10.40 Because there are no detailed, empirical estimates of how much private climate finance has actually been leveraged by public sources glob-ally across funds and institutions, using the above leverage factors is a cautious and reasonable approach. The lever-age factor for adaptation varies between 0 and 1 (Table 2). These factors used are simply assumptions, given the dearth of empirical data.
Of course, high leverage does not necessarily mean effec-tive climate finance. Indeed, it may be easiest to achieve high leverage ratios where public finance is least needed.41 For the GEF, leverage is poorly correlated with mitiga-tion efficiency (i.e. metric tons of CO2 abated per unit of dollar value), and for market mechanisms like the Clean Development Mechanism, there may even be a leverage paradox—projects with a high leverage factor but lower mitigation efficiency.42 For example, industrial gas and methane projects achieve high mitigation efficiency, but only low leverage factors. Maximizing leverage should not, therefore, be the sole guide for climate finance.
Scenario 3: Developed country climate finance + multilateral development bank climate finance + private sector leverageThe third possible scenario for reaching $100 billion adds multilateral development bank (MDB) climate finance to developed country climate finance as well as private sec-tor leverage for both these sources. Considering only the MDBs’ own resources, climate finance totaled $24.7 billion in 2012, including investments, technical assistance, and policy-based instruments.43 Because our calculations of developed country climate finance exclude core contribu-tions to MDBs, there is no overlap in our analysis between developed country climate finance and MDB climate finance. However, not all of this MDB climate finance can be attributed to developed countries; developing countries also fund the MDBs. Thus, we weighted the MDB finance by the developed countries’ capital share (Appendix B), minus the amount directed toward European Union

10 |
Table 2 | Private Sector Leverage Parameters Used
PROJECTION LEVERAGE FACTOR (MITIGATION) SOURCE/ ASSUMPTION LEVERAGE FACTOR
(ADAPTATION) SOURCE/ ASSUMPTION
Low 1.1Climate Investment Funds (CIF) public sector projects 0
Pilot Program for Climate Resilience
(CIF)
Medium 1.6 Total CIF projects 0.5
Reasonable assump-tion not based on
empirical data
High 3.0International Finance Corpora-
tion/Clean Technology Fund1.0
Reasonable assump-tion not based on
empirical data
countries (hereafter referred to as adjusted MDB climate finance). In 2012, the adjusted MDB climate finance totaled $15.3 billion, 80 percent of which was directed to mitigation, and 20 percent to adaptation. The OECD has a methodology for estimating the climate-related share of multilateral ODA contributions by DAC members in a given year, but it does not attempt to attribute back to donors their shares of the total outflow of MDB climate finance on the basis of historical contributions or the proportion of MDBs’ capital.44
For MDB climate finance, we used the same growth rates and leverage factors as for the developed country climate finance, and the proportion of mitigation and adaptation finance are assumed to stay constant until 2020.
Scenario 4: Developed country climate finance + multilateral development bank climate finance + private sector leverage + bilateral climate-related official development assistanceScenario 4 includes the sources of finance in the first three scenarios and adds bilateral climate-related official development assistance (ODA). Bilateral climate-related ODA totaled $21.5 billion in 2012.45 Of this, $15.6 billion was directed to mitigation, and $10.1 billion to adapta-tion. However $4.2 billion was double counted as both mitigation and adaptation.46, 47 This bilateral climate-related ODA excludes contributions to specific multilateral climate funds (e.g. Climate Investment Funds) and core contributions to multilateral institutions. It includes activities that target climate change as a principal objec-tive (i.e. the activity would not have happened were it not for climate change priorities) and activities where climate
change is a significant objective (i.e. climate change con-siderations have been factored into development projects that would have happened anyway). All ODA projects by definition have poverty reduction and development as their core focus. While developed countries include some climate-related ODA in their biennial reports as noted previously, the share that is counted varies widely. Most OECD countries surveyed report 100 percent of their climate-related ODA marked as principal to the UNFCCC. However, for climate-related ODA marked as significant, the countries reported between 0 and 100 percent among those surveyed.48
To avoid double-counting, the amount of developed coun-try climate finance each year that is projected to be ODA finance is subtracted from the climate-related ODA (the remainder is referred to as adjusted climate-related ODA finance). Short of calculating the adjusted portion for each individual party, this is the simplest calculation approach. However, it should be noted the biennial reports and the OECD DAC data are not always comparable. The biennial reports contain a mix of commitment and disbursement data, and country coverage sometimes differs from the DAC data.
In 2012, $11.7 billion, 69 percent of the total of developed-country climate finance, was reported as ODA, yielding $9.8 billion in adjusted climate-related ODA.49 It is assumed that the proportion of developed country climate finance reported as ODA remains constant. The growth rates used as for the developed country climate finance were also used here. Private sector leverage is not considered for climate-related ODA. The proportion of both mitigation and adaptation finance remains constant to 2020.

WORKING PAPER | May 2015 | 11
Getting to $100 Billion: Climate Finance Scenarios and Projections to 2020
Figure 3 | Scenario 1: No Projection Meets the $100 Billion Goal in 2020
Figure 4 | Scenario 2: Only the High-Growth, High-Leverage Projection Meets the $100 Billion Goal in 2020
Low-Growth, Low-Leverage
Medium-Growth, Medium-Leverage
High-Growth, High-Leverage
Year
Tota
l Fin
ance
($ b
illio
n)
0
10
20
30
40
50
60
2012 2013 2014 2015 2016 2017 2018 2019 2020
Low-Growth, Low-Leverage
Medium-Growth, Medium-Leverage
High-Growth, High-Leverage
20120
20
40
60
80
100
120
140
160
180
200
2013 2014 2015 2016
Year
Tota
l Fin
ance
($ b
illio
n)
2017 2018 2019 2020
Note: The lines start at multiple points in 2012 because of different projections for leveraged private sector finance.
PROJECTIONS TO 2020Rather than show the projections for every possible per-mutation of growth rate and leverage, we streamlined the presentation of results by showing three projections for Scenarios 1 and 2 and one projection for each of Scenarios 3 and 4.
For Scenario 1 (developed country climate finance without private sector leverage), the $100 billion target would not be met under any of the growth projections. Even under the high-growth projection, public developed country cli-mate finance would total only $55 billion in 2020 (Figure 3, Table 3). For Scenario 1 to reach $100 billion in 2020, a compound annual growth rate of 25 percent would be necessary. If public developed country climate finance declined from its 2012 level, the shortfall would be stark. In Scenario 2, which includes leveraged private sector investment, the $100 billion target is met only under the high-growth, high-leverage projection ($184 billion in 2020) (Figure 4). For the Scenario 2 low-growth projec-tion, the leverage factor would need to be 3.7 (compared with the high-leverage factor of 3) to reach $100 billion.
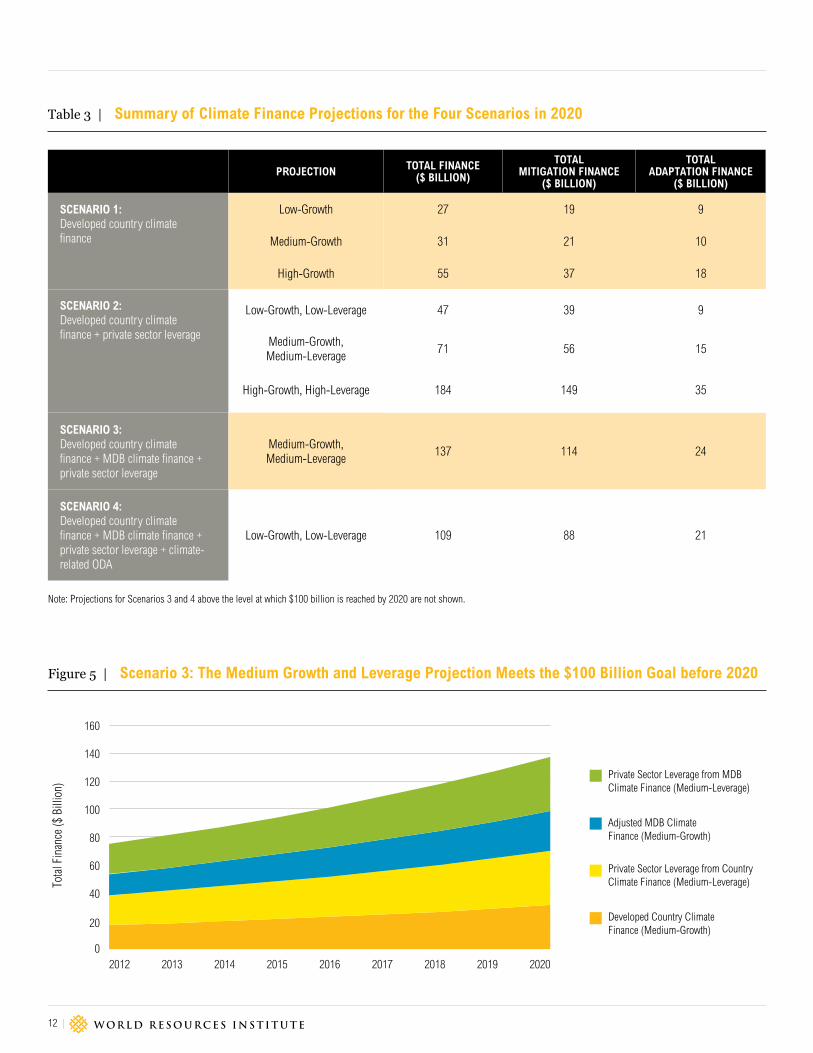
The results of Scenarios 3 and 4 are presented as “wedge diagrams” to better show the values for the constituent finance sources. Scenario 3, which includes developed country climate finance, (adjusted) MDB climate finance, and the private sector investment leveraged by both of these public sources, would allow for the $100 billion goal to be reached under the medium-growth, medium-leverage projection (Figure 5). Scenario 4 would exceed the $100 billion under the low-growth and low-leverage projection (Figure 6). The results of all scenario projec-tions are shown in Appendix C.
The Copenhagen Accord called for a “balanced allocation” between adaptation and mitigation.50 Debate on what this means continues, but across the scenarios, much more finance is projected for mitigation, particularly when leveraged private sector investment is included (see Table 3). Countries remain concerned about the lack of increase in adaptation finance.
12 |
Figure 5 | Scenario 3: The Medium Growth and Leverage Projection Meets the $100 Billion Goal before 2020
Table 3 | Summary of Climate Finance Projections for the Four Scenarios in 2020
PROJECTION TOTAL FINANCE ($ BILLION)
TOTAL MITIGATION FINANCE
($ BILLION)
TOTAL ADAPTATION FINANCE
($ BILLION)
SCENARIO 1: Developed country climate finance
Low-Growth 27 19 9
Medium-Growth 31 21 10
High-Growth 55 37 18
SCENARIO 2: Developed country climate finance + private sector leverage
Low-Growth, Low-Leverage 47 39 9
Medium-Growth, Medium-Leverage
71 56 15
High-Growth, High-Leverage 184 149 35
SCENARIO 3: Developed country climate finance + MDB climate finance + private sector leverage
Medium-Growth, Medium-Leverage
137 114 24
SCENARIO 4: Developed country climate finance + MDB climate finance + private sector leverage + climate-related ODA
Low-Growth, Low-Leverage 109 88 21
0
20
40
60
80
100
120
140
160
2012 2013 2014 2015 2016 2017 2018 2019 2020
Tota
l Fin
ance
($ B
illio
n)
Year
Private Sector Leverage from MDB Climate Finance (Medium-Leverage)
Adjusted MDB Climate Finance (Medium-Growth)
Private Sector Leverage from Country Climate Finance (Medium-Leverage)
Developed Country Climate Finance (Medium-Growth)
Note: Projections for Scenarios 3 and 4 above the level at which $100 billion is reached by 2020 are not shown.

WORKING PAPER | May 2015 | 13
Getting to $100 Billion: Climate Finance Scenarios and Projections to 2020
Figure 6 | Scenario 4: The Low-Growth, Low-Leverage Projection Meets the $100 Billion Goal by 2020
0
20
40
60
80
100
120
Private Sector Leverage from MDB Climate Finance (Low-Leverage)
Adjusted MDB Climate Finance (Low-Growth)
Private Sector Leverage from Country Climate Finance (Low-Leverage)
Developed Country Climate Finance (Low-Growth)
Adjusted Climate-related ODA (Low-Growth)
Tota
l Fin
ance
($ B
illio
n)
Year
2012 2013 2014 2015 2016 2017 2018 2019 2020
FINDING A MIDDLE GROUND TO REACH $100 BILLION Shedding light on the Parties’ progress toward meeting the $100 billion goal can help inform, but not replace, discussions of how to scale up climate finance particularly in the post-2020 climate finance regime. We have laid out several scenarios with different finance sources under dif-ferent projections of growth and leverage to suggest that sources of climate finance other than developed country finance will likely need to play a role in meeting the $100 billion goal, unless developed country finance grows at rates that we have not yet seen. Our projections show that including more finance sources will allow $100 billion to be reached at low-growth and leverage rates, but under every projection an increase in public finance is required for balance.
A country’s argument for what sources of finance should be counted toward the $100 billion goal may in part reflect its perspective. On the one hand, some developing coun-tries suggest that only developed country finance (or even only grant finance) should be counted. On the other hand, many developed countries suggest a more expansive set of climate finance sources. The question is whether countries can find a middle ground between increasing public devel-oped country climate finance to levels high enough to meet
the $100 billion goal without relying on other sources, and on counting other sources of finance in the push to reach $100 billion.
Our analysis suggests that the middle ground may lay in the consideration of additional sources—leveraged private sector investment (but not all private sector investment), MDB climate finance, and climate-related ODA—coupled with increasing public flows. In other words, more sources are counted toward the $100 billion, but the analysis assumes that all public flows are increas-ing to 2020. Under the lowest growth rate used, climate finance is growing only as fast as development assistance over the recent past. Under the low-growth projection (6 percent), developed country climate finance, (adjusted) MDB climate finance, and (adjusted) climate-related ODA increase per year by $10 billion, $9 billion, and $6 billion, respectively in 2020 compared with 2012. Under the medium growth projection, the increases are $14 billion, $13 billion, and $8 billion, respectively. Of course, if developed country climate finance declines because of fiscal pressures and austerity measures, the $100 billion target would not be met.
Additionally, there could be scope to increase developed country climate finance through new and innovative

14 |
sources, such as the redirection of fossil fuel subsidies, carbon market revenues, financial transaction taxes, export credits, and debt relief.51 The International Mon-etary Fund (IMF) has estimated that pre-tax fossil fuel subsidies for OECD countries totaled $13.3 billion in 2012,52, 53 while the OECD has estimated that budget-ary support and tax expenditures to fossil fuels totaled $76.4 billion in 2011 for its 34 member countries.54 While the G-20 has agreed “to phase out and rationalize over the medium term inefficient fossil fuel subsidies while providing targeted support for the poorest,”55 no specific timeframe has been announced. Currently, emissions trading schemes and carbon price schemes cover almost 6 gigatonnes of CO2 equivalent, or about 12 percent of the annual global GHG emissions.56 The three major devel-oped country emissions trading schemes—the European Union, California, and Québec—could bring in about $27 billion in revenues in 2020.57 In 2013, export credits contributed about $700 million to global climate finance flows, and their use could be expanded for climate finance. Debt swaps have not received as much attention as other sources, although the United States reported 0.5 percent and Italy reported 11 percent of their fast-start finance to be debt-for-nature swaps.58
In terms of the other public flows, there is likely scope for the MDBs to increase climate finance, without increased capital contributions. Although data are not available for all the MDBs, the World Bank Group, for example, com-mitted $11.3 billion to climate finance in 2014,59 which was about 20 percent of its total commitment during the fiscal year.60 Moreover, the increase in climate-related ODA would not have to come at the expense of total ODA or investments in health, education, social development, and governance. For example, funds for social sector spending in least developed countries should not be re-allocated to finance mitigation in middle income countries.
NEXT STEPS FOR PARTIESSeveral limitations in the available data underscore the need for robust and harmonized monitoring, reporting, and verification systems for climate and development finance. Transparency and accuracy in climate finance reporting are necessary to ensure that the ultimate goal of scaling up financial flows for climate action in develop-ing countries is sustained. This analysis was constrained by data limitations, such as the lack of consistency across the biennial reports, the MDBs, and the OECD on the definition of climate change mitigation and adaptation. Furthermore, the variable quality in the finance data in the biennial reports and inconsistencies in how much climate-related ODA is included in the biennial reports presented a challenge.
Parties should clarify the definition of climate finance and the development of methodologies, including those for calculating and attributing leveraged private sector invest-ment. This paper’s findings could feed into the Standing Committee on Finance’s recommendations to strengthen work on the definitional elements of climate finance for future reporting under the Convention; the Standing Com-mittee on Finance seeks to collaborate with other entities for technical work on operational definitions. As the delib-erations on how to count MDB climate finance and private sector leverage continues, the results of the analysis can complement recent efforts of the MDBs and International Development Finance Club to align their climate finance reporting. Similar efforts are underway to track and report on mobilized private climate finance through the OECD Research Collaborative.
This methodological work is important to the broader goal of scaling up climate finance to keep the average global temperature increase to 2°C. Public finance has a critical catalytic role to play in shifting the trillions to low carbon, climate-resilient investments.
We hope this work will contribute to a COP decision on a robust Long-Term Finance work program, including detailed guidance on further work on accounting and the development of strengthened reporting guidelines.

WORKING PAPER | May 2015 | 15
Getting to $100 Billion: Climate Finance Scenarios and Projections to 2020
Table A1 | Developed (Annex II) Country Climate Finance Contributions in 2012 (US$ millions)
MULTILATERAL BILATERAL/REGIONAL/OTHER CHANNELS
COUNTRY MITIGATION ADAPTATION CROSS-CUTTING OTHER MITIGATION ADAPTATION CROSS-
CUTTING OTHER GRANT FINANCE
NONGRANT FINANCE TOTAL
Australia 45.46 15.95 6.74 1.63 36.80 99.47 11.14 147.41 0.00 217.19
Austria 2.57 13.35 16.49 13.38 12.07 41.94 0.00 57.86
Belgium 0.49 9.18 20.04 1.93 3.43 1.48 0.00 4.91 0.00 36.54
Canada 114.27 29.79 199.77 9.07 80.55 4.97 94.59 0.00 438.42
Denmark 83.11 53.67 136.78 0.00 136.78
European Union 237.33 101.59 604.20 943.11 0.00 943.11
Finland 6.23 14.67 73.90 15.97 3.10 25.24 26.06 18.25 139.11
France 132.39 0.00 0.00 0.00 3,267.04 86.39 52.70 0.00 77.99 3,328.13 3,538.52
Germany 160.67 51.41 15.10 39.11 730.95 413.38 162.50 526.96 1,831.22 2.57 2,100.08
Greece 0.07 0.54 0.61 0.00 0.61
Iceland 2.40 4.27 0.74 2.18 0.11 3.04 0.00 9.71
Ireland 0.20 42.17 0.30 42.67 0.00 42.67
Italy 5.99 1.40 12.52 0.73 37.06 0.00 50.31 0.00 57.70
Japan 323.76 5.00 3,226.18 401.82 137.14 199.18 3,565.96 4,093.90
Luxembourg 1.41 3.66 3.27 0.00 14.20 25.94 0.00 0.00 40.15 0.00 48.49
Netherlands 1.59 108.77 110.22 58.74 77.78 246.74 0.00 357.09
New Zealand 20.86 5.86 10.44 37.16 0.00 37.16
Norway 0.00 0.00 337.72 0.00 46.79 4.36 462.08 0.00 513.23 0.00 850.95
Portugal 0.10 18.53 0.11 1.70 16.94 18.74
Spain 2.55 192.73 30.07 39.02 63.04 198.77 264.37
Sweden 46.01 47.28 12.89 34.19 149.68 159.55 343.42 0.00 449.60
Switzerland 2.11 1.07 19.67 80.65 71.79 152.44 0.00 175.28
United Kingdom 148.60 209.98 6.46 260.37 9.65 4.61 146.10 419.95 0.78 785.77
United States 324.78 53.70 69.91 1,496.61 339.52 813.30 1,022.84 2,284.52
Totals 6,230.96 8,154.24 17,084.18
Source: Compiled from countries’ biennial reports to the UNFCCC: http://unfccc.int/national_reports/biennial_reports_and_iar/submitted_biennial_reports/items/7550.php
APPENDIX A. DEVELOPED COUNTRY CLIMATE FINANCE CONTRIBUTIONS

16 |
APPENDIX B. MULTILATERAL DEVELOPMENT BANK CLIMATE FINANCE
Table B1 | Climate Finance from Seven Multilateral Development Banks, 2012
MULTILATERAL DEVELOPMENT BANK
CAPITAL SHARE DEVELOPED
COUNTRIES (OECD) (PERCENT)
CAPITAL SHARE DEVELOPING
COUNTRIES (NON-OECD) (PERCENT)
TOTAL MITIGATION FINANCE IN 2012A
(US$ MILLIONS)
TOTAL ADAPTATION FINANCE IN 2012B
(US$ MILLIONS)
TOTAL CLIMATE FINANCE IN 2012C
(US$ MILLIONS)
African Development Bankd 37.8 62.2 1,463 445 1,908
Asian Development Banke 64.6 35.4 2,001 821 2,822
European Bank for Recon-struction and Developmentf
91.0 9.0 2,812 188 3,000
European Investment Bank 100.0 0.0 3,484 179 3,663
Inter-American Development Bankg
59.8 40.2 1,619 139 1,758
International Finance Corporationh
71.0 29.0 1,552 0 1,552
World Bank (International Bank for Reconstruction and Development)i
63.3 36.7 6,168 3,813 9,982
Note: OECD is Organisation for Economic Co-operation and Development.a. Multilateral Development Banks, 2013, “Joint Report on MDB Climate Finance 2013.”b. Ibid.c. Unweighted by developed countries’ capital share.d. African Development Bank, 2015, “Distribution of Voting Power by Executive Director.” http://www.afdb.org/fileadmin/uploads/afdb/Documents/Boards-Documents/AfDB_Statement_of_
Voting_Power_as_at_31_January_2015.pdf. Capital share based on 2015 data.e. Asian Development Bank, 2012, “ADB Financial Profile 2012.” http://www10.iadb.org/intal/intalcdi/PE/2012/07776.pdf; Capital share based on 2011 data.f. European Bank for Reconstruction and Development, 2015, “Shareholders and Board of Governors.” http://www.ebrd.com/shareholders-and-board-of-governors.html. Capital share
based on 2015 data.g. Inter-American Development Bank, 2015, “Capital Stock and Voting Power.” http://www.iadb.org/en/about-us/capital-stock-and-voting-power,3166.html. Capital share based on 2015
data.h. International Finance Corporation, 2015, “World Bank Group Finances.” https://finances.worldbank.org/Shareholder-Equity/IFC-Subscriptions-and-Voting-Power/gsdw-avpz. Capital
share based on 2013 data.i. World Bank, 2015, “World Bank Group Finances.” https://finances.worldbank.org/Shareholder-Equity/IBRD-Statement-of-Subscriptions-to-Capital-Stock-a/rcx4-r7xj. Capital share
based on 2013 data.

WORKING PAPER | May 2015 | 17
Getting to $100 Billion: Climate Finance Scenarios and Projections to 2020
APPENDIX C. PROJECTED CLIMATE FINANCE FLOWS FOR THE FOUR SCENARIOS
Table C1 | Projected Climate Finance Flows for the Four Scenarios, 2012–20 (US$ billions)
Note: The high-growth, high-leverage projections are not shown for Scenarios 3 and 4.
SCENARIO AND FINANCE SOURCES PROJECTION 2012 2020
SCENARIO 1
Developed Country Climate Finance Low / Medium / High Growth 17 / 17 / 17 27 / 31 / 55
SCENARIO 2
Developed Country Climate Finance Low / Medium / High Growth 17 / 17 / 17 27 / 31 / 55
Leveraged Private Sector Investment Low / Medium / High Leverage 13 / 21 / 40 20 / 39 / 129
High-growth, high-leverage total 57 184
SCENARIO 3
Developed Country Climate Finance Low / Medium Growth 17 / 17 27 / 31
Multilateral Development Bank Climate Finance (adjusted)
Low / Medium Growth 15 / 15 24 / 28
Leveraged Private Sector Investment Low / Medium Leverage 26 / 42 42 / 78
Medium-growth, medium-leverage total 74 137
SCENARIO 4
Developed Country Climate Finance Low / Medium Growth 17 / 17 27 / 31
Multilateral Development Bank Climate Finance (adjusted)
Low / Medium Growth 15 / 15 24 / 28
Leveraged Private Sector Investment Low / Medium Leverage 26 / 42 42 / 78
Climate-related official development assistance (adjusted)
Low / Medium Growth 10 / 10 16 / 18
Low-growth, low-leverage total 68 109
Medium-growth, medium-leverage total 84 155
18 |
ENDNOTES
1. Finance contributions to European Union countries were subtracted.2. Cicero and Climate Policy Initiative, 2015, “Background Report on Long-
Term Finance for the G-7,” Draft.3. UNFCCC (United Nations Framework Convention on Climate Change),
2009. “Report of the Conference of the Parties on its Fifteenth Session, Held in Copenhagen from 7 to 19 December 2009,” Addendum, Part Two: Action taken by the Conference of the Parties at its Fifteenth Session, Bonn, Germany. http://unfccc.int/resource/docs/2009/cop15/eng/11a01.pdf.
4. Later agreed to at COP 16 in Cancun, Mexico. See: UNFCCC, 2011, “Report of the Conference of the Parties on its Sixteenth Session, held in Cancun from 29 November to 10 December 2010.” Addendum, “Action Taken by the Conference of the Parties at its Sixteenth Session.” http://unfccc.int/resource/docs/2010/cop16/eng/07a01.pdf
5. UNFCCC, 2011, “Report of the Conference of the Parties on Its Sixteenth Session, Held in Cancun from 29 November to 10 December 2010.” Addendum. “Action Taken by the Conference of the Parties at its Sixteenth Session.” http://unfccc.int/resource/docs/2010/cop16/eng/07a01.pdf
6. UNFCCC, 2012, “Report of the Conference of the Parties on its Seventeenth Session, Held in Durban from 28 November to 11 December 2011.” Addendum, Part Two, “Action Taken by the Conference of the Parties at its Seventeenth Session,” Bonn, Germany.
7. UNFCCC, 2013, “Report of the Conference of the Parties on its Eighteenth Session, Held in Doha from 26 November to 8 December 2012.” Addendum, Part Two, “Action Taken by the Conference of the Parties at its Eighteenth Session,” Bonn, Germany.
8. UNFCCC Standing Committee on Finance, 2014, “Biennial Assessment and Overview of Climate Finance Flows Report 2014.” Bonn, Germany.
9. L. Schalatek, 2010, “A Matter of Principle(S): A Normative Framework for a Global Compact on Public Climate Finance.” Heinrich Böll Stiftung North America, Washington, DC.http://www.boell.de/downloads/ecology/Schalatek_Matter_of_Principle_NOV2010.pdf).
10. T. Fransen, S. Nakhooda, T. Kuramochi, A. Caravani, A. Prizzon, N. Shimizu, H. Tilley, A. Halimanjaya, and B. Welham, 2013, “Mobilising International Climate Finance: Lessons from the Fast-Start Finance Period.” Overseas Development Institute, World Resources Institute, Institute for Global Environmental Strategies, Open Climate Network. London, UK, Washington, DC, Tokyo, Japan. http://www.odi.org.uk/publications/7987-mobilising-international-climate-finance-lessons-fast-start-finance-period
11. High Level Advisory Group on Climate Change Financing, 2010, “Report of the Secretary-General’s High-level Advisory Group on Climate Change Financing.” United Nations, New York. http://www.un.org/wcm/webdav/site/climatechange/shared/Documents/AGF_reports/AGF_Final_Report.pdf; World Bank, 2011, “Mobilizing Climate Finance.”: Paper prepared at the request of G20 Finance Ministers. Washington, DC. http://www.imf.org/external/np/g20/pdf/110411c.pdf
12. The developed countries agreed to provide financial resources needed by the developing countries to meet the agreed full incremental costs of implementing measures under the Convention. UNFCCC, 1992, “United Nations Framework Convention on Climate Change.” Bonn, Germany.
13. J. Brown, N. Bird, and L. Schalatek, 2010, “Climate Finance Additionality: Emerging Definitions and their Implications.” Climate Finance Policy Briefs 2. Overseas Development Institute, London. http://www.odi.org.uk/sites/odi.org.uk/files/odi-assets/publications-opinion-files/6032.pdf; M.J. Stadelmann, T.J. Roberts and S. Huq, 2010, “Baseline for Trust: Defining ‘New and Additional’ Climate Funding.” IIED Briefing Papers. International Institute for Environment and Development (IIED), London. http://pubs.iied.org/pdfs/17080IIED.pdfhttp://pubs.iied.org/pdfs/17080IIED.pdf.
14. During the fast-start finance period, most of the reported finance was not new and additional according to a number of criteria: (1) Climate-related spending was higher during the fast-start finance period than before; (2) Climate-related projects and programs received more funding than prior to the fast-start finance period, (3) fast-start finance included contributions to meet pledges made prior to the fast-start finance period, (4) Country has already met the Monterrey commitments to deliver 0.7 percent of gross national income as ODA, (4) New sources of finance have been mobilized to address climate change. T. Fransen, S. Nakhooda, T. Kuramochi, A. Caravani, A. Prizzon, A., N. Shimizu, H. Tilley, A. Halimanjaya, A. and B. Welham, 2013, “Mobilising International Climate Finance: Lessons from the Fast-Start Finance Period.” Overseas Development Institute, World Resources Institute, Institute for Global Environmental Strategies, Open Climate Network. London, UK, Washington, DC, Tokyo, Japan. http://www.odi.org.uk/publications/7987-mobilising-international-climate-finance-lessons-fast-start-finance-period
15. It estimated that $4.5 billion in incremental investment is needed over the next 15 years just for low carbon infrastructure. Global Commission on the Economy and Climate, 2014, “New Climate Economy Technical Note: Infrastructure Investment Needs of a Low-Carbon Scenario.” Washington, DC
16. This refers to public finance only.17. Weighted by the developed countries’ capital share, as explained later.18. Adjusted for overlap with developed country climate finance, as explained
later.19. United Nations, 2010, “Report of the Secretary-General’s High-level
Advisory Group on Climate Change Financing.” 20. http://unfccc.int/national_reports/biennial_reports_and_iar/submitted_
biennial_reports/items/7550.php21. WRI analysis.22. OECD (Organisation for Economic Co-operation and Development), 2014,
“Climate-Related Development Finance in 2013: Improving the Statistical Picture.” Paris, France. http://www.oecd.org/dac/environment-development/Climate-related%20development%20finance%20FINAL.pdf.
23. Four countries—Germany, New Zealand, Ireland, and the United Kingdom—designated projects as “other.” Most of the large projects by dollar value (Germany, United Kingdom) were related to REDD.
24. OECD Statistics. http://stats.oecd.org/ (accessed November 23, 2014).25. Global Environment Facility, 2013, “GEF-6 Replenishment: Overview of the
Financial Structure.” Prepared by the Trustee. Washington, DC. http://www.thegef.org/gef/GEF6-Replenishment/overview-financial-structure
26. OECD Statistics. http://stats.oecd.org/ (accessed November 23, 2014).27. Green Climate Fund Initial Resource Mobilization Pledges as of 31
December 2014. http://news.gcfund.org/wp-content/uploads/2015/02/pledges_GCF_dec14.pdf.
28. J. Brown, B. Buchner, G. Wagner, K. Sierra, 2011, “Improving the Effectiveness of Climate Finance: A Survey of Leveraging Methodologies.” Overseas Development Institute, Climate Policy Initiative, Environmental Defense Fund, Brookings Institute. London, Venice, New York, Washington, DC. http://www.edf.org/sites/default/files/effectiveness-%20climate-finance-leveraging-methodologies.pdf.
29. J. Brown, and M. Jacobs, 2011, “Leveraging Private Investment: The Role of Public Sector Climate Finance.” Overseas Development Institute, London. http://www.odi.org.uk/publications/5701-climate-finance-private-investment-public-sector-climate-change.
WORKING PAPER | May 2015 | 19
Getting to $100 Billion: Climate Finance Scenarios and Projections to 2020
30. The term “leverage” is often used interchangeably with “mobilization.” Some have sought to differentiate the two terms, using leverage in the context of discrete financial instruments, while mobilization is the provision of climate finance for developing countries through the use of finance and other interventions by developed countries. Like leverage, what is considered mobilized climate finance varies across institutions and their funds. Methodologies differ in how causality and attribution are measured and whether public and private sources are included and disentangled. See R. Caruso and J. Ellis, 2013, “Comparing Definitions and Methods to Estimate Mobilised Climate Finance.” Organisation for Economic Co-operation and Development. Paris. http://www.oecd-ilibrary.org/environment/comparing-definitions-and-methods-to-estimate-mobilised-climate-finance_5k44wj0s6fq2-en; R. Jachnik, R. Caruso, and A. Srivastava, 2015, “Estimating Mobilised Private Climate Finance: Methodological Approaches, Options and Trade-Offs,” OECD Environment Working Paper No. 83, OECD Publishing. http://dx.doi.org/10.1787/5js4x001rqf8-en.
31. Note that this includes any private contribution to investment, not just where the private sector is majority owner.
32. S. Patel, 2010, “Climate Finance: Engaging the Private Sector.” International Finance Corporation. Background paper for the World Bank; MDB (Multilateral Development Bank) Working Group on Climate Finance 2011, “Mobilizing Climate Finance.” Paper prepared at the request of G20 Finance Ministers. http://www.ifc.org/wps/wcm/connect/topics_ext_content/ifc_external_corporate_site/cb_home/publications/publication_climatefinance
33. M. Michele de Nevers, 2014, “Assessing “Leverage” in the Climate Investment Funds.” Climate Investment Funds, Washington, DC. https://www.climateinvestmentfunds.org/cif/sites/climateinvestmentfunds.org/files/Assessing_leverage_in_the_CIF.pdf.
34. Simple average across projects of the climate portion of investment. 35. The IFC now uses three broad categories to define climate-related
investment: mitigation, adaptation, and special climate. Prior to FY2013, activities were classified as renewable energy, energy efficiency or “other” climate.
36. S. Patel and R. Music, 2013, “Leverage in IFC’s Climate-Related Investments: A Review of 9 Years of Investment Activity (Fiscal Years 2005-2013).” International Finance Corporation. Washington, DC. http://www.ifc.org/wps/wcm/connect/topics_ext_content/ifc_external_corporate_site/cb_home/publications/publication_leverage_ifc_climate_investments.
37. United Nations, 2010, “Report of the Secretary-General’s High-level Advisory Group on Climate Change Financing.”
38. Pieter Terpstra and Lisa Dougherty-Choux, 2015, “Adaptation at the Bottom of the Pyramid: Catalyzing Small Business Engagement in Climate Change Adaptation.” World Resources Institute, Washington, DC.
39. de Nevers 2014, “Assessing Leverage in the Climate Investment Funds.”40. United Nations, 2010, “Report of the Secretary-General’s High-level
Advisory Group on Climate Change Financing”; J. Brown, B. Buchner, G. Wagner, K. Sierra, 2011, “Improving the Effectiveness of Climate Finance: A Survey of Leveraging Methodologies” Climate Policy Initiative, Overseas Development Institute, Brookings Institution, Washington, DC.
41. UNFCCC Standing Committee on Finance, 2014, “Biennial Assessment and Overview of Climate Finance Flows Report 2014.”
42. M. Stadelmann, P. Castro, A. Michaelowa, 2011, “Is There a Leverage Paradox in Climate Finance? Efficiency of the CDM and the GEF in Leveraging Funds and Reducing CO2.” Climate Strategies Working Paper, Climate Strategies, Cambridge, United Kingdom.
43. Multilateral Development Banks, 2013, “Joint Report on MDB Climate Finance, 2013.” http://www.eib.org/projects/documents/joint-report-on-mdb-climate-finance-2013.htm and “Joint Report on MDB Climate Finance 2012.” http://www.ebrd.com/downloads/sector/sei/climate-finance-2012.pdf.
44. OECD, 2014, “Treatment of “Green” Multilateral Flows in DAC Statistics and Status of Reporting.” Paris.
45. OECD, http://stats.oecd.org/Index.aspx?DataSetCode=RIOMARKERS (accessed November 2014).
46. OECD, 2014, “OECD DAC Statistics Climate-Related Aid.” http://www.oecd.org/dac/environment-development/Climate-related%20aid%20Flyer%20-%20May%202014%20final.pdf.
47. Going forward, the proportion of climate-related ODA that is adaptation includes this cross-cutting amount.
48. OECD, 2015, “Draft Stock Take Report on Members’ Reporting Practices on Environment-Related Official Development Finance and Reporting against International Obligations.” Draft Report. Paris.
49. $21.5 billion (climate-related ODA) minus $11.7 billion (developed country climate finance reported as ODA) yields $9.8 billion.
50. UNFCCC (United Nations Framework Convention on Climate Change), 2009. “Report of the Conference of the Parties on its Fifteenth Session, Held in Copenhagen from 7 to 19 December 2009,” Addendum, Part Two: Action taken by the Conference of the Parties at its Fifteenth Session, Bonn, Germany. http://unfccc.int/resource/docs/2009/cop15/eng/11a01.pdf.
51. Cicero and Climate Policy Initiative, 2015, “Background Report on Long-Term Finance for the G-7.” Draft.
52. IMF (International Monetary Fund), 2013, “Energy Subsidy Reform: Lessons and Implications.” IMF, Washington,D.C. The Overseas Development Institute provided the data and converted it based on IMF GDP figures. (Shelagh Whitley, Overseas Development Institute, personal communication)
53. Pre-tax subsidies include: consumer subsidies for gasoline, diesel, and kerosene (for 172 countries) using the price-gap approach, consumer natural gas and coal subsidies (for 56 countries) using the price-gap approach; and producer subsidies for coal (for 16 OECD countries). The price-gap approach refers to calculating the difference paid by consumers or received by producers relative to a benchmark price, in this case the international market price. Post-tax subsidies are much higher and include: pre-tax subsidies, tax breaks for fossil fuels, and externalities such as the costs of climate change, local pollution, and traffic congestion.
54. OECD, 2012, “Inventory of Estimated Budgetary Support and Tax Expenditures for Fossil Fuels 2013.” Paris. Individual country data obtained from http://www.oecd.org/site/tadffss/ (accessed November 2014).
55. G-20, 2009, “Leader’s Statement. The Pittsburgh Summit, September 24 – 25, 2009.” http://www.treasury.gov/resource-center/international/g7-g20/Documents/pittsburgh_summit_leaders_statement_250909.pdf.
56. World Bank, 2014, “State and Trends of Carbon Pricing.” Washington, DC.57. California Legislative Analyst’s Office, 2014, “The 2014-15 Budget: Cap-
And-Trade Auction Revenue and Expenditure Plan.” http://www.lao.ca.gov/reports/2014/budget/cap-and-trade/auction-revenue-expenditure-022414.pdf; European Commission, 2011, “Scaling Up International Climate Finance after 2012.” Commission staff working document [SEC(2011) 487]. http://ec.europa.eu/economy_finance/articles/financial_operations/pdf/sec_2011_487_final_en.pdf; Finances Québec, 2012, “Québec and Climate Change: A Greener Environment.” http:// http://www.budget.finances.gouv.qc.ca/Budget/2012-2013/en/documents/climate.pdf.
58. Ibid.59. World Bank, 2014, “World Bank Group Climate Lending Grows to Over $11
Billion.” http://www.worldbank.org/en/news/feature/2014/09/09/world-bank-group-climate-lending-grows-11-billion-fy14
60. World Bank, 2014, “Annual Report.” http://www.worldbank.org/en/about/annual-report.
´

ABOUT WRI World Resources Institute is a global research organization that turns big ideas into action at the nexus of environment, economic opportunity and human well-being.
Our ChallengeNatural resources are at the foundation of economic opportunity and human well-being. But today, we are depleting Earth’s resources at rates that are not sustainable, endangering economies and people’s lives. People depend on clean water, fertile land, healthy forests, and a stable climate. Livable cities and clean energy are essential for a sustainable planet. We must address these urgent, global challenges this decade.
Our VisionWe envision an equitable and prosperous planet driven by the wise manage-ment of natural resources. We aspire to create a world where the actions of government, business, and communities combine to eliminate poverty and sustain the natural environment for all people.
Our ApproachCOUNT ITWe start with data. We conduct independent research and draw on the latest technology to develop new insights and recommendations. Our rigorous analysis identifies risks, unveils opportunities, and informs smart strategies. We focus our efforts on influential and emerging economies where the future of sustainability will be determined.
CHANGE ITWe use our research to influence government policies, business strategies, and civil society action. We test projects with communities, companies, and government agencies to build a strong evidence base. Then, we work with partners to deliver change on the ground that alleviates poverty and strength-ens society. We hold ourselves accountable to ensure our outcomes will be bold and enduring.
SCALE ITWe don’t think small. Once tested, we work with partners to adopt and expand our efforts regionally and globally. We engage with decision-makers to carry out our ideas and elevate our impact. We measure success through government and business actions that improve people’s lives and sustain a healthy environment.
ABOUT THE AUTHORSMichael I. Westphal is Senior Associate of the WRI’s Sustainable Finance Program. He is working on a number of research and analysis projects related to international climate finance policy and the UNFCCC negotiations, transformational climate finance, tracking green finance, and cities and urban infrastructure finance.
Contact: [email protected]
Pascal Canfin is a Senior Advisor for International Climate Affairs. He contributes to the Institute’s work to secure an effective and ambitious inter-national climate agreement. In addition, he focuses on the development of creative solutions to the challenging issues that countries will be addressing in the lead-up to the UNFCCC climate negotiations in Paris in 2015. Pascal was previously the Minister for Development in the French Ministry of Foreign Affairs.
Contact: [email protected]
Athena Ballesteros is a Director at WRI’s Sustainable Finance Center, which aims to shift the world’s financial flows to support sustainable development by engaging the public and private sectors to scale up investments in low-carbon, socially beneficial projects—particularly in the developing world. She is a long-time policy advisor to the Philippine government’s official climate change negotiating team at the UN Framework Convention on Climate Change (UNFCCC) and has assisted various Philippine ministries on climate, energy and finance issues at key international sessions.
Contact: [email protected]
Jennifer Morgan is the Global Director of the Climate Program at the World Resources Institute. In this capacity, she oversees the Institute’s work on climate change issues and guides WRI strategy in helping countries, govern-ments, and individuals take positive action toward achieving a zero-carbon future. She is responsible for day-to-day management of the 50+ person program, and under her leadership, the program is in the process of deepen-ing its engagement in China, India and Brazil. In addition, Jennifer is WRI’s lead representative at international climate meetings, including the UNFCCC negotiations.
Contact: [email protected]
Copyright 2015 World Resources Institute. This work is licensed under the Creative Commons Attribution 4.0 International License. To view a copy of the license, visit http://creativecommons.org/licenses/by/4.0/
10 G Street, NE | Washington, DC 20002 | www.WRI.org
ACKNOWLEDGMENTSThe authors would like to thank the following individuals for their valuable insights and critical reviews of this work: Manish Bapna, Charlotte Cristofari, Jan Corfee-Morlot, Taryn Fransen, Smita Nakhooda, Stephanie Ockenden, Shilpa Patel, Pieter Terpstra, Dennis Tirpak, Joe Thwaites, and several anony-mous reviewers.
The authors would also like to thank Emily Matthews for copyediting and proofreading. In addition, we thank Carni Klirs, Julie Moretti, and Hyacinth Billings for publication layout and design. Funding for this project was provided by the Charles Stewart Mott Foundation, the Rockefeller Brothers Fund, and an anonymous foundation. While our reviewers were very generous with their time and advice, this working paper represents the views of the authors alone.