perspectives on climate-related scenarios
TRANSCRIPT

JUNE 2021
Perspectives on Climate-Related ScenariosRisks and Opportunities

Glossary of termsbarrel: 42 U.S. gallons — a common volume measure for crude oil and petroleum productsbarrel of oil equivalent or boe: A unit of energy based on the energy released by burning one barrel of crude oil or 5.8 million British thermal unitsbcm: Billion cubic meters (a measure of natural gas volume)bpcd: Barrels per calendar day — the average of how much crude oil or other feedstock a refinery processes over a period of time, divided by the number of days in that period, typically 365 days (a common rate measure for petroleum refineries)bpd: Barrels per day — a common rate measure for crude oil and petroleum productsCDP: formerly known as the Carbon Disclosure Project, CDP is a not-for-profit charity that runs a global disclosure system for investors, companies, cities, states and regions to report environmental dataCO2e: Carbon dioxide equivalent — a common unit of measurement converting all greenhouse gases to carbon dioxide. MPC calculates CO2e emissions using the EPA factors identified in Table A-1 at 40 CFR Part 98.EII®: Energy Intensity Index, a measure proprietary to energy consulting firm HSB Solomon Associates LLCEPA: The U.S. Environmental Protection AgencyERM: Enterprise Risk ManagementESG: Environmental, social, and governanceGHGs: Greenhouse gases, such as carbon dioxide and methaneIEA: International Energy AgencyIEA’s CPS: Current Policies ScenarioIEA’s SDS: Sustainable Development ScenarioLNG: Liquefied natural gasLPG: Liquefied petroleum gasesTonne or metric ton: 2,205 poundsMPC: Marathon Petroleum CorporationMPLX: MPLX is a diversified, large-cap master limited partnership formed by Marathon Petroleum Corporation (MPC) that owns and operates midstream energy infrastructure and logistics assets, and provides fuels distribution servicesNGL: Natural gas liquid — a light hydrocarbon liquid often produced with natural gasOEMS: MPC’s Operational Excellence Management System to manage environmental, health and safety risksRenewable diesel: a hydrocarbon diesel fuel produced by hydroprocessing of fats, vegetable oils, and waste cooking oilsRenewable fuel: liquid fuel derived from biomass and waste feedstocks and include ethanol, biogasoline, sustainable aviation fuel, biodiesel and renewable dieselScope 1 Emissions: All direct GHG emissions by a company, including fuel combustion, company vehicles and fugitive emissions Scope 2 Emissions: Indirect GHG emissions from consumption of purchased electricity, heat or steamScope 3 Emissions: Other indirect GHG emissions that occur in a company's value chain that are not captured by Scope 2TCFD: Task Force on Climate-related Financial Disclosures, formed by the Financial Stability Board (an international body that monitors and makes recommendations about the global financial system)
On the cover: Sherwood natural gas processing plant in Doddridge County, West Virginia -- the largest gas processing plant in the U.S.
Table of Contents01 Letter from the President and CEO
02 MPC and MPLX Operations
03 Introduction
05 Business Planning and Capital Allocation06 Market-Based Carbon Programs07 Scope 3 Emissions
09 Climate Scenario Planning
11 Midstream19 Refining and Marketing25 Renewable Fuels
29 Managing Physical Risks to Our Facilities
32 Governance
35 Metrics and Targets
38 TCFD Recommendation Index

From The President and Chief Executive Officer
Michael J. Hennigan President and CEO
At MPC and MPLX, we’re challenging ourselves to be a leader in sustainable energy – to meet the needs of today while investing in an energy-diverse future. We are pleased to present our fifth annual Perspectives on Climate-Related Scenarios report, an important part of our commitment to transparency and our engagement toward collaborative solutions.
As global, national and local initiatives to address climate change progress, we are engaging with many stakeholders, including federal, state and local governments, investors, business partners, and communities across our operational footprint.
Our world is dynamic, and the energy mix that enables human prosperity is evolving. The International Energy Agency (IEA) forecasts an important role for traditional energy sources for years to come; it also projects that inherently lower-carbon natural gas and renewable fuels will comprise a growing portion of the global energy mix. MPC and MPLX are well positioned to meet the needs of this energy evolution.
As part of our challenge to be a leader in sustainable energy, we have set various targets to improve GHG performance. MPC and MPLX are aiming to reduce Scope 1 and 2 GHG emissions intensity 30% below 2014 levels by 2030 – a metric linked to compensation – and MPLX aims to reduce gathering and processing methane emissions intensity 50% below 2016 levels by 2025. This is just the beginning, and we commit to update and expand targets as new opportunities and technologies unfold.
This year we have included an estimate of the Scope 3 emissions from the products we process and market to the consuming public. We also plan to provide such information in our report to the CDP so that investors and stakeholders have an additional avenue to access our data.
We have accelerated our pace toward lowering carbon intensity and strengthening resiliency. Over the last year we ceased crude processing at three of our refineries, one of these has been converted to a renewable diesel facility and another is in the process of being converted. We continue to expand our MPLX natural gas gathering and processing operations helping to facilitate the transitional step of eliminating coal from the utility and industrial sectors while also offering lower-carbon feedstocks into the petrochemical sector. In addition, we continue to focus on our efficiency, and for the second straight year, we have been recognized by the U.S. Environmental Protection Agency with the ENERGY STAR® Partner of the Year – Sustained Excellence Award – the only company with fuels manufacturing as its primary business to earn this recognition. These actions have lowered the carbon intensity of our company operations and the products we offer to the consumer.
Our progress is enabled by strong governance and dynamic enterprise risk management. MPC’s board is engaged on climate issues and qualified to steer our evolution to meet the needs of a changing market. We adjust our climate scenarios annually to maintain consistency with the latest IEA projections, including the Sustainable Development Scenario and the IEA’s new Net Zero Emissions by 2050 case, which
will require global reductions by all sectors. We again retained HSB Solomon Associates LLC to thoroughly evaluate our resiliency against these scenarios, with attention to risks and opportunities across key business components: refining and marketing, midstream and renewables.
Thank you for your interest in MPC and MPLX. I encourage you to read on to learn more about how we’re working to meet society’s needs today while investing in an energy-diverse future.
2021 Perspectives on Climate-Related Scenarios | 01

®
Illustrative representation of asset map as of 5/12/21
(a) Includes MPC/MPLX owned and operated lines, MPC/MPLX interest lines operated by others and MPC/MPLX operated lines owned by others.(b) Includes MPLX owned and operated natural gas processing complexes.(c) Wholly owned subsidiary of MPC working to commercialize the conversion of biobased feedstocks into renewable fuels and chemicals.
MPC Refinery
MPC Owned Light Product Terminal
MPC Owned Asphalt/ Heavy Oil Terminal
MPC Owned and Part-Owned Marine Facility
MPC/MPLX Pipeline (a)
Cavern
MPC Domestic Marketing Area
MPC International Marketing Area
Ethanol Facility
MPC Biodiesel Facility
Virent (c)
MPC Renewable Diesel Facility
Martinez Renewable Fuels Project
MPC AND MPLX OPERATIONS
11.8 billion
standard cubic feet per day of natural gas processing capacity
2.9 million
barrels per calendar day of
crude oil refining capacity
North American branded and direct dealer locations
8,100
2.1 billion
gallons of renewable
fuels delivered to consumers in
2020
barrels of storage capacity at our light product and asphalt terminals
42 million
MPLX Owned and Part-Owned Light Product Terminal
MPLX Owned Asphalt/Heavy Oil Terminal
MPLX Natural Gas Processing Complex (b)
MPLX Refining Logistics Asset
MPLX Gathering System
MPLX Owned Marine Facility
Louisiana Offshore Oil Port, a joint venture in which MPC and MPLX hold interests.
barrels per calendar day of Natural Gas Liquids (NGLs) fractionation
capacity
0.8 million
0202

Acting today is crucial to unlocking tomorrow’s potential. The primary ambition of the Paris Agreement is to limit global warming to well below 2 degrees Celsius compared to pre-industrial levels. Access to clean, reliable and affordable energy is critically important to meeting this challenge. Reliable and affordable energy will provide the resources and prosperity that can drive innovation of next-generation energy technologies.
The Intergovernmental Panel on Climate Change (IPCC) indicates that to achieve the temperature ambition of the Paris Agreement, global GHG emissions will need to reach a “net-zero” state sometime around mid-century, followed by a subsequent drawdown of ambient GHG concentrations. Net-zero does not mean zero emissions, instead it refers to a balance between the amount of greenhouse gas emitted and the amount removed from the atmosphere in order to prevent ambient concentrations from rising. Like a bathtub with the taps on, an approach to achieving this balance can be either to turn down the taps (reduce emissions) or to drain an equal or greater amount (e.g., remove CO2 through photosynthesis, direct air capture). Both will be needed.
The IPCC timing of the net-zero goal is based on a “carbon-budget,” which estimates the remaining emissions that can enter the atmosphere without raising the temperature above 1.5 to 2 degrees Celsius. Thus, it is equally important for society to reduce near-term global emissions to preserve the carbon budget while working toward the longer-term aspirations of reaching net-zero.
Global emissions have continued to increase despite bright spots where nations or regions have achieved reductions – mainly the U.S. and the European Union, where emissions from fossil fuel combustion have fallen by more than 15% below 2005 levels. To reverse the global trend, it is imperative for society to deploy existing strategies and technologies that can decrease GHG emissions in the near term. Every sustained tonne of GHG emissions avoided today counts for 30 tonnes of total GHG emissions avoided in the three decades between now and 2050, thereby helping to preserve the carbon budget.
The importance of near-term action means it is critical to bank those savings as soon as possible using the technological tools currently at our disposal. Continued investment in the next generation of innovative energy technologies is a long-term solution that should continue on a parallel path.
We should not allow the global ambition to be net-zero to inhibit the deployment of existing technologies that can reduce greenhouse gas emissions today.
INTRODUCTION
To reach a net-zero state, global emissions must be reduced and balanced with GHG emissions sinks
Strategies to reduce annual GHG emissions include:
• Replacing coal generation with natural gas and renewables
• Energy efficiency and electrification
• Carbon capture, utilization and sequestration (CCUS)
• Biofuels and other alternative fuels
• Lifestyle changes (e.g., heating and cooling, commuting)
• Innovation
Strategies to increase annual GHG emissions sinks include:• Regenerative/sustainable agriculture • Protecting and restoring ecosystems• Direct air capture• Innovation
Annual global GHG emissions
GHG removal sinks
Remaining GHG budget
GHG already accumulated in atmosphere
2021 Perspectives on Climate-Related Scenarios | 03

A variety of innovative technologies are being developed to supplement the enormous role that traditional energy sources play in fueling modern life, however, they are not readily deployable as replacements today and potentially not for many decades. Deploying existing technologies, on the other hand, can have an immediate impact on GHG reductions.
Incentivizing deployment of existing technologies and strategies that we know can provide near-term GHG emission reductions – replacing coal with natural gas and renewables, energy efficiency, biofuels, nature-based solutions and carbon capture – will allow the next generation of advanced energy technologies to be developed and deployed in the decades to come.
For instance, a global switch from coal to natural gas and renewables to generate power could reduce GHG emissions by over 5 billion tonnes per year.
Throughout this report we provide disclosures that follow the recommendations from the Task Force on Climate-Related Financial Disclosures (TCFD), including a review of our business against a “less than 2-degree” or “low-carbon” scenario, using scenarios developed by the International Energy Agency (IEA).
We believe our investors and other interested stakeholders will find that the extensive disclosures in this report, our most recent Annual Report on Form 10-K, Sustainability Report and website align with the TCFD’s principles and demonstrate MPC’s and MPLX’s financial strength, adaptiveness and resilience to climate-related risks.
Climate mitigation technologies and strategies ready today
Next-generation technologies for potential future deployment
CO2e
04
INTRODUCTION
Electrification Energy efficiency
Coal-to-gas switching for baseload and peak power
Non-baseload renewable power (e.g.
solar and wind)
Carbon capture, utilization and sequestration
(CCUS)
Biofuels (e.g. renewable
diesel)
Nature-based sequestration and land use
Grid-scale battery storage
Direct air capture
technologies
Advanced cellulosic biofuels
Blue hydrogen
Green hydrogen
H2
H2
2020
Petroleum based fuel
Non-energy petroleum products
Biofuels
Natural gas & NGLs
2014
Petroleum based fuel
Non-energy petroleum products
Biofuels
Natural gas & NGLs
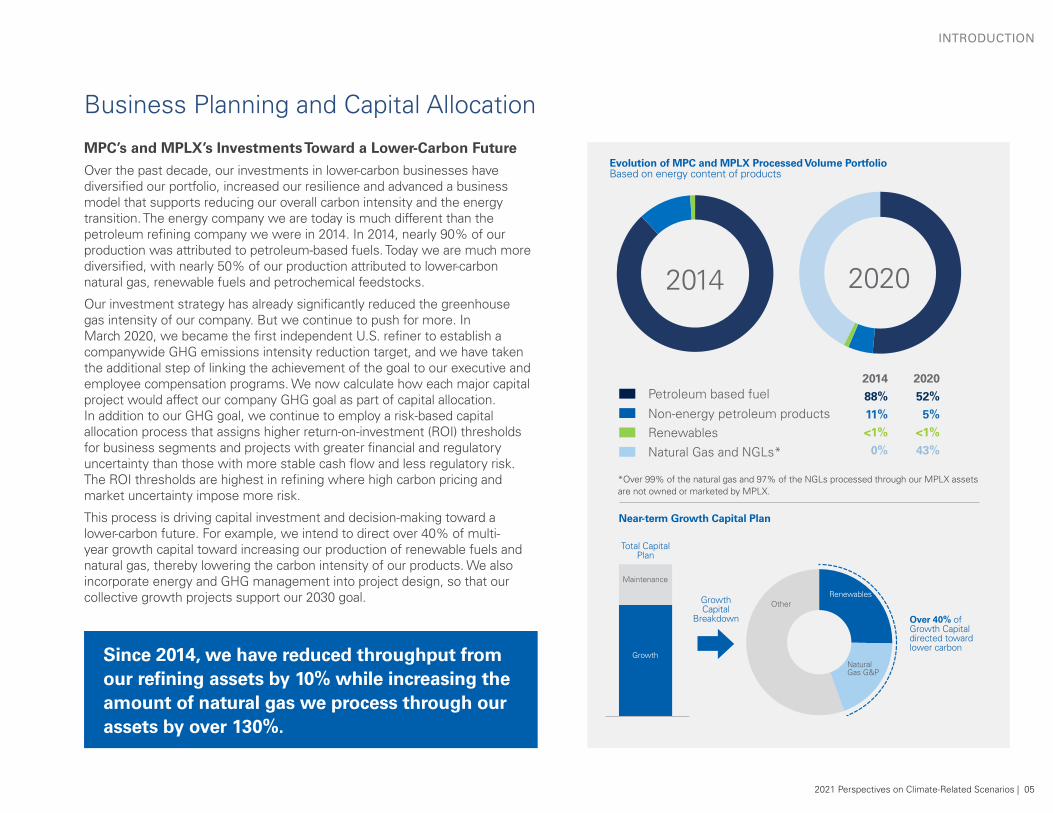
MPC’s and MPLX’s Investments Toward a Lower-Carbon Future
Over the past decade, our investments in lower-carbon businesses have diversified our portfolio, increased our resilience and advanced a business model that supports reducing our overall carbon intensity and the energy transition. The energy company we are today is much different than the petroleum refining company we were in 2014. In 2014, nearly 90% of our production was attributed to petroleum-based fuels. Today we are much more diversified, with nearly 50% of our production attributed to lower-carbon natural gas, renewable fuels and petrochemical feedstocks.
Our investment strategy has already significantly reduced the greenhouse gas intensity of our company. But we continue to push for more. In March 2020, we became the first independent U.S. refiner to establish a companywide GHG emissions intensity reduction target, and we have taken the additional step of linking the achievement of the goal to our executive and employee compensation programs. We now calculate how each major capital project would affect our company GHG goal as part of capital allocation. In addition to our GHG goal, we continue to employ a risk-based capital allocation process that assigns higher return-on-investment (ROI) thresholds for business segments and projects with greater financial and regulatory uncertainty than those with more stable cash flow and less regulatory risk. The ROI thresholds are highest in refining where high carbon pricing and market uncertainty impose more risk.
This process is driving capital investment and decision-making toward a lower-carbon future. For example, we intend to direct over 40% of multi-year growth capital toward increasing our production of renewable fuels and natural gas, thereby lowering the carbon intensity of our products. We also incorporate energy and GHG management into project design, so that our collective growth projects support our 2030 goal.
Business Planning and Capital Allocation
Near-term Growth Capital Plan
Petroleum based fuel
Non-energy petroleum productsRenewables
Natural Gas and NGLs*
2014
88%
11%
<1%
0%
2020
52%
5%
<1%
43%
2014 2020
Evolution of MPC and MPLX Processed Volume Portfolio Based on energy content of products
Other Renewables Natural Gas G&P
Renewables
Natural Gas G&P
Other
Over 40% of Growth Capital directed toward lower carbon
Maintenance
Growth
Growth Capital
Breakdown
Total Capital Plan
Since 2014, we have reduced throughput from our refining assets by 10% while increasing the amount of natural gas we process through our assets by over 130%.
*Over 99% of the natural gas and 97% of the NGLs processed through our MPLX assets are not owned or marketed by MPLX.
2021 Perspectives on Climate-Related Scenarios | 05
INTRODUCTION

$32$36
$24
$3
Clean Fuel Credits$135
LCFS Credits$200
Cap and Trade Credits$18
$9
$18
$8
$20
$24
North American Carbon Pricing Programs ($USD)
Existing programsLegislation adopted and program under development
We support market-based approaches to reduce emissions, and we are currently participating in several programs based on this approach. For example, the California Low Carbon Fuel Standard (LCFS) program established a goal to reduce the carbon intensity of the motor fuel sold in California by 20% through 2030. Fuel producers and marketers can comply by marketing fuels that have a lower carbon intensity or by purchasing credits that are currently priced near $200 per tonne of CO2. In response to this incentive, we deployed capital to convert our Dickinson, North Dakota, and Martinez, California, petroleum refineries into renewable diesel facilities that will generate LCFS credits. This is an example of a narrow market-based policy that is driving investment in lower carbon-intensity fuels.
Because the climate impact of one tonne of carbon emitted to the atmosphere is the same regardless of location or source, we believe an economy-wide market-based policy that places a uniform, predictable cost on carbon will drive emission reductions at the lowest cost to society. Such a program would also support continued technology innovation and deployment.
There are many opportunities with abatement costs far below the $200 per tonne of CO2 costs associated with the California LCFS. For example, an appropriately designed and implemented national economy-wide program with a gradual price escalation would assure the lowest-cost abatements are completed first. Some opportunities that require an incentive to make widespread deployment cost effective include:
• Carbon capture, utilization and sequestration (CCUS)• Many energy efficiency projects• Building retrofits - insulation, HVAC, windows, etc.• Electrification • Regenerative farming• Nature-based sequestration
Market-Based Carbon Programs Can Incentivize GHG Emission Reductions
Sources: The World Bank, State and Trends of Carbon Pricing 2021.
06
INTRODUCTION
We have focused considerable effort and capital toward reducing Scope 1 and Scope 2 emissions, and we have provided transparent reports detailing our efforts and our progress. We focus on Scope 1 and Scope 2 emissions because we have direct control over these emissions and there are well-established and consistent criteria for reporting them across different industries. Scope 1 and Scope 2 emissions are also an indication of how efficiently a company produces a product.
This year we are providing an estimate of our Scope 3 emissions from the use of sold products. These are the GHG emissions released when the fuels we produce and market are combusted. Emissions from the use of sold products are, by their very nature, not within our control. Scope 3 emissions on an individual company basis are also not an indicator whether global emissions are being reduced and do not provide context of how emissions fit within the global energy system.
For instance, as we discuss in detail starting on Page 11, the growth of the U.S. natural gas industry significantly increased the Scope 3 emissions of many individual natural gas companies, including MPC and MPLX. This growth also enabled a significant net emissions decrease from natural gas replacing coal for power generation. This perspective is lost when Scope 3 emissions are not presented in context.
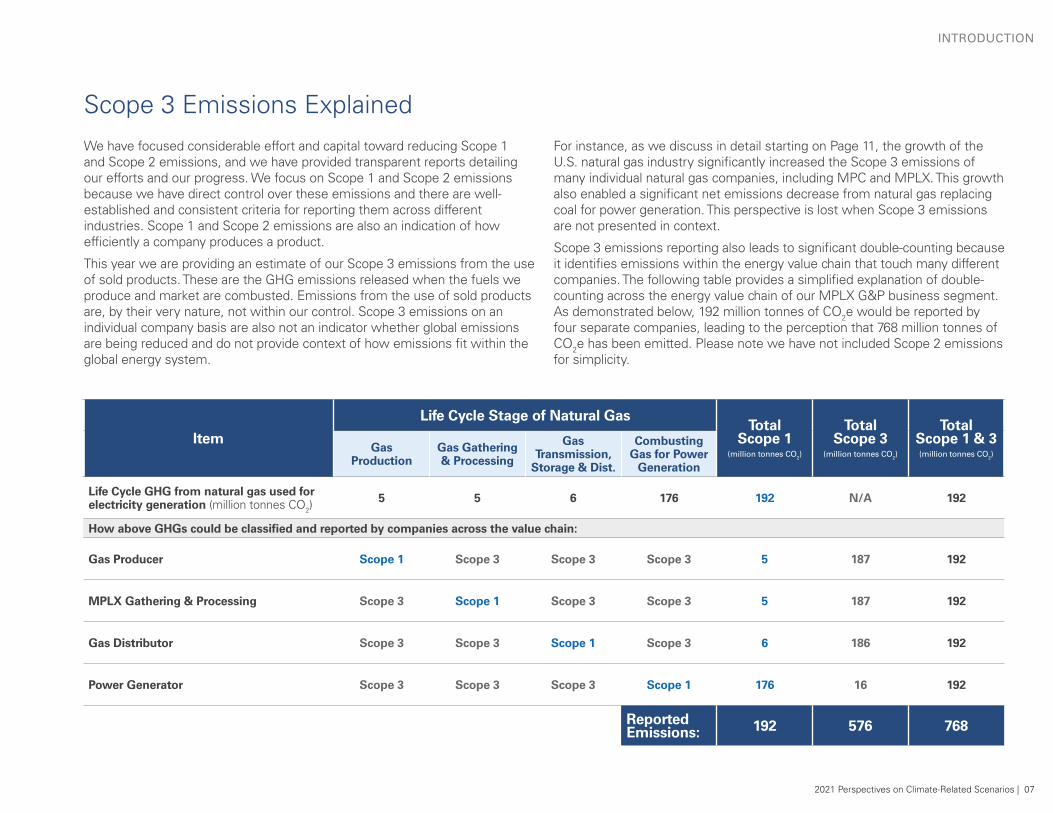
Scope 3 emissions reporting also leads to significant double-counting because it identifies emissions within the energy value chain that touch many different companies. The following table provides a simplified explanation of double-counting across the energy value chain of our MPLX G&P business segment. As demonstrated below, 192 million tonnes of CO2e would be reported by four separate companies, leading to the perception that 768 million tonnes of CO2e has been emitted. Please note we have not included Scope 2 emissions for simplicity.
Scope 3 Emissions Explained
Item
Life Cycle Stage of Natural GasTotal
Scope 1 (million tonnes CO2)
Total Scope 3
(million tonnes CO2)
Total Scope 1 & 3 (million tonnes CO2)
Gas Production
Gas Gathering & Processing
Gas Transmission,
Storage & Dist.
Combusting Gas for Power
Generation
Life Cycle GHG from natural gas used for electricity generation (million tonnes CO2)
5 5 6 176 192 N/A 192
How above GHGs could be classified and reported by companies across the value chain:
Gas Producer Scope 1 Scope 3 Scope 3 Scope 3 5 187 192
MPLX Gathering & Processing Scope 3 Scope 1 Scope 3 Scope 3 5 187 192
Gas Distributor Scope 3 Scope 3 Scope 1 Scope 3 6 186 192
Power Generator Scope 3 Scope 3 Scope 3 Scope 1 176 16 192
Reported Emissions: 192 576 768
2021 Perspectives on Climate-Related Scenarios | 07
INTRODUCTION

Annual global emissions trends of the entire oil and gas industry compared to Paris-aligned scenario projections like the IEA’s SDS and NZE2050 are a much better measure of meeting the world’s climate goals than an individual company’s Scope 3 emissions. For instance, the IEA indicates that in 2040 oil and gas could still provide roughly 50% of energy demand worldwide, albeit at lower volumes than today. This means there will still be successful companies producing oil and gas products for societal use well into the future.
Currently, Scope 3 reporting protocols do not recognize the societal GHG reductions that correspond with reported Scope 3 emissions. An example is GHG emission reductions associated with fuel switching or CCUS employed by a customer. Protocols currently do not recognize these benefits as a corresponding reduction in the Scope 3 emissions of the energy supplier even though they are realized by society. We feel this inequity should be rectified by the standard-setting bodies to enable GHG emission reductions to be accounted for in the same fashion as the emissions associated with our energy products.
Refining and Marketing (including biofuels) Unit of Measure 2019 2020
Scope 3 Emissionsi Category 11 - Refinery Yield Method million tonnes CO2e 426 352
Scope 3 Emissionsi Category 11 - Marketed Volume Method million tonnes CO2e 485 415
MPLX G&P Unit of Measure 2019 2020
Scope 3 Emissionsi,ii Category 11 - Processed Volume Owned by Third Parties million tonnes CO2e 188 191
Scope 3 Emissionsi,ii Category 11 - Processed Volume Owned by MPLX million tonnes CO2e 2 2
i MPC calculates emissions from third-party use of sold products in alignment with methods in Category 11 of IPIECA’s Estimating Petroleum Industry Value Chain (Scope 3) Greenhouse Gas Emissions (2016). MPC applied emission factors obtained from EPA or derived from API calculations. Non-fuels products are not combusted by the end user and therefore are not included in these Scope 3 estimates. IPIECA’s Scope 3 methodology includes 15 categories of activities along each product’s value chain. Due to lack of third-party data, Scope 3 emissions for categories other than Category 11 could not be estimated. Greenhouse gas estimates using the yield method are based on MPC’s sales of products manufactured by our assets and emissions from the marketed volume method represent energy products sold to customers by MPC and include energy products purchased by MPC from other suppliers and resold.
ii Over 99% of the natural gas and 97% of the NGLs processed through our MPLX assets are not owned or marketed by MPLX.
Throughout this report, we highlight examples of customer (end user) GHG emission reductions from our participation in several value chains as reflected below:
• Approximately 250 million metric tons per year of GHG emission reductions associated with the coal-to-natural gas switching in the power sector based upon our current natural gas processing rates – Page 13
• Production and blending of ~2.1 billion gallons per year of biofuels has enabled nearly 9 million metric tons per year of GHG emission reductions – Page 27
• Carbon capture and use of Scope 1 GHG emissions from our assets has resulted in ~0.4 million metric tons per year of GHG emissions being displaced from the food and beverage industry – Page 24
These substantial GHG emission reductions are not solely attributable to MPC, MPLX or other companies, but rather, they represent the collective societal benefits from significant investment and involvement throughout the value chain.
The external assurance statement from Lloyds Register Quality Assurance, Inc. relating to our GHG data is available athttps://www.marathonpetroleum.com/htmlEmails/LRQA/LR_Independent_Assurance_Statement.pdf
08
INTRODUCTION

BUSINESS STRATEGY AND CLIMATE-RELATED SCENARIO PLANNING
Pictured: A wind turbine provides electricity for a pipeline pump station owned and operated by Marathon Pipe Line LLC, an MPLX subsidiary.
Today’s energy landscape is constantly evolving, and the topic of climate change is at the forefront.
Whether it is the significant investment in research and development of low-carbon energy technologies that may disrupt our current energy systems, the advances in scientific understanding of the global carbon cycle, or the many competing policies and strategies put forth at all levels of government, we continually evaluate these and other climate-related risks and opportunities as part of our governance. This includes evaluating both long-term and short-term scenarios. Throughout this section we provide detailed analyses of our business strategies against future scenarios from the International Energy Agency (IEA) and data from HSB Solomon Associates LLC (Solomon).
The IEA’s scenarios forecast possible future energy landscapes with the aim of providing governments, companies and other stakeholders with a range of potential outcomes to consider. These scenarios provide our company with several versions of the future to consider so we can plan ahead and adjust appropriately as the future unfolds. In this year’s report, we apply the following three hypothetical scenarios:
• Stated Policies Scenario (STEPS) — previously known as the New Policies Scenario, the central scenario from IEA provides a detailed look at where today’s policy ambitions would take the energy sector. It incorporates policies and measures that governments around the world have already put in place, as well as the effects of announced policies, most notably those in climate pledges submitted for the Paris Climate Agreement (COP21).
• Sustainable Development Scenario (SDS) — a hypothetical construct that starts with the outcomes to be achieved and then assesses a pathway of actions that could achieve them. The specific outcomes are modeled after the United Nations Sustainable Development Goals: 1) ensuring universal access to affordable, reliable, sustainable and modern energy services by 2030 (SDG 7.1); 2) substantially reducing air pollution (SDG 3.9); and 3) limiting worldwide temperature increases to well below 2 degrees Celsius (SDG 13).
• Net Zero Emissions by 2050 case (NZE2050)— a supplement to the SDS analysis. The SDS sees many advanced economies reaching net-zero emissions by 2050 at the latest, and puts the world on track for net-zero emissions by 2070. The NZE2050 accelerates this further by modeling a pathway to reach net-zero CO2e emissions globally by 2050.
2021 Perspectives on Climate-Related Scenarios | 09

Energy Outlook Through 2040
IEA Energy Projections for 2040 at a Glance
2019* 2040 STEPS
2040 SDS
Gas 23%
Other Renewables 18%
Coal 10%
Bioenergy 13%
Nuclear 9%
Gas 25%
Other Renewables 8%
Coal 19%
Bioenergy 11%
Nuclear 5%
Gas 23%
Hydro 3%
Coal 26%
Bioenergy 9%
Nuclear 5%
Crude Oil 23%Crude Oil 28%Crude Oil 31%
Hydro 4%Hydro 3%Other Renewables
2%
* Latest year available** In million boe per day*** Adapted from IEA (2021), Net Zero by 2050, IEA, Paris
Source: IEA, World Energy Outlook 2020
Total Energy Demand**
287
Total Energy Demand
340
Total Energy Demand
259
For the world to meet the challenge of the Paris Agreement, there needs to be a shift in the type and volumes of energy the global community uses today and in the future. There are short-term solutions like replacing coal with natural gas and renewables, and carbon capture, utilization and sequestration (CCUS) that can provide immediate carbon reductions. There are also longer-term solutions such as grid-scale battery storage and/or compact nuclear reactors that are still under development. Key to the success of the sustainable energy evolution is affordable and reliable energy. Ensuring that energy remains affordable and reliable, as lower-carbon technologies are deployed, will help build societal support and lead to more decarbonization. If energy costs rise rapidly, energy becomes less reliable and is not available when expected, prosperity suffers, with those least able to afford such shocks impacted most.
Prosperity and energy are inextricably tied together. The more people pay for energy, the less income they have for other things. People need energy to get to work; to light, heat and cool their homes; to power their phones and computers; and to cook their meals.
Basic services that many of us take for granted, like clean water and sanitation, all depend on energy. Virtually every product we purchase depends on energy for its raw materials, manufacture, and transport to retail outlets and our homes. Ensuring that energy remains reliable and affordable is essential to gaining and keeping public support for our common goal of reducing GHG emissions.
While developed nations enjoy nearly universal access to affordable, reliable energy, not everyone is so fortunate. There are still nearly 800 million people worldwide without electricity and another 2.6 billion people without access to clean cooking resources. We support the United Nations Sustainable Development Goal of providing energy access to close this gap so that everyone has a chance at greater prosperity. The IEA’s scenarios take these factors into consideration; all three scenarios include diversified energy portfolios that vary the speed of innovation, technology adoption and decarbonization. The SDS, for example indicates that fossil fuels would still be expected to provide over 50% of energy demand into 2040, albeit at lower volumes than today.
2040 NZE2050***
Gas 14%
Other Renewables 32%
Coal 6%
Nuclear 10%
Crude Oil 15%
Total Energy Demand
239
Bioenergy 18%
Hydro 5%
10
BUSINESS STRATEGY AND CLIMATE-RELATED SCENARIO PLANNING

Scenario Analysis of MidstreamUnder each of IEA’s scenarios, demand for natural gas is expected to stay strong through 2040. This is because, as the cleanest burning fossil fuel, natural gas provides a pathway toward significant near-term GHG emissions reduction ambitions. Every sustained tonne of GHG emissions avoided today counts for 30 tonnes of total GHG emissions avoided in three decades, preserving the planet’s carbon budget and allowing for technology development in furtherance of net-zero goals.
The importance of near-term actions means it is critical to bank any GHG reductions as soon as possible and to use the technological tools currently at our disposal. That is where natural gas can deliver. The greatest potential for GHG reductions is in replacing coal used for electricity generation and thermal heating. The best option for replacing coal – in the short term – is natural gas in combination with new renewable power generating capacity.1 This is because natural gas produces half the emissions for the same amount of energy as coal, is abundant, burns cleanly and can provide efficient heat production on demand. Natural gas can also be supplemented with renewable power generation, such as wind and solar, to further reduce GHGs, with natural gas providing the baseload and peak energy.
The U.S. has already demonstrated the benefits of this strategy. Specifically, as shown to the right, the U.S. has reduced CO2 emissions from fuel combustion by over 930 million tonnes per year below 2005 levels, a 16% decrease. Much of this reduction occurred within the electricity generation sector through coal displacement in favor of natural gas and, to a lesser extent, renewable sources such as wind and solar. This is in stark contrast to much of the rest of the world, where emissions continue to increase. Much of the increase can be attributed to expanding coal power. For instance, China and India, collectively, still produce more than 65% of their electricity from coal. Both countries continue to build new coal plants, signaling both China and India intend to continue coal use for many years, further reducing the remaining global carbon budget.2
0
1
2
3
2000 2002 2004 2006 2008 2010 2012 2014 2016
Regional Carbon Dioxide Emissions from Fuel Combustion (2000-2019)
2018 2020
Carb
on D
ioxi
de E
mis
sion
s (b
illio
n to
nnes
per
yea
r)4
5
6
7
8
9
10
Source: IEA, CO2 Emissions from Fuel Combustion (2020)
205% increase
17% decrease
15% decrease
159% increase
101% increase
China OECD Europe India Middle EastUnited States
Natural Gas Demand Projections Through 2040 (billion cubic meters)
2010 Actual
2019 Actual
2030E
0 1000 2000 3000 4000 5000 6000
Source: IEA, World Energy Outlook 2020
2040E
NZE2050SDSSTEPS
“A record-tying 37.8 gigawatts (GW) of coal plants were retired in 2020, led by the U.S. with 11.3 GW and EU27 with 10.1 GW, but these retirements were eclipsed by China’s 38.4 GW [and India’s 2 GW] of new coal plants.”
Global Energy Monitor, et. al., Boom and Bust 2021 (April 2021).
2021 Perspectives on Climate-Related Scenarios | 11
BUSINESS STRATEGY AND CLIMATE-RELATED SCENARIO PLANNING

United States Power Generation by Source
0 20% 40% 60% 80% 100%
Coal Natural Gas Nuclear
Renewable Fuels Other
2005
2010
2015
2020
In 2005, nearly 50% of the electricity produced in the U.S. was generated from coal. This dropped below 20% for the first time in 2020 and is expected to continue declining. This shift from coal to natural gas significantly increased demand for natural gas by nearly 20 billion standard cubic feet per day (scfd), a 30% increase. This natural gas boom has been the primary driver behind the 930 million tonnes per year of CO2 reductions realized in the U.S. This was accomplished through significant private investment across all key segments of the natural gas system, including production, gathering and processing, distribution and storage, and transmission. Natural gas power generation has also kept the electric grid stable, allowing for more renewable power to come online without disrupting electricity supplies. This is a model that can be replicated throughout much of the world to further help reduce GHG emissions.
If a similar coal displacement strategy were applied worldwide, an additional 5 billion tonnes of CO2 per year reduction could be realized in the near term while expanding access to electricity in the developing world.3 This can be done now with existing technology and without risking grid instability; U.S.-produced natural gas could help spawn decarbonization in other parts of the world, including China and India, where coal use continues to expand.
MPLX Contributions to U.S. GHG ReductionsWe have invested approximately $20 billion to acquire and expand natural gas gathering and processing capacity through our master limited partnership, MPLX. Since first acquiring natural gas assets in December 2015, we have steadily grown MPLX into the largest natural gas processing company in the U.S.4 These significant investments helped to significantly reduce the carbon intensity of the energy supply chain over the last decade, benefiting the economy and the environment. As shown to the right, our asset base has steadily grown over the past decade and corresponds to the increase in natural gas electricity generation shown above. During this time period, demand for electricity remained relatively flat. Evaluating the gross Scope 1, 2 and 3 emissions from these investments would show a steady increase in MPLX’s GHG emissions year over year. However, this one-dimensional analysis ignores the substantial net societal GHG reductions that MPLX has helped to facilitate.
Natural Gas Processed by MPLX Assets (2010-2020)
0 2 4 6 8 10
2020
2018
2016
2014
2012
2010
Billion standard cubic feet per day
Source: U.S. Energy Information Administration
12
BUSINESS STRATEGY AND CLIMATE-RELATED SCENARIO PLANNING

For climate-risk reporting and analysis to be meaningful, net societal benefits and impacts must be considered.
An illustrative example of the substantial net societal GHG benefits MPLX has helped facilitate is shown to the right. Over the next decade we expect further displacement of U.S. coal-fired generating capacity as more natural gas, wind and solar generation come online. An additional 700 million tonnes of CO2 could be reduced in the U.S. as a result. Natural gas, wind and solar generation are very complementary. Because natural gas generation can be produced on demand, it provides baseload energy and grid stability for wind and solar. Unlike natural gas generation, wind and solar are inherently intermittent, capturing wind energy and solar energy only when they are present.
The annual volume of natural gas processed by MPLX has helped avoid approximately 250 million tonnes CO2e from the U.S. energy supply chain per year when compared to coal for electricity generation.This illustrative example compares the life cycle GHG emissions that would result from the 8.4 Bcf/d of natural gas processed by MPLX in 2020 being used for electricity generation versus that of coal. Based on U.S. Energy Information Administration data:
• 8.4 Bcf/d of natural gas would produce 417 billion kWh of electricity
• 233 million tons of coal would be needed to produce 417 billion kWh of electricity
~5 MT CO2e ~5 MT CO2e1 ~6 MT CO2e
~176 MT CO2e
≈ 192 MT CO2e+ + +
Gas Production
MPLX Gathering and
Processing
Gas Distribution
Electricity Production
An estimated 192 million tonnes CO2e is emitted across the energy value chain to produce 417 billion kWh of electricity natural gas.
~16 MT CO2esmall, not available ~431 MT CO2e
≈ 447 MT CO2e+ +
Coal Production
Coal Distribution
Electricity Production
An estimated 447 million tonnes CO2e is emitted across the energy value chain to produce 417 billion kWh of electricity using coal.
8.4 Bcf/d
8.4 Bcf/d
8.4 Bcf/d
233 million tons 233 million tons 417 billion kWh
417 billion kWh
Nearly 10% of the natural gas produced in the United States passes through our integrated gas gathering and processing networks, which are strategically located within some of the most prolific natural gas basins in the U.S. — the Marcellus, Utica and Permian. Source: Adapted from U.S. EPA, Inventory of U.S. Greenhouse Gas Emissions and Sinks: 1990-2019 (2021)
2021 Perspectives on Climate-Related Scenarios | 13
BUSINESS STRATEGY AND CLIMATE-RELATED SCENARIO PLANNING

Additional Carbon Reductions Natural Gas Can DeliverNatural gas is a versatile, clean-burning and efficient fuel that can be used in a wide variety of applications.
Natural gas and combined heat and power (CHP)
Replacing lower-efficiency boilers and deploying CHP systems reduces the emissions intensity of the industrial sector, even as natural gas continues to grow as a proportion of total fuel consumption in the sector. MPC operates several CHP systems at our refineries, which have avoided millions of tonnes of GHGs when compared to separately generating electricity and steam.
CO2eNatural gas power generation with CCUS
Natural gas power plants can be retrofitted for carbon capture, utilization and sequestration (CCUS), leading to further GHG reductions. Natural gas generation will be critical to providing grid stability as electrification strategies for buildings, industry and transportation increase electricity demand.
H2
Natural gas as feedstock
Natural gas and natural gas liquids (NGLs) are important feedstocks to make products such as chemicals and plastics, which do not emit greenhouse gases in end use. Methane is also the primary feedstock used to produce hydrogen. The proliferation of blue hydrogen made through stream methane reformation with CCUS or methane pyrolysis is a future low-carbon use for natural gas that is expected to drive substantial CO2 reductions.
Natural gas as transportation fuel
Compressed natural gas (CNG) and liquefied natural gas (LNG) can be deployed directly as a transportation fuel. Most natural gas-fueled vehicles in the United States today are buses and trucks. CNG and LNG can reduce GHG emissions as compared to gasoline and diesel and are energy-dense fuels that can be used in heavy-duty engines and cargo ships where electrification is currently not viable. Limited availability of fueling infrastructure is one of the hurdles to deploying more natural gas-fueled vehicles.
14
BUSINESS STRATEGY AND CLIMATE-RELATED SCENARIO PLANNING
Focus on MethaneTo fully realize the potential climate benefits of natural gas, it is important to minimize leaks, venting and flaring of methane. Unmitigated methane emissions can undermine some of the climate benefits of natural gas we have highlighted throughout this report. MPLX and others within the natural gas industry are implementing measures to reduce methane emissions from leaks, venting and flaring. We continue to work with regulators to identify and implement measures that help to minimize methane emissions and promote efficiency within the natural gas industry.
MPLX CommitmentsTo further our commitment to reduce methane emissions, in 2020 MPLX adopted a target to decrease our methane emissions intensity by 50% below 2016 levels by 2030.
The first step we took was to inventory where methane emissions originate from within our system and identify programs to reduce emissions. We expect to reduce methane emissions from existing assets by around 5,000 tonnes per year to meet our 2025 goal. For new construction, we plan to design systems with lower potential for methane emissions.
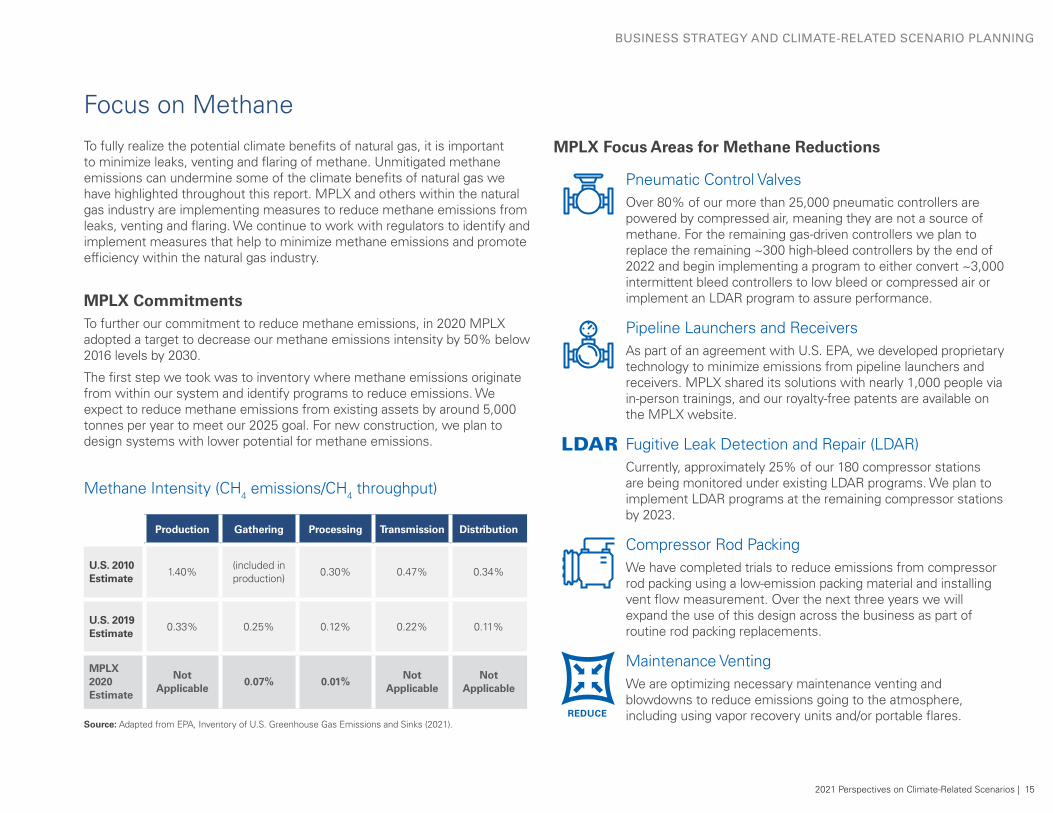
MPLX Focus Areas for Methane Reductions
Pneumatic Control ValvesOver 80% of our more than 25,000 pneumatic controllers are powered by compressed air, meaning they are not a source of methane. For the remaining gas-driven controllers we plan to replace the remaining ~300 high-bleed controllers by the end of 2022 and begin implementing a program to either convert ~3,000 intermittent bleed controllers to low bleed or compressed air or implement an LDAR program to assure performance.
Pipeline Launchers and ReceiversAs part of an agreement with U.S. EPA, we developed proprietary technology to minimize emissions from pipeline launchers and receivers. MPLX shared its solutions with nearly 1,000 people via in-person trainings, and our royalty-free patents are available on the MPLX website.
Fugitive Leak Detection and Repair (LDAR) Currently, approximately 25% of our 180 compressor stations are being monitored under existing LDAR programs. We plan to implement LDAR programs at the remaining compressor stations by 2023.
Compressor Rod PackingWe have completed trials to reduce emissions from compressor rod packing using a low-emission packing material and installing vent flow measurement. Over the next three years we will expand the use of this design across the business as part of routine rod packing replacements.
Maintenance VentingWe are optimizing necessary maintenance venting and blowdowns to reduce emissions going to the atmosphere, including using vapor recovery units and/or portable flares.
LDAR
REDUCE
Methane Intensity (CH4 emissions/CH4 throughput)
Production Gathering Processing Transmission Distribution
U.S. 2010 Estimate
1.40%(included in production)
0.30% 0.47% 0.34%
U.S. 2019 Estimate
0.33% 0.25% 0.12% 0.22% 0.11%
MPLX 2020 Estimate
Not Applicable
0.07% 0.01%Not
ApplicableNot
Applicable
Source: Adapted from EPA, Inventory of U.S. Greenhouse Gas Emissions and Sinks (2021).
2021 Perspectives on Climate-Related Scenarios | 15
BUSINESS STRATEGY AND CLIMATE-RELATED SCENARIO PLANNING

Midstream — Potential Risks and Opportunities
Our Midstream segment, which includes MPLX, faces the following key climate-related risks and opportunities:
Gathering and Processing
Risks
• Potential regulations and policies could reduce demand for natural gas and related services.
• While we do not conduct hydraulic fracturing operations, we do provide gathering, processing and fractionation services with respect to natural gas and NGLs produced by our customers as a result of such operations. As a result, any prohibitions on hydraulic fracturing or increased regulation of the upstream oil and gas industry could affect our Midstream business.
Opportunities
• Continued coal-to-gas switching would support or increase demand for natural gas and provide a “quick win” by reducing local air pollutants and near-term GHG emissions.
• Production of blue hydrogen as a low carbon fuel source could increase demand for natural gas. The United States has ample saline aquifer storage capacity that can be used to store CO2 generated from converting natural gas into blue hydrogen.
• Increased petrochemical feedstock demand and demand for clean cooking fuel could further strengthen demand for NGLs from our deethanization and fractionation facilities located in the Marcellus, Utica and Permian basins.
Logistics and Storage
Risks
• Reduced demand for transportation fuels that are transported through or stored in our logistics assets, including our pipelines, terminals and marine fleet.
• Increased climate-related regulations and litigation surrounding pipeline construction, siting and operation could have a negative impact on business.
Opportunities
• The integration of our transportation and storage assets with our refining, gas processing and branded retail locations provides opportunities to quickly and cost-effectively take advantage of market opportunities, such as being located in areas accessible to existing and planned gas and petroleum product export facilities.
• The increased difficulty of building new pipelines increases the value of MPLX’s existing infrastructure. This existing logistics infrastructure could be converted to transport renewable fuels, green or blue hydrogen, or CO2 for sequestration as emerging markets mature.
16
BUSINESS STRATEGY AND CLIMATE-RELATED SCENARIO PLANNING

Midstream Scenario Analysis Throughout this report we have highlighted the great potential of natural gas to help further the ambitions of the Paris Agreement to reduce GHG emissions. As the cleanest burning fossil fuel, natural gas emits about half the amount of carbon dioxide as coal and is highly versatile. Natural gas can also coexist with wind and solar generation to deliver electricity with a much lower carbon footprint while providing the reliability and affordability that is expected.
Given these significant advantages, the IEA continues to project strong demand for natural gas and NGLs through 2040.
• Natural Gas: The IEA projects worldwide natural gas demand will increase by 30% under its Stated Policies Scenario. Under the SDS, demand increases initially, then falls by 10% below today’s levels. The Stated Policies Scenario also projects that U.S. natural gas production will increase by approximately 12% through 2040 and is expected to be concentrated in the Utica, Marcellus and Permian basins. The U.S. is expected to supply between 20% to 25% of the world’s natural gas through 2040.
• Nonmethane Fractions of Natural Gas: Demand remains strong through 2040 for the nonmethane fractions of natural gas called NGLs, which are important feedstocks for the petrochemical industry (e.g., steam cracking). The IEA projects petrochemical feedstock demand could increase by over 40% through 2040. The IEA and United Nations also project a significant market increase is needed for clean cooking fuel in the developing world to combat indoor air pollution.
• Transportation: The use of natural gas in international shipping is projected to reach 50 bcm by 2040 from less than 1 bcm today and could account for 13% of the shipping fuel mix. The International Maritime Organization has adopted an initial strategy to cut GHG emissions by 50% through 2050. Natural gas fuel is considered to be a viable option to help meet this goal.
Description Key Advantages Key Challenges
SM
R
wit
h C
CU
S Steam methane reforming (SMR) is a thermal process that reacts methane (CH4) with steam to produce hydrogen and CO2. In order to be carbon neutral, it needs to be combined with CCUS.
The only technology currently operating at scale. As such, it is the most cost-effective form of hydrogen production, even with the addition of CCUS.
Complex storage of CO2 gas. Political opposition to CCUS in many countries.
Ele
ctro
lysi
s Electrolysis is an existing technology (small-scale use) that splits water (H2O) into hydrogen and oxygen using electricity. Hydrogen produced can only be considered carbon neutral if the electricity used is itself carbon neutral.
No direct carbon emissions and no other by products that need to be stored.
Higher cost and questions about scalability. Requires large amounts of water.
Pyr
oly
sis Pyrolysis is the decomposition of methane into
hydrogen and solid carbon (c). Residual carbon is in solid rather than in gaseous form.
No complex CO2 storage in underground caverns, as is the case with CCUS. Solid carbon can be used as a feedstock in existing industries.
Early stages of technology development.
Natural Gas - Potential for Hydrogen Production
• U.S. Product Exports: The continued strong outlook for U.S. crude, natural gas and NGL production will require additional infrastructure to link supply to global demand markets. Pipelines and processing, fractionation and LNG export facilities will be needed to allow U.S. producers to realize full product value. The IEA projects that almost all the growth in U.S. gas production will be destined for export.
Natural gas also has great potential to produce blue hydrogen as a zero-carbon fuel and feedstock. In the SDS, around 50 million tonnes of oil equivalent (Mtoe) of low-carbon hydrogen would be produced globally in 2030, and this rises to 470 Mtoe in 2050. Blue hydrogen is produced through a reaction that separates methane into hydrogen and CO2 and then captures and sequesters the CO2. It is lower cost than green hydrogen produced through the electrolysis of water. Much of the 470 Mtoe of hydrogen production would need to be produced through CCUS-equipped natural gas reformers unless there are significant advancements in electrolysis and pyrolysis.
2021 Perspectives on Climate-Related Scenarios | 17
BUSINESS STRATEGY AND CLIMATE-RELATED SCENARIO PLANNING
Our Midstream Resiliency
Natural Gas Gathering and Processing• The IEA projects the natural gas sector could experience worldwide
investments from $6 trillion to $8 trillion through 2040. Our strategic goals align with this investment trend. Since 2015, we have invested approximately $20 billion in MPLX to acquire, steadily grow and optimize our integrated natural gas gathering and processing network. This investment trend has lowered our overall carbon intensity substantially and benefited the environment, to the extent that natural gas is displacing coal for electricity generation. As shown on Page 13, the volume of natural gas processed by MPLX plays an important role in the U.S. energy supply chain that had a net societal benefit of reducing GHGs.
• The IEA projects the United States will continue to be the largest producer of natural gas in the world through 2040, spawning significant exports of natural gas through pipelines to Canada and Mexico and LNG to other regions of the world. MPC and MPLX are strategically located to take advantage of this opportunity. The location of our assets allows us to tie into other existing and planned infrastructure, such as long-haul pipelines, to deliver feedstock and product to refineries, petrochemical facilities and export terminals on the East Coast and the Gulf Coast.
Logistics and Storage • Given the projected viability of our natural gas processing plants, and the
U.S. refining industry, our logistics assets, including storage terminals, export terminals, pipelines, marine fleet and trucking fleet will continue to transport feedstocks and products to and from our production facilities. Our nationwide logistics network also provides us with a greater ability to procure and deliver advantaged feedstocks to our production facilities and transport finished products from our facilities to demand centers. Our existing nationwide logistics infrastructure could also be converted to transport renewable fuels, renewable hydrogen and/or CO2 for sequestration as those emerging markets mature.
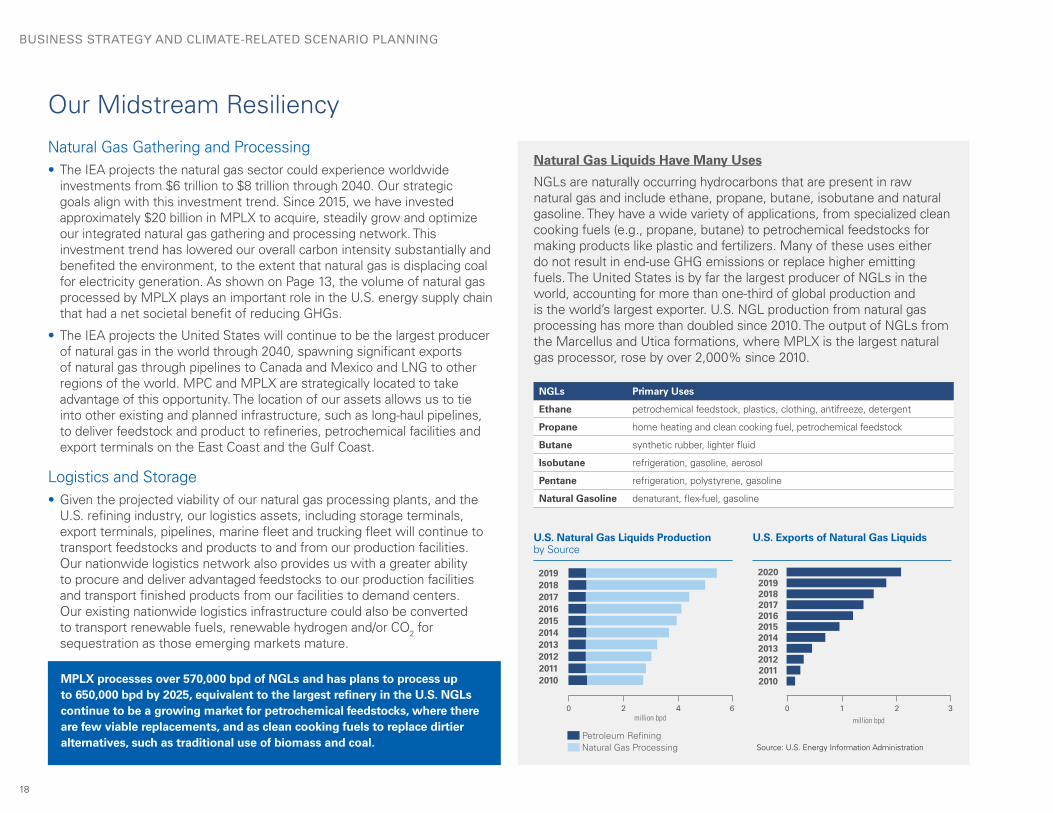
Natural Gas Liquids Have Many Uses
NGLs are naturally occurring hydrocarbons that are present in raw natural gas and include ethane, propane, butane, isobutane and natural gasoline. They have a wide variety of applications, from specialized clean cooking fuels (e.g., propane, butane) to petrochemical feedstocks for making products like plastic and fertilizers. Many of these uses either do not result in end-use GHG emissions or replace higher emitting fuels. The United States is by far the largest producer of NGLs in the world, accounting for more than one-third of global production and is the world’s largest exporter. U.S. NGL production from natural gas processing has more than doubled since 2010. The output of NGLs from the Marcellus and Utica formations, where MPLX is the largest natural gas processor, rose by over 2,000% since 2010.
U.S. Natural Gas Liquids Production by Source
201920182017201620152014
0 2 4 6million bpd
U.S. Exports of Natural Gas Liquids
NGLs Primary Uses
Ethane petrochemical feedstock, plastics, clothing, antifreeze, detergent
Propane home heating and clean cooking fuel, petrochemical feedstock
Butane synthetic rubber, lighter fluid
Isobutane refrigeration, gasoline, aerosol
Pentane refrigeration, polystyrene, gasoline
Natural Gasoline denaturant, flex-fuel, gasoline
2013201220112010
Petroleum RefiningNatural Gas Processing
2019201820172016201520142013201220112010
0 1 2 3
million bpd
2020
MPLX processes over 570,000 bpd of NGLs and has plans to process up to 650,000 bpd by 2025, equivalent to the largest refinery in the U.S. NGLs continue to be a growing market for petrochemical feedstocks, where there are few viable replacements, and as clean cooking fuels to replace dirtier alternatives, such as traditional use of biomass and coal. Source: U.S. Energy Information Administration
18
BUSINESS STRATEGY AND CLIMATE-RELATED SCENARIO PLANNING

Climate Scenario Analysis of Refining and Marketing
Scenario Projections for Petroleum-Based LiquidsThe IEA projects worldwide demand for petroleum-based liquids will remain strong through 2040, indicating an increase under its STEPS. On the other hand, to meet the carbon constrained SDS, demand would need to decline by 12% through 2030 and 33% by 2040. Under the NZE2050, demand would need to decline by 28% over the next decade and 58% by 2040. Thus, unless there is a technology breakthrough to capture and sequester CO2 emissions from mobile sources, demand for petroleum-based liquids will need to decline to align with the IEA’s less than 2 degree scenarios. Such a decline would prompt additional rationalization of the refining industry. Some key areas where petroleum-based fuels could be impacted include:
• Road Transport: Road transport has the largest impact on oil demand, and by 2040 there could be another 1 billion passenger vehicles on the road worldwide. As a result, without significant advances in fuel economy, renewable fuel production, and penetration of electric and hydrogen vehicles, demand for petroleum-based fuel will increase. To meet the projections in the SDS and NZE2050, 40% to 60% of all new passenger cars sold worldwide would need to be powered by low-carbon electricity or hydrogen by 2030, along with 30% of new light- and medium-duty trucks.
A revolution to the vehicle fleet like this will require significant government coordination to be successful. First, significant decarbonization of electric grids must occur for electric vehicles to provide the modeled GHG reductions. Second, electric grid infrastructure must be expanded and improved to ensure stability from the increased demand for electricity. Finally, a robust charging network would need to be built out before consumers will purchase vehicles at the levels being modeled. These hurdles, and the reality that it takes 15 to 20 years to change over an existing vehicle fleet, indicate that a significant base volume of petroleum fuels will be needed through 2040. Under the SDS, this is roughly 40% less than today.
• Aviation and Shipping: There are few viable options currently available to replace petroleum- based fuels in aviation and shipping beyond the small volumes of sustainable aviation fuel being produced today. As a result, improvements must be made through engine and vehicle design, logistics optimization and research and development of alternative fuels (e.g., ammonia, biofuels and hydrogen) to have a significant impact on volumes of jet fuel, diesel and bunkers.
• Industry and Petrochemicals: Light-weighting of the transport sector to increase fuel efficiency will be accomplished in part by increasing the use of petroleum-based plastics and composite materials in vehicles, planes and ships. As a result, petrochemicals demand is expected to grow.
• Buildings and Other: Other areas for demand reduction include making buildings more efficient and replacing oil-fired boilers and heaters with natural gas, electric or renewable sources.
Worldwide Petroleum-based Liquids Demand through 2040 (million bpd)
2010 Actual
2019 Actual
0 20 40 60 80 100 120
NZE2050SDSSTEPS
2030
Source: IEA, World Energy Outlook 2020 ; IEA (2021), Net Zero by 2050, IEA, Paris
2040
2021 Perspectives on Climate-Related Scenarios | 19
BUSINESS STRATEGY AND CLIMATE-RELATED SCENARIO PLANNING

Petroleum Refining and Marketing Scenario Analysis
Worldwide Refining Projections• The SDS models refinery runs based on a substantial reduction in demand
for gasoline, distillates, kerosene and bunker fuel and an increase in petrochemical feedstocks. This equates to a worldwide demand decrease for refined products of approximately one-third through 2040. Under the NZE2050, this same level of reduction would be achieved within the next 10 years. For these scenarios to be realized, significant rationalization of global refining capacity would need to occur. Rationalization, however, would not be borne equally across the refining industry. Instead, there would be winners and losers based on a host of factors including location, cost competitiveness, efficiency, complexity and government policy.
• The COVID-19 pandemic offered a short-term glimpse into a potential lower-carbon future. The worldwide lockdowns resulted in abrupt demand reductions for transportation fuels as people stayed in their homes instead of commuting to work or traveling. As a result, refining activity fell by almost 10% in 2020 alone, a level not seen since 2010.
• Prior to the pandemic, global refining utilization was hovering near 80%, meaning there was already overcapacity worldwide. Many high-cost, lower-utilized refineries were continuing to operate hoping demand would increase, making them profitable. However, the pandemic caused the global utilization rate to fall to approximately 73% and has yet to fully recover, prompting the announcement of approximately 3.7 million bpd of refining capacity being shut down or idled. The IEA indicates 2.4 million bpd of additional capacity rationalization is needed for utilization rates to once again exceed 80%.
• The volume of refinery closures aligns with the projections of the SDS. So far, high-cost, low-utilized refineries are being shuttered. As the world decarbonizes, we would expect this trend to continue. According to the IEA, the regions with the highest percentage of capacity at risk under the STEPS are Europe (35%), Japan and Korea (29%), Russia (17%), China (14%) and the U.S. (8%). China is one of the few regions still building new capacity, but the new capacity is displacing many small, inefficient, high-cost facilities with large, modern refinery complexes that integrate petrochemical plants. Under the SDS, over 40% of refineries worldwide would be at risk of rationalization.5
North American Refining Projections• North American refining is projected to experience modest capacity
reductions of 1.8 million bpd through 2040 under the STEPS. As shown below, some of this rationalization has already occurred as U.S. and Canadian refiners have reacted to the demand destruction brought on by COVID-19.
• One driver for the U.S. refinery closures is market opportunity to convert existing hydro processing capacity at underperforming assets to produce renewable diesel and sustainable aviation fuel. Although demand for petroleum-based transportation fuel is currently muted, demand for renewable fuel continues to increase to meet demand created by programs like the California Low Carbon Fuel Standard.
• Despite the projected decline in domestic U.S. gasoline demand over the long term, U.S. refiners benefit from a high level of complexity, giving them greater capability to meet global demand for a variety of products. U.S. refineries have an ample supply of domestic feedstock, lower energy costs and are favorably situated such that they can readily export to regions with higher demand for imported transportation fuels and other refined products.
Recent Refinery Rationalization by Region (thousand bpd)
0 200 400 600 800 1000
Announced Refinery Closures Additional Idled Capacity
North America
Europe
China
Asia Pacific
Latin America & Caribbean
Rest of World
1200 1400 1600
Source: HSB Solomon Associates LLC
20
BUSINESS STRATEGY AND CLIMATE-RELATED SCENARIO PLANNING

Refining and Marketing— Potential Risks and Opportunities
Potential Transitional Risks • Legal, technological, political and scientific developments regarding
greenhouse gas emissions and vehicle efficiency may decrease the demand or increase the cost for our transportation fuels.
• Energy assets and companies are subject to increasing climate-related litigation.
• While we do not conduct upstream oil and gas activities, any prohibitions on hydraulic fracturing or increased regulation of the upstream oil and gas industry could affect our ability to procure feedstocks for our assets.
• Advances in battery and fuel cell technology and alternative vehicle market penetration could reduce demand for liquid transportation fuels.
• Technological breakthroughs relating to renewable fuels or other fuel alternatives (e.g., hydrogen or ammonia), or efficiency improvements for internal combustion engines, could reduce demand for petroleum-based transportation fuels.
• Consumer preference could shift away from fossil fuels, reducing demand.
• We could face reduced demand for transportation fuels due to changes in work, school and travel habits resulting from the COVID-19 pandemic.
• Controversies associated with carbon emissions could impact investor sentiment, affecting access to capital.
• Some countries and regions may take actions to allow their refining industry to continue operation regardless of competitiveness.
Physical Risks • Our assets and operations could be adversely affected by acute physical
risks, such as floods, hurricane-forced winds, wildfires and snowstorms, and potential chronic physical risks, such as sea or water shortages.
Potential Opportunities• We consider energy efficiency to be a core business
function and opportunity because it reduces costs and GHG emissions and enhances long-term cost competitiveness.
• Reduced freshwater use intensity increases resiliency and reduces long-term operating costs.
• The availability and procurement of lower-carbon or renewable energy to power our operations could further reduce the life cycle carbon intensity of the fuels and products we manufacture.
• The market for clean cooking fuels in parts of Southeast Asia and Africa could expand the export market for the LPGs we produce, displacing the coal and biomass that are currently used by many households in these regions.
• Worldwide demand for petrochemical feedstocks is expected to increase through 2040 because there are few substitutes for the petroleum-based feedstocks used in the petrochemical industry.
• Gasoline and diesel demand is expected to increase in many developing countries. Our assets are favorably located for export to these countries.
• Worldwide and domestic demand for renewable fuels in the transportation fleet is expected to increase through 2040, and governments are adopting programs that provide economic incentives to increase renewable fuel production. Many of our assets could be converted to produce these fuels if market incentives materialize.
2021 Perspectives on Climate-Related Scenarios | 21
BUSINESS STRATEGY AND CLIMATE-RELATED SCENARIO PLANNING

The Resiliency of the U.S. Refining Industry
The U.S. refining industry as a whole has many advantages over the rest of the world, including:
• Competitive energy and feedstock costs due to robust domestic natural gas and crude oil production.
• A mature integrated logistics network that allows cost-effective transportation of feedstocks to refineries and products to consumers both domestically and abroad.
• A highly skilled and trained workforce.
• The lower cost of production in the U.S. is greater than many regional transportation costs. This enables products to be exported to other countries and regions, including Asia, Latin America, Africa and Europe.
• Market incentives to convert hydro processing capacity at underperforming refineries to produce renewable diesel and sustainable aviation fuel.
Consistent with our internal forecasts, the IEA projects the United States will continue to maintain lower energy prices through 2040 compared to other global regions. As a result, we believe the U.S. refining sector, including MPC, is well positioned to maintain a cost advantage over much of the world.
The U.S. refining sector is also advantaged with the highest level of technological complexity in the world. This provides greater capability to adjust output to products most in demand worldwide. Further, the most complex U.S. refineries are generally located near petrochemical and export facilities, providing synergies for easy delivery of petrochemical feedstocks, reducing transportation costs and emissions. As a result, we expect U.S. refining capacity utilization to remain relatively high compared to other regions, as the global refining sector adjusts output to match the reductions in transportation fuels projected by the SDS.
U.S. refiners are also finding ways to repurpose assets that are not as profitable under lower demand scenarios. Examples include converting hydro processing units to process plant- and animal-based oils instead of crude oil. Existing steam methane reformers can also be retrofitted with CCUS facilities to produce blue hydrogen that can be used as a low-carbon feedstock and fuel. The limiting factor to repurposing existing facilities, however, is a lack of a market incentive such as an economywide price on carbon. Where incentives exist, such as the California Low Carbon Fuel Standard, U.S. refiners are adjusting output to capture higher value for their assets.
Cumulative Crude Oil Distillation Capacity (million bpd)
Proprietary and Confidential © HSB Solomon Associates LLC
Rel
ativ
e C
ost
to P
rodu
ce Tr
ansp
orta
tion
Fuel
s (U
SD
/bbl
)
0 2 4 6 8 10 12 14 16 18 20 22
65
75
85
95
105
115
125 Latin America
Middle East
Other Asia
Europe
India/China
U.S./Canada
United States Refining Cost Advantage (2018)
Average relative costs for refineries that have closed
U.S./CanadaLatin AmericaEuropeMiddle EastOther AsiaIndia/China
22
BUSINESS STRATEGY AND CLIMATE-RELATED SCENARIO PLANNING
Resiliency of MPC Refining
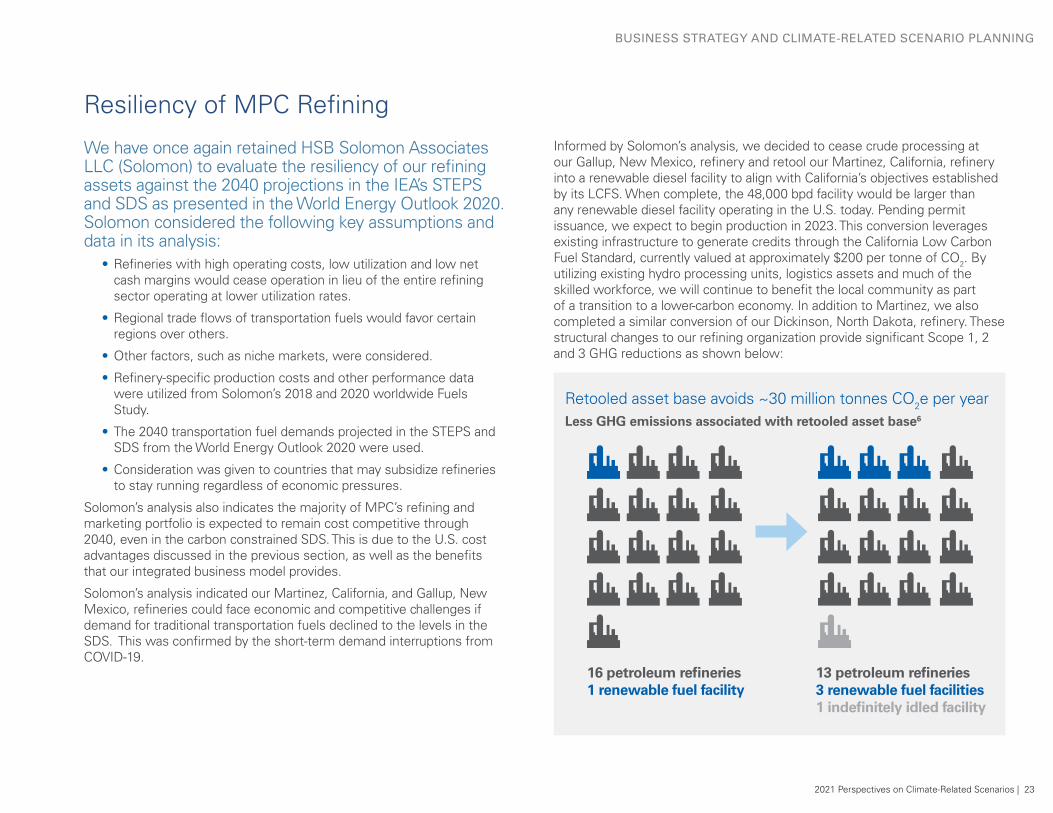
We have once again retained HSB Solomon Associates LLC (Solomon) to evaluate the resiliency of our refining assets against the 2040 projections in the IEA’s STEPS and SDS as presented in the World Energy Outlook 2020. Solomon considered the following key assumptions and data in its analysis:
• Refineries with high operating costs, low utilization and low net cash margins would cease operation in lieu of the entire refining sector operating at lower utilization rates.
• Regional trade flows of transportation fuels would favor certain regions over others.
• Other factors, such as niche markets, were considered.
• Refinery-specific production costs and other performance data were utilized from Solomon’s 2018 and 2020 worldwide Fuels Study.
• The 2040 transportation fuel demands projected in the STEPS and SDS from the World Energy Outlook 2020 were used.
• Consideration was given to countries that may subsidize refineries to stay running regardless of economic pressures.
Solomon’s analysis also indicates the majority of MPC’s refining and marketing portfolio is expected to remain cost competitive through 2040, even in the carbon constrained SDS. This is due to the U.S. cost advantages discussed in the previous section, as well as the benefits that our integrated business model provides.
Solomon’s analysis indicated our Martinez, California, and Gallup, New Mexico, refineries could face economic and competitive challenges if demand for traditional transportation fuels declined to the levels in the SDS. This was confirmed by the short-term demand interruptions from COVID-19.
Informed by Solomon’s analysis, we decided to cease crude processing at our Gallup, New Mexico, refinery and retool our Martinez, California, refinery into a renewable diesel facility to align with California’s objectives established by its LCFS. When complete, the 48,000 bpd facility would be larger than any renewable diesel facility operating in the U.S. today. Pending permit issuance, we expect to begin production in 2023. This conversion leverages existing infrastructure to generate credits through the California Low Carbon Fuel Standard, currently valued at approximately $200 per tonne of CO2. By utilizing existing hydro processing units, logistics assets and much of the skilled workforce, we will continue to benefit the local community as part of a transition to a lower-carbon economy. In addition to Martinez, we also completed a similar conversion of our Dickinson, North Dakota, refinery. These structural changes to our refining organization provide significant Scope 1, 2 and 3 GHG reductions as shown below:
Retooled asset base avoids ~30 million tonnes CO2e per yearLess GHG emissions associated with retooled asset base6
16 petroleum refineries1 renewable fuel facility
13 petroleum refineries3 renewable fuel facilities1 indefinitely idled facility
2021 Perspectives on Climate-Related Scenarios | 23
BUSINESS STRATEGY AND CLIMATE-RELATED SCENARIO PLANNING

Because roughly 75% of the life cycle GHG emissions from petroleum-based fuels result from consumer end use, a reduction in demand will be necessary to achieve the oil demand reduction modeled in the SDS — an annual reduction of approximately 33% by 2040. Removing this amount of oil from the global energy supply chain would result in an annual global reduction of about 3.5 billion tonnes of CO2. In essence, this is a Scope 3 goal for the global energy supply chain
Focus on Energy Focus on Water Combined Heat and Power (CHP)
• Only oil and gas company to receive the ENERGY STAR Partner of the Year – Sustained Excellence Award in 2020 and 2021.
• Five refineries achieved ENERGY STAR Certification, which recognizes those facilities that are in the top 25% of refineries in energy performance and have superior environmental compliance.
• Our energy efficiency program continues to reduce emissions and costs across our entire enterprise.
• The program has avoided the equivalent of 1.8 billion Btu/hr of energy across our refineries, which is equivalent to the energy used by approximately 100,000 homes.
• 10 year saving of more than $500 million.
2020 Accomplishments:
• Dedicated water technologist and coordinators to drive water reduction program.
• Completed water balances for all refinery locations.
• Developed key performance indicators impacting refinery water use at each location.
An effective way to increase efficiency is through cogeneration, a process that simultaneously produces electricity while capturing useful heat or steam for industrial uses. Five of our facilities have CHP systems that cogenerate electricity and steam. These facilities have avoided millions of tonnes of GHG emissions since they were installed.
Carbon Capture, Utilization and Sequestration (CCUS)
and is not a relevant goal for any one upstream, downstream or integrated oil company. It is, however, an indicator of risk that the energy supply chain must consider. For more information on Scope 3 emissions, including MPC’s Scope 3 emissions, please see Pages 7 and 8.
What is often lost in the low-carbon scenario narrative is the fact that the world in 2040 is still expected to need approximately 66% of the oil volume being used today. As a result, we are
focusing investments to position our refining assets for long-term competitiveness so that we can continue to refine a portion of that volume through 2040. One aspect of being successful is reducing our environmental footprint so the products we produce in 2040 are cleaner and less carbon intensive than today. Below are a few strategies we employ:
Focus on Water Target: Reduce freshwater withdrawal intensity by 20% below 2016 levels by 2030.
14% reduction in water withdrawals in water-stressed areas
CCUS SiteTonnes CO2
captured (2020)
Los Angeles, California, refinery 111,000
Martinez, California, refinery 22,000
Catcher Ranch, Oklahoma, gas plant 46,000
Albion, Michigan, ethanol plant 89,000
Greenville, Ohio, ethanol plant 91,000
Denison, Iowa, ethanol plant 62,000
Total CO2 captured 421,000
24
BUSINESS STRATEGY AND CLIMATE-RELATED SCENARIO PLANNING

Scenario Analysis of MPC’s Renewable Fuels Program
Scenario Projections for Renewable Liquid FuelsRenewable fuels are expected to play a role in reducing the carbon intensity of liquid fuels because they can displace a portion of petroleum-based fuels using existing engines. However, renewable fuels are not a complete replacement for petroleum fuels due to inherent limitations associated with renewable feedstocks that constrain overall volume. For instance, we should not, as a society, allow forests to be destroyed or food to be displaced in order to make fuel.
The other major constraint is economics. Renewable fuels rely heavily on government programs to incentivize production. Examples include the U.S. Renewable Fuel Standard (RFS), California Low Carbon Fuel Standard (LCFS) and various blending mandates throughout the world. Renewable feedstocks are often as expensive as finished petroleum-based transportation fuels even before any processing takes place. Thus, production is occurring because the subsidies created through the government programs make production economical. This is an example of a market-based program incentivizing behaviors to reduce greenhouse gases.7
Renewable fuels are derived from biomass and waste feedstocks and include ethanol, biogasoline, sustainable aviation fuel, biodiesel and renewable diesel. Because renewable fuels are sourced from biomass materials (e.g., plants and animal fats), the CO2 released from combusting these fuels is offset by the CO2 that was recently removed from the atmosphere by the biomass feedstock. Most renewable fuels today are not yet net-zero fuels because it takes energy to turn biomass material into fuel. For example, producing soy-based renewable diesel requires energy to plant and harvest soybeans, transport and process the soybeans into meal and oil, refine the oil into fuel, and transport and deliver the final product to consumers. The carbon emissions associated with each point in the value chain are added together to determine the carbon intensity (CI) of the fuel. Carbon reductions anywhere along the value chain, such as changes in farming practices or more efficient refining, will result in a lower CI value for the fuel.
Global Renewable Liquid Fuel Demand Projections through 2040 (million bpd)
0 2 4 6 8
2040E
2030E
2019 Actual
2010 Actual
The IEA projects that demand for renewable fuels will grow by 3 million to 5 million bpd through 2040. Public announcements through mid-2021 indicate over 300,000 bpd of additional barrels of biofuels capacity is already being planned over the next five years in the U.S. alone.
Over the next five years, we expect to increase renewable fuels production from just over 300 million gallons per year to nearly 1.2 billion in 2025. This is driven through investments in renewable diesel and sustainable aviation fuel, which are fuels needed for hard to decarbonize sectors.
Source: IEA, World Energy Outlook 2020; adapted from IEA (2021), Net Zero by 2050, IEA, Paris
NZE2050SDSSTEPS
2021 Perspectives on Climate-Related Scenarios | 25
BUSINESS STRATEGY AND CLIMATE-RELATED SCENARIO PLANNING

Comparing the Carbon Intensity (CI) of Different Fuels
gCO2e/MJ = grams of carbon dioxide equivalent per megajoule of energy.
Source: Adapted from California Air Resources Board, Approved Pathways as of July 27, 2020 and internal projections.
Diesel~100
gCO2e/MJ
Oil Extraction Transportation Transportation CombustionPetroleum Refining
Crude Oil
RenewableDiesel
(soy-based)~53-58
gCO2e/MJ
Land use change and
farming soybeans
Soybean oil extraction Biorefining
Transportation/Blending
Transport of soybean
oil Combustion
CO2 emissions are offset by the CO2 emissions previously removed from the plant material
Soybeans
Regenerative Farming – How Farms Can Help Fight Climate Change and Produce Renewable Diesel
Regenerative farming is a set of farming practices such as low/no tillage, cover crops and lower chemical inputs to improve soil health, resulting in increased bio-sequestration of carbon, improved water retention and more biodiversity. Regenerative farming is a powerful tool to reduce carbon emissions as plants, including soybeans, can sequester 0.5 to 1.0 tonnes of CO2e per acre by drawing down carbon dioxide from the atmosphere, where it can be consumed by the plant with the balance remaining in the soil to increase microbe activity and improve soil health.
As a purchaser of crop-based renewable feedstocks, MPC has a keen interest in ensuring the farm practices used to produce our feedstocks, including soybean oil, promote regenerative farming. That is why we are working with soybean suppliers and farmers to promote regenerative farming practices. By sourcing regeneratively farmed feedstocks, we will reduce our Scope 3 emissions and progress toward producing a net-zero renewable diesel fuel.
MPC is also working with a broad coalition that includes farmers, feedstock suppliers, food companies and governments to develop programs that will assist, incentivize and reward farmers for employing regenerative farming practices. If all farmland in the U.S. were converted to regenerative practices, the U.S. could reduce net GHG emissions by hundreds of millions of tonnes per year.
Renewable Diesel(using
regeneratively farmed soy and carbon
optimization)
Potentially NET-ZERO
0 gCO2e/MJ
Regenerative Agriculture
Soy oil extraction Biorefining
Transportation/Blending
Transportation of soy oil Combustion
CO2 emissions are considered offset by the carbon previously
removed from atmosphere by the plant material.
Soybeans w/ Carbon Optimized
Nature-based carbon
sequestration in soil
Carbon capture, utilization and
sequestration (CCUS)
Renewable electricity
26
BUSINESS STRATEGY AND CLIMATE-RELATED SCENARIO PLANNING

MPC’s Renewable Fuels Program Scenario Analysis
MPC Renewable Fuels Production Increases 2019-2025
Cincinnati BiodieselDickinson Renewable Diesel
Andersons/Marathon JVMartinez Renewable Diesel
MPC is a market leader in the production and delivery of renewable fuels. In 2020, we delivered approximately 2.1 billion gallons to consumers, which avoided nearly 9 million tonnes of customers’ CO2 transportation emissions. This was a slight decrease from 2019 due to lower blended volumes of renewables that resulted from declines in demand associated with the COVID-19 pandemic. Over the next five years, MPC expects to increase renewable fuels production from just over 300 million gallons per year to nearly 1.2 billion.
We are doing this, in part, by converting petroleum refineries into renewable diesel facilities. In 2020, we completed the approximately $500 million conversion of our 19,000 bpd Dickinson, North Dakota, refinery into a 12,000 bpd renewable diesel production facility that converts biogenic oils (e.g. distillers corn oil, soybean oil and tallow) into renewable diesel. The Dickinson facility is currently the second-largest renewable diesel production facility operating in the U.S. This is a good example of supporting an energy transition by using an existing asset and workforce to help a community transition to a lower-carbon future.
Our renewable diesel is a drop-in fuel that can be used as fuel in existing infrastructure and diesel engines. In addition to the Dickinson facility, we are also progressing the conversion of our 161,000 bpd Martinez, California, refinery into a 48,000 bpd renewable diesel production facility. When complete, the Martinez facility will be larger than any renewable diesel production facility operating in the U.S. today.
Renewable Electricity
MPC is investing in an on-site wind energy project that will be dedicated to
the facility.
Carbon capture, utilization and sequestration (CCUS)
We are evaluating the installation of a system to capture the CO2 produced from the on-site hydrogen plant and
then pumping the CO2 deep below the site where it will remain sequestered.
CO2e
Regenerative Agriculture
MPC is working with farmers to identify and optimize practices that reduce greenhouse gas
emissions and increase carbon storage in agricultural lands.
Because of the volume constraints inherent with renewable feedstocks, we are heavily focused on reducing the carbon intensity of the biofuels we manufacture. For instance, we are progressing three projects at our Dickinson, North Dakota, facility that have the potential to produce a NET-ZERO FUEL.
0 200 400 600 800 1,000 1,200 1,400
2021E
2022E
2023E
2024E
2025E
2019
2020
2021 Perspectives on Climate-Related Scenarios | 27
BUSINESS STRATEGY AND CLIMATE-RELATED SCENARIO PLANNING

Advanced Biofuels Research and Development
Virent – Investing in the Future
Virent is a wholly-owned subsidiary of MPC working to commercialize its BioForming® platform for converting biobased feedstocks into low carbon renewable fuels and chemicals. Based on a groundbreaking and novel catalytic process, the BioForming platform has the potential to make a broad impact on the future bioeconomy by introducing pathways for producing both renewable fuels and chemicals from the carbohydrate portion of plants, while also making use of wind, solar and hydrogen derived from renewable resources to achieve net-zero or lower carbon products.
Virent’s current focus is on the deployment of its aromatics process for producing biogasoline, and aromatic jet fuel components from corn starch as a first-generation feedstock. The same process also produces bioparaxylene (a key raw material for the production of polyester fibers and packaging), and biobenzene for use as a raw material in producing engineered plastics and other products. The process can also use cane sugar or beet sugar, with the ultimate goal of using sugar feedstocks derived from wood and agricultural wastes, once available.
The company has made great progress on efforts to ensure that the technology is ready for commercial deployment. At its facility in Madison, Wisconsin, Virent has produced over 22,000 gallons of its BioFormate® product for fuels testing and over 14 tonnes of bioparaxylene for testing and market demonstrations using its demonstration plant. Its biogasoline product (BioForm® gasoline)
has been approved by the EPA for blending in gasoline up to 45%, while its jet fuel product (BioForm® SAK) has undergone flight testing and shown a reduction in particulate emissions at altitude and during engine performance monitoring.
Using wind and solar energy, CCUS, as well as hydrogen from renewable natural gas and other resources, could open the door for the BioForming platform to provide net-zero or even negative-carbon fuels and chemicals to the market. Future use of lignocellulosic feedstocks, such as woody biomass, corn stover and sugar cane bagasse, as well as low-carbon corn, cane and beet sugars, has
the potential to reduce the overall carbon footprint even further.
As part of its research and development efforts, Virent is continuing to explore opportunities to expand the BioForming platform to provide new technologies that will have a positive impact on the bioeconomy. This includes its proprietary technologies for converting lignocellulosic feedstocks, the production of hydrogen and diesel fuel from carbohydrates, and the ability to produce jet fuel and renewable chemicals from ethanol.
The Virent Bioforming® Platform
DIESEL
JET
BioForm® Gasoline
BioForm® SAK Jet Fuel
BioForm® Renewable Diesel
BioForm® SAK Jet Fuel
BioForm® PX Bioform® Benzene
®
Biomass Deconstruction
GAS
JET®
BioForming® Process
®
Aromatics Processing(BioFormate®)
®
Distillate Processing
Corn Stover
Bagasse
Wood
Cellulosic Sugars
Corn Dry Mill Sugars
Corn Wet Mill Sugars
Cane Sugar
Beet Sugars
RNGWind Solar
CCUS
Converting Sugars to Renewable Fuels and Chemicals
28
BUSINESS STRATEGY AND CLIMATE-RELATED SCENARIO PLANNING
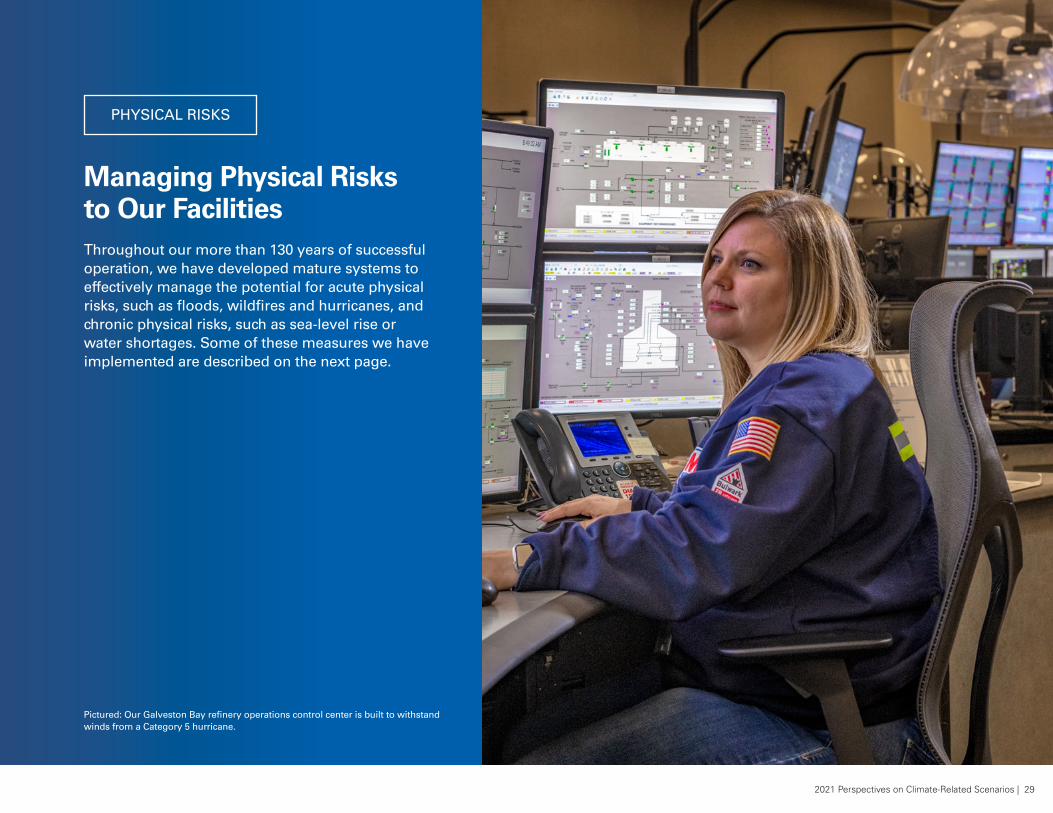
Managing Physical Risks to Our Facilities Throughout our more than 130 years of successful operation, we have developed mature systems to effectively manage the potential for acute physical risks, such as floods, wildfires and hurricanes, and chronic physical risks, such as sea-level rise or water shortages. Some of these measures we have implemented are described on the next page.
PHYSICAL RISKS
Pictured: Our Galveston Bay refinery operations control center is built to withstand winds from a Category 5 hurricane.
2021 Perspectives on Climate-Related Scenarios | 29

Facility Design and Asset HardeningOur facilities are designed, constructed and operated to withstand a variety of extreme weather and environmental conditions. Based on our experience, we continually assess whether additional measures are necessary, and we have spent hundreds of millions of dollars “hardening” our assets where appropriate. For instance, when we constructed the wharf at our Martinez, California, facility, we factored a potential sea-level rise into the design. We have also upgraded control rooms at our Garyville refinery in Louisiana and our Galveston Bay refinery in Texas City, Texas, to withstand wind and storm surges characteristic of the most extreme weather in their locations.
Our refineries on the U.S. Gulf Coast are also protected from storm surges, high waves and flooding by infrastructure currently in place, with more being planned. Our Galveston Bay refinery in Texas City, Texas, is already well protected by a levee, ranging in height from 19 to 23 feet, which protects 36 square miles of land in the Texas City area. This levee has provided adequate protection through several storms, including Hurricane Ike in 2008, which was accompanied by an unprecedented Category 4 storm surge, and Hurricane Harvey in 2017, which was accompanied by record rainfall and regionwide flooding.
Our Garyville refinery is favorably located on a local high point, which provides a natural barrier to flooding. The refinery is also protected by a levee along the Mississippi River and is near several spillways both upstream and downstream of the refinery.
After construction of a facility or asset, we continue to monitor and manage integrity and adjust as necessary based on changing conditions. An example is the integrity management of our pipeline system, where we monitor stream crossings throughout our pipeline network using a powerful combination of physical inspections and predictive modeling. By doing so, we have identified pipeline segments that we plan to proactively relocate deeper below waterway beds to reduce the risk of future scouring if flow conditions change.
Emergency Preparedness and ResponseBeyond maintaining our physical assets, we also prepare and train personnel to respond in the event of an emergency such as a major flood, fire or hurricane. We have a dedicated Emergency Management Group (EMG) that coordinates preparedness and response activities throughout the company so that we can respond rapidly and appropriately to an emergency incident.
We train personnel in the Incident Command System, a globally recognized organizational structure designed to integrate resources across multiple agencies and organizations when an emergency event occurs. To maintain readiness, we conduct training sessions that include tabletop exercises with a review of our emergency plans and resources. We also conduct periodic training simulations that involve federal organizations, such as the U.S. EPA or the U.S. Coast Guard, state environmental protection or wildlife agencies, and local emergency responders.
Our robust programs and procedures allow us to safely maintain our operations throughout severe weather incidents and quickly recover. We have standing agreements in place for alternate workspaces, necessary office equipment and multiple means to maintain internet and telephone connectivity, even during prolonged power outages. We also have agreements for supplies such as generators, repair materials, water and more. We maintain an emergency mass notification system to communicate with personnel before, during and after an emergency. This information is vital to providing humanitarian aid to our personnel, contractors and local communities.
We also have a Business Recovery Team (BRT) that responds during emergency situations to maintain transportation fuel supplies to affected areas. The BRT coordinates supply and transportation methods throughout our operational areas. The team’s efforts help ensure fuel supplies reach affected areas, facilitating recovery efforts and enabling daily life and normal operations to resume as quickly as possible.
30
PHYSICAL RISKS

Focus on Water Program Fresh water is vital to our operations. It is used to add heat to our refining process (as steam), remove heat from the process (as cooling water), remove salts and impurities from crude oil, protect equipment from corrosion, generate hydrogen, control emissions and clean equipment during maintenance activities.
Water availability is a major concern throughout much of the world and parts of the U.S. Climate change, together with population growth, could further exacerbate water stress. Currently, two of MPC’s operating refineries – El Paso, Texas, and Los Angeles, California – are located in water-stressed regions as defined by the Global Reporting Initiative (GRI) and World Resources Institute assessment tools. We ceased crude processing at two additional refineries located in water-stressed areas in 2020 – Gallup, New Mexico, and Martinez, California – significantly reducing the amount of water used in stressed areas. Although we are progressing the conversion of our Martinez facility to produce renewable diesel, this facility will use approximately 1 billion fewer gallons of water per year than previously.
In 2020, we focused on program development to ensure long-term success. We modeled our “Focus on Water” program on the success of our “Focus on Energy” program, which is the basis for our ENERGY STAR Partner of the Year – Sustained Excellence recognition. The program is designed to help sites assess their water use, understand and mitigate water risks and identify opportunities to reduce water use. To ensure success, we also established a companywide target to reduce freshwater withdrawal intensity by 20% by 2030 from 2016 levels.
In 2020, the first year of the program, we documented companywide water reductions of approximately 570 million gallons per year, saving over $2.6 million. Some of the key areas where significant savings were realized include:
• Increasing cycles of concentration: By using a new anti-scaling dispersant in cooling towers at our Los Angeles refinery, we were able to increase the number of times water could be cycled back through the towers, which reduced the amount of fresh water required by 159 million gallons per year. Similar programs were implemented at our Galveston Bay refinery in Texas, and Salt Lake City, Utah, refinery, saving an additional 12 million gallons per year.
• Reusing and recycling wastewater effluent: We continue to operate a temporary reverse osmosis (RO) system during summer months at our Detroit refinery to reuse a portion of the plant’s treated effluent. We saved more than 71 million gallons of water in 2020 and are progressing plans to invest in a permanent RO system that would recycle up to 580 million gallons of water per year. We also continue to recycle municipal wastewater at our Los Angeles, California, and Dickinson, North Dakota, facilities.
• Optimizing filter backwash: Backwashing refers to pumping clean freshwater backward through a filter media to clean the filters of particulate matter and other captured impurities. By optimizing the frequency and duration of backwashing, along with using recycled water, we were able to reduce freshwater use by over 200 million gallons per year at our Galveston Bay refinery in Texas, and Catlettsburg, Kentucky, refinery.
We will continue to use the lessons learned from the projects we implemented in 2020 to drive additional improvements to meet our water reduction goal.
FACILITY DESIGN
Our MPLX gas processing plants are designed to use little to no water in their routine operations. Instead of using steam for heating and water for cooling, nearly all our plants have hot oil heaters that transfer heat to the process and air-cooling units that circulate hot product through air-cooled radiators. These measures eliminate the need for cooling towers and steam boilers that rely on fresh water.
Focus on Water Target: Reduce freshwater withdrawal intensity by 20% below 2016 levels by 2030.
14% reduction in water withdrawals in water-stressed areas
2021 Perspectives on Climate-Related Scenarios | 31
PHYSICAL RISKS

At MPC, we identify andmanage climate-related risksand opportunities at all levels of our organization under the leadership and guidance of our Board of Directors. The Board’s committees, including the Sustainability and Public Policy Committee, are responsible for specific areas of oversight and policy decision-making. Specific responsibilities are set forth in our Corporate Governance Principles and each committee’s charter.
GOVERNANCE
32

Board Oversight
Sustainability GovernanceAt MPC, our impacts, risks and opportunities related to ESG topics are identified and managed by company leadership with the oversight of our Board.
The Board has four committees, each of which is responsible for specific areas of oversight and policy decision-making, as set forth in our Corporate Governance Principles and each committee’s charter.
Our executive leadership team has primary responsibility for sustainability strategies and standards. Sustainability is embedded in several cross-functional leadership committees that help ensure our objectives are incorporated into our OEMS standards and sustainability strategies. These are in turn cascaded throughout the organization. These standards and strategies are developed by committees of the executive leadership team and aligned with related procedures and plans at the operational level.
Communication and collaboration among the Board, its committees and management are critical to maintaining our aligned direction on sustainability matters.
Board of Directors
Audit Committee
Compensation and Organization Development
Committee
Corporate Governance and Nominating Committee
Sustainability and Public Policy Committee
ESG Responsibilities and Oversight:
• Enterprise risk management process
• Legal and regulatory compliance
• ESG-related financial reporting
• Business integrity and compliance
• Business continuity
• Cybersecurity and data privacy
• Human capital management strategies and policies, including diversity, equity and inclusion initiatives, as well as pay equity, talent and performance management practices
• Stakeholder engagement for compensation and human capital management matters
• Board succession planning and commitment to diversity
• Codes of conduct and corporate policies
• Legislative and regulatory developments and stakeholder engagement relating to corporate governance matters
• Development of policies and programs regarding sustainability, ESG and HES&S
• Climate change and sustainability reporting and targets
• Oversight of public policy positions
• Governance framework and budgets for political contributions and lobbying activities
• Legislative and regulatory developments and stakeholder engagement relating to sustainability, ESG and public policy matters
MPC Executive Leadership Team
Sustainability is embedded across executive committees with responsibility for sustainability strategies and standards
External Policy CommitteeHealth, Environment, Safety and Security (HES&S) Management
Committee
Enterprise Risk Management Committee Strategic Steering Committee
Leadership Team
Drives sustainability strategies across the enterprise
ESG & Sustainability Working Group HES&S Planning Committee Renewable Energy Steering Committee
Cross-Organization Teams
Implement key sustainability strategies, programs and plans
Environmental Justice TeamClimate Policy and
Strategy TeamEmbedding and
Communicating ESG TeamFocus on Water and
Focus on Energy Teams
HES&S Planning Committee Renewable Energy Steering CommitteeESG and Sustainability Working Group
2021 Perspectives on Climate-Related Scenarios | 33
GOVERNANCE

Risk Management
Board of Directors
Oversight of Risk Management
Audit Committee
Compensation and Organization Development Committee
Corporate Governance and Nominating Committee
Sustainability and Public Policy Committee
Executive Leadership Team
Establish and drive ERM Strategies
ERM Committee
Directs ERM process for identifying, assessing, and managing enterprise risk Monitors the performance of risk mitigation strategies
Roles and Responsibilities
Enterprise Risk Management (ERM) Program Enterprise Risk Management is how we identify, assess, and manage enterprise-level risks, and review the effectiveness of risk-mitigation strategies.
Enterprise level risks include environmental, social and governance risks such as climate- and compliance-related risks, as well as those risks described in our Annual Report on Form 10-K and other filings with the Securities and Exchange Commission.
ERM Process Our ERM process is continuous and dynamic to help us identify emerging risks that may impact our ability to operate and efficiently allocate resources. The process involves a cross-functional review of potential enterprise-level risks, including sustainability risks. Our enterprise risk manager leads the process through quarterly leadership workshops that involve key leaders
with responsibility for our sustainability priorities. Our risk analysis includes an examination of the causes and consequences of each enterprise-level risk, as well as the development of strategies to mitigate risks — imminent and potential — and position the company to capitalize on new opportunities.
ERM Community We have formed an ERM community to support the ERM Committee. It comprises mid-level risk and assurance representatives across our value chain and meets quarterly to discuss, develop, standardize and integrate risk management best practices throughout the company to support risk-based decision-making.
The Board and Executive Leadership Team routinely review and discuss enterprise-level risks and strategies, and the Board’s Audit Committee further reviews our ERM process and performance trends and oversees internal processes to evaluate their effectiveness.
Climate-Related Risk We carefully review, evaluate and manage climate-related risks and opportunities to ensure our ability to adapt and strengthen our resiliency. These include both transitional and physical risks, which we regularly discuss with the Board’s Sustainability and Public Policy Committee and executive and senior leadership committees.
Compliance-Related Risk As part of our ERM process, our Board oversees risks related to the regulatory landscape, including emerging and proposed regulations related to issues that have the potential to impact our business, such as greenhouse gas and other air emissions, water withdrawals and effluents, hazardous materials management, product specifications, and employee health and safety.
Identification and Disclosure of Risks We disclose risks to our company in the Risk Factors section of our Annual Report on Form 10-K and Quarterly Reports on Form 10-Q that are filed with the U.S. Securities and Exchange Commission. Categories of risk described in these reports include:
• Business and Operational Risks
• Financial Risks
• Legal and Regulatory Risks
• Strategic Transaction Risks
• General Risk Factors
34
GOVERNANCE

Each year we measure our performance on a variety of environmental, social and governance (ESG) metrics and report them in our annual Sustainability Report available on our website at www.marathonpetroleum.com/sustainability.
The graphs to the right and the table on Page 36 include select metrics from our Sustainability Report relevant to climate-related risks. Last year, we became the first independent U.S. refiner to create a companywide goal for reducing greenhouse gas emissions intensity and link it to employee and executive compensation. Through 2020, we have achieved a 21% reduction below 2014 levels, and are targeting 30% by 2030.
Last year, we also began our “Focus on Methane” program and established a goal to reduce our methane emissions intensity at our natural gas gathering and processing assets by 50% below 2016 levels through 2025. While these voluntary efforts are important, we continue to work with policymakers and regulators to improve methane controls throughout the natural gas value chain to minimize emissions and maximize the substantial benefits of natural gas.
This year, we established a companywide goal to reduce freshwater withdrawal intensity by 20% below 2016 levels through 2030 after formally kicking off our “Focus on Water” program in 2020. We are also enhancing our disclosures this year by including an estimate of Scope 3 emissions from the use of our sold products.
METRICS AND TARGETS Target: Reduce Scope 1&2 GHG emissions intensity 30% by 2030 from 2014
Progress: at 21%0% 30%
Target: Reduce MPLX G&P methane emissions intensity 50% by 2025 from 2016
Target: Reduce freshwater withdrawal intensity 20% by 2030 from 2016 levels
Progress: at 9%0% 20%
Company GHG Emissions Intensity (Scope 1 and Scope 2 Emissions)
2014
10
20
30
2017 2020 2023 2026 2029
tonn
es C
O 2e/m
boe
man
ufac
turin
g in
puts
Actual GHG Emissions Intensity2030 GHG Goal
Freshwater Withdrawal Intensity
Actual Freshwater Withdrawal Intensity2030 Freshwater Withdrawal Goal
Meg
alite
rs /
mill
ion
boe
man
ufac
turin
g in
puts
201670
80
100
2018 2020 2022 2026 2028
90
20302024
MPLX G&P Methane Emissions Intensity
Actual Methane Emissions Intensity2025 Methane Goal
MM
cf C
H4 /
MM
cf n
atur
al g
as th
roug
hput
2016
0.01%
0.02%
0.04%
2018 2020 2022 2024
0.03%
2030
2025Progress at 22%0% 50%
2021 Perspectives on Climate-Related Scenarios | 35
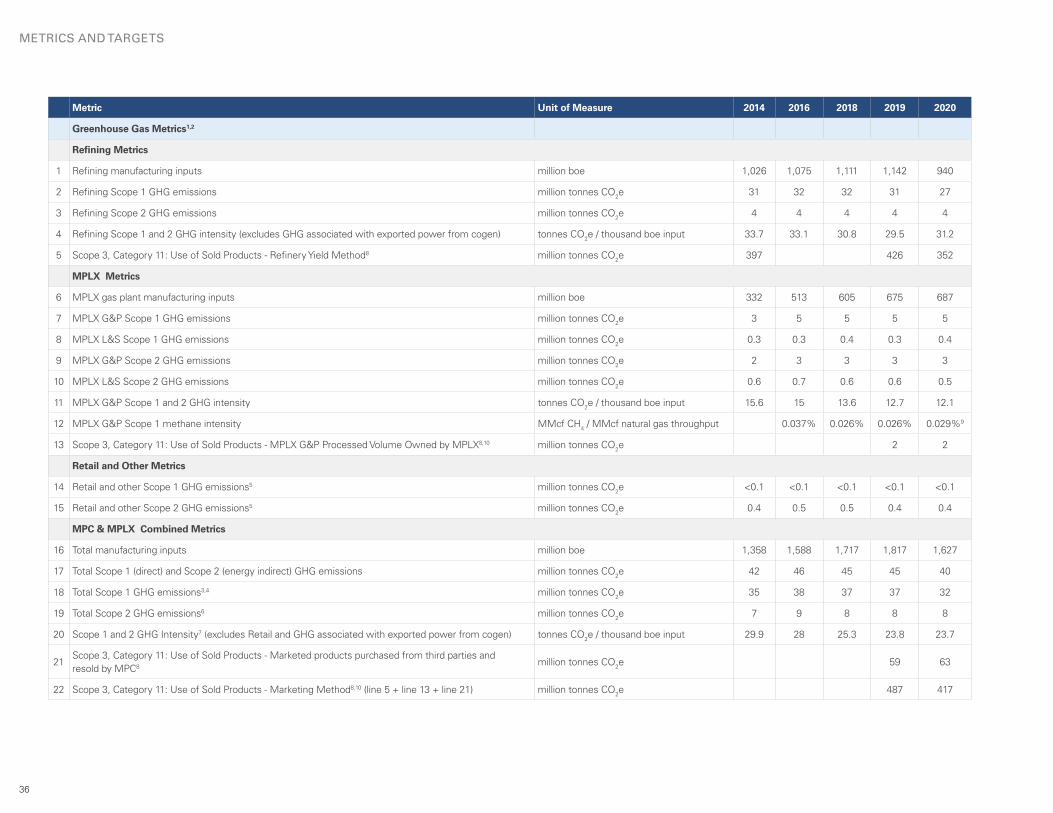
Metric Unit of Measure 2014 2016 2018 2019 2020
Greenhouse Gas Metrics1,2
Refining Metrics
1 Refining manufacturing inputs million boe 1,026 1,075 1,111 1,142 940
2 Refining Scope 1 GHG emissions million tonnes CO2e 31 32 32 31 27
3 Refining Scope 2 GHG emissions million tonnes CO2e 4 4 4 4 4
4 Refining Scope 1 and 2 GHG intensity (excludes GHG associated with exported power from cogen) tonnes CO2e / thousand boe input 33.7 33.1 30.8 29.5 31.2
5 Scope 3, Category 11: Use of Sold Products - Refinery Yield Method8 million tonnes CO2e 397 426 352
MPLX Metrics
6 MPLX gas plant manufacturing inputs million boe 332 513 605 675 687
7 MPLX G&P Scope 1 GHG emissions million tonnes CO2e 3 5 5 5 5
8 MPLX L&S Scope 1 GHG emissions million tonnes CO2e 0.3 0.3 0.4 0.3 0.4
9 MPLX G&P Scope 2 GHG emissions million tonnes CO2e 2 3 3 3 3
10 MPLX L&S Scope 2 GHG emissions million tonnes CO2e 0.6 0.7 0.6 0.6 0.5
11 MPLX G&P Scope 1 and 2 GHG intensity tonnes CO2e / thousand boe input 15.6 15 13.6 12.7 12.1
12 MPLX G&P Scope 1 methane intensity MMcf CH4 / MMcf natural gas throughput 0.037% 0.026% 0.026% 0.029%9
13 Scope 3, Category 11: Use of Sold Products - MPLX G&P Processed Volume Owned by MPLX8,10 million tonnes CO2e 2 2
Retail and Other Metrics
14 Retail and other Scope 1 GHG emissions5 million tonnes CO2e <0.1 <0.1 <0.1 <0.1 <0.1
15 Retail and other Scope 2 GHG emissions5 million tonnes CO2e 0.4 0.5 0.5 0.4 0.4
MPC & MPLX Combined Metrics
16 Total manufacturing inputs million boe 1,358 1,588 1,717 1,817 1,627
17 Total Scope 1 (direct) and Scope 2 (energy indirect) GHG emissions million tonnes CO2e 42 46 45 45 40
18 Total Scope 1 GHG emissions3,4 million tonnes CO2e 35 38 37 37 32
19 Total Scope 2 GHG emissions6 million tonnes CO2e 7 9 8 8 8
20 Scope 1 and 2 GHG Intensity7 (excludes Retail and GHG associated with exported power from cogen) tonnes CO2e / thousand boe input 29.9 28 25.3 23.8 23.7
21Scope 3, Category 11: Use of Sold Products - Marketed products purchased from third parties and resold by MPC8 million tonnes CO2e 59 63
22 Scope 3, Category 11: Use of Sold Products - Marketing Method8,10 (line 5 + line 13 + line 21) million tonnes CO2e 487 417
36
METRICS AND TARGETS

Metric Unit of Measure 2014 2016 2018 2019 2020
Water (MPC and MPLX Combined)
23 Freshwater withdrawal thousand Megaliters 156 158 162 144
24 Water discharge thousand Megaliters 83 86 89 82
25 Fresh water withdrawal in stressed areas thousand Megaliters 44 45 44 38
26 Water discharge in stressed areas thousand Megaliters 21 20 21 18
27 Freshwater withdrawal intensity Megaliters / million boe 98 92 89 89
NOTES
1 Data before 2019 inclusive of facilities that MPC did not yet own so that performance can be compared across the same asset base over time. Assets included are those that MPC owned/operated as of Dec. 31, 2019, unless otherwise noted.
2 GHG and Water data reported for facilities of which MPC has operational control.
3 Scope 1 direct GHG emissions include those from Refining, Midstream and Retail/other and are typically calculated per the EPA’s Mandatory Greenhouse Gas Reporting Program or the 2009 API Compendium of Greenhouse Gas Emissions Methodologies for the Oil and Natural Gas Industry. Global Warming Potentials used are from Table A-1 to Subpart A of 40 CFR Part 98 as of the year they were reported. It includes emissions from fuel combustion, company vehicles and fugitive emissions.
4 Inclusive of carbon dioxide (CO2), methane (CH4), and nitrous oxide (N2O). Nitrogen trifluoride (NF3), hydrofluorocarbons (HFC), and perfluorocarbons (PFC) emissions are considered to not be material to our operations and are therefore excluded.
5 “Other” includes the administrative office complex in Findlay, Ohio.
6 Scope 2 emissions include indirect GHG emissions from consumption of purchased electricity, heat or steam.
7 This is the metric used to measure our 2030 GHG intensity goal.
8 For an explanation of Scope 3 emissions, please see Pages 7 and 8.
9 Excluding a one-time emission event would result in a leak rate of 0.023%, indicating the program is resulting in long-term emission reductions.
10 Over 99% of the natural gas and 97% of the NGLs processed through our MPLX assets are not owned or marketed by MPLX. Scope 3 emissions from processed volumes owned by third parties were 188 million tonnes of CO2e in 2019 and 191 million tonnes of CO2e in 2020.
The external assurance statement from Lloyds Register Quality Assurance, Inc. relating to our GHG data is available athttps://www.marathonpetroleum.com/htmlEmails/LRQA/LR_Independent_Assurance_Statement.pdf
2021 Perspectives on Climate-Related Scenarios | 37
METRICS AND TARGETS

TCFD Recommendation Section Page
Governance
Disclose the organization’s governance around climate-related risks and opportunities.
Describe the board’s oversight of climate-related risks and opportunities.Governance: Board of Directors
32 - 34
Describe management’s role in assessing and managing climate-related risks and opportunities. Governance: Executive Leadership 32 - 34
Strategy
Disclose the actual and potential impacts of climate-related risks and opportunities on the organization’s businesses, strategy, and financial planning where such information is material.
Describe the climate-related risks and opportunities the organization has identified over the short, medium and long term.
Business Strategy and Climate-Related Scenario Planning
9 - 28
Describe the impact of climate-related risks and opportunities on the organization’s businesses, strategy and financial planning.
Midstream Refining and Marketing Renewable Fuels Program
11 - 18 19 - 24 25 - 28
Describe the resilience of the organization’s strategy, taking into consideration different climate-related scenarios, including a 2°C or lower scenario.
Business Strategy and Climate-Related Scenario Planning
9 -28
Risk Management
Disclose how the organization identifies, assesses and manages climate-related risks.
Describe the organization’s processes for identifying and assessing climate-related risks. Governance 32 - 33
Describe the organization’s processes for managing climate-related risks.Risk Management Physical Risks
34 29 - 31
Describe how processes for identifying, assessing and managing climate-related risks are integrated into the organization’s overall risk management.
Risk Management 34
Metrics and Targets
Disclose the metrics and targets used to assess and manage relevant climate-related risks and opportunities where such information is material.
Disclose the metrics used by the organization to assess climate-related risks and opportunities in line with its strategy and risk management process.
Metrics and Targets 35
Disclose Scope 1, Scope 2, and, if appropriate, Scope 3 greenhouse gas (GHG) emissions, and the related risks. Scope 3 Emissions Explained7 - 8, 36 - 37
Describe the targets used by the organization to manage climate-related risks and opportunities and performance against targets.
Metrics and Targets 35
The table below shows how the disclosures in this report align with the recommendations of the Financial Stability Board’s Task Force on Climate-Related Financial Disclosures (TCFD), as the TCFD has described the categories, and where the relevant information can be found in this report.
TCFD Recommendations
38

Endnotes1 Because both energy demand and the ability to produce wind and solar energy differ significantly by region, each region has an optimal ratio of gas and renewables that would
assure grid reliability at the most affordable cost. For simplicity, we have assumed that coal will be displaced with 50% gas and 50% renewables as a basis for potential emission reductions.
2 The expected rise in coal use in 2021 dwarfs that of renewables by almost 60%, even as electricity generation from renewables is set to leap by more than 8%. More than 80% of the projected growth in coal use is set to come from Asia, led by China, whereas coal use in the United States and the European Union will remain well below pre-pandemic levels. IEA, Global Energy Review 2021.
3 This assumes coal generation would be replaced with 50% natural gas generation and 50% renewable electricity.4 S&P Global Platts, NGL Facilities Databank (February 1, 2021).5 The IEA does not provide regional projections of capacity at risk under the SDS or NZE2050.6 Estimate. Encompasses MPC’s emissions from operating the facilities, as well as customers’ and suppliers’ GHG emissions associated with facility inputs and products. 7 There are many opportunities with abatement costs far below the $200 per tonne of CO2 costs associated with the California LCFS. As a result, we believe a national economy-wide program with a gradual price escalation would assure the lowest-cost abatements are completed first.
Forward-Looking Statements
This publication includes forward-looking statements that are subject to risks, contingencies or uncertainties. You can identify our forward-looking statements by words such as “anticipate,” “believe,” “commitment,” “could,” “design,” “estimate,” “expect,” “forecast,” “goal,” “guidance,” “imply,” “intend,” “may,” “objective,” “opportunity,” “outlook,” “plan,” “policy,” “position,” “potential,” “predict,” “priority,” “project,” “proposition,” “prospective,” “pursue,” “seek,” “should,” “strategy,” “target,” “would,” “will,” or other similar expressions that convey the uncertainty of future events or outcomes. We have based our forward-looking statements on our current expectations, estimates and projections about our business and industry. We caution that these statements are not guarantees of future performance and you should not rely unduly on them, as they involve risks, uncertainties and assumptions that we cannot predict. Material differences between actual results and any future performance suggested in our forward-looking statements could result from a variety of factors, many of which are beyond our control, including without limitation the risks and uncertainties discussed under “Disclosures Regarding Forward-Looking Statements” and “Risk Factors” in MPC’s annual report on Form 10-K for the year ended Dec. 31, 2020, its quarterly Form 10-Q filings and other filings made with the SEC from time to time; the effects of any divestitures on the business or our financial condition, results of operations and cash flows; consumer demand for refined products and renewable fuels; the success or timing of completion of ongoing or anticipated capital or maintenance projects, including the potential conversion of the Martinez Refinery to a renewable fuels facility; the receipt of relevant third party and/or regulatory approvals; our ability to successfully implement our sustainable energy strategy and principles, including our GHG intensity, methane intensity and freshwater withdrawal intensity targets, and realize the expected benefits thereof; general economic, political or regulatory developments, including changes in governmental policies relating to refined petroleum products, crude oil, natural gas or NGLs, regulation or taxation and other economic and political developments (including those caused by public health issues and outbreaks); and compliance with federal and state environmental, economic, health and safety, energy and other policies and regulations, including the cost of compliance with the Renewable Fuel Standard, and/or enforcement actions initiated thereunder. MPC undertakes no obligation to update any forward-looking statement except to the extent required by applicable law. Copies of MPC’s Form 10-K, Forms 10-Q and other SEC filings are available on the SEC’s website, MPC’s website at https://www.marathonpetroleum.com/Investors/ or by contacting MPC’s Investor Relations office.
References in this report to “materiality,” “material,” and similar terms, when used in the context of economic, environmental and social topics, are defined in the referenced sustainability standards, and are not intended to correspond to the concept of materiality under the U.S. securities laws and/or disclosures required by the U.S. Securities and Exchange Commission.
2021 Perspectives on Climate-Related Scenarios | 39

Marathon Petroleum Corporation
Corporate Headquarters539 S. Main St.Findlay, Ohio 45840marathonpetroleum.com
2020 AccomplishmentsENERGY STAR Partner of the Year Sustained Excellence Award
Five Refineries ENERGY STAR CertifiedAnacortes, WashingtonCanton, Ohio Garyville, LouisianaRobinson, IllinoisSt. Paul Park, Minnesota
Four Terminals Achieved the ENERGY STAR Challenge for IndustryCharleston Terminal, West VirginiaNashville 51st Terminal, TennesseeNashville Downtown Terminal, TennesseeYoungstown Terminal, Ohio