geohydrology, water quality, and water … · figure 1. trilinear diagram showing quality of...
TRANSCRIPT

GEOHYDROLOGY, WATER QUALITY, AND WATER BUDGETS OF
GOLDEN GATE PARK AND THE LAKE MERCED AREA IN THE
WESTERN PART OF SAN FRANCISCO, CALIFORNIA
By Eugene B. Votes, Scott N. Hamlin, and Lisa Horowitz McCann
U.S. GEOLOGICAL SURVEY
Water-Resources Investigations Report 90-4080
Prepared in cooperation with the
SAN FRANCISCO WATER DEPARTMENT
Sacramento, California 1990

DEPARTMENT OF THE INTERIOR MANUEL LUJAN, JR., Secretory
U.S. GEOLOGICAL SURVEY Dallas L. Peck, Director
Any use of trade, product, or firm names in this publication is for descriptive purposes only and does not imply endorsement by the U.S. Government.
For sale by the Books and Open-File Reports Section, U.S. Geological Survey Federal Center, Box 25425 Denver, CO 80225
For additional information write to: District Chief U.S. Geological Survey Federal Building, Room W-2234 2800 Cottage Way Sacramento, CA 95825

CONTENTS
Abstract 1 Introduction 2
Purpose and scope 2 Physical setting 2 Previous studies 3 Acknowledgments 3
Geohydrology 4 Geology 4
Extent of ground-water basin 4 Bedrock 4Unconsolidated sediments 4 Structure 5
Occurrence and movement of ground water 7 Sources of water 7 Aquifer characteristics 7 Water levels in 1988 9 Water-level trends 10
Water quality 10j Sample-collection methods 10
Water types 11 Major constituents 11
Cations 11 Anions 13
Stable isotopes 14Relation of water quality to recharge sources 15
Water budgets 18Golden Gate Park and Lake Merced area 18
Inflow 18Infiltration of rainfall, irrigation water, and lake water 18 Leakage from water and sewer pipes 21 Ground water 22
Outflow 22Pumping 22Evaporation and transpiration 23 Ground water 24
Storage changes 25 Comparison of water budgets 25
Lake Merced 26 Inflow 27
Rainfall 27 Surface water 27 Ground water 27
Outflow 30Evaporation 30Pumping and surface outflow 31 Ground water 32
Water levels and storage changes 32 Uncertainty of inflows and outflows 34 Relation of lake level to water-budget factors 34
Contents III

Effects of increased pumping 36 Summary and conclusions 37 References cited 39 Appendix A. Ground-water quality data 42
FIGURES
Plate 1. Generalized geologic map and sections, well locations, and ground-water levels in Golden Gate Parkand the Lake Merced area, San Francisco, California In Pocket
Figure 1. Trilinear diagram showing quality of seawater, rain, municipal water, and ground water in thewestern part of San Francisco, water year 1988 12
2-6. Graphs showing:2. Variation of specific conductance with well depth in wells in the western pan of
San Francisco 133. Relation of sulfate and nitrate concentrations in ground water in the western part of
San Francisco 144. Stable-isotope composition of rain, municipal water, and ground water in the western part
of San Francisco, water year 1988 155. Stable-isotope composition of water from wells in Golden Gate Park 166. Relation of annual rainfall to annual net change in minimum water level in
Lake Merced 33
Table 1. Horizontal hydraulic conductivity at selected San Francisco Recreation and Park Department wells, calculated from 1- to 2-hour constant-discharge tests, June 1988 8
2. Ground-water budgets for Golden Gate Park and the Lake Merced area, water years 1976-83 and 1988 19
3. Estimated land use, irrigation, and ground-water recharge in Golden Gate Park and the Lake Merced area, water years 1976-83 and 1988 20
4. Discharge rate and monthly pumpage of wells in Golden Gate Park and the Lake Merced area, water year 1988 23
5. Daily rainfall at four gages near Lake Merced, water year 1988 286. Estimated flow of shallow ground water into and out of Lake Merced, water year 1988 307. Measured pan evaporation at Lake Merced, May-October 1988 308. Pan evaporation, lake evaporation, and transpiration by tules at Lake Merced, water year 1988 319. Water budget for Lake Merced, water year 1988 35
IV Content*

Conversion Factors
For readers who prefer to use metric and International System (SI) units rather than inch-pound units, the conversion factors for terms used in this report are as follows:
_______Multiply_____________By______________To obtain____________
acre 0.4047 hectareacre-foot (acre-ft) 1,233 cubic meter
0.3258 million gallons (Mgal)acre-foot per year (acre-ft/yr) 1,233 cubic meter per year
acre-foot per month (acre-ft/mo) 1,233 cubic meter per monthfoot (ft) 0.3048 meter
foot per day (ft/d) 0.3048 meter per dayfoot per year (ft/yr) 0.3048 meter per year
foot squared per day (ft2/d) 0.0929 meter squared per daygallon per day (gal/d) 0.003785 cubic meter per day
gallon per minute (gal/min) 0.003785 cubic meter per minuteinch (in.) 25.4 millimeter
inch per year (in/yr) 25.4 millimeter per yearmile (mi) 1.609 kilometer
million gallons (Mgal) 3,785 cubic metermillion gallons per day (Mgal/d) 3,785 cubic meter per day
million gallons per year (Mgal/yr) 3,785 cubic meter per yearpound per acre per year [(lb/acre)/yr] 1.121 kilogram per hectare per year
pound per year (Ib/yr) 0.4536 kilogram per yearsquare foot (ft2) 0.0929 square meter
_____________square mile (mi2)________2.590________ square kilometer
Temperature is given in degrees Fahrenheit (°F) and can be converted to degrees Celsius (°C) using the following equation:
°F=1.8(°C)+32
Sea Level: In this report, "sea level" refers to the National Geodetic Vertical Datum of 1929 (NGVD of 1929)--a geodetic datum derived from a general adjustment of the first-order level nets of both the United States and Canada, formerly called Sea Level Datum of 1929. All altitudes are referenced to this datum. Readers may wish to note that numerous previous studies have used the San Francisco Datum, which is 8.616 ft above sea level.
Conversion Factors V

GEOHYDROLOGY, WATER QUALITY, AND WATER BUDGETS OF
GOLDEN GATE PARK AND THE LAKE MERCED AREA IN THE
WESTERN PART OF SAN FRANCISCO, CALIFORNIA
By Eugene B, Votes, Scott N, Hamlin, and Lisa Horowitz McCann
Abstract
Ground-water conditions in Golden Gate Park and the Lake Merced area of the western part of San Francisco were investigated in order to evaluate the potential for minimizing dependence on imported water. Data collected during the 1-year study indicate that use of ground water for irrigation could be expanded, and that ground water could serve as an emergency municipal supply if sources of imported water were suddenly interrupted. The ground-water basin in the western part of San Francisco is about 2 miles wide and extends south from Lincoln Park about 6 miles along the coast to Daly City and from there about 5 miles southeast to San Francisco Bay near San Bruno. Faults and bedrock control the extent of the basin. Ground water is pumped chiefly from sands and silts of the Colma and Merced Formations.
Aquifer tests have yielded values for hydraulic con ductivity ranging from 10 to 30 feet per day. Storage coefficients for shallow strata (0.01 to 0.20) indicate unconfmed conditions, whereas values for deeper strata (0.0002 to 0.009) indicate a confined aquifer system. Vertical water-level gradients are generally small, except near the south end of Lake Merced where pumping from the deep part of the aquifer system has produced a down ward and southward gradient. Water levels have been fairly constant in the western part of San Francisco, with the exception of the southern part of the Lake Merced area.
Ground-water quality in San Francisco is affected by recharge from rainfall, irrigation-return flow, and leakage from water and sewer pipes. Rain and municipal water have low concentrations of dissolved solids and tend to dilute ground water. Irrigation-return flow and sewer leakage are the probable sources of high concentrations of nitrate. These concentrations exceed the U.S. Environmen tal Protection Agency's limit for safe drinking water at several locations. The concentration of dissolved solids decreases with depth in the aquifer system and indicates a shallow source. Stable-isotope data from the area near the
southern end of Lake Merced indicate that surface water is recharging the deeper part of the aquifer system.
An annual water budget was calculated for Lake Merced. Inflow to the lake is mainly from ground-water seepage, with lesser amounts from rainfall and surface runoff. The lake loses water primarily through evapo ration and transpiration and, to a lesser extent, through seepage to ground water and by direct pumping. A 1.5- foot decline in lake level during 1988 was equivalent to a total storage loss of 370 acre-feet of water.
Large amounts of pumpage from deep wells near the south end of Lake Merced have created a steep downward water-level gradient within the aquifer system, which is the probable cause of long-term declines in the level of the lake. The average annual rate of decline between 1976 and 1988 was approximately 0.06 to 0.40 foot. Ground-water budgets were developed separately for Golden Gate Park and for the area surrounding Lake Merced. In Golden Gate Park, about one-half the annual recharge is from rainfall. Ground-water inflow and irrigation-return flow are about equal and form the balance of recharge. Pumpage and natural ground-water outflow are nearly equal and represent the bulk of ground-water discharge. In the Lake Merced area, recharge from rain fall and ground-water inflow generally each contribute about one-third of the total annual inflow to the ground- water system. Irrigation-return flow normally contributes about one-fifth of the inflow, and leakage from water and sewer pipes accounts for the rest Ground-water outflow accounts for nearly two-thirds of the total outflow and pumping within the Lake Merced area accounts for nearly one-third of the outflow. However, most of the ground- water outflow is not natural outflow to the ocean, but is caused by pumping from the deep part of the aquifer system south of the area. Net evaporation and tran spiration from Lake Merced and tules constitute less than one-tenth of the outflow. Low rainfall during water year 1988 (October 1987-September 1988) resulted in a net decrease in ground-water storage in both areas. The net decline in ground-water storage volume during 1988 was 290 acre-feet at Golden Gate Park and 720 acre-feet in the Lake Merced area.
per day.acre-foot per year equals 0.3258 million gallons per year or an average daily rate of 0.008927 million gallons
Abstract 1

INTRODUCTION
Ground water was a significant source of water supply for San Francisco during the late 1800's. A number of wells and natural springs were used to obtain water for municipal purposes. Since that time, development of the Hetch Hetchy pipeline system and associated reservoirs has satisfied increasing water demands from the city and other municipalities along the pipeline. The San Francisco Water Department (SFWD) has been operating the system since 1930. Currently (1989), the major use of spring water is withdrawal of about 2 Mgal/d (million gallons per day) from spring-fed Lobos Creek for the Presidio Military Reservation. The major use of ground water within the city is for irrigation at Golden Gate Park, Stern Grove, Fleishhacker Zoo, and several golf courses. A large quantity of ground water is pumped for municipal and irrigation purposes south of the city, between Daly City and San Bruno.
* The Hetch Hetchy pipeline system currently deliv- iers 80 to 90 percent of the water used in the city. frhe primary source of this water is nearly 200 mi |from San Francisco in Yosemite National Park. The Hetch Hetchy system supplies water to 2 million people in five counties along the pipeline route, and water demands may soon exceed the delivery capaci ty of the system (Cheryl Davis, San Francisco Water Department, written commun., 1988). Annual aver age delivery capacity is presently equivalent to a rate ?of about 325 Mgal/d, and water use in 1987 averaged 240 Mgal/d systemwide. Between the years 2000 and 2010, average annual demand is expected to range from 325 to 345 Mgal/d. Greater use of local ground water within San Francisco would reduce the demand and dependency on the Hetch Hetchy system. Although increased ground- water use might be preferentially directed toward nonpotable purposes, local ground water could be a major source of emergency drinking-water supply if the Hetch Hetchy pipeline were damaged by an earthquake and temporarily put out of service.
Information from the current study will facilitate management and development of ground water in San Francisco by the SFWD and related city agen cies. Items of particular interest include potential for greater ground-water withdrawal, suitability of ground-water quality for various uses, and con junctive use (reclaimed water and ground water).
This report describes results of the first year of a 4-year study made by the U.S. Geological Survey in cooperation with San Francisco Water Department
PURPOSE AND SCOPE
The primary objective of this report is to describe ground-water conditions in the western part of San Francisco with an emphasis on Golden Gate Park and the area around Lake Merced. The latter area is bounded by the Pacific Ocean, 19th Avenue, Vicente Street, and John Daly Boulevard (pi. I A), and includes Fleishhacker Zoo. Ground-water conditions were evaluated by developing a conceptual model of the ground-water system and by quantifying ground- water budgets for the two areas and a surface-water budget for Lake Merced. Water-quality data and hydraulic characteristics of the system were used to refine estimates of terms in the water budgets.
Existing data and information pertinent to the study were reviewed. In addition, the following hydro-logic data were collected during the first year of the study: water levels in wells and in Lake Merced, water quality of surface and ground water, daily rainfall, aquifer transmissivity, pumpage (estimated from hour meters), evaporation from Lake Merced, and seepage through the bed of Lake Merced.
PHYSICAL SETTING
San Francisco, a large city on the central California coast, is built on a peninsula bounded by San Francisco Bay to the north and east, and by the Pacific Ocean to the west (pi. LA). The total area of the city and county of San Francisco is about 49 mi2. The topography of San Francisco is hilly. Altitude in the western part of San Francisco ranges from sea level at the beach to 925 ft above sea level at Mount Davidson, the highest point in the city. The gentle slopes west and northwest of Twin Peaks, Mount Sutro, and Mount Davidson result from deposits of windblown dune sands.
Golden Gate Park (1,040 acres) and the Lake Merced area (2,880 acres) are located in the western part of San Francisco. These areas contain the largest irrigated acreage in San Francisco. Features of Golden Gate Park and the Lake Merced area are shown on plate 1.
2 Geohydrology, Water Quality, and Water Budgets, San Francisco, California

The climate of San Francisco is controlled by its location in the California Coast Ranges, which form a nearly continuous barrier between the Pacific Ocean to the west and the San Joaquin and Sacra mento Valleys to the east The Coast Ranges have a Mediterranean climate which is characterized by mild, wet winters and warm, dry summers. Typi cally westerly winds from the Pacific Ocean tend to moderate temperatures. The average daily temper ature at the Richmond-Sunset weather station in Golden Gate Park ranges from 45 °F in January to 69 °F in September. Record high and low temper atures are 101 °F and 27 °F, respectively. Annual rainfall at the Richmond-Sunset weather station averaged 21.3 in. for 1976-83. Summer fog com monly results from steep air- and water-temperature gradients in the vicinity of San Francisco. This produces a pattern of relative humidity which reaches a maximum during the summer months.
Natural bodies of surface water in western San Francisco include Lake Merced, Pine Lake, Mountain Lake, and Lobos Creek (pi. IA, 1C). Several small artificial lakes are maintained in Golden Gate Park for storage of irrigation water and for recreational purposes. The natural water bodies are connected to the ground-water system and are recharged primarily by ground-water seepage. Numerous seeps and springs have been observed in the western part of San Francisco. Sources of flow to these discharges may be ground water and leaking water or sewer pipes.
The western part of San Francisco is primarily a residential area. There are, however, several large undeveloped areas, including Golden Gate Park, the shoreline of Lake Merced, Ocean Beach, Fleish- hacker Zoo, Stern Grove, Olympic Golf dub, Harding Park Golf Course, and San Francisco Golf dub (pi. 1,4, 1C). Residential and commercial areas within the city of San Francisco are served by a combined sewer system that receives both storm runoff and wastewater discharges. The capacity of the Richmond-Sunset Water Pollution Control Plant is occasionally exceeded during periods of excessive storm runoff.
PREVIOUS STUDIES
Numerous previous studies, mainly by engineering consultants, have focused on selected aspects of local
geohydrology surrounding construction sites. The first comprehensive evaluation of the ground-water supply in the city and county of San Francisco was completed in 1913 by M.J. Baitell. In the late 1970's, Woodward-Clyde Consultants produced a series of reports describing a geotechnical study of the proposed Southwest Ocean Outfall Project (SWOOP) for disposal of treated wastewater near Fleishhacker Zoo (Woodward-Clyde Consultants, 1977a, 1977b, 1977c, 1980, 1981). They also evaluated ground-water resources in Golden Gate Park in the early 1980's. Caldwell-Gonzalez- Kennedy-Tudor (1982) did a geotechnical evaluation of several areas in the city for the Bayside Facilities planning project These facilities collect and store dry- and wet-weather sewage and storm flows and will convey treated wastewater to SWOOP for disposal in the Pacific Ocean. Harding-Lawson Associates (1977) made a geotechnical evaluation of the Westside Transport System, located under the Great Highway. This facility was designed to store and transport discharge from the Richmond-Sunset Sewer District Dames and Moore (1979) completed a geotechnical investigation to select the route for the Richmond Transport Sewer. This sewer collects combined sewage and stormwater in northwestern San Francisco for transport to the Westside Transport System. The geology of the western part of San Francisco was mapped and described by Bonilla (1964, 1971), Schlocker (1974), Hunter and Clifton (1982), and Clifton and Hunter (1987).
ACKNOWLEDGMENTS
Public agencies that have contributed to the study include the San Francisco Clean Water Program, Pacific Gas and Electric Company, San Francisco Recreation and Park Department, San Francisco Fire Department, San Francisco Department of Public Works, San Francisco Department of Public Health, the San Francisco Bureau of Water-Pollution Con trol, and the city of Daly City. Numerous private businesses and individuals also contributed infor mation and assistance to the study, including: Lake Merced Boating and Fishing Company, Harding- Lawson Associates, Olympic Golf Club, San Fran cisco Golf dub, Bendix Environmental Research, San Francisco State University, Gregory B. Yates, Eve Iverson, and Carla M. Reiter.
Introduction 3

GEOHYDROLOGY
GEOLOGY
EXTENT OF GROUND-WATER BASIN
A continuous body of permeable, water-bearing sediments underlies much of the western part of San Francisco, including Golden Gate Park and the Lake Merced area. These sediments arc part of a single ground-water basin, within which pumping or recharge in one area can affect water levels in other areas. The basin is about 2 mi wide and extends southward from Lincoln Park about 6 mi along the coast to Daly City (pi. LA), and from mere southeastward an additional 5 mi to San Francisco Bay near San Bruno. It is bounded on the east by Mount Sutro, Mount Davidson, and San Bruno Mountain. South of Daly City, the basin is bounded on the west by the San Andreas fault. North of Daly City, the basin extends westward beneath the Pacific Ocean probably at least as far as the San Andreas fault, which lies up to 3 mi offshore in the San rFrancisco area. The total onshore area of the ground-water basin is about 40 mi2, of which about ;16 mi2 are within San Francisco. The onshore boundaries and surficial geology of the northern part of the ground-water basin are shown on plate IE. Geologic sections along east-west lines through Golden Gate Park and the Lake Merced area are ^shown on plate ID and IF.
BEDROCK
Boundaries of the ground-water basin in the west- em part of San Francisco are defined by bedrock, which consists of consolidated rocks of the Francis can Complex and Great Valley sequence. Younger unconsolidated sediments overlie the bedrock and constitute the permeable fill deposits of the ground- water basin. The Franciscan Complex is exposed on the slopes of Mounts Sutro and Davidson. It is also exposed where the tops of buried bedrock ridges protrude through the overlying sediments. The Fran ciscan Complex crops out at isolated locations in the eastern half of Golden Gate Park and at two loca tions along 19th Avenue near Stem Grove and San Francisco State University (Bonilla, 1971; Schlocker, 1974). It comprises an assemblage of Late Jurassic and Cretaceous sedimentary, volcanic, and meta- morphic rocks (Schlocker, 1974). The rocks are generally deformed and fractured; different lithol- ogies commonly are juxtaposed in complex patterns.
Lithologies from boreholes and outcrops in the study area consist of radiolarian chert, greenstone, and sandstone. Fractures in these rocks may contain one or more of the following secondary deposits: quartz, calcite, zeolites, iron oxides, manganese oxide, chlorite, and clay minerals.
Rocks of the Great Valley sequence form the bed rock beneath the ground-water basin in areas south west of me City College shear zone (pi. IE) and are exposed at San Francisco State University. These rocks are of about the same age as the Franciscan Complex. The rocks of the Great Valley sequence consist primarily of sandstones and can be distin guished from the Franciscan Complex by the lesser amount of shearing, the absence of interbedded chert and greenstone, and by a high potassium feldspar content (Schlocker, 1974, p. 28).
UNCONSOLIDATED SEDIMENTS
Dune sands and unconsolidated sediments of the Colma and Merced Formations constitute the basin fill in the study area. Generally, the Merced Form ation is overlain by the Colma Formation, which is in turn overlain by the dune sands.
The Merced Formation consists predominantly of shallow marine and estuarine deposits with thin interbedded muds and peats. More than 5,800 ft of sediments were deposited unconformably on bedrock during the late Pliocene and Pleistocene Epochs. Thicker fine-grain layers (10 to 60 ft) typically occur every 300 to 600 ft (Clifton and Hunter, 1987, p. 260). Cementation is rare but about 25 percent of the sands contain an intergranular matrix of clay and iron oxide, which binds the grains (Woodward-Clyde Consultants, 1977c; Hunter and Clifton, 1982). The matrix probably decreases permeability of the sedi ments. The Merced Formation dips to the northeast. Dips of bedding planes decrease from more than 40 degrees in the older strata exposed between San Bruno and Daly City to 10 or 15 degrees in the youngest strata exposed on the beach near Lake Merced (Bonilla, 1971). Tilted fine-grain strata might significantly impede horizontal flow of ground water.
The Merced Formation is present as far south as San Bruno, and most of the strata are exposed in sea cliffs between Mussel Rock and Lake Merced (pi. LA). Norm of Lake Merced, the Merced Formation
4 Goohydrology, Water Quality, and Water Budgets, San Francisco, California

is overlain by the Colma Formation, but it is thought to extend continuously to outcrops along the coast of Marin County, 10 to 30 mi farther north (Schlocker, 1974, p. 67). Seismic reflection profiles indicate that the Merced Formation may extend offshore past the San Andreas fault an additional 5 to 6 mi to the Pilarcitos fault (Cooper, 1973). The Merced Forma tion does not crop out along the eastern side of the ground-water basin, but the formation is thought to extend beneath the Colma Formation at least as far east as the San Bruno fault (pi. IE, IF) (Edward Clifton, U.S. Geological Survey, oral commua, 1988).
The Colma Formation overlies the Merced Forma tion and bedrock and underlies younger dune sands in most parts of Golden Gate Park and the Lake Merced area. The Colma Formation does not crop out in Golden Gate Park, although surficial expo sures exist north and south of the park. The Colma Formation is exposed over most of the Lake Merced area south and east of Lake Merced. It consists of fine-grain sand and silty sand with occasional beds of clay as much as 5 ft thick. These beds were deposited in a variety of shallow marine, estuarine, and eolian environments. Thin layers with iron- oxide cement sometimes occur in the upper 20 ft of the formation (Dames and Moore, 1979, p. A-l). The thickness of the Colma Formation ranges from 0 to about 300 ft in Golden Gate Park and the Lake Merced areas. The Colma Formation probably con sists, in large part, of reworked material from the Merced Formation, because the lithology of the sand layers is similar (Schlocker, 1974).
Holocene eolian dune sands cover most parts of the ground-water basin north of Lake Merced. His torical maps and photographs indicate that the dunes were widespread prior to urbanization (Schlocker, 1974, p. 79; Olmsted and Olmsted, 1979), and active eolian transport continues to occur near Fort Funston (pi. 1C). The dune sands consist of loose, clean, well-sorted, fine- to medium-grain sands of varying lithology. The thickness of dune sands ranges from 0 to 80 ft in Golden Gate Park (Schlocker, 1974) and 0 to 50 ft in the Lake Merced area.
STRUCTURE
Two faults may be present in Golden Gate Park and the Lake Merced area. The City College shear zone (pi. IE) occupies a band about 0.5 to 1 mi wide extending from Lincoln Park southeastward to San
Francisco Bay near Bayshore (pi. IA). It crosses Golden Gate Park about 1 mi from the coast, between the Elk Glen well and the Windmill wells (pi. 1). It crosses the northwest comer of the Lake Merced area at the eastern end of Stem Grove. The shear zone contains intensely sheared cataclasite and blocks of Great Valley sequence rocks up to 200 ft in diameter (Dames and Moore, 1979). It appears to affect only bedrock and separates Franciscan Com plex rocks on the northeast from Great Valley sequence rocks on the southwest The shear zone appears to be inactive, but in the Late Cretaceous it may have been a surface on which Great Valley sequence rocks were thrust westward into juxtapo sition with the Franciscan Complex (Schlocker, 1974, p. 92). Geologic sections and bedrock contour maps prepared by previous investigators have not indicated any vertical offset in the bedrock surface near the fault zone, although bedrock information is scanty along most of the fault zone (Bonilla, 1971; Schlocker, 1974; Dames and Moore, 1979; Caldwell- Gonzalez-Kennedy-Tudor, 1982, appendix A).
Available water-level data do not indicate that the City College shear zone affects ground-water flow in bedrock fractures or in the basin-fill sediments. In boreholes near the Lake Merced area, however, the cataclasite in the fault zone was observed to be weak and tended to soften and become plastic on contact with water (Caldwell-Gonzalez-Kennedy- Tudor, 1982, p. 48). Such a material probably would not support open fractures and might create a barrier to flow through fractured bedrock.
The San Bruno fault (pi. IE, IF) extends north westward from San Francisco Bay and passes through the Lake Merced area. Its age, exact location, and offset in the Lake Merced area are uncertain, and consequently the thickness of the ground-water basin and the lateral subsurface extent of the Merced Formation also are uncertain. Lawson (1895) originally proposed the San Bruno fault to explain the absence of outcrops of Merced Formation along the flanks of Mount Davidson and San Bruno Mountaia A bedrock contour map of the area drawn by Bonilla (1964) indicates that the trace of the fault lies approximately along the axis of South Lake (pi. IE) and that the vertical offset along the fault is about 1,700 ft in the Lake Merced area (pi. IE, IF). More recent borehole information (Caldwell- Gonzalez-Kennedy-Tudor, 1982, appendix A) indi cates that Bonilla's bedrock contours for the northeastern, upthrown side of the fault are too
Goohydrology 5

shallow (pL IF), thus casting doubt on the accuracy of the contours on the downthrown side. Onshore seismic reflection profiles between Fleishhacker Zoo and Stem Grove reportedly showed no fault at that location, but indicate a fault about 1,500 ft farther east (pi. IE, IF) (Caldwell-Gonzalez-Kennedy- Tudor, 1982, appendix B), which was assumed to be the San Bruno fault even though the vertical offset was only about 200 ft (pi. IF). The interpretation of the seismic reflection data is tentative because there were no borehole data verifying that the bedrock sur face had been correctly identified. Linear features in offshore seismic reflection data have been identified that might align with either onshore location for the San Bruno fault (David McCulloch, U.S. Geological Survey, oral commun., 1988).
Lawson (1895) thought the fault had ceased to be active long before deposition of the Colma Form ation (about 2.3 million years ago). Bonilla (1971) also considered the fault inactive. More recently, Brabb and Hanna (1979) reported microseismic acti-
, vity along a line that could be the offshore extension !?of the fault, but the seismic activity might have been ^related to movement along the nearby San Andreas Jfault If the San Bruno fault is active, it might also
offset the Colma Formation and affect ground-water flow by creating a shear zone of low horizontal per meability or by creating discontinuities in clay layers.
^ It is not known whether the San Bruno fault is the ^eastern limit of the Merced Formation. This hypoth
esis has been asserted by some geologists (Lawson, 1895; Edward Clifton, U.S. Geological Survey, oral commun., 1988), but another study showed the form ation on both sides of the fault (Kirker, Chapman, and Associates and Todd, 1972). The apparent off shore extent of the Merced Formation also includes large areas on both sides of the projected fault trace (Cooper, 1973). In the Lake Merced area, an exten sive layer of clay or silty clay about 40 ft thick at an altitude between 40 and 200 ft below sea level is evident in borehole logs on both sides of the fault. The maximum thickness of clay layers in the Colma Formation generally has been reported as less than 5 ft (Bonilla, 1959; Kirker, Chapman, and Asso ciates, and Todd, 1972, p. 16; Schlocker, 1974, p. 67), yet thicker clay layers have been reported in several wells northeast of the fault, including those shown on plate 1. These data indicate that if the San Bruno fault is the eastern limit of the Merced For mation, then either the Colma Formation contains a
recognized thick clay layer, or the San Bruno fault is farther east than previously thought. If the latter is true, the fault plane would have to pass through the clay-bedrock contact in well CGKT P-l, as indicated by the queried bedrock surface on plate IF. If the fault is this far east and the offset is as large as previously reported (Bonilla, 1964), the total volume of the ground-water basin is much larger than previously thought.
If the San Bruno fault is not the eastern limit of the Merced Formation, then the clay layer might not be continuous. It might be two separate layers coin- cidentally juxtaposed at about the same depth. Alter natively, the fault might have ceased to be active during the deposition of the Merced Formation, and the clay layer might be a younger stratum deposited uniformly across the fault. If the fault does pass through the Merced Formation, it might create a barrier to horizontal flow of ground water. It also could facilitate vertical ground-water movement by offsetting clay layers.
The seismically active San Andreas fault (pi. IA) is about 2 mi offshore in the vicinity of the Lake Merced area and 3 mi offshore near Golden Gate Park. Although the fault offsets Pliocene and Pleis tocene sediments which may be equivalent to the Merced and Colma Formations (Cooper, 1973, p. 43-44), its effect on ground-water flow and the hydraulic connection between the ocean and the ground-water basin is unknown. Offshore seismic reflection profiles also indicate the occurrence of moderate folding and numerous small offsets in add ition to the discontinuities associated with the San Andreas and other major faults (Cooper, 1973). These smaller features may affect ground-water flow and might also occur undetected in onshore areas.
The depth and shape of the base of the ground- water basin is highly speculative. With little borehole information and conflicting geophysical evidence, basin thickness and the amount of ground water in storage cannot be determined accurately. It also is difficult to estimate the probable yield of wells drilled in undeveloped areas and to estimate the effects of pumping in one area on water levels in other parts of the ground-water basin. The bedrock surfaces on plate 1 generally are those proposed by Bonilla (1971) and Schlocker (1974) and are modi fied near Stern Grove and the eastern end of Golden Gate Park for consistency with more recent information.
6 Geohydrology. Water Qualify, and Water Budgets, San Francisco, California

The occurrence of isolated, exposed knobs of bedrock in several locations indicates that the buried bedrock surface is highly uneven. This impression is confirmed by geologic information from closely spaced boreholes drilled east of Stem Grove for the Crosstown Transport Facility (Caldwell-Gonzalez- Kennedy-Tudor, 1982, appendix A). The bedrock surface, derived by interpolating between boreholes, is as steep and uneven as the nearby bedrock exposures on the slopes of Mount Davidson. At the site of the Alvord well in Golden Gate Park, Schlocker (1974) inferred a depth to bedrock of only 80 ft by assuming a gentle bedrock topography between outcrops. The Alvord well was drilled to a depth of 331 ft in 1982 and did not reach bedrock, indicating that the buried bedrock surface is highly dissected. Drawdown patterns during a pumping test at the well in June 1988 indicated the presence of a nearby bedrock boundary, which could be the wall of the buried canyon.
OCCURRENCE AND MOVEMENT OF GROUND WATER
tSOURCES OF WATER
Recharge to ground water in the western part of San Francisco is from several sources. Prior to urban development, rainfall provided most of the recharge to the ground-water system. With urban
.development, additional sources of recharge became significant. Water was imported from Yosemite Valley and other distant locations by the Hetch
; Hetchy pipeline system to supply water needs in the growing city. Leakage from water and sewer pipes began to supplement natural recharge to the aquifer. Conversely, recharge from rainfall diminished as urbanization decreased the total area of permeable soils through which surface water can infiltrate. Irrigation-return flow from parks, golf courses, and private gardens became an additional source of recharge.
AQUIFER CHARACTERISTICS
Movement of ground water is controlled by the hydraulic conductivity and storage coefficient of subsurface geologic materials. The hydraulic con ductivity of bedrock is low compared with the overlying unconsolidated sedimentary deposits. The primary porosity of bedrock is low, but fractures are common. The presence of springs at various bedrock
outcrops and the occasional loss of drilling fluid from boreholes drilled into bedrock (Caldwell- Gonzalez-Kennedy-Tudor, 1982, appendix A) indi cate that some fractures allow ground-water flow. Open, continuous fractures are uncommon, however. For the purposes of this study, bedrock is considered an impermeable boundary of the ground-water basin.
Sands and silts of the dune sands, Colma Forma tion, and Merced Formation are porous, permeable, and allow storage and movement of ground water. In some strata, interstitial clay or local cementation might significantly decrease the permeability. In horizontally layered deposits, horizontal ground- water flow occurs predominantly in coarse-grain strata which have high hydraulic conductivity. Sands and silty sands commonly have horizontal hydraulic conductivities between 2 and 200 ft/d (Davis, 1969; Heath, 1987, p. 13). An aquifer test at the Alvord well indicated that horizontal hydraulic conductivity in the depth interval between 170 and 240 ft ranged from 12 to 24 ft/d (Woodward-Clyde Consultants, 1984). Similar tests yielded values of 28 ft/d at the zoo (Harding-Lawson Associates, 1977), and 10 to 30 ft/d at Stem Grove (Caldwell-Gonzalez-Kennedy- Tudor, 1982, appendix D). At the Oceanside Water Pollution Control Plant site (formerly called the Southwest Water Pollution Control Plant), one test indicated a horizontal hydraulic conductivity of 17 ft/d for the shallow aquifer (uppermost 100 ft of sediments) (Woodward-Clyde Consultants, 1980). A later test gave a value of 8 ft/d for the interval between 175 and 475 ft below land surface (CH2M- Hill, 1989). Horizontal hydraulic conductivity in the top several hundred feet of the ground-water basin also was estimated from drawdown data obtained during 1- to 2-hour well-efficiency (constant dis charge) tests conducted for this study in June 1988. The data for seven wells are shown in table 1. Hydraulic conductivity ranged from 5 to 31 ft/d and averaged 17 ft/d.
Storage properties of the ground-water basin were determined during several of these tests. A wide range of storage coefficients was calculated, with generally lower values for deep strata. Two tests in the upper 80 ft of sediments near the zoo yielded storage coefficients between Q.01 and 0.20, indi cating unconfmed conditions (Harding-Lawson Asso ciates, 1977; Woodward-Clyde Consultants, 1980). The tests at Stem Grove and the Alvord well yielded values from 0.00002 to 0.009 for depths to 240 ft (Caldwell-Gonzalez-Kennedy-Tudor, 1982, appendix D; Woodward-Clyde Consultants, 1985). A 10-day
Geohydrology 7

Table 1. Horizontal hydraulic conductivity at selected San Francisco Recreation and Park Department wells, calculated from 1- to 2-hour constant-discharge tests, June 1988
[Location of wells shown on plate LA. Thickness of pumped interval is estimated from well depth if screened interval is unknown. ft2/d, feet squared per day; ft/d, feet per day]
MN
24567
7071
kP Well namex/«
Northeast Windmill1Elk Glen ........Arboretum No. 5 . .Arboretum No. 41 . .Alvord ..........Zoo No. 41 ......Zoo No. 31 ......
Trans-missivity
(f^/d)
... 3,900
... 5,800
... 3,100
... 1,200
... 1,200
... 5400
... 4,400
Thickness ofpumpedinterval(feet)
280354230230
65180185
Hydraulic
conductivity(fl/d)
1416135
18
24
Results are averages from two separate tests.
aquifer test at the Oceanside Water Pollution ControlPlant site indicated a storage coefficient of 0.00024for the interval from 175 to 475 ft below landsurface and 0.0045 for a 45-foot-thick clay layer
^above that (CH2M-Hill, 1989). These values show*that the clay layer confines or partly confines the^underlying interval.
Confinement occurs where a horizontally con tinuous layer of relatively impermeable material such as clay overlies more permeable aquifer material, day layers tend to control the vertical flow of water in a ground-water basin. These layers form con fining beds that isolate the underlying aquifer from the water table, creating confined conditions and small storage coefficients. The degree of confine ment depends on the vertical hydraulic conductivity, thickness, and horizontal continuity of the clay layers. Because the vertical hydraulic conductivity of clay is generally several orders of magnitude less than that of sand and silty sand (Freeze and Cherry, 1979, p. 29), even a thin layer of clay can be an effective barrier to vertical ground-water flow.
Extensive clay layers are not present in the dune sands and are rare in the Colma Formation (Schlocker, 1974). However, clay layers are much thicker in the Merced Formation, which makes up most of the thickness of the ground-water basin in the Lake Merced area. Borehole geologic logs indi cate a thick clay layer at a depth of slightly more than 100 ft across the northern part of the Lake Merced area. This layer partly isolates the overlying shallow water-table aquifer from the underlying confined part of the aquifer system. The shallow aquifer consists largely of dune sands and Colma Formation, and the confined part of the aquifer system is formed by the Merced Formation. The chief variable controlling the extent of aquifer confinement and hydrologic isolation probably is the horizontal continuity of the clay layers. The clay layer is tentatively correlated among eight wells between the Oceanside Water Pollution Control Plant site and Stern Grove (pi 1C). At the Oceanside Water Pollution Control Plant site, the clay was present in seven of eight boreholes drilled to depths greater than 105 ft for three separate investigations (Woodward-Clyde Consultants, 1977a, 1977b, and 1980; Kirn Ries, CH2M-Hill, written commun., 1988). The top of the clay layer was found at depths ranging from 100 to 128 ft, which correspond to altitudes of 24 to 94 ft below sea level.
The clay layer might not be continuous farther south, near wells at the Olympic Golf Club and San Francisco Golf dub. In fact, these wells demon strate that clay layers arc not necessarily continuous even if they are thick. The geologic log of the north well at the Olympic Golf dub has a 53-foot-thick clay layer at an altitude of 226 ft below sea level. The log of the south well, which is only about 300 ft away, does not show a thick clay layer until an alti tude of about 430 ft below sea level. Clay layers constituted 14 to 20 percent of the thickness of sedi ments penetrated by those wells; however, they com prised 57 percent of the thickness at the San Fran cisco Golf Club well, which is about 2,500 ft farther east. Some of the apparent spatial variability can be attributed to differences in terminology among drillers. Attempts to correlate individual layers between boreholes is also complicated by the regional dip of the Merced Formation and the unknown offset of the San Bruno fault
8 Geohydrology, Water Quality, and Water Budgets, San Francisco, California

WATER LEVELS IN 1988
The water level in a well indicates the hydraulic head at the depth of the well screen referenced to a datum such as sea level. Hydraulic head is a measure of the potential energy of ground water at a point within the ground-water basin. Its primary components are related to altitude and pressure. In this report, the term "water level" is occasionally applied directly to an aquifer, as if the hydraulic head were being measured with a well screened only in that aquifer.
Unfortunately, most of the water-level data available for this study were obtained from water- supply wells that have long screened intervals. Consequently, the water levels do not indicate hydraulic head at a specific depth, but rather represent an average hydraulic head for the entire screened interval Nevertheless, well depths are in some cases sufficiently different that approximate vertical gradients can be estimated. In August 1988, the water level in Lake Merced Qess than 21 ft deep) was 10.8 ft above sea level. The water level in the Harding Park well (screened between depths of 50 and 265 ft) was 8.9 ft above sea level, and the water level in the north well at the Olympic Golf Club
"(screened between depths of 242 and 499 ft) was about 32 ft below sea level. The downward gradient between the lake and the Olympic Golf Club well is about 0.120, which is much larger than the steepest horizontal water-level gradients in the shallow aquifer (0.035). This contrast indicates that vertical hydraulic conductivity in me Lake Merced area is much lower than horizontal hydraulic conductivity, which is consistent with the occurrence of an extensive clay layer.
Vertical gradients are negligible within the shallow aquifer overlying the main confining clay layer near the zoo. In June 1988, the water level in zoo wells 3 and 4 (200 ft deep) were virtually the same as the water level in a 35-foot-deep monitoring well 200 ft away. Vertical gradients also appear to be small at the west end of Golden Gate Park. The Northeast and Northwest Windmill wells are reportedly about 152 and 255 ft deep, respectively (Lloyd Poole, San Francisco Recreation and Park Department, oral commun., 1988). In June 1988, the water level in the shallower well was only 0.6 ft higher than in the deeper well.
Contours of ground-water levels in Golden Gate Park in August 1988 are shown on plate 15. The contours were developed from head measurements at four wells in the park screened at various depths between 110 and 350 ft below land surface. Because the wells do not have identical screened intervals, the contours might contain errors caused by variation of hydraulic head with depth. However, the contours generally are consistent with measured water levels at four additional wells near the south edge of the park, water-level contours along the north edge of the park in autumn 1978 (Dames and Moore, 1979), and the expected effects of bedrock topography. Although Schlocker (1974) indicated a gentle bedrock divide connecting the bedrock outcrops in the eastern half of the park, it was assumed that pumping at the Alvord and Arboretum wells would capture recharge north of the divide by creating a southward gradient through notches in the divide. The water-level contours indicate that ground-water flow generally is westward with local areas of radial flow toward production wells. Local water-table mounds may occur near the lakes but are not shown on plate 1.
Contours of shallow ground-water levels in the Lake Merced area in August 1988 are shown on plate 1C. Water levels in several deep wells are also shown and are much lower than the shallow water levels. The water level in the San Francisco State University well (pi. 1C) may not accurately represent general water-level patterns east of Lake Merced. The sediments in the ground-water basin are only 17 ft thick at the well location, and consequently, trans- missivity is lower than in nearby areas where the basin is thicker (assuming similar lithology). The low transmissivity retards downslope movement of recharge from nearby hillsides, creating a steeper and higher water table than would occur if the sediments were thicker.
The natural movement of ground water in the Lake Merced area is westward. Lake Merced creates a plateau in the water table by causing a path of low resistance for shallow ground-water flow (pi. 1C). Also superimposed on the general westward water- level gradient is a downward and southward gradient caused by deep pumping at golf courses and locations south of the Lake Merced area.
Geohydrology 9

WATER-LEVEL TRENDS
Hydrographs of water levels in four wells in Golden Gate Park during water year 1988 are shown on plate IB. Occasional heads below the main trend of the data probably result from pumping at the well shortly before those measurements. The hydrographs indicate that seasonal fluctuation was greatest at the Elk Glen well, which also produced the largest amount of water. Net declines in water level during 1988 ranged from 13 ft at Elk Glen well near the midpoint of the park to about 2 ft at the Northeast Windmill well at the west end of the park. In con trast, the Alvord well at the east end of the park showed an apparent rise in water level of about 11 ft. The reason for this rise is not known.
Hydrographs of water levels in four wells in the Lake Merced area are shown on plate 1C. The large fluctuation in head at the San Francisco Golf Club well probably results from the small storage coeffi cient and relatively large amount of pumping from
4he deep confined part of the aquifer system. Net Recline in head during 1988 ranged from 2 ft at jSLA V well to 3 ft at Harding Park well. By com
parison, the amount of seasonal fluctuation in Lake Merced was 2.6 ft, and the net decline was 1.5 ft. Seasonal fluctuation and decline in the deep wells used to irrigate the Olympic Golf Club were not determined but probably were similar to those at the .San Francisco Golf Club well.
<,*fe ;e Accurate determination of long-term water-level trends requires measurements made over a period of many years. Few historical measurements are avail able for wells in Golden Gate Park and the Lake Merced area. Three measurements of water level in the Alvord well between 1982 and 1985 were between 224 and 227 ft above sea level. Six nonpumping measurements made at this well in water year 1988 were all between 207 and 218 ft above sea level, indicating an average decline of about 12 ft during a period of 3 to 6 years. However, the water level was rising during 1988, while water levels were declining in other wells. This indicates that long-term trends in the Alvord well may not be representative of general ground- water conditions in the park. Available data give no indication of long-term water-level declines at any of the other wells in Golden Gate Park.
Water levels in shallow monitoring wells (including map nos. 9 through 16 on pi. I A) along the Great Highway between Golden Gate Park and the Lake Merced area were measured in December
1987. No consistent changes were evident when these measurements were compared with measure ments made in December 1980 and December 1984 (Harding-Lawson Associates, 1987). Bartell (1913) reported a water-table altitude near 44th Avenue and Kirkham Street (1.4 mi north of Vicente Street) that was nearly identical to water levels measured in 1988 in a well one block farther south.
In the Lake Merced area, long-term water-level trends in the shallow aquifer are indicated by trends in the lake level. As described in a later section, Lake Merced is essentially an exposed part of the water table and has been gradually declining for more than 10 years at a rate between 0.06 and 0.40 ft/yr.
Water-level trends in the deep part of the aquifer system in the Lake Merced area are indicated by water levels in municipal wells in Daly City. These levels declined at a rate of about 4.2 ft/yr during 1940-70, from about 10 ft above sea level to about 115 ft below sea level (Kirker, Chapman, and Asso ciates, and Todd, 1972, p. 104). Water levels in seven municipal wells within 0.5 mi of the southern boundary of the Lake Merced area ranged from 95 to 125 ft Below sea level in March 1971, from 78 to 136 ft below sea level in April 1977 (California Department of Health Services, written commun., 1989), and from 95 to 173 ft below sea level in May 1988 (Michael Abramson, Daly City Department of Water and Wastewater Resources, written commun., 1988). These data indicate that there has been little or no net decline in the deep part of the aquifer system since 1970.
WATER QUALITY
SAMPLE-COLLECTION METHODS
Although the emphasis of this study is on Golden Gate Park and the Lake Merced area, ground-water samples for chemical analysis were collected from wells throughout the western part of San Francisco in order to more clearly identify water-quality effects associated with urbanized areas. Rain was collected as runoff from a field vehicle and from a motel roof. Water from Lake Merced was collected using a van Doran sampler. Municipal water was sampled from die water main at the Lake Merced pump station. Samples of ground water were collected by a method appropriate to the well type and water depth. Production wells were sampled either from a petcock
10 Geohydrology, Water Quality, and Water Budgets, San Francisco, California

at the well head or from the discharge pipe. Most shallow monitoring wells were sampled using a peristaltic pump with plastic tubing. Water samples from wells with water levels too deep for use of the peristaltic pump were collected with a Teflon bailer.
Prior to the collection of the samples, wells were purged of stagnant water in the casing until the electrical conductance of the discharged water reached a stable value. Treatment and preservation of the water samples followed procedures described by Wood (1976). Temperature, pH, specific conduc tance, and alkalinity were measured in the field according to techniques outlined by Presser and Barnes (1974). Water samples for stable-isotope analysis were collected in glass bottles fitted with polyseal caps to prevent evaporation.
WATER TYPES
Chemical reactions between ground water and sediments affect the variety and concentrations of dissolved constituents. Different geologic environ- ments result in ground water of different chemical types. Chemical precipitation can remove ions from solution and store them as mineral deposits. Pre cipitation of calcium carbonate and release of dissolved carbon dioxide can result from a decrease in pressure or an increase in temperature. Ferrous iron in solution oxidizes on exposure to air and is deposited as ferric hydroxide. Ion exchange involves the replacement of ions adsorbed on the surface of elays in the aquifer sediments by ions in solution.
Trilinear diagrams are used to display the relative proportions of the most common cations and onions, thereby allowing comparison and classification of water samples with different total concentrations (Hem, 1985). Water-quality data for the study area are plotted on the trilinear diagram in figure 1 and are tabulated in appendix A. This type of diagram is convenient for showing the effects of mixing water from two different sources. If two types of water are combined, the composition of the mixture will be proportional to the relative amounts of the same waters as long as chemical reactions do not occur. On a trilinear diagram, the composition of the mixture will plot along a line connecting the two source compositions.
Ground water in the western part of San Francisco tends to have a composition intermediate between the compositions of municipal water, rain, and
surface runoff. The quality of surface runoff is simi lar to that of seawater, probably because it contains salts originating from sea spray. A complete chem ical analysis of untreated wastewater was not avail able for inclusion in this graph. Anion compositions, which are less reactive than cation compositions, cluster near the municipal water composition, but show some spread toward the seawater composition. Compared to the composition of recharge sources, magnesium in ground-water samples is enriched with respect to the other cations, probably as a result of cation exchange in the aquifer. In general, ground water tends to have nearly equal amounts of magne sium, calcium, and sodium. Bicarbonate is the major anion.
As ground water moves through the saturated zone, the concentration of dissolved solids normally increases. Studies from many areas show that the concentration of dissolved solids in shallow ground water in recharge areas usually is lower than in deep ground water and in shallow ground water in dis charge areas of the same system (Freeze and Cherry, 1979, p. 241). Ground water in the western part of San Francisco exhibits an opposite trend; that is, concentration of dissolved solids tends to decrease with depth. This trend is shown by a plot of specific conductance-an indicator of the concentration of dissolved solids in water-compared to well depth (fig. 2). If the relation of specific conductance and well depth is assumed to be linear, the decreasing trend is significant at a 99 percent confidence level. An approximate estimate of the concentration of dissolved solids can be obtained by multiplying the specific conductance by 0.65. This conversion indicates that dissolved solids range from about 250 to 600 mg/L (milligrams per liter).
MAJOR CONSTITUENTS
CATIONS
The major cations in the ground-water supplies are calcium, magnesium, sodium, and potassium. Area! distribution of the cations is fairly uniform with the exception of potassium. The concentration of potassium in ground water near Golden Gate Park and the Lake Merced area is 5 to 10 times less than that found in ground water from the adjacent urbanized area between them. Because of its lower geochemical mobility in ground water, potassium is seldom found in concentrations greater than or equal to sodium.
Water Quality 11

EXPLANATION
SAMPLE SOURCE
> Lake Merced
I Municipal Water
r Rain
Runoff
) Seawater
WELLS
Golden Gate Park (MapNos. 1,2,3,4,5.7)
Zoo and Stern Grove (MapNos. 20,21,22)
Golf Clubs and San Francisco State University (Map Nos. 26.27,29)
HLA-VOther HLA
(MapNos. 9.10,11,12,13,15)44th Avenue
(MapNos. 17,18,19)
40
CATIONS
60 80
PERCENTAGE OF TOTAL MILLIEQUIVALENTS PER LITER
Cl
ANIONS
Figure 1. Quality of seawater, rain, municipal water, and ground water in the western part of San Francisco, water year 1988. The bordered areas indicate expected composition of ground water derived solely by mixing of the labeled sources.
Hardness is an effect of alkaline-earth cations (Hem, 1985, p. 158) and results from the presence of divalent metallic cations of which calcium and magnesium are the most abundant in ground water. These ions react with soap to form precipitates and
with certain anions present in water to form scale. Because of its reaction with soap, hard water is con sidered undesirable for household cleaning purposes. The hardness in water is expressed as the equivalent concentration of calcium carbonate. The average
12 Geohydrology, Water Quality, and Water Budgets, San Francisco, California

1,000
QC Ul
izUlo ocUl Q.(OZWUID5(0
Ul"J° O in2 <N
800
400
Oo ou.oUl Q. V)
200
O O
OO
O
O O
O
Y = 766-0.612 X r = -0.70
100 300 500
WELL DEPTH, IN FEET
700
Figure 2. Variation of specific conductance with well depth in wells in the western part of San Francisco.
hardness of ground water from the western part of San Francisco is about 230 mg/L, as calcium carbonate, which is considered to be hard.
Cation exchange can produce ground water having a character other than a simple mixture of water from different sources (Todd, 1980). Most ion- exchange processes involve the adsorption of cations to microscopic particles of clay minerals, which have a large surface area and negative charge. Divalent cations tend to adsorb more strongly than monova- lent ions. Among the divalent cations, calcium tends to adsorb more strongly than magnesium; among the monovalent cations, potassium tends to adsorb more strongly than sodium. The most common cation- exchange reaction in ground-water systems is usually between calcium and sodium. If this exchange occurs on montmorillonitic clays (hydrous aluminum silicates), it can cause large changes in permeability, because clays of this type can expand and contract in
response to changes in the type of adsorbed cation. A replacement of calcium with sodium can result in decreased permeability and can cause drainage problems or decreases in the agricultural productivity of soils.
ANIONS
Bicarbonate is the most common anion in ground water in western San Francisco. Bicarbonate ions (HCO3~) are formed by dissolution of atmospheric carbon dioxide and are the dominant carbonate species when the pH is between 7 and 10. The pH of ground water in the western part of San Francisco is between 6.8 and 8.6, and the bicarbonate concentration ranges from 74 to 434 mg/L.
Concentration of chloride is higher in shallow ground water than in deeper ground water. Average chloride concentration is about 80 mg/L in wells less than 120 ft deep and is about 47 mg/L in wells greater than 120 ft deep. Chloride ions are generally conservative and nonreactive in ground water. Their movement is usually not affected by ion exchange or precipitation as mineral deposits (Hem, 1985).
Sulfate concentration in ground water in the western part of San Francisco is generally low, ranging from 2.7 to 72 mg/L. In general, the sulfate ion is stable under oxidizing and alkaline (high pH) conditions. However, a reducing to mildly oxidizing aqueous environment, coupled with acidic (low) pH, will produce the dissolved hydrogen sulfide specie. The solubility of the sulfate ion is commonly expressed as CaSO4. In many natural waters that attain equilibrium with gypsum, saturation with respect to calcite (CaCO3) also will occur.
The concentration of nitrate in ground water in the western part of San Francisco increases with sulfate concentration (fig. 3). If the relation is assumed to be linear, the slope of a regression line is 1.98 and is significantly greater than zero at a 99 percent confidence level.
The maximum allowable concentration of nitrate (as nitrogen) in drinking water is 10 mg/L (U.S. Environmental Protection Agency, 1986). This limit is exceeded at several locations in the western part of San Francisco. Water containing more than 20 mg/L of nitrate (as nitrogen) is considered harmful to infants (Driscoll, 1986). Of the 23 wells sampled in western San Francisco, 8 had nitrate concentrations
Water Quality 13

CC UI 0.<0
80
70
60
50
2 40_j _j5z~ 30 ui
<0 20
10
o
o
oo
y= 19.0+ 1.98 X / = 0.55
0 5 10 15 20 NITRATE AS NITROGEN, IN MILLIGRAMS PER LITER
Figure 3. Relation of sulfate and nitrate concentrations in ground water in the western part of San Francisco.
greater than 10 mg/L, and 11 had concentrations ibetween 5 and 10 mg/L. The maximum concentra tion detected was 17 mg/L at Arboretum well 5.
The concentration of fluoride in ground water in the study area is between 0.1 and 0.2 mg/L and is rather uniformly distributed in the western part of San Francisco. Fluoride is a natural constituent of ground water in concentrations varying from less than 0.1 mg/L to values as high as 10 to 20 mg/L (Freeze and Cherry, 1979). Solubility constraints limit the possible concentration of fluoride in the western part of San Francisco to a maximum of about 3 mg/L. Greater amounts would form a mineral with calcium and precipitate from solution. Because the concentration of fluoride ion in water is affected by ion exchange and adsorption, it is less persistent in solution than conservative ions such as chloride. Through these processes, the concentration of fluoride ion will generally decrease as water flows through and interacts with aquifer materials.
STABLE ISOTOPES
Isotopes of some elements in a water body may be useful in determining the history of and sources of ground-water recharge. The isotopes used most extensively in hydrologic studies are hydrogen-2 (2H, deuterium) and oxygen-18 (18O) (Hem 1985, p. 162). These heavy isotopes occur naturally in average proportions of 0.01 percent hydrogen and 0.2 percent oxygen in water molecules. Mass spectrometry analysis allows rapid and accurate measurement of ratios of the main isotopes that comprise the water molecule, 18O/16O and 2H/1 H. The isotope ratios are expressed in delta units (5), which are parts per thousand (%c) differences relative to an arbitrary standard known as standard mean ocean water (SMOW):
8%o = [(R-R standard)/R standard]xl,000, (i)
where R and R standard are the isotope ratios (2H/1 H or 18O/16O) of the sample and the standard, respectively. Concentrations of 2H and 18O are, in general, correlated linearly. Graphic representation of this relation is known as the meteoric water line. The departure and distribution of 18O and 2H concentrations related to this line can be used to distinguish different sources of ground-water recharge.
During the process of evaporation, water molecules containing the heavy isotopes tend to become concentrated in the residual water, while molecules containing the lighter isotopes become concentrated in the water vapor, rain, and snow. Hence, ocean water is enriched with respect to the heavy isotopes. As water vapor moves inland, the process of conden sation and precipitation is repeated many times. The vapor becomes progressively more depleted of heavy isotopes. This characteristic was observed in the local municipal water, which consists largely of water from Hetch Hetchy Reservoir in the Sierra Nevada, 200 mi east of San Francisco.
The equation describing the meteoric water line varies somewhat with geographic location. The equation used for precipitation in San Francisco is
8(2H) = 85(180)+10.89. (2)
This equation was derived from data collected at Santa Maria, California (International Atomic Energy Agency, 1981).
14 Goohydrology, Water Quality, and Water Budgets, San Francisco, California

The meteoric water line and the stable isotopic compositions of water samples from the western part of San Francisco are shown in figure 4. Several features are significant in the figure. Isotope values for samples from Lake Merced lie to die right of the meteoric water line and indicate concentration of the heavy isotopes by evaporation. The HLA V well near Lake Merced shows a similar concentration. Once in the ground, water is generally not fraction ated with respect to stable isotopes. Water from wells at the Olympic Club also shows the effects of evaporative enrichment.
Analyses of municipal water, which consists largely of water from Hetch Hetchy pipeline system, are the most depleted in heavy isotopes. Most of the water from the Hetch Hetchy system is derived from precipitation in the Sierra Nevada. Water vapor forming this precipitation has been depleted in the heavy isotopes as it moved inland, yielding the contrasting character of Hetch Hetchy water when compared with local ground water.
§ -20
to OX HccUlQ- -40
52 -60 DC UJ
UJo
-80
-100
AA
SAMPLE SOURCE
V Rain
A Lake Merced
® Mt. Davidson Spring
Municipal water
WELLS
O HLA-V
S Olympic Club
M S.F. Golf Club
O Zoo Nos. 3 and 4
A Arboretum No. 5
A Other
1-15 -10 -505
DELTA OXYGEN-18, IN PARTS PER THOUSAND
Figure 4. Stable-isotope composition of rain, municipal water, and ground water in the western part of San Francisco, water year 1988.
RELATION OF WATER QUALITY TO RECHARGE SOURCES
The chemical characteristics of ground water in the western part of San Francisco reflect the mixing and interaction of waters from several different sources. Water-quality data obtained for this study were sufficient to make tentative inferences about these sources. Firm conclusions could not be drawn in some cases because of the absence of water-quality data for sewage and irrigation-return flow, the limited distribution of wells in the study area, and the effects of chemical changes that occur within the aquifer.
Some constituents in ground water have been dis solved and transported in rain. The isotopic and chemical composition of rain is highly variable. The range of isotopic compositions defined by three samples includes nearly all ground-water composi tions. Percolating rain may also leach organic material from soils and interact with minerals in aquifer sediments.
Rain contains dissolved solids that range from several milligrams per liter in continental non- industrial areas to several tens of milligrams per liter in coastal areas (Freeze and Cherry, 1979, p. 238). In areas unaffected by urban and industrial activities, rain normally has a pH between 5 and 6. The equili brium pH for freshwater in contact with atmospheric carbon dioxide (CO2) is 5.7. A sample of rain collected near Heishhacker Zoo had a pH of 5.6. Dissolved CO2 is present in the ionic form as bicarbonate, (HC03~). Atmospheric sulfur dioxide (SO2) is a common pollutant and dissolves to form sulfate ion (SOj") and sulfuric acid in rain.
Primary dissolved constituents in rain collected in the western part of San Francisco are calcium, sodium, potassium, bicarbonate, sulfate, chloride, and nitrate. In general, local rain is a dilute, slightly acidic, and oxidizing solution that can quickly cause chemical alterations in soils and geologic materials during infiltration.
Another source of dissolved constituents in rain from coastal areas is minerals from sea spray. Runoff from a building rooftop had an ionic compo sition similar to that of seawater, indicting that the rain contained dissolved salts originating from sea spray. The effect of sea spray on water quality decreases with distance from the ocean. The effect
Water Quality 15

was difficult to verify using the data collected during this study because all the wells near the ocean were shallow, and all the wells more than 1,500 ft from the shoreline were deeper than 190 ft. Thus, sea spray effects might have J)een concealed by depth- related effects. Also, all wells less than 100 ft deep were located along the Great Highway (pi. 1) next to the Westside Transport Facility, a 2-mile-long underground storage vault for untreated wastewater. Any leaks in this vault could significantly affect water quality in the adjacent monitoring wells.
Municipal water is imported by the Hetch Hetchy pipeline system and is dilute compared with ground water. It would have a smaller influence on ground- water chemistry than would more concentrated recharge sources. The concentration of dissolved solids in San Francisco's municipal supply is less than 50 mg/L. Major dissolved constituents in municipal water are calcium and bicarbonate. The uniform background concentration of fluoride in ground water could have come from municipal ,water, sea spray, or seawater trapped in the basin "sediments at the time of deposition.
;*&"
,^ The distinct isotopic composition of municipal water did indicate that recharge of municipal water slightly concentrated by evaporation occurs near the Arboretum. In general, the isotopic composition of
.ground water would be expected to resemble more laclosely that of municipal water than that of local rain ||f municipal water were a direct major source of frecharge. However, municipal water might be evap- /oratively enriched during irrigation. Concentration would produce some deviation to the right of the meteoric water line, which is observed for many ground-water samples. Water collected from Arboretum well 5 in Golden Gate Park illustrates this point (fig. 5). A significant amount of municipal water is used for irrigation at this location. The isotopic composition of water from the Arboretum well is closer to municipal water com position than is ground water in other areas of Golden Gate Park where municipal water is not used for irrigation. It is not known whether the recharge is from leaking water or sewer pipes, or from return flow in nearby areas irrigated with municipal water.
Fluoride concentration in ground water from the western part of San Francisco is uniform and not correlated with areas of probable recharge from leaking water and sewer pipes. Concentration of fluoride ion in water from these sources averages
-20
-40
(0
oX
OC w°-
P OC
Q.
5i -60 OCw
Io
-100
SAMPLE SOURCE
Municipal water
WELLS
O Northwest Windmill
Northeast Windmill
D South Windmill
V Elk Glen
A Arboretum No. 5
Alvord
-15 -10 -5DELTA OXYGEN-18, IN PARTS PER THOUSAND
Figure 5. Stable-isotope composition of water from wells in Golden Gate Park.
about 1 mg/L, whereas the concentration in ground water is generally constant between 0.1 and 0.2 mg/L. This phenomenon may be explained, in part, by the nonconservative reaction of fluoride in solution. Fluoride ions have the same charge and nearly the same radius as hydroxide ions, so that the ions tend to replace each other in some minerals. Adsorption on aquifer materials can also remove fluoride ion from solution. For example, this occurred in other areas when reclaimed water with a high fluoride concentration was injected into an aquifer containing low-fluoride water (Hamlin, 1985). The concentration of fluoride ion in San Francisco ground water may be similarly affected and buffered by the processes of ion exchange and adsorption.
Sewage contains municipal water and, at times, runoff from rainfall. As a result, it probably has a highly variable isotopic composition. It might be difficult to distinguish on this basis, unless seasonal trends were apparent. Recharge from leaking sewers is indicated by the relatively high concentration of
16 Geohydrotogy, Water Quality, and Water Budgets, San Francisco, California

potassium in ground water beneath residential and commercial areas. High potassium values are occa sionally observed as a result of pollution from sewage (Matthess, 1982). A study conducted on Long Island, New York, (Kimmel, 1972) determined that leaking sewers above the water table were a significant source of artificial recharge and a major contributor to the high nitrogen content of the ground water. In general, sewage contains high concentrations of dissolved solids, including plant nutrients and organic chemicals, and may also introduce bacteria to the ground water.
The high concentration of nitrogen in many sam ples, particularly from shallow wells, could be from sewers or fertilizers. Natural processes, such as bulk precipitation, sorption, and decomposition of guano could have added nitrogen to ground water prior to urbanization of the western part of San Francisco. The sand dunes that covered much of the area sup ported little vegetation (Olmsted and Olmsted, 1979). With little loss due to plant uptake or microbial activity, nitrates could have percolated easily through the highly permeable sands. Nitrogen-loading rates from natural processes might have been about 21 <lb/acre)/yr (Colt and others, 1977). Assuming that 30 percent of the 21.5 in. of annual rainfall on the dunes was lost to evaporation and that the remainder dissolved all the nitrogen, the resulting ground-water recharge would have a concentration of about 6 mg/L. A study of the Los Osos ground-water basin on the California coast 190 mi south of San Francisco also found that nitrates and dissolved ,solids were correlated only for nitrate concentrations greater than 6 mg/L as N, indicating that lower values were probably derived from natural sources (Brown and Caldwell, 1983). Because high concen tration of nitrate in ground water originates most commonly from human activities, its presence is taken as evidence of contamination. Pathogenic bacteria may accompany contamination from waste- water. Analyses by the San Francisco Department of Public Health (Lorraine Anderson, San Francisco Department of Public Health, written commun., 1988) have detected fecal coliform bacteria at Stem Grove and at Arboretum well 5, indicating contam ination by wastewater.
Residual water-quality effects from predevelop- ment recharge are probably small because most of that water would have already left the basin. Meas ured water-level gradients and hydraulic conductivity
indicate that ground-water recharge at the eastern edge of the basin would flow to the ocean in as little as 40 years; the western part of San Francisco has been developed for more than 50 years.
Buried peat layers occur within the Merced Formation (Hunter and Clifton, 1982) and could be another source of nitrogen in ground water. How ever, these layers are generally deeper than the aquifers containing high nitrate concentrations.
The correlation of nitrate with sulfate in ground water, but not with chloride, indicates that irrigation-return flow containing fertilizers might be a significant source of recharge. Ammonium sulfate (NH4SO4) is a commonly used turf fertilizer and could be the source of both the nitrate and the sulfate. However, the lack of correlation between nitrate and chloride could be the result of other independent sources of chloride such as sea spray or connate water in the basin sediments. Most of the chloride in shallow ground water is probably derived from near-surface sources. For example, the average concentration of chloride during 1987 in sewage flowing out of the Richmond-Sunset Water Pollution Control Plant was 145 mg/L. Average chloride con centration in shallow wells (less than 120 ft deep) is about 80 mg/L, whereas deep wells (greater than 120 ft deep) have a value of about 47 mg/L. Evaporation of water used for irrigation tends to concentrate dissolved solids. The primary constituents of com mercial fertilizers are sulfate, nitrate, phosphate, calcium, potassium, magnesium, urea, and ammo nium (Matthess, 1982).
A study of seawater intrusion along the California coast in 1958 found no evidence of intrusion along the coastline of San Francisco (California Depart ment of Water Resources, 1958). Data collected for the current study also show no evidence of seawater intrusion at the present time (1989). The seawater- freshwater interface is located in the beach only a few feet from the surf zone. A shallow underground seawater intake for the Steinhart Aquarium in Golden Gate Park is buried in the beach at the west end of the park. Freshwater has occasionally entered the collector when the natural seasonal buildup of sand on the beach was greater than usual. Deeper in the ground-water basin, the seawater-frcshwater interface is seaward of all existing deep wells near the coast, at least to the depths penetrated by the wells.
Water Quality 17

Lake Merced affects the chemistry and isotopic composition of the ground-water system. Water in the HLA V and Olympic Golf Club wells, which are downgradient from and thus receive recharge from the lake, are clearly enriched with heavy isotopes and slightly enriched in chloride, compared with water in upgradient wells. Both of these changes are caused by evaporation from the lake surface. The down-gradient wells also have low nitrate concen trations as a result of near-total nitrogen removal by plants and algae in the lake. Isotopic enrichment possibly could be from irrigation-return flow concentrated by evaporation, but this is unlikely for two reasons: (1) a thin, shallow clay layer is present at the Olympic Club and would tend to impede recharge in that area, and (2) the low concentration of nitrates, similar to the lake water, is unlike ground water at all other irrigation wells where irrigation- return flow could be causing evaporative enrichment of isotopes. Stable-isotope data in the Lake Merced area showing evaporative enrichment follow a line that has a slope of 4.9. Evaporation from surface- water bodies is a nonequilibrium process that results in enrichment of the remaining water in deuterium
s^m and oxygen-18 (18O) such that the 8(2H)/ 6(18O) slope is usually between 3 and 6 (Tyler Coplen, U.S. Geological Survey, written common., 1987).
The relatively high concentration of nitrate (11 mg/L as N) in ground water upgradient of the lake,
.combined with the large rate of seepage (811 acre- jffi/yr) into the lake creates a nitrogen load of 24,000 ilbs/yr, or about 88 Ibs/yr per acre of lake surface. This is probably at least twice the natural rate of nitrogen influx from ground water prior to urbani zation. Hie biological effects of the increased nitrogen load could be significant but were not measured during this study.
Use of ground water in the western part of San Francisco is limited by the presence of coliform bacteria and by nitrate concentrations that exceed U.S. Environmental Protection Agency's drinking- water standards. The quality of ground water is suitable for irrigation and other nonpotable uses.
WATER BUDGETS
GOLDEN GATE PARK AND LAKE MERCED AREA
An annual ground-water budget is an itemized accounting of all inflows, outflows, and changes in storage that occur during a year. Ordinarily, a water budget is estimated for an entire ground-water basin. This minimizes errors caused by subsurface inflow, which is negligible across impermeable basin bound aries. For this study, ground-water budgets were developed only for Golden Gate Park and the Lake Merced area which are relatively small areas within the ground-water basin. Consequently, subsurface flow to and from surrounding parts of the ground- water basin were large items in the ground-water budgets for these local areas. A ground-water budget was developed for each area for water year 1988. Less information was available to develop long-term average ground-water budgets. However, estimates of the average annual ground-water budgets for water years 1976-83 were made using the best available information. The 1976-83 period was chosen because average annual rainfall approx imately equaled the long-term mean and because water-use patterns were similar to those in 1988. However, the winter of 1983 was considerably wetter than normal, and ground-water levels may not have responded fully by September 1983. This possibility increases the uncertainty of the estimate of change in average annual storage. The ground-water budgets are shown in table 2.
INFLOW
Infiltration of rainfall, Irrigation water, and lake water. -Recharge of ground water occurs when rain fall or irrigation water percolates downward from the ground surface to the water table. Water percolates past the root zone of plants only when soil moisture is high, as can happen during irrigation or during periods of sustained rainfall. Recharge also occurs only in areas where the soil is exposed and not covered with impermeable surfaces, such as pave ment and buildings. Other processes affecting soil
18 Geohydrology, Water Qualify, and Water Budgets. San Francisco, Caafornia

Table 2. Ground-water budgets for Golden Gate Park and the Lake Merced area, water years 1976-83 and 1988
[All values are in acre-feet per year and are rounded to the nearest 10 acre-feet per year]
Item
Golden Gate Park
1976-83
Inflow Rainfall recharge . . Irrigation-return
flowLeaking water
pipes .........Leaking sewer
pipes .........Ground-water
inflow
Total .........
Outflow Pumpage .......Net evaporation and
transpiration .... Ground-water
outflow .......
Total .........
Change in storage1 . . Inflow-outflow
850
610
60
0
570
2,090
1,020
0
1,070
2,090
0
1988
480
680
70
0
620
1,850
1,140
20
980
2,140
-290
Lake Merced area
1976-83
1,150
740
250
240
1,040
3,420
1,150
180
2,220
3,550
-130
1988
670
910
270
230
1,020
3,100
1,410
400
2,010
3,820
-720
Negative values indicate a decrease in aquifer storage.
moisture and deep percolation are surface runoff, depression storage (puddles), and evapotranspiration. The combined effect of these processes was evalu ated using a soil-moisture accounting algorithm. The algorithm calculated monthly soil-moisture budgets by using information for land use, rainfall distri bution, runoff characteristics, temperature, root depth, soil properties, and irrigation practices.
Land use was determined from aerial photographs, onsite inspection, and information from the Recrea tion and Park Department. Land use in the Lake Merced area and the amounts of impervious, irri gated, and nonirrigated land surface in Golden Gate Park and selected areas near Lake Merced and the zoo are shown in table 3.
Average annual rainfall was estimated from records for 27 rain gages operated by the San Francisco Gean Water Program. Average annual rainfall during water years 1976-83 was 23.0 in. in Golden Gate Park and 21.3 in. in the Lake Merced area. Rainfall during water year 1988 was only about 67 percent of normal.
On impervious areas, all rainfall except a small amount lost to depression storage was assumed to run off. Depression storage on impervious areas is about 0.07 in. for each storm (Overton and Meadows, 1976), which is equivalent to about 1.0 in/yr. On pervious surfaces, all rainfall in excess of 6 in. in any month was assumed to run off. Maxi mum soil infiltration rates (Eric Vinson, U.S. Soil Conservation Service, written commun., June 14, 1988) are greater than all but the most intense rainfall rates, which occur only for brief periods (Metcalf and Eddy, 1980, p. 4-22). Most of the rain therefore is absorbed at the soil surface. However, Rantz (1974) indicated that average annual runoff from pervious areas in western San Francisco is about 5 in/yr. This estimate includes rain that infiltrates and later emerges as baseflow in streams. In- Golden Gate Park, Stem Grove, and the golf courses, runoff from impervious surfaces was assumed to flow onto adjacent soil areas and infil trate. In the zoo and urban areas, runoff from impervious surfaces flows into storm drains and out of the area.
Evapotranspiration of soil moisture by plants with ample water is probably between 33 and 36 in/yr for the San Francisco area (California Department of Water Resources, 1975; Pruitt and others, 1987). Evapotranspiration in Golden Gate Park and the Lake Merced area is probably only 60 to 90 percent of this rate because of the effects of coastal fog and
Water Budgets 19

Table 3. Estimated land use, irrigation, and ground-water recharge in Golden Gate Park and the Lake Merced area, water years 1976-83 and 1988
[Ground-water recharge includes only recharge firom rainfall and irrigation-return flow; acre-ft/yr, acre-feet per year]
Location Impervious
Land use (acres)
Pervious Irrigation
Total (acre-ft/yr)
Ground-water recharge
(acre-ft/yr)
Irrigated Nonirrigated 1976-83 1988 1976-83 1988
Golden Gate Park 31 608 405 1,044 1,519 1,700 1,461 1,162
Lake Merced area Fleishhacker Zoo ..... Golf courses ........Stern Grove .........Residential and
commercial ........Beach, bluffs,
and lakeshore ......Total for Lake
Merced area1 .....
17 11
1
946
10
985
46 39646
248
0
736
31 17031
165
485
882
94 57778
1359
495
2,603
115 995115
623
0
1,848
143 1 2^4
129
773
0
2,279
106855108
567
256
1,892
96 ROO
85
513
90
1.584
Excluding the 280 acres occupied by Lake Merced.
breezes (California Department of Water Resources, 1975). Pan evaporation near Lake Merced during 1987-88 confirmed the coastal effect.
.Average annual potential evapotranspiration near the* coast is probably about 24 to 27 in.
*&- Irrigated vegetation was assumed to use water at*^the potential rate, adjusted for plant type. Irrigation
efficiency was assumed to be 60 percent Nonirri gated vegetation uses less water when soil moisture becomes depleted. The soil-moisture accounting algorithm calculated soil-moisture depletion and actual evapotranspiration for nonirrigated vegetation from soil-moisture retention characteristics of the soils. Table 3 shows the estimated areas and irriga tion quantities of irrigated and nonirrigated soils in Golden Gate Park and the Lake Merced area.
Deep percolation of soil moisture to the water table was assumed to occur whenever the amount in storage exceeded the field capacity of the root zone. Monthly soil-moisture budgets were calculated separately for irrigated and nonirrigated areas. Annual ground-water recharge from rainfall and
irrigation-return flow was determined by summing monthly values and is shown in tables 2 and 3. In Golden Gate Park, recharge from these sources averaged about 1,460 acre-ft/yr during 1976-83 and about 1,160 acre-ft/yr in 1988. In the Lake Merced area, it averaged about 1,890 acre-ft/yr during 1976-83 and about 1,580 acre-ft/yr in 1988.
There are no streams in Golden Gate Park or the Lake Merced area. All lakes in Golden Gate Park are artificial and ground water is pumped into them. Several of the lakes, especially Lloyd Lake and North Lake, leak a considerable amount of water, which then percolates back to the water table (Frank Bezek, San Francisco Recreation and Park Department, oral commun., 1988). The amount of water pumped into the lakes is not measured, and the leakage rate is assumed to be accounted for by the 4 percent leakage rate assumed for the overall irrigation system. In the Lake Merced area, Pine Lake and Lake Merced are natural lakes in direct hydraulic connection with ground water. Neither lake has a surface outlet that flows on a regular basis, although seepage to and from the ground- water system occurs through the lakebeds.
20 Geohydrology, Water Qualify, and Water Budgets, San Francisco, California

Leakage from water and sewer p/pes.-Leaking water and sewer pipes can be a significant source of recharge in residential and commercial areas. There are irrigation pipes beneath parks, but few water or sewer pipes beneath undeveloped land. Recharge from leaks is small in undeveloped areas.
The San Francisco Water Department surveys a part of the water distribution system for leaks each year. The surveys have been done since 1961, and the leakage rate has typically been about 4 percent (Pitometer Associates, 1987).
Irrigation accounts for almost all water use in Golden Gate Park and totaled 1,519 acre-ft/yr during 1976-83 and 1,700 acre-ft/yr in 1988. If the leak rate for irrigation pipes is conservatively assumed to equal the leak rate for municipal water mains (about 4 percent), they contributed about 60 and 70 acre- ft/yr of recharge in 1976-83 and 1988, respectively. Water use and pipe leakage in the Lake Merced area was estimated from citywide water use. The amount of imported water used in San Francisco averaged 101,000 acre-ft/yr during 1976-83 and was about 107,000 acre-ft/yr in 1988 (Thomas Dickeraian, San Francisco Water Department, written commun., 1988). About 31 percent of the citywide total is used in the service area of the Richmond-Sunset Water Pollution Control Plant (Metcalf and Eddy, 1980, p. 4-5), which includes about 8,400 acres of residential and commercial land. Assuming that this water-use rate per unit area is correct for the residential and commercial parts of the Lake Merced area, annual imported water use in that area was 5,070 acre-ft/yr in 1976-83 and 5,350 acre-ft/yr in 1988. Irrigation at golf courses, Stem Grove, and the zoo totaled about 1,230 acre-ft/yr in 1976-83 and 1,510 acre-ft/yr in 1988. Assuming a leakage rate of 4 percent, ground-water recharge from this source was 250 acre-fi/yr in 1976-83 and 270 acre-ft/yr in 1988.
Sewers are designed to be watertight, but leakage of sewage into the ground is common, especially from old sewers (Todd, 1980, p. 317). The city of San Francisco uses a combined sanitary and storm sewer system. Infiltration of ground water into sewers below the water table may range from 0.0001 to more than 0.040 Mgal/d per mile of sewer line (Miller, 1980). In the western part of San Francisco, sewer lines are generally above the water table which
promotes leakage of sewage. The principal variables that control the volumes of infiltration or exfiltration are the age and condition of the sewers and the types of joints used to connect lengths of pipe. Kimmel (1972) attributed a rapid recovery of the water table after a decrease in ground-water pumpage largely to a combination of leakage from sewer and water pipes on Long Island, New York.
Sewer pipes in San Francisco are not routinely tested for leaks, but a scheduled maintenance pro gram is in effect. Most of the sewer pipes in the western part of San Francisco are 40 to 70 years old and are made of clay pipe with mortared joints or are made of reinforced concrete (San Francisco Department of Public Works, 1974). Except possi bly in areas within a block or two of the ocean, sewers in the Golden Gate Park and the Lake Merced area are above the water table and tend to lose rather than gain water by seepage. A leakage rate of 4 percent, which equals the leakage rate from water pipes, was assumed for this study.
San Francisco has a combined sewer system; sewer flow is derived from wastewater and rainfall runoff. Wastewater probably equals about 98 percent of municipal nonirrigation use (California Department of Water Resources, 1983, p. 9). Monthly municipal nonirrigation use was assumed to be constant and equal to total water use during the month of lowest monthly use. Monthly water-use data for 1977-87 indicate that municipal nonirrigation use is about 88 percent of total annual water use. Multiplying these percentages by the amount of imported water used in residential and commercial parts of the Lake Merced area indicates that wastewater flow was about 4,370 acre-ft/yr in 1976-83 and 4,610 acre-ft/yr in 1988.
Rain falling on pavement and rooftops in resi dential and commercial areas enters the sewer system through storm drains. Subtracting 1.0 in. of depres sion storage from annual rainfall, and multiplying by the amount of impervious area yields annual runoff volumes of 1,600 acre-ft/yr during 1976-83 and 1,220 acre-ft/yr in 1988. Combining this with the wastewater flow and multiplying by a leakage rate of 4 percent indicates that ground-water recharge from leaking sewers was about 240 and 230 acre- ft/yr in 1976-83 and 1988, respectively. The recharge rates are similar because the increase in wastewater flow was offset by low rainfall in 1988.
Water Budgets 21

Ground wo/er.-Except in a few places along the perimeter of Golden Gate Park, the boundaries of the park and the Lake Merced area do not coincide with the boundaries of the ground-water basin underlying the western part of San Francisco. Ground water in Golden Gate Park and the Lake Merced area flows to and from adjacent parts of the ground-water basin.
Water-level contours in the vicinity of Golden Gate Park (pi. IB) indicate that ground-water flow is generally westward. Ground-water inflow across the east end of the park was assumed to equal the amount of recharge from rainfall, irrigation, and leaking water and sewer pipes in a ISO-acre area of tributary ground-water flow. The tributary area is bounded by bedrock and flow divides. The inflow from the tributary area was estimated to equal 60 acre-fl/yr during 1976-83 and 50 acre-fl/yr in 1988.
Under predevelopment conditions, there was prob ably no net natural flow across the north and south boundaries of the park, which approximately coin cided with flow lines. However, pumping at wells in
*the park probably induces a significant amount of inflow across those boundaries. Because the wells are all close to either the north or the south boundary, one-half their total pumpage was assumed to come from outside the park. Inflow due to pumpage was about 510 acre-fl/yr during 1976-83 and 570 acre-fl/yr in 1988.
tv Ground-water inflow across the eastern side of the"Lake Merced area was assumed to equal the amount^>f recharge and storage change occurring in the
44,380-acre area of tributary ground-water flowbetween the Lake Merced area and Mount Davidson(pi. 1A). Storage changes in the tributary area werecalculated by assuming similar aquifer properties andhydraulic-head changes as in the shallow aquifer inthe Lake Merced area. Inflow from the tributaryarea was about 1,040 acre-ft/yr during 1976-83 and1,020 acre-fl/yr in 1988. The northern side of theLake Merced area was assumed to be a no-flowboundary because it is approximately parallel to thedirection of ground-water flow.
OUTFLOW
Pump/n0.--Most ground-water withdrawals in the western part of San Francisco are for irrigation at Golden Gate Park, Heishhacker Zoo, private golf courses, Lake Merced, and Stem Grove. The irrigation season is generally from April through
October. In 1988, however, the irrigation season began in February because of below-average winter rainfall. A small amount of water is pumped during the winter months for irrigation and other nonpotable uses. The San Francisco Recreation and Park Department operates the largest number of wells. Seven wells in Golden Gate Park supply irrigation water and maintain artificial lakes. Two wells are used at Heishhacker Zoo to provide nonchlorinated water for the Penguin Pool and to supply water for irrigation in the zoo and along the Great Highway. One well at Stem Grove supplies irrigation water to the park. Additionally, water is pumped from Lake Merced to irrigate Harding Park Golf Course. The Olympic Golf Club and San Francisco Golf Club each have two irrigation wells.
Pumping rates and well efficiency values of the San Francisco Recreation and Park Department wells were measured in June 1988. Personnel at the private golf clubs also provided well pumpage information. Monthly pumpage for each well during water year 1988 is shown in table 4. None of the wells were equipped with flow meters, but hour meters were installed at most wells during 1988. Pumpage at these wells was estimated by multiplying pumping time by pumping rate. An estimate of pumpage at the San Francisco Golf Club was sup plied by Mr. Robert Klinestecker (San Francisco Golf Club, oral commun., 1988). A similar estimate of water pumped from Lake Merced was given by Mr. Thomas Standing of the San Francisco Water Department (oral commun., 1988). The smallest use of ground water was at Stern Grove and ranged from 0 to 1.5 acre-fl/mo. The Elk Glen well was the largest producer, averaging 80 acre-ft/mo in mid summer, or more than twice as much as the second most productive well. Pumpage totals in July 1988 were 175 acre-ft at Golden Gate Park, 18.2 acre-ft at Heishhacker Zoo, 1.2 acre-ft at Stem Grove, 18 acre-ft at Lake Merced, 63 acre-ft at the Olympic Club, and 18 acre-ft at the San Francisco Golf dub.
Measured pumpage quantities were used to verify irrigation rates calculated by the soil-moisture budget accounting algorithms. Annual amounts could be only approximately compared because measured pumpage data were available for most wells only for a few summer months. Total measured pumpage in Golden Gate Park averaged 150 acre-fl/mo during July-September 1988. Assuming a 7-month irrigation season (1988 was a relatively dry year), annual pumpage would be about 1,050 acre-ft The actual total may be somewhat higher because metered data
22 Goohydrology, Water Quality, and Water Budgets, San Francisco, Caiifomia

Table 4. Discharge rate and monthly pumpage of wells in Golden Gate Park and the Lake Merced area, water year 1988
[Location of wells shown on plate 1A. gal/min, gallons per minute; acre-ft, acre-feet; --, no data]
Map No.
1 2 3 4 5 6 7
20 21 22 24 27 28 29
Discharge Well name rate
(gal/min)
Northwest Windmill . . . Northeast Windmill . . . South Windmill ......Elk Glen ...........Arboretum No. 5 ..... Arboretum No. 4 .....Alvord ............Zoo No. 4 ..........Zoo No. 3 ..........Stern Grove irrigation . . Lake Merced ........Olympic Club North . . . Olympic Club South . . . San Francisco
Golf Club .........
685 506
1,240 1,600
220 510 328 390 725 121
1,000 1,200
700
Pumpage (acre-ft)
Oct. Nov. Dec. Jan. Feb. Mar. Apr. May
.. 14
.. 17 .. .. .. .. .. .. 61
16 7 - -- 126 11 11 10
0 0.3 0.9 .3 .3 0 .3
.. 27
.. 20
June
19
24 95
13
1.5
29 20
July
20 17 25 83
5.5 15 11 17
1.2 1.2
3 18
39 24
3 18
Aug.
19 15 13
55 5.8
13 11 17
1.2
12 20
Sept.
17 13 20
71 5.8
11 9
14 .3
23 14
Cumulative pumpage for December to February. ^Includes pumpage during December and January. Estimated by well operator.
at two wells with longer periods of record indicate that some pumpage occurred in all months (table 4). The soil-moisture algorithm indicated that pumpage
; ;in the park was about 1,140 acre-ft, which equals ^two-thirds of total irrigation in the park. Approxi mately one-third of the park is irrigated with munic ipal water. The two estimates of pumpage are simi lar, given the uncertainties of the assumptions in deriving them.
Irrigation requirements calculated with the soil- moisture budget accounting algorithm were used to extend the partial record of pumpage to include all of water year 1988. Total pumpage in Golden Gate Park was about 1,020 acre-ft/yr during 1976-83 and 1,140 acre-ft/yr in 1988. Total pumpage in the Lake Merced area was about 1,150 acre-fiVyr during 1978- 83 and 1,410 acre-ft/yr in 1988.
Evaporation and fransp/rof/on.-Lake Merced is an exposed part of the water table, and for the purpose of calculating a ground-water budget for the shallow aquifer, the lake was considered as part of the aquifer. In this context, rainfall and runoff directly entering the lake are inflows to the aquifer, evaporation and transpiration are outflows; seepage
through the lakebed is an internal flow within the ground-water system. Net evaporation and trans piration are listed as a single item in the water budget and were calculated as the sum of rainfall and local runoff minus the sum of evaporation from the lake and transpiration by tules. Pumpage from the lake and storage changes are accounted for elsewhere in the ground-water budget In water year 1988, net evaporation and transpiration equaled 400 acre-ft, and during 1976-83 averaged about 180 acre-ft/yr. Note that in the water budget for Lake Merced described in the following section, seepage through the lakebed is explicitly included as a budget item.
The combined area of the 10 lakes in Golden Gate Park is about 31 acres. The lakes are artificial and are filled by wells in the park. Some of the water returns to the ground-water system by seepage through the lakebeds. The net loss of ground water through evaporation from the lakes was calculated in the same manner as for Lake Merced. Because rain fall is slightly higher in Golden Gate Park than in the Lake Merced area, net evaporation from these lakes was only about 20 acre-ft in 1988 and almost zero during 1976-83.
Water Budgets 23

Except for the tules surrounding Lake Merced, there are probably no areas where phreatophytic plants transpire a significant amount of water directly from the water table.
Ground water.-Ground-water outflow to the ocean from Golden Gate Park in 1988 was estimated using Darcy's Law, which relates discharge to the hydraulic conductivity of the aquifer, aquifer thickness, and the water-level gradient perpendicular to the coast. Horizontal water-level gradients can vary with depth, depending on the extent of aquifer confinement and the vertical distribution of pumpage and recharge. The data are too limited to identify these vertical variations, and it was assumed that the horizontal gradient was constant with depth.
An average water-level gradient of 0.010 wascalculated from winter water levels in the Elk Glenand Northeast Windmill wells. The summer gradientwas probably smaller because of seasonal headdeclines. Similar gradients were measured between
jwells on 44th Avenue and the ocean (pi. L4) and?Jwere estimated from water-level contour mapsDeveloped by previous investigators (Dames and||[oore, 1979; Harding-Lawson Associates, 1987).An average gradient of 0.012 was assumed for 1988.Using the average horizontal hydraulic conductivityof 15 ft/d and assuming a 300-ft flow thickness,outflow across the west end of the park was 980,acre-ft in 1988. The 300-ft depth is the approximate
.^epth of wells used to determine the gradient.Outflow from deeper parts of the basin was assumedto be small because flow paths are longer andJiydraulic conductivities are probably smaller. Asaltwater interface forces outflow upward into theshallow part of the basin, where it is accounted forby the measured gradients.
Ground-water outflow from Golden Gate Park during 1976-83 was calculated as the residual of the ground-water budget by assuming that there was no net change in storage. The resulting average annual outflow of 1,070 acre-ft/yr (349 Mgal/yr) is slightly greater than outflow in 1988, which is consistent with the probable occurrence of slightly steeper gradients during the earlier period.
The natural flow of ground water toward the ocean is sufficient to sustain pumping at the windmill wells without causing seawater intrusion. The South Windmill, Northeast Windmill, and Northwest Windmill wells are all only a few hundred feet from the ocean, yet saltwater has never been reported at
the wells in more than 50 years of use. Even in a dry year (1988), ground-water outflow through the upper 300 ft of the basin near Golden Gate Park amounts to 0.45 acre-ft/yr per linear foot of coastline. Annual pumping at the two wells at the North Windmill probably does not exceed 200 acre-ft, which could be supplied by intercepting the outflow along only 500 ft of coastline. The South Windmill well would need to intercept outflow along only 325 ft of coastline. Although ground-water outflow appears to be sufficient to supply the wells on an annual basis, seawater intrusion could occur temporarily during the peak pumping season.
Outflow to the ocean across the western side of the Lake Merced area was calculated separately for shallow and deep parts of the basin. '~ Outflow through the shallow aquifer was calculated as part of the water budget for Lake Merced described in following sections. Outflow was about 300 acre-ft/yr during 1976-83 and 260 acre-ft/yr in 1988. Outflow from die deep part of die aquifer system was assumed to occur only along the northernmost 2,000 ft of the western side because natural outflow farther south was assumed to be intercepted by pumping at the Olympic Golf Club and in Daly City. A seaward water-level gradient of 0.005 was assumed, which is less than in the shallow aquifer because of the probable effects of deep pumping at inland locations. Outflow from the deep aquifer system was calculated to equal 415 acre-ft/yr during 1976-83 and 380 acre-ft/yr in 1988.
Outflow across the southern side of the Lake Merced area probably occurs because of heavy pumping and low ground-water levels south of the area. In August 1988, water levels in wells at the Olympic Golf dub and San Francisco Golf dub averaged about 46 ft below sea level. Water levels in four Daly City municipal wells along an east-west line 4,000 ft to the south averaged about 100 ft below sea level (Michael Abramson, Daly City, Department of Water and WastOvater Resources, written commun., 1988). Applying this gradient to a cross-sectional flow area 300 ft deep and 2,900 ft wide and using an average hydraulic conductivity of 15 ft/d yields an outflow estimate of 1,370 acre-ft in 1988.
A map of water-level contours in the Daly City area in 1971 (Kirker, Chapman, and Associates, and Todd, 1972) indicates that water levels near the Daly City municipal wells were around 100 ft below sea level. Water levels in 1971 near wells in the San
24 Geohydrology, Water Quality, and Water Budgets, San Francisco, California

Francisco Golf Club and Olympic Golf dub were around 10 and 25 ft below sea level, respectively. This indicates that the water-level gradient across the southern boundary was probably steeper during 1976-83 than in 1988. On this basis, an average annual outflow of 1,505 acre-fl/yr was estimated for 1976-83.
The water budgets were balanced by adjusting the estimate of ground-water outflow. Adjustments were limited to a reasonable range of values defined by available information about the system. Additional constraints were imposed by the assumptions that aquifer properties and flow thicknesses did not change between the 1976-83 and 1988 budget periods and that they were constant throughout each area.
Ground-water outflow was a large item in the water budgets, so slight adjustments of the assumptions used in the calculations resulted in large changes in the overall water budget. For example, if hydraulic conductivity were assumed to be 20 ft/d instead of 15 ft/d, and if assumed flow thicknesses were increased by 20 percent, calculated ground- water outflow from the Lake Merced area in 1988 would have been larger by 1,210 acre-fi/yr. This is larger than any of the individual inflows listed in the water budget.
The budgets were balanced by slight adjustments to the estimated hydraulic-head gradient used to calculate ocean outflow. The resulting estimated gradient for 1988 was slightly smaller than that for 1976-83, as would be expected given the dry condi tions that occurred in 1988. In the Lake Merced area, the 1988 budget was balanced by slight adjust ments to the estimated width of outflow across the southern boundary of the area. When the adjusted width was used in the 1976-83 budget, the result was a slight annual decrease in storage, which is con sistent with the observed decline in Lake Merced.
STORAGE CHANGES
Storage changes were calculated by multiplying changes in water level by the estimated storage coefficient of the aquifers in Golden Gate Park and the Lake Merced area. In Golden Gate Park, water-level declines during 1988 were interpolated between wells and assigned to subareas of the park. Assuming a storage coefficient of 0.10, which is a
representative value determined from aquifer tests, the decrease in storage was about 290 acre-ft. It was assumed that there was no net storage change in Golden Gate Park during 1976-83 because there is no evidence indicating long-term water-level changes.
The storage decrease in the Lake Merced area during 1988 was calculated using the measured water-level decline of 1.6 ft in Lake Merced and a slightly smaller average water-table decline throughout the surrounding shallow aquifer. The decrease in Lake Merced volume was 370 acre-ft Assuming a storage coefficient of 0.10, storage in the surrounding aquifer decreased 350 acre-ft. Total decrease in storage was 720 acre-ft.
Storage change in the Lake Merced area during 1976-83 was calculated as the residual of the water budget. The annual decrease in storage of 130 acre-fi/yr was consistent with the average annual decline in the level of Lake Merced, which is probably between 0.06 and 0.40 fi/yr. If this same decline is also occurring in shallow ground-water levels throughout the Lake Merced area, total average annual storage change would be between 30 and 210 acre-ft/yr.
Most of the change in ground-water storage in the Lake Merced area is probably accounted for by changes in lake level and the water table. Because the storage coefficient .of the deep confined part of the aquifer system is relatively small, large changes in head are required to create large volumetric changes in storage. Rapid declines in head did occur during 1940-70, but available data do not indicate that those declines continued to occur in 1976-83 or 1988.
COMPARISON OF WATER BUDGETS
In Golden Gate Park, about 41 percent of the annual inflow is from rainfall under normal climatic conditions (1976-83). Ground-water inflow and irrigation-return flow are about equal and make up most of the remaining inflow. Recharge from rain fall is independent of pumpage, but depends greatly on annual rainfall, which varies considerably from year to year. Rainfall during water year 1988 was 79 percent of normal, and recharge from rainfall was 56 percent of normal. Irrigation-return flow and most of the ground-water inflow result from pumpage, which generally varies less than rainfall
Water Budgets 25

Pumpage and ground-water outflow are the signifi cant outflows from Golden Gate Park and arc about equal in magnitude. In dry years, such as 1988, most of the decrease in rainfall recharge (370 acre- ft/yr) is compensated for by a decrease in storage (290 acre-fVyr). The rest is compensated for by a decrease in ground-water outflow (90 acre-ft/yr).
In the Lake Merced area, rainfall recharge and ground-water inflow each made up about one-third of the total annual inflow during 1976-83. Irrigation- retum flow contributed about one-fifth of the inflow, and leaking sewer and water pipes accounted for the rest In 1988, rainfall recharge was only about 58 percent of normal, but ground-water inflow remained almost unchanged. Total inflow was 10 percent (330 acre-ft) less than during 1976-83.
Ground-water outflow to the ocean accounted for about 20 percent of total outflow from the Lake Merced area during 1976-83. Ground-water outflow to pumping centers south of the area amounted to 43
^percent of total outflow. Pumpage within the area ^accounted for about 32 percent of total outflow. Net evaporation and transpiration of ground water accounted for 5 percent of outflow during 1976-83 and 10 percent in 1988. The additional 600 acre- ft/yr of storage loss in 1988 resulted principally from a decrease in rainfall recharge (480 acre-ft/yr),
-increases in pumpage (260 acre-ft/yr), and net evapo- sration and transpiration (220 acre-ft/yr). However, jtjiese factors were partly offset by an increase in Imgation-retum flow (170 acre-ft/yr) and a decrease in ground-water outflow (210 acre-ft/yr).
The principal sources of ground-water recharge in residential and commercial areas arc quite different from those in Golden Gate Park and undeveloped parts of the Lake Merced area. In residential and commercial parts of the Lake Merced area, rainfall recharge and irrigation-return flow occur on a small part of the total area, which is 70 percent imper vious. Recharge from these sources in 1988 was equivalent to a uniform recharge rate of 0.38 ft/yr averaged over the total residential and commercial area. Municipal water deliveries were about 3.9 ft/yr on an areally averaged basis and sewer flow (includ ing municipal wastewater and rainfall runoff from impervious areas) was about 4.4 ft/yr. Total water deliveries and sewer flow thus equaled 8.3 ft/yr. Assuming a 4 percent leakage rate for water and sewer pipes, ground-water recharge from leaks was 0.33 ft/yr in 1988, which is 88 percent as large as recharge from rainfall and irrigation-return flow.
This percentage is about 80 percent under normal climatic conditions (1976-83). These calculations demonstrate that even if water and sewer pipes leak at a rate of only 4 percent, they arc still significant sources of recharge in urban areas.
LAKE MERCED
Lake Merced is separated from the Pacific Ocean by a band of sand-covered hills about 1,000 ft wide (pi. 1C). The total surface area of the lake is 273 acres, and its volume is about 3,710 acre-ft at its recent average water level of 11.7 ft above sea level (Entrix, 1988). Estimates of its original, natural drainage area range from 3.4 mi2 (Shoup and Baker, 1981) to 8 mi2 (Fahy, 1974). The lake is divided into three sections: North Lake, South Lake, and Impound Lake. A narrow strip of land, described as a dam in early reports, separates North Lake from South Lake. North Lake has two basins connected by a narrow strait. South Lake is the largest section of the lake. Impound Lake, the smallest and southernmost section, is separated from South Lake by a concrete causeway on an artificial sand berm.
The bathymetry of the lake was surveyed in 1987 (Entrix, 1988). The maximum depth in North Lake is 24 ft and average depth is 13 ft. The maximum and average depths of South Lake are 23 and 16 ft, respectively. The maximum and average depths of Impound Lake are 12 and 8 ft, respectively. Bottom topography is generally flat and smooth. Depths greater than average were measured at a few isolated locations.
North and South Lakes arc directly connected by a culvert, which is usually left open (Robert Killian, San Francisco Water Department, oral commun., 1987). The source of freshwater to the lakes includes ground-water inflow, urban runoff, and rainfall. Maximum water level is controlled by an overflow structure near the midpoint of the southeast shore of South Lake. The altitude of the overflow spillway is 20.14 ft (Entrix, 1988).
A separate water budget was calculated for Lake Merced in order to identify factors contributing to the long-term decline in the level of the lake. The relative magnitudes of these factors can be used to plan effective strategies for halting the decline. In the water budget, ground water in the surrounding aquifer is considered external to the lake and seepage through the lakebed is included as a separate item.
26 Geohydrology, Water Quality, and Water Budgets, San Francisco, Caiifomia

INFLOW
Rainfall.-Data. collected from four rain gages were used to determine rainfall at Lake Merced (pi. 1C). Gages 1 and 3 were installed on December 4, 1987, and so no rainfall measurements were obtained for the first two months of water year 1988. Two gages already were in use at the SFWD pump house and at the North San Mateo County Sanitation District (NSMCSD). Daily rainfall at each gage is presented in table 5.
Rainfall for October and November 1987 at gages 1 and 3 was estimated from data for the other two gages. The percentages of annual rainfall that occurred during these 2 months were 20 percent and 24 percent at the pump house and NSMCSD, respec tively. An average of these two percentages also was assumed to represent the percentage of annual rainfall at gages 1 and 3 during October and November. The resulting annual rainfall was 13.87 in. at gage 1 and 11.12 in. at gage 3. Total annual rainfall at the NSMCSD and pumphouse gages was
19.06 and 14.93 in., respectively.
Differences in total rainfall measured at each location can be attributed to spatial variability of rainfall, obstructions near the gages, and measure ment error. Spatial variability is the probable cause of consistent differences in rainfall between gages 1 and 3. Nearby trees and buildings may have affected the catch at the pump house gage. The gages also were of different types and were operated by three different agencies.
Annual total rainfall on the surface of Lake Merced was determined by the arithmetic average and Thiessen-weighted average methods (Viessman and others, 1977, p. 35). The arithmetic average was 14.75 in. and was determined by summing annual rainfall at the four gages and dividing by the number of gages. The Thiessen-weighted average was 13.71 in. This value was determined by weighting the rainfall at each gage according to the fraction of the lake area within a polygon drawn around the gage. The polygons were constructed by drawing perpen dicular bisectors across lines connecting the gages.
The Thiessen-weighted average is lower than the arithmetic average because a small amount of lake area was assigned to the NSMCSD gage, which had much more rainfall than the other gages. The estimates indicate that rainfall on the lake was
probably between 13.5 and 15.0 in. For the water- budget analysis, total annual rainfall was assumed to equal 14.3 in., which is about 67 percent of normal.
To determine the volume of rain that fell on the lake during water year 1988, total annual rainfall in inches was multiplied by the surface area of the lake. The area of the lake surface varies with lake level. During the study period, the stage of North and South Lakes ranged from 10.29 to 12.64 ft above sea level. The stage of Impound Lake ranged from 7.51 to 10.72 ft above sea level. Using the measured relation between surface area and lake level (Entrix, 1988), the surface area ranged from 266 to 280 acres and averaged 273 acres. The total volume of rainfall entering the lake was 325 acre-ft.
Surface water. Surface-water inflow to Lake Merced is minimal because of modifications to the natural drainage system. Prior to urbanization, several streams drained to the lake. In the 1890's, the streams were filled or covered and their flows diverted to storm drains (Shoup and Baker, 1981). One of the diversion canals can still be seen between South Lake and the Olympic Golf Club. Wooden flumes from the east side of the lake fed into a settling pond which is now Impound Lake.
In May 1978, following a period of drought, the SFWD added 400 Mgal of municipal water to the lake (Woodward-Clyde Consultants, 1981). Smaller amounts were reportedly added several times during the late 1960's (Kirker, Chapman, and Associates, and Todd, 1972, p. 85).
Except in a few small areas, runoff from the area surrounding the lake is still diverted. A visual reconnaissance during the winter of 1988 indicated that street drains along John Muir Drive near Lake Merced Boulevard and in a parking lot near the southern end of Sunset Boulevard discharged to the lake (pi. 1C). The collection area of the drains included about 450,000 ft2 of pavement and imper vious surfaces. The volume of runoff from this area during 1988 was about 12 acre-ft. This estimate was calculated by multiplying the drainage area by the annual rainfall.
Ground water. Movement of water between Lake Merced and the surrounding shallow aquifer system was estimated using Darcy's Law. These estimates were corroborated in part by direct measurements of seepage through the lakebed and by water-quality data from wells near the lake.
Water Budgets 27

Table 5. Daily rainfall at four gages near Lake Merced, water year 1988
[NSMCSD, North San Mateo County Sanitation District Location of gages shown on plate 1C. No rainfall recorded for July, August, and September]
Date Gage 1
October2223272829 -
Monthlytotal h.04
November239
13;: w
161718202130 -
Monthlytotal h.68
December12356 0.7078 .889
1011161719 .99222326 .09
Rainfall
Gage 3
(inches)
NSMCSD Pump house Date Gage 1
Rainfall
Gage 3
(inches)
NSMCSD Pump house
December Continued ~
_ «
!0.83
~~ ~ ~
_
h.35
0.55
.72 ~
.83
.05
0.02.20
.90
.24
1.36
0.03.02.04.17.48.03.72.19.03.60.20
2.51
0.50.22.03.68.20.80
1.10.01.10.07.10.75~
.13~
~
0.50.50
_ .10
h.io
~
0.08
.01
.95
.50
! 1.54
0.09.19.01~
.02
.70
.80
.05
.50
.30~
.15
.10
282930
Monthlytotal
January2345689
1011151617182930
Monthlytotal
February1
272829
Monthlytotal
MarchI2
1323
Monthlytotal
0.99
3.65
~ ~
2.35~ ~
1.00~
1.30
.74
5.39
~
~
..
0.03..
0.03
0.90
3.05
~~~ ~
2.18..
.65
1.10..
.58
4.51
~~~~
..
..
..0.06
..
0.06
0.70.43.11
5.93
0.12.26.71.80.01.05.02.05.24.68.45.82.08.51.29
5.09
'
0.02.36.10
0.48
0.18.06
.04
0.28
0.07.59.18
3.75
0.02
1.00.90.02.10.06.08.17.60
1.001.00.10.54..
5.59
0.00.42_
.20
0.62
0.07
0.07
See footnote at end of table.
28 Geohydroiogy, Water Quality, and Water Budgets, San Francisco, Califomia

Table 5. Daily rainfall at four gages near Lake Merced, water year 1988-Conf/nueGf
Date
April13141516192021222324252829
Monthlytotal
May278
131617272829
Monthlytotal
June78
Monthlytotal
Annualtotal
Gage 1
1.05~
.28~
1.33
0.09~
.18«
0.27
0.48
0.48
13.87
Rainfall
Gage 3
0.75
.15
0.90
0.02
.10 ~
0.12
0.30
0.30
11.12
(inches)
NSMCSD
0.02~
.04
.46
.10
.43 ~
.80
1.85
0.26
.04
.03
.10
.08
.50
.10
1.11
0.45_
0.45
19.06
Pump house
0.05
.05
.02
.17
.70
.15
.03
.15
.05
.11
1.48
0.15
.02
.12
.04
.09
0.42
0.36
0.36
14.93
Monthly totals at Gage 1 and Gage 3 estimated from correlation with pump house and NSMCSD data.
Darcy's Law states that ground-water flow is proportional to hydraulic conductivity, cross- sectional flow area, and water-level gradient (Freeze and Cherry, 1979). How was calculated separately for five ground-water flow tubes intersecting the shoreline of the lake as shown on plate 1C. Flow tubes are arbitrary hypothetical subdivisions of horizontal ground-water flow. The flow rate is constant within each flow tube. There is no flow between tubes because the boundaries between them are streamlines. The bottom of each flow tube is the confining clay layer and the top is the water table. A representative water-level gradient for each flow tube was calculated from contoured water-level data for August 1988 (pi. 1Q. All ground-water flow in each tube was assumed to flow either into or out of the lake, depending on the direction of the water- level gradient. The water-level contours indicate that ground water flows into the lake along the north and east sides (flow tubes 1 and 2). A hydraulic conduc tivity of 15 ft/d was assumed in all calculations.
Water levels near the lake in February 1988 were evaluated to determine seasonal variations in grad ients. In general, seasonal variations were small because lake levels were high at the same time water levels in wells were high. The largest variation was in the gradient between Lake Merced and the ocean, which was 19 percent greater in February than in August. Average annual flow in all flow tubes was assumed to equal the average of the February and August values.
Calculated flow of shallow ground water into the lake through flow tubes 1 and 2 is given in table 6. Using the initial estimate of flow through flow tubes 1 and 2, total annual flow of ground water into the lake was about 1,571 acre-ft in 1988. Outflow through flow tubes 3, 4, and 5 was about 264 acre-ft. The nearly six-fold difference between inflow and outflow is probably caused largely by an overesti- mation of inflow to the lake through flow tube 2. The water-level gradient in that tube was determined almost entirely from water levels at the San Fran cisco State University well. The well is on a bed rock hillside with only about 15 ft of saturated alluvial cover.
Water Budgets 29

Table 6. Estimated flow of shallow ground water into and out of Lake Merced, water year 1988
[Negative signs indicate flow out of the lake, ft/ft, feet per foot; ft/d, feet per day; ft2, square feet; acre-ft, acre-feet]
Flow tube
Water-level gradient
(ft/ft)
Specific discharge1
(ft/d)
Cross- sectional area (ft2)
Annual flow
(acre-ft)
0.013.032
2.013
-0.0204 3-.0033 3-.0051
Inflow
0.195.480
2 195
Outflow
-0.305 4-.057 4-.078
169,000321,000321,000
15,000350,00090,000
276 L295 2526
-38-167
-59
;, Total outflow ....................... -264
f * Specific discharge is the flow rate divided by the cross-sectional area.
2Alternative estimates assuming the water-level gradient in flow tube 2 equals the gradient in flow tube 1.
Water-level difference, corrected for seawater density, divided by average width of trapezoidal flow tube.
'Total flow rate divided by the cross-sectional area. Specific discharge is not uniform along the length of trapezoidal flow tubes.
Consequently, water levels are higher than they would be if the ground-water basin were several hundred feet thick at that location, as it is a short distance to the west.
An alternative estimate of ground-water inflow along the east side of the lake was obtained by assuming that the water-level gradient in flow tube 2 is the same as in flow tube 1 near Stern Grove. The revised inflow from flow tube 2 was 526 acre-ft/yr and the revised total inflow was 802 acre-ft/yr, or about one-half the initial estimate. The revised estimate was assumed to be more accurate and was used in the subsequent water-budget calculations. It should be noted, however, that ground-water recharge from rainfall, irrigation-return flow, and leaking water and sewer pipes in the 2,200-acre tributary area of flow tubes 1 and 2 was about 1,700
acre-ft/yr, so the higher inflow rate cannot be ruled out for lack of sufficient recharge. Conversely, much of this recharge might percolate downward to the deep aquifer system before reaching the lake.
OUTFLOW
Evaporation. -Evaporation of water from Lake Merced was estimated using measured pan evapora tion and published evaporation values. A Qass-A evaporation pan was placed in the northwest area of South Lake (pi. 1C) on May 5, 1988, and water loss was measured every 2 to 3 weeks through September 1988. Measured pan evaporation data are shown in table 7. The amount of evaporation in each meas urement period was uniformly prorated on a daily basis, and daily values were then totaled to obtain monthly evaporation. Monthly evaporation for October 1987 through April 1988 was estimated from the average of values for the northern and central California coast published by the California Department of Water Resources (1975). These values were adjusted to reflect mean monthly tem peratures during 1988 and the relation between measured and California Department of Water Resources (DWR) evaporation values during May through September. Mean monthly temperatures averaged 3 °F above normal during 1988. Measured and estimated monthly evaporation at the Lake Merced evaporation pan are shown along with the DWR values in table 8.
Table 7. Measured pan evaporation at Lake Merced, May-October 1988
Measurement period
Start
5-05-885-17-886-10-886-22-887-19-887-28-888-12-888-19-889-09-889-28-88
End
5-17-886-10-886-22-887-19-887-28-888-12-888-19-889-09-889-28-88
10-18-88
Evaporation (inches)
1.47(*)1.895.951.071.64.83
1.812.171.08
Not measured.
30 Goohydrology, Water Qualify, and Water Budgets, San Francisco, California

Table 8. Pan evaporation, lake evaporation, and transpiration by tules at Lake Merced, water year 1988
[All values are in inches. USGS, U.S. Geological Survey; DWR, California Department of Water Resources]
Pan evaporation Lake TuleMonth USGS
(1988)DWR1
(average)
evapo ration2
transpi ration3
1987October . November December
^.59 41.67 41.08
3.30 Z25 1.55
1.941.25
.81
2.231.44.93
1988 January .....February .... March ......April .......May ........June ........July ........August .......September ....
Total ......
41.1841.77 ^.8043.1154.0555.065.583.173.17
35.2
1.602.10 3354.155.105455.655.204.30
44.0
0.891.33 2.112.333043.804.192.382.38
26.4
1.011.52 2.412.673.484354802.732.73
30.3
Average of long-term mean values for north coast coastal valleys and plains and central coast coastal valleys and plains (California Department of Water Resources, 1975).
Equals USGS pan evaporation multiplied by a pan-to-lake coefficient of 0.75.
3Assumed to equal 86 percent of USGS pan evaporation.
4Estimated from DWR values according to measured differences during May through September 1988 and departures of monthly temperatures from long-term averages.
Combination of estimated and measured values.
Monthly evaporation at the Lake Merced evapo ration pan ranged from 61 to 99 percent of the DWR values during May through September. Steep climatic gradients near the coast are the probable reason evaporation at Lake Merced is consistently less than the DWR value for the coastal area as a whole. Climatic studies at several valleys along the central California coast have shown that evaporation at the coastline is often as little as 65 percent of evaporation a few miles inland because of cool sea breezes and more frequent fog near the coast
(California Department of Water Resources, 1975, p. 14). The coastal effect was offset somewhat by unusually warm temperatures during most of 1988. Measured pan evaporation was 99 percent of the DWR value in My, when a record-breaking warm spell occurred.
Evaporation from Lake Merced was estimated by multiplying the pan evaporation by a pan-to-lake coefficient, which is the ratio of lake evaporation to evaporation from a Class-A pan next to the lake. In the Western United States, the average value of the coefficient is 0.70, although values of 0.80 are common in humid areas (Blaney and Corey, 1955). A value of 0.75 was assumed for Lake Merced. The resulting monthly lake evaporation is given in table 8. Evaporation from Lake Merced totaled about 26.4 in. during water year 1988. This corresponded to a volumetric loss of about 601 acre-ft, which is 85 percent greater than the amount of rainfall on the lake during 1988.
The greater enrichment of the lake water in heavy isotopes than either rainfall or ground water (fig. 4), confirms that evaporation generally exceeds rainfall at Lake Merced.
Transpiration by tules along the shore of Lake Merced was estimated from pan evaporation data. Annual potential evapotranspiration in the San Francisco area is about 76 percent of annual pan evaporation (California Department of Water Resources, 1975). This percentage would correspond to an annual rate of about 27 in. at Lake Merced during 1988. Transpiration by tules is greater than potential evapotranspiration, which is the amount of water consumed by short-cropped, well-watered grass. At a lake in an arid location in southern California, transpiration by tules was 95 percent of pan evaporation (California Department of Water Resources, 1942). An intermediate value of 86 percent was assumed for the tules surrounding Lake Merced. This corresponds to an annual transpiration rate of 30.3 ia and an annual volume of 134 acre-ft for the 53 acres of tules.
Pumping and surface outflow. Water was pumped from Lake Merced during 1988 to irrigate Harding Park Golf Course and to fill street-cleaning trucks. Pumps are located at the pump house and at the northern tip of South Lake. Estimates of pumpage for irrigating Harding Park range from 191 to 312
Water Budgets 31

acre-ft/yr. The low estimate was obtained by assuming that 69 percent of the 146-acrc golf course is irrigated and that the application rate in 1988 was 23 in., which was the rate estimated for Olympic Golf dub from 6 months of pumpage data. An intermediate estimate of 225 acre-ft/yr was obtained from a visual estimate of pump discharge and an assumption that irrigation occurs 8 hours a day, 5 days a week from April through October (Thomas Standing, San Francisco Water Department, oral commun., 1988). The high estimate resulted from the soil-moisture budget accounting algorithms, which indicated that 37.4 in. of water were applied to irrigate the golf courses during 1988. This leads to a volumetric pumpage estimate of 312 acre-ft. A value of 250 acre-ft was used in the water-budget calculations for Lake Merced.
The amount of water pumped from the lake to fill street-cleaning trucks during 1988 was 9.5 acre-ft (John Busher, San Francisco Department of Public Works, oral commun., 1988). This use was dis continued during 1988 because of concerns about the
Jlow level of the lake..-& -**
,In 1895, an earth dam was built across the natural surface outlet of Lake Merced. A spillway allows excess lake water to flow into a diversion canal. No surface outflow occurred during 1988 because lake levels remained more than 8 ft below the spillway.
Ground water.-Seepage of water from the lake into the shallow aquifer was evaluated using the
-flow-tube analysis described earlier. Characteristics of each outflow tube were considered when applying Darcy's Law. A low water-level mound near the zoo may have decreased the effective width of flow tube 5 in August 1988 (pi. 1C). In most months, however, the water level in flow tube 5 decreased continuously from the lake to the ocean. Flow tubes 4 and 5 are approximately trapezoidal in plan view, so the length of the flow tube was assumed to be a linear function of distance along the coastline. Flow was calculated by integrating along the length of the western edge of each tube. The water-level gradient in tubes 4 and 5 was the difference between the lake level and the ocean-minus a correction for the density difference between seawater and fresh water-divided by the east-west length of the tubes. The equivalent freshwater head at the ocean end of the flow tube was assumed to equal sea level plus one-fortieth of the flow thickness, or 1.5 ft above sea level for a 60-foot-thick aquifer.
Seepage near Impound Lake is complicated by large vertical hydraulic-head gradients caused by pumping in nearby deep wells. Theoretical analysis of lake seepage indicates that downward head gradients in the ground-water system can create local areas of seepage out of the deepest parts of the lakebed (Winter, 1984). This deep seepage would not be accounted for in calculations based on horizontal water-level gradients in shallow strata. It is not known whether deep seepage occurs out of Lake Merced, but it is more likely to occur out of Impound Lake than South Lake or North Lake. To minimize a possible error due to deep seepage, seepage out of Impound Lake was assumed to equal seepage from South Lake to Impound Lake through the sand barrier between them (flow tube 3). Seepage through the barrier was calculated using Darcy's Law. Total outflow through tubes 3, 4, and 5 was about 264 acre-ft during 1988 (table 6).
WATER LEVELS AND STORAGE CHANGES
A continuous record of water level in Lake Merced (North and South Lakes) from October 1987 through October 1988 is shown on plate 1C. The maximum water level was 12.8 ft above sea level and occurred in January 1988. The minimum water level was 10.2 ft and occurred in October 1988. Net decline for water year 1988 was 1.6 ft.
The water level in Impound Lake was measured once in October 1987 and monthly starting in May 1988. Impound Lake was 1.0 ft lower than South Lake in October 1987. This difference increased to 2.7 ft by October 1988.
The minimum annual water levels in Lake Merced from 1977 through 1988 (San Francisco Water Department, written commun., 1988; Woodward- Clyde Consultants, 1981) are shown on plate 1C. The graph reveals large year-to-year changes ..in minimum lake level and a slight long-term declining trend. There was a net decline of 2.2 ft during the 11-year period; average decline was 0.20 ft/yr. The period begins and ends during droughts; the 1976-77 drought was drier than the current (1987-90) drought Water levels during 1976-77 would have been higher if rainfall had equaled the amount in 1987-88. As a result, the comparison of water levels in 1987-88 might underestimate the long-term water-level decline.
32 Geohydrology, Water Quality, and Water Budgets, San Francisco, California

The year-to-year changes in lake levels are caused mainly by variations in annual rainfall. This relation is more obvious in figure 6, which shows annual rainfall at the Richmond-Sunset weather station and corresponding net annual water-level change for Lake Merced each year from 1977 to 1988. Municipal water was added to the lake in 1978, so that year was omitted from the analysis. Several patterns are evident in the figure. The data indicate a fairly strong correlation between annual rainfall and annual changes in lake level. However, 1987 and 1988 plot below the general trend of the data, indicating that water-level declines in those years were greater than would be expected on the basis of rainfall alone.
Another indication that the lake level is declining was obtained from a linear regression of the data in figure 6. The regression equation was:
WL = 0.0966^-2.55 (3)
where
WL = net change in minimum water level frompreceding year, in feet,
R - rainfall during the year, in inches.
UJ (S
< o oUJ
ui
UJ
I"2
-3
Y= -2.55 + 0.0966 X
'1988
'1987
10 20 30
ANNUAL RAINFALL, IN INCHES
40
Figure 6. Relation of annual rainfall to annual net change in minimum water level in Lake Merced. Data are from 1977 to 1988; 1978 omitted.
The correlation coefficient (r) was 0.90 and the residuals were independent and normally distributed. Of particular interest is the amount of annual rainfall associated with no net annual change in lake level. The regression equation indicates that about 26.4 in. of rain is required to maintain the lake level. This is much more than the average annual rainfall, which is only about 21.3 in.
The estimate of average annual water-level decline during 1977-88 can be corrected for the difference in rainfall during the two drought periods by using the regression equation. If as much rain had fallen during water years 1976-77 as during 1987-88, the minimum water level in 1977 would have been about 14.59 ft and the average annual rate of decline during 1977-88 would have been about 0.40 ft.
Another estimate of the long-term rate of decline in lake level was obtained by superimposing an assumed long-term rate of decline in lake level on the measured data and repeating the regression analysis. By trial and error, it was found that the most linear relation between the variables was associated with a long-term decline rate of 0.06 ft/yr. The amount of annual rainfall corresponding to zero annual water level change for the revised regression was 20.8 in., which is close to the actual mean annual rainfall.
It is not known why the regression-smoothing method yielded a much smaller estimate of the long-term rate of water-level decline than did the comparisons between 1977 and 1988 water levels. The accuracy of the regression-smoothing method could be low because of variations in the long-term rate of decline or water-level changes caused by other factors. However, no significant correlations were found between annual water-level changes and annual pumpage at municipal wells in Daly City.
Few measurements of lake level are available prior to 1976, but they indicate that lake levels prior to 1976 were consistently higher than levels after 1976. In 1908, a lake level of 24 ft above sea level was reported (Schussler, 1908). Two measurements made during the 1950's were 20.3 and 17.3 ft above sea level (Robilliard and Stromberg, 1987). Britton and others (1974) reported a lake level of 21.0 ft in 1967. Lake levels since 1976 have ranged from 10.2 to 14 ft above sea level. Because annual fluctuations in lake level can be large, the pre-1976 data are too few to determine exactly when the long-term
Water Budgets 33

decline in lake levels began and whether the decline has been steady and continuous. Nevertheless, the data indicate that the decline began prior to 1976.
Storage changes in Lake Merced were calculated from the water-level changes. When the water level in North and South Lakes is between 10 and 12 ft above sea level, 280 acre-ft are required to raise the water level 1 ft (Entrix, 1988). The 1.5-foot decline in North and South Lakes and the 3.2-foot decline in Impound Lake during water year 1988 were associated with a total storage loss of 370 acre-ft of water.
UNCERTAINTY OF INFLOWS AND OUTFLOWS
The estimates of ground-water seepage are subject to much greater uncertainly than the estimates of other items in the water budget of Lake Merced. As indicated earlier, errors associated with water levels
j at individual wells can result in errors equal to 100 ^percent of the calculated seepage. Measured hydrau- "lic conductivity in the Lake Merced area varies by a factor of two, which also would lead to uncertainties
4>f 100 percent in the seepage estimates. The satu rated thickness of the shallow aquifer also is uncer tain. A thickness of about 60 ft was assumed in the calculations, but thicknesses as small as 25 ft or as large as 150 ft are possible. The effective depth of
^the flow system is strongly dependent on layering of- ihe basin-fill deposits and the ratio of vertical to-^horizontal hydraulic conductivity (Winter, 1984),-which are not well known. Finally, the extent to
which deep pumpage near the lake induces additional seepage out of the lake is only approximately known. If flow thickness, hydraulic conductivity, and gradient were all assumed to equal the maximum values of their ranges of uncertainty, net ground- water inflow to the lake would be 8,715 acre-ft/yr. This is much more water than could be removed by evaporation or deep percolation. Conversely, if minimum values are assumed, net ground-water inflow to the lake would be only 56 acre-ft/yr. In this case, pumpage, evaporation, and transpiration would have resulted in 60 percent (0.7 ft) greater decline in lake level than was observed, even if there were no deep percolation. From this discussion it is obvious that although uncertainties in individual terms in the flow equations are large, the terms are not all simultaneously overestimating or underesti mating their actual values.
The direction and rate of seepage through the lakebed was verified by field measurements of seepage at eight locations along the lakeshore (pi. 1C). Two measurements were made at each site using 8-inch-diameter flowmeters embedded 10 ia into the lakebed. Specific discharge at four sites along the sand barrier between South and Impound Lakes (flow tube 3) ranged from 0.029 to 0.515 ft/d and averaged 0.261 ft/d. Seepage was out of South Lake and into Impound Lake. These measurements compare well with the value of 0.305 ft/d estimated from the flow-tube analysis (table 6). Specific discharge at three sites along flow tube 2 ranged from 0.003 to 0.105 ft/d and averaged 0.052 ft/d into the lake. The measured specific discharge rates at the sites along flow tube 2 are much smaller than the average specific discharge of 0.480 ft/d initially calculated for that tube using a water-level gradient based on the San Francisco State University well (pi. 1C). These rates are closer to the specific discharge rate of 0.195 ft/d calculated for flow tube 2 using the gradient for flow tube 1. These results support the conclusion that water-level gradients based on the San Francisco State University well are too high. The actual average specific discharge for the flow tubes is probably greater than the average of the small number of measured values because the spatial distribution of seepage values is often lognormally distributed (Biggar and Nielsen, 1976) and local "leaky" spots were probably not detected in the small sample size.
Stable-isotope data confirm the downward move ment of ground water near the south end of Lake Merced. Water from the Olympic Golf Club wells is enriched in heavy isotopes, indicating that the water had been subjected to evaporation. The most likely source of this water is Lake Merced.
RELATION OF LAKE LEVEL TO WATER-BUDGET FACTORS
The inflows and outflows of Lake Merced described in the preceding sections are combined in table 9. The independently estimated inflows, outflows, and change in storage indicate a budget imbalance of 250 acre-ft, or about 20 percent of the total budget. That is, the lake declined more than can be accounted for by the inflows and outflows listed in the water budget The imbalance could simply result from the accumulation of errors in the estimates of individual items. However, it also could be caused by an additional outflow from the lake not
34 Geohydrology, Water Quality, and Water Budgets, San Francisco, CaHfomia

Table 9. Water budget for Lake Merced, water year 1988
[All values are in acre-feet]
Item Flow volume
InflowRainfall .....Runoff ......Ground water .
Total inflow
OutflowEvaporation ....Tule transpiration Pumpage ......Ground water ...
Total outflow ,
Inflow-outflow.., Change in storage
-Budget error
32512
8021,139
601 134 260 264 US9
-120-370
-250
included in the budget, such as deep seepage caused by pumping in nearby wells. The cause of the imba lance will be investigated during the ongoing Federal-local study of ground water in San Francisco.
In spite of its imbalance, the budget indicates that ground water was the principal source of inflow during water year 1988, which was drier than normal. Average rainfall (21.3 in.) would have con tributed about 485 acre-ft of water, which is still much less than the estimated amount of ground- water inflow. Evaporation provides the largest out flow of water from the lake, accounting for about one-half the total loss. Direct pumpage and shallow outflow to ground water are approximately equal and account for most of the remaining outflow. The latter outflows also were less than the loss of water in storage in the lake during 1988.
The pattern of water-level contours near the lake (pi. 1C) and the relatively large ground-water inflow and outflow in the water budget indicate that the lake is closely coupled with the adjacent shallow aquifer and that the lake surface is essentially an exposed part of the water table. This close coupling tends to buffer the lake from rapid changes in water
level. If the lake level were suddenly lowered, the water-table gradient on the influent north and east sides would become steeper and ground-water inflow would increase. Simultaneously, the water-table gradient between the lake and the ocean would become shallower and ground-water outflow would decrease. The increase in inflow and decrease in outflow would tend to offset the initial lowering of the lake level.
From a management standpoint, the coupling between the lake and the ground-water system means that efforts to raise or lower the lake level must take into account the amount of water required to raise or lower the adjacent water table. For example, the bathymetric survey indicated that if there were no coupling with the ground-water system, the 260 acre- ft of water pumped from the lake in 1988 would result in a decline in lake level of about 11.2 in. With coupling, the decline would be less because the pumping would induce an increase in ground-water inflow and a decrease in ground-water outflow. Conversely, if 260 acre-ft of water were added to the lake, the lake level would rise by an amount less than 11.2 in.
The probable cause of the long-term decline in the level of Lake Merced is pumpage from the deep part of the aquifer system beneath the lake. Although decreases in rainfall or ground-water inflow also could result in lake declines, neither of these potential causes is consistent with all available information. A cumulative departure analysis of annual rainfall at the Federal Office Building gage in downtown San Francisco since 1844 indicates that average annual rainfall since the 1940's (approxi mately 20.2 in/yr) has been consistently less than during the period 1849-95 (approximately 24.0 in/yr). However, the lake and shallow ground-water system respond very rapidly to annual variations in rainfall (pi. 1C and fig. 6), and any responses to pre-1900 rainfall would have long since come to completion. Likewise, responses to the runoff diversion structures installed in the 1890's would have occurred long ago.
Urban development beginning in the 1930's might have caused some decrease in ground-water recharge in areas upgradient of the lake. Urban areas around the lake are about 70 percent impervious (table 3), and rain falling on the impervious areas is removed by storm drains. Prior to urbanization, however, much of the rainfall was transpired by vegetation.
Water Budgets 35

Also, about 28 percent of the Lake Merced area is presently irrigated. Irrigation-return flow contributes to ground-water recharge and recharge from rainfall tends to be higher on irrigated soils than nonirrigated soils. These factors might more than offset the increase in impervious areas. For example, the data in table 3 indicate that ground-water recharge per unit area for the Lake Merced area as a whole is slightly greater than recharge per unit area along the undeveloped beaches, bluffs, and lakeshore. Finally, mere has been little increase in urbanization in the Lake Merced area during the past 10 years, yet lake levels continued to decline.
The difference in water levels between South Lakeand Impound Lake cannot be explained by variationsin recharge, but can be explained by pumpage fromthe deep part of the aquifer system. The present day(1989) southward gradient between the lakes isopposite of the natural, predevelopment gradient forsurface and ground water. This southward gradientcould not be caused by an increase in inflow or
.£ recharge to the north without an increase in lake&,levels, which has not occurred. The southward
gradient can only be explained by a closed4*depression of ground-water levels caused by
pumpage near the southern end of the Lake Mercedarea. The water-level depression in the deep part ofthe aquifer system would cause a similar depressionin the shallow aquifer. The large vertical head
, differences between the shallow and deep aquifers:Jnear the south end of the lake and negligibleJ differences near the north end explain the southward"gradient in the shallow aquifer. The downward
water-level gradient between the shallow aquifer andthe deep part of the aquifer system that has beenpresent since the 1940's is sufficient to explain thelong-term decline in lake level observed during the1977-88 period.
Finally, the relatively high concentration of heavy isotopes in water from the Olympic Golf Club wells confirm that lake water is seeping downward to the deep part of the aquifer system.
EFFECTS OF INCREASED PUMPING
The clay layer that separates the shallow and deep parts of the aquifer system throughout much of the Lake Merced area tends to isolate the two parts and is the principal reason the lake level has declined gradually. Because of the clay layer, the shallow
system responds rapidly to fluctuations in recharge and only gradually to changes in water level in the deep part of the aquifer system.
Sufficient ground water is available in Golden Gate Park to water areas presently irrigated with municipal water. In 1988, 360 acre-ft of municipal water were used for irrigation in the park (Cheryl Davis, San Francisco Water Department, written commun., 1989), or about 21 percent of total irri gation water use. The availability of additional ground water is indicated by the significant amount of ground-water outflow to the ocean occurring along the 14,000 ft of coastline between Lincoln Park and the northern boundary of the Lake Merced area. By using average or slightly conservative estimates of hydraulic conductivity (15 fi/d), water-level gradient (0.009), and flow thickness (250 ft), the calculated outflow is approximately 4,000 acre-fl/yr (3.5 Mgal/d). This equals 250 gal/d per linear foot of coastline. The optimal placement of wells to capture this outflow would depend partly on the anticipated pumping schedule. For example, outflow across 1,400 linear feet of coastline would supply a well pumping year round at 500 gal/min, 12 hours per day. If wells were uniformly spaced 1,400 ft apart, the drawdown at one well after 12 hours of pumping at the adjacent well would be 2.0 ft. After 6 months of continuous pumping (24 hours per day), the drawdown would be 12 ft Alternatively, wells pumping at 1,000 gal/min could be placed twice as far apart, in which case the drawdown at the adjacent well after 12 hours would be smaller (0.86 ft) but after 6 months would be larger (18 ft).
Several general factors might be considered when selecting locations of additional production wells. Wells near the coastline would have the maximum amount of inland area from which to capture recharge, but they would run the greatest risk of seawater intrusion. Wells farther inland might not capture all of die recharge, but pumping from them would be less likely to cause seawater intrusion. Inland wells would have an additional advantage of obtaining ground water at a higher altitude above sea level, which.could decrease the cost of pumping it to various points of use.
Ground water in the Lake Merced area is in a state of overdraft, as indicated by the long-term decline in the level of Lake Merced, the persistent occurrence of water levels below sea level in deep wells, and the decrease in storage even during years of average
36 Goohydrology, Water Quality, and Water Budgets, San Francisco, CaHfomia

rainfall. It would be difficult to capture the 300 acre-fi/yr of outflow from the shallow aquifer to the ocean without accelerating the long-term water-level decline in Lake Merced. Deep wells in the vicinity of the zoo could capture outflow from the deep con fined part of the aquifer system, but in so doing would lower the hydraulic head and eventually increase the rate of leakage from Lake Merced and the shallow aquifer.
The potential long-term effects of increasing deep pumpage near the zoo were investigated by ana lyzing an aquifer test done at the Oceanside Water Pollution Control Plant site (pi. 1C). The analysis indicated that effects of deep pumpage on the shal low aquifer might be delayed for several years because of storage effects in the confining clay layer.
The aquifer test used a deep well drilled by a pri vate firm at the site in December 1988. The well was screened below the confining clay layer, which is between 85 and 130 ft below land surface at that
.location. The well was pumped at 800 gal/min for ;10 days, and water levels were recorded in the pumping well and several observation wells above sand below the clay layer. Theis and modified r;Hantush type curves and other analytical methods were used to estimate the transmissivity (2,850 ft?/d) and storage coefficient (0.00024) of the deep aquifer and the vertical hydraulic conductivity (0.00175 ft/d) and storage coefficient (0.0045) of the confining clay layer. It was concluded that pumping from the well would not affect water levels in Lake Merced (CH2M-HiU, 1989).
An alternative analysis of the aquifer test was done for this study. A digital ground-water-flow model was used to estimate long-term effects of pumping by simulating the aquifer test for an extended period. A three-layer, finite-difference ground-water model code (McDonald and Harbaugh, 1988) was applied to an area that includes the Lake Merced area, the northern part of Daly City, and a 1-mile-wide band of ocean floor (pi. LA). The northern and eastern boundaries of the modeled area coincide with the boundaries of the Lake Merced area and were represented by no-flow and constant-flow bound aries, respectively. The southern boundary of the modeled area lies along a row of municipal wells in Daly City and was assumed to be a flow divide. One-half of the well pumpage was assumed to come from the modeled area. All offshore cells in the top layer were assigned a constant head equal to sea
level The three layers corresponded to the shallow aquifer, confining layer, and confined part of the aquifer system. The thicknesses and hydraulic prop erties of the layers were set equal to the values assumed or determined by the aquifer test. Other known pumping wells in the vicinity were included in the model. Time steps of increasing length were used to simulate the aquifer test and extend it for a total of 20 years.
In order to accurately duplicate the assumptions and results of the 10-day aquifer test, aquifer characteristics used in the model were not adjusted or calibrated. Simulated drawdown in the pumping well after 10 days of pumping was slightly less than the measured drawdown, probably because of discre tization effects. Simulated drawdowns at the observa tion wells matched measured drawdowns reasonably well.
The results indicated that after 10 days of pumping, the system was still dominated by storage changes. On the tenth day, 77 percent of the water pumped from the well was coming from storage in the confining layer, 12 percent from storage in the bottom layer, and only 11 percent from leakage from the top layer. Steady-state conditions, in which storage changes have come to complete equilibrium with the pumping stress, are almost achieved after 20 years of pumping. Downward leakage from the top layer does not reach its steady-state value until about 2 years after the onset of pumping. The model results demonstrate that storage responses in the system are very slow and that the full effects of increased pumpage from the deep aquifer system would not become apparent for several years. The model results also explain how an aquifer test lasting only 10 days might incorrectly lead one to conclude that pumping from the deep part of the aquifer system would have no effect on the shallow aquifer and Lake Merced.
SUMMARY AND CONCLUSIONS
Ground water in the western part of San Francisco is used chiefly for irrigation in Golden Gate Park and in the Lake Merced area. Available water- quality and storage data indicate the potential for further development of this resource. The ground- water basin underlies a 39-mi2 area extending south from Lincoln Park through Daly City and termin ating near San Bruno. It is bounded on the west by
Summary end Conclusions 37

the San Andrcas fault and on the east by relatively impermeable rocks of the Franciscan Complex and the Great Valley sequence. Because the exact thick ness and extent of the unconsolidated sediments of the basin are not known, the amount of ground water in storage cannot be determined accurately.
Existing and new aquifer-test data were used to describe aquifer characteristics in the basin. An aquifer test in Golden Gate Park yielded values for hydraulic conductivity between 12 and 24 ft/d. Tests in the Lake Merced area determined horizontal hydraulic conductivities to be between 8 and 30 ft/d. Storage coefficients generally decrease with depth. Tests conducted on wells completed in the upper 80 ft of sediments indicated storage coefficients between 0.01 and 0.20, values typical of unconfmed condi tions. For depths up to 240 ft, measured storage coefficients ranged from 0.00002 to 0.009. These values represent confined or partly confined condi tions. A horizontally continuous confining clay layer is present at a depth of about 100 ft in the vicinity of
i;Lake Merced. This layer separates a shallow uncon- gfined aquifer from the deep confined part of the %quifer system.
*S&v Pumpage from the deep part of the aquifer systemat local golf courses and in Daly City, coupled with the presence of the confining layer, has produced a steep downward and southward ground-water-level gradient near the south end of Lake Merced. Verti cal gradients in ground water appear to be much smaller in other areas in the western part of San
IFrancisco. Ground-water flow is generally westward with local areas of radial flow toward production wells. At most wells there was a net water-level decline of 1 to 3 ft during water year 1988. The declines probably resulted mostly from two conse cutive winters of below-average rainfall. Available information does not indicate long-term water-level declines at wells in Golden Gate Park, with the possible exception of the Alvord well. However, there is evidence of long-term water-level declines in the shallow aquifer in the Lake Merced area.
The chemical character of ground water in San Francisco results from the mixing of recharge from rainfall, irrigation-return flow, and leaking water and sewer pipes. Ground-water quality also is affected by chemical interaction with sediments in the aquifer system. Data collected during this study were insuf ficient to identify positively or to quantify all recharge sources. However, the data do indicate
probable sources. Water from municipal water pipes also tends to dilute the major constituents found in ground water, with the exception of fluoride. Con centrations of dissolved solids, sodium, and chloride tend to decrease with depth, indicating a shallow source, such as sea spray, sewer leakage, or irriga tion-return flow. Nitrate concentrations exceeded the U.S. Environmental Protection Agency's recom mended limit for drinking water of 10 mg/L in 41 percent of the samples. The most likely sources of nitrate are seepage from sewers and irrigation return flow. The correlation between nitrate and sulfate and the lack of correlation between nitrate and chloride would seem to implicate fertilizers, but the chloride data may be affected by sources other than sewage. In contrast, the distribution of potassium appears to be related to sewer locations. Except for high nitrate concentrations, ground water is generally of good quality and is a calcium magnesium bicarbonate type. Stable-isotope data and concentrations of chloride and nitrate indicate that surface water from Lake Merced is recharging the deep aquifer system near the southern end of the Lake Merced area. Isotope data also indicate that recharge from municipal water occurs near the Arboretum well in Golden Gate Park.
Ground-water budgets were developed separately for Golden Gate Park and the Lake Merced area. Recharge occurs from rainfall, irrigation-return flow, sewer and water-pipe leakage, infiltration of lake water, and ground-water inflow. Discharge occurs through evaporation and transpiration, natural ground-water outflow, and pumping. In Golden Gate Park, about 41 percent of the annual inflow under normal climatic conditions is from rainfall. Ground- water inflow and irrigation-return flow are about equal, forming the balance of ground-water recharge. Pumpage and ground-water outflow are nearly equal in magnitude and account for most of the ground- water discharge. In the Lake Merced area, recharge from rainfall and ground-water inflow under normal climatic conditions each contribute about one-third of the total annual inflow to the ground-water system. Irrigation-return flow normally contributes about one-fifth of the inflow, and leakage from water and sewer pipes accounts for the remainder. Ground- water outflow accounts for nearly two-thirds of total outflow and pumpage accounts for nearly one-third. However, about two-thirds of the ground-water outflow is induced by pumping outside of the area. Net evaporation and transpiration comprise 5 to 10 percent of the outflow. Temperatures were warmer
38 Geohydrology, Water Quality, and Water Budgets, San Francisco, California

and the climate drier than average for water year 1988. Mean monthly temperatures averaged 3 °F higher than normal; annual rainfall was only 67 percent of normal. As a result, recharge from rainfall was only slightly more than one-half the normal amount In addition, there were increases in pumpage, net evaporation, and transpiratioa These changes were partly balanced by increases in irrigation-return flow and decreases in ground-water outflow. However, both the Lake Merced and Golden Gate Park areas underwent a decrease in ground-water storage during this period.
The water budget for Lake Merced was estimated for water year 1988. Inflow to the lake was mainly from ground water (802 acre-ft) with lesser amounts from rainfall (325 acre-ft) and surface runoff (12 acre-ft). Evaporation, the largest outflow, amounted to 601 acre-ft and transpiration from tules equaled 134 acre-ft Direct pumpage was estimated to be about 260 acre-ft.
.. A correlation between lake levels and rainfall jduring a 10-year period indicates that water-level .declines in 1987 and 1988 were greater than would be expected from rainfall variation alone. The prob able cause for this is the effect of deep pumping near the southern end of the lake. Vertical seepage to the deep aquifer induced by pumping in nearby wells might also account for the imbalance in the calculated water budget. Between 1977 and 1988, .water level in Lake Merced declined at an average rate between 0.06 and 0.40 ft/yr. A 1.6-foot decline in lake level during 1988 was associated with a total storage loss of 370 acre-ft of water.
The water budgets and water-level trends indicate that pumpage could be increased in Golden Gate Park without adversely affecting the ground-water system. In contrast, ground water in the Lake Merced area is in a state of overdraft, and any increases in pumpage probably would increase the rate of long-term water-level decline in the lake.
REFERENCES CITED
Bartell, MJ., 1913, Report on the underground water supply of San Francisco County: San Francisco Department of Public Works, 157 p.
Biggar, J.W., and Nielsen, D.R., 1976, Spatial variability of the leaching characteristics of a field soil: Water Resources Research, v. 12, no. 1, p. 78-84.
Blaney, HJ7., and Corey, G.L., 1955, Evaporation from water surfaces in California: California Department of Water Resources Bulletin 54-B, 98 p.
Bonilla, M.G., 1959, Geologic observations, epicentral area, San Francisco earthquake of March 22, 1957: California Division of Mines and Geology, Special Report 57, p. 25-34.
1964, Bedrock-surface map of the San Francisco south quadrangle, California: U.S. Geological Survey Miscellaneous Field Studies Map MF-334, scale 1:31,680.
1971, Preliminary geologic map of the San Francisco south quadrangle and part of the Hunter's Point quadrangle, California: U.S. Geological Survey Miscellaneous Field Studies Map MF-311, 2 sheets, scale 1:24,000.
Brabb, E.E., and Hanna, W.F., 1979, Map showing aero- magnetic anomalies, faults, earthquake epicenters, and igneous rocks in the southern San Francisco Bay region, California: U.S. Geological Survey Geo physical Investigations Map GP-932, 3 sheets, scale 1:125,000.
Britten, LJ., Ferreira, R.F., and Averett, R.C., 1974, Limnological data from selected lakes in the San Francisco Bay region, California: U.S. Geological Survey open-file report, 79 p.
Brown and Caldwell, 1983, Los Osos-Baywood Park, Phase 1, Water-quality management study: Pasadena, California, Brown and Caldwell, Consulting Engineers, 100 p.
Caldwell-Gonzalez-Kennedy-Tudor, 1982, Bayside facili ties plan, expanded geotechnical investigation, geotechnical reference report: San Francisco, Cali fornia, Caldwell-Gonzalez-Kennedy-Tudor Consulting Engineers, 127 p.
California Department of Water Resources, 1942, Use of water by native vegetation: California Department of Water Resources Bulletin 50, 135 p.
1958, Seawater intrusion in California: California Department of Water Resources Bulletin 63, 91 p.
1975, Vegetative water use in California, 1974: California Department of Water Resources Bulletin 113-3, 104 p.
1983, Urban water use in California: California Department of Water Resources Bulletin 166-3, 239 p.
CH2M-HU1, 1989, Technical memorandum for Oceanside Water Pollution Control Plant groundwater develop ment study: Emeryville, California, CH2M-HU1, Consulting Engineers report to San Francisco Clean Water Program, 35 p.
Clifton, H.E., and Hunter, R.E., 1987, The Merced Forma tion and related beds: A mile-thick succession of Late Cenozoic coastal and shelf deposits in the seacliffs of San Francisco, California: Geological Society of America Centennial Field Guide Cordilleran Section, p. 257-262.
Colt, John, Tanji, Kenneth, and Tchobanglous, George, 1977, Impact of dog, cat, and pigeon wastes on the nitrogen budget of San Francisco storm runoff: Davis, California, University of California Water Science and Engineering Paper 4015, 26. p.
Cooper, Alien, 1973, Structure of the continental shelf west of San Francisco: U.S. Geological Survey Open-File Report 73-48, 72 p.
References Cited 39

Dames and Moore, 1979, Final report, geotechnical invest igation, route selection study, Richmond Transport Service, San Francisco, California: San Francisco, California, Dames and Moore, Consulting Engineers, 57 p.
Davis, S.N., 1969, Porosity and permeability of natural materials, in DeWiest, R.J.M., ed., Flow through porous media: New York, Academic Press, p. 53-89.
Driscoll, F.G., 1986, Groundwater and wells (2d ed.): St. Paul, Minnesota, Johnson Division, 1089 p.
Entrix, 1988, Bathymetric survey of Lake Merced: Wal nut Creek, California, Entrix, Incorporated, 18 p.
Fahy, N.E., 1974, Origin of Lake Merced: California Geology, v. 27, no. 8, p. 171-174.
Freeze, R.A., and Cherry, J.A., 1979, Groundwater: Englewood Cliffs, New Jersey, Prentice-Hall, 604 p. Hamlin, S.N., 1985, An investigation of ground-water recharge by injection in the Palo Alto Baylands, Cali fornia: Hydraulic and chemical interactions Final report U.S. Geological Survey Water-Resources Investigations Report 84-4152, 61 p.
Harding-Lawson Associates, 1977, Westside transport, geotechnical investigation, pump station at Fleish- hacker Pool near Sloat Boulevard: San Francisco, California, report prepared for Kennedy Engineers, Inc., 66 p.
1987, Completion report for groundwater level monitoring, West Side Transport Project, San Fran cisco, California: San Francisco, California, Harding- Lawson Associates letter report to San Francisco Clean Water Program, February 5, 1987, 16 p.
Heath, R.C., 1987, Basic ground-water hydrology: U.S. Geological Survey Water-Supply Paper 2220, 84 p.
Hem, J.D., 1985, Study and interpretation of the chemical characteristics of natural water: U.S. Geological Survey Water-Supply Paper 2254, 263 p.
Hunter, R.E., and Clifton, HE., 1982, Description of beds exposed at Fort Funston, Golden Gate National Recre ation Area, northwestern San Francisco peninsula, California: U.S. Geological Survey Open-File Report 82-1055, 30 p.
International Atomic Energy Agency, 1981, Statistical treatment of environmental isotopic data in precipita tion: Vienna, Technical report series No. 206, 255 p.
Kimmel, G.E., 1972, Nitrogen content of ground water in Kings County, Long Island, New York: U.S. Geolog ical Survey Professional Paper 800-D, p. D199-D203.
Kirker, Chapman, and Associates, and Todd, D.F., 1972, Daly City ground-water investigation: South San Francisco, California, Kirker, Chapman, and Associates, 159 p.
Lawson, A.C., 1895, Sketch of the geology of the San Francisco peninsula: U.S. Geological Survey 15th Annual Report, p. 399-476.
Matthess, George, 1982, The properties of ground water New York, John Wiley, 406 p.
McDonald, M.G., and Harbaugh, A.W., 1988, A modular three-dimensional finite-difference ground-water flow model: U.S. Geological Survey Techniques of Water- Resources Investigations, Book 6, ch. Al, 576 p.
Metcalf and Eddy, 1980, Southwest water pollution control plant project, final project report* Palo Alto, California, Metcalf and Eddy/Engineers, 73 p.
Miller, D.W., 1980, Waste disposal effects on ground water Berkeley, California, Premier Press, 512 p.
Olmsted, Roger, and Olmsted, Nancy, Resource Consul tants, 1979, Ocean Beach study, a survey of historic maps and photographs: San Francisco Wastewater Program, 48 p.
Overton, D.E., and Meadows, MJi., 1976, Stormwater modeling: New York, Academic Press, p. 21-22.
Pitometer Associates, 1987, Report on pitometer water- waste survey, San Francisco, California, 1986-1987: Montclair, New Jersey, Pitometer Associates, Engi neers, 30 p.
Presser, T.S., and Barnes, Ivan, 1974, Special techniques for determining chemical properties of geothermal water. U.S. Geological Survey Water-Resources Investigations Report 22-74, lip.
Praitt, W.O., Fereres, E., Kuita, K., and Snyder, R.L., 1987, Reference evapotranspiration (ETo) for Cali fornia: Berkeley, California, University of California, Division of Agriculture and Natural Resources, Bulle tin 1922, 11 p.
Rantz, S.E., 1974, Mean annual runoff in the San Fran cisco Bay region, California, 1931-70: U.S. Geo logical Survey Miscellaneous Field Studies Map MF-613, 24 p., 2 sheets, scale 1:500,000.
Robilliard, G.A., and Stromberg, L.P., 1987, Preliminary inventory of natural resources of Lake Merced with emphasis on siting additional fishing piers: Walnut Creek California: Entrix, Inc., 38 p.
San Francisco Department of Public Works, 1974, Sewer system evaluation for infiltration inflow, Phase 1, Richmond-Sunset District San Francisco Department of Public Works, 45 p.
Schlocker, Julius, 1974, Geology of the San Francisco north quadrangle, California: U.S. Geological Survey Professional Paper 782, 109 p.
Schussler, H., 1908, The past, present, and future water supply of San Francisco: San Francisco, California, Spring Valley Water Company.
Shoup, L.H., and Baker, Suzanne, 1981, Cultural resource overview: Lake Merced Transport, San Francisco Clean Water Management Program, San Francisco, California: San Francisco, California, L.H. Shoup, and Suzanne Baker, Archaeological Consultants, 95 p.
Todd, D.K., 1980, Groundwater hydrology: New York, John Wiley, 535 p.
U.S. Environmental Protection Agency, 1986, Quality criteria for water 1986, EPA 4405-86-001,452 p.
Viessman, Warren, Jr., Knapp, J.W., Lewis, G.L., and Harbaugh, T.E., 1977, Introduction to hydrology (2d ed.): New York, Harper and Row, 704 p.
Winter, T.C., 1984, Modeling the interrelationships of ground water and surface water, in Schoor, J.L., ed, Modeling of total acid precipitation impacts, Acid Precipitation Series, volume 9: Boston, Massachusetts, Butterworth Publishers, chap. 5, p. 89-119.
Wood, W.W., 1976, Guidelines for collection and field analysis of ground-water samples for selected unstable constituents: U.S. Geological Survey Techniques of Water-Resources Investigations, Book 1, ch. D2, 24 p.
Woodward-Clyde Consultants, 1977a, Onshore 500-ft boring (boring No. 1), sub-task 2-2, Southwest Ocean Outfall Project San Francisco, California: Woodward- Clyde Consultants, Basic data report to PBQ&D Inc., 26 p.
40 Geohydrology, Water Quality, and Water Budgets, San Francisco, California

Woodward-Clyde Consultants, 1977b, Onshore borings Nos. 2 through 12, Southwest Ocean Outfall Project San Francisco, California, Woodward-Clyde Consul tants, Basic data report to PBQ&D Inc., 14 p.
1977c, Geologic exploration studies, Southwest Ocean Outfall Project, sub-task 7-2: San Francisco, Cali fornia: Woodward-Clyde Consultants, report to PBQ&D Inc., 12 p.
1980, Pump test and infiltration test, Southwest Water Pollution Control Plant Project: San Francisco, Cali fornia: Woodward-Clyde Consultants, Geotechnical report to PBQ&D Inc., 8 p.
Woodward-Clyde Consultants, 1981, Geotechnical engi neering evaluation supplement, Southwest Ocean Outfall Project, subtasks 7-3 and 3-8: San Francisco, California, Woodward-Clyde Consultants, report to PBQ&D Inc., 35 p.
1984, Report on testing of Alvord Lake irrigation well, Golden Gate Park, San Francisco, California: Walnut Creek, California, Woodward-Clyde Consul tants letter report to San Francisco Department of Public Works, June 5, 1984, 6 p.
1985, Report on final inspection and testing of Alvord Lake irrigation well, Golden Gate Park, San Francisco, California: Walnut Creek, California, Woodward- Clyde Consultants letter report to San Francisco Department of Public Works, October 25, 1985, 4 p.
References Cited 41

APPENDIX A. Ground-Water Quality Data
[Data are given in milligrams per liter unless otherwise noted. °C, Degree Celsius; uJS/cm, microsiemens per centimeter, <, less than; , no data]
Map No.
Well name or sample source
Station No. Date
Specific conduct
ance (uS/cm)
pH(standard
units)
Temper ature, water
Calcium, Magnesium, dissolved dissolved
1 Northwest Windmill......... 374616122303001
2 Northeast Windmill ......... 3746161223030023 South Windmill ............ 374555122302801
4 Elk Glen ................. 374605122284801
5 Arboretum No. 5 ........... 374558122281001
7 Alvord .................. 374602122271001
8 Stanyan Street ............. 3745471222705019 HLA B .................. 374544122303001
10 HLA E .................. 374516122302701
11 HLA G ................. 374450122302401
12 HLA J .................. 374424122301901
13 HLA K ................. 374409122301701
15 HLA O ................. 374409122300701
16 HLA V ................. 374346122300501
17 Lawton North ............. 37451912230080118 Moraga North ............. 374523122300901
19 Santiago South ............ 374436122300501
20 Zoo No. 4 ................ 374406122301702
21 Zoo No. 3 ................ 37440612230170122 Stern Grove irrigation ....... 374412122284901
03-02-88 05-04-88 03-02-88 03-02-88 05-04-88 03-02-88 05-04-88 03-02-88 05-04-88 03-02-88 05-04-88 11-19-87 11-18-87 03-02-88 05-03-88 11-18-87 03-01-88 05-03-88 11-19-87 03-01-88 05-04-88 11-20-87 03-01-88 05-04-88 11-20-87 02-29-88 05-02-88 02-29-88 05-03-88 11-18-87 05-02-88 02-29-88 11-16-87 03-02-88 05-03-88 11-19-87 03-02-88 05-03-88 05-02-88 03-01-88 11-17-87 11-17-87 03-02-88 05-04-88
385371660420467529586588572625620507805784792952886815622615603530702727787727707413601907891922591597581550591618559625524591582522
7.98.0 7.57.77.8 7.7 7.97.27.37.87.9 6.87.57.6 7.6 7.0 7.3 7.3 7.7 7.5 7.96.86.97.0 7.47.17.2 7.0 7.0 7.5 7.2 7.27.57.6 7.6 7.2 7.4 7.2 7.7 7.7 8.0 7.2 7.1 7.1
18.5
17.517.517.016.516.017.517.014.518.516.518.018.018.017.017.018.0
15.518.018.516.518.018.019.0
18.019.018.017.5
19.018.0
18.520.019.020.518.018.018.0
1919332225313432313033345250514747452727271622223428271315434042423334293034272928303128
2322422529333741403234224847493938373132321726263028271524544748313335252831303331323431
42 Geohydrology, Water Quality, and Water Budgets, San Francisco, Califomla

APPENDIX A. Ground-Water Quality Data-Continued
Sodium, dissolved
2626342326262826264750383939398070674647485879787777774668708389302931404146394233413632
Potassium, dissolved
1.31.41.91.21.71.11.32.42.61.11.11.09.29.0
111312194.74.55.57.09.6
128.88.59.81.0.80
3.85.04.26.64.85.43.74.25.52.11.81.9.90
1.01.0
Bicar bonate,
(as HCO3)
14615225814216615417419619421421618130129630818518018217116616498
13016020020619474
115434432430
182186161186208174176177163172164
Carbonate,
00000000000000000000000000000000000000000000
Alkalinity, (as CaCO3)
12012521111613612614316115917517714824724325215214814914013613480
107131164169159
6194
356354352152149152132152170143144145133141134
Sulfate, dissolved
8.68.2
481528294133383033424844547265714843523134465854623056
2.71315374955222633342926453142
Chloride, dissolved
383647353941463028595630475047
1301301105660606593877579776481
11092
100504342556060495442463931
Fluoride, dissolved
0.20.10.20.10.10.20.10.10.10.20.20.20.10.10.10.20.20.10.10.10.10.20.20.20.30.30.30.10.10.20.20.20.10.10.10.10.10.10.10.20.20.10.10.10
Bromide, dissolved
0.11.12.16.11.15.16.24.24.25.30.31.15.35.31.35.55.45.42.24.24.25.24.36.39.32.28.34.26
1.2.26.29.28.42.21.22.34.35.38.22.21.20.28.25.24
Silica, dissolved
4443374139434238364749273130312124243031301929271717162840383739222728222122384037434643
Nitrogen, NO2+NO3 dissolved
(asN)
2.42.5-6.57.9
12141517 9.74.9
1514161614128.84.19.68.98.2
16148.56.33.18.5
.10
.42
.108.5
116.4 8.72.19.59.1
131415
Appendix A 43

APPENDIX A. Ground-Water Quality Data-Conf/nued
Map No.
24
26
2728
29
_.
Well name or sample source
Lake Merced .............
San Francisco State University
Olympic Club ............
San Francisco Golf Club
Seawater ................Municipal water ..........
Rain ...................Runoff .................
Station No.
374330122295601
. 374325122282801
374226122290701
374235122283801
374407122302601374302122290801
374346122300501374408122301301
Date
11-17-8703-01-88 *05-02-8811-19-8702-29-8805-03-8811-19-8703-01-8805-02-8811-19-8703-01-8805-03-8811-17-8711-17-8703-01-8805-02-8802-29-8811-17-87
Specific conduct
ance
654643650695683668593571568611606588
48,90053393811
167
pH (standard
units)
8.38.28.68.08.08.17.97.87.88.07.87.88.08.97.88.85.67.7
Temper ature, water
15.514.018.018.021.517.518.018.020.017.016.517.0145A~B*X
15.011.012.0
15.5
Calcium, dissolved
3131307068
282826343433
3306.54.95.0
46 "TVJ
3.8
Magnesium, dissolved
3233331516
31313032*J^
3232
1,000.58.12.30.01
1.5
44 Geohydrolgy, Water Quality, and Water Budgets, San Francisco, Caiifomia
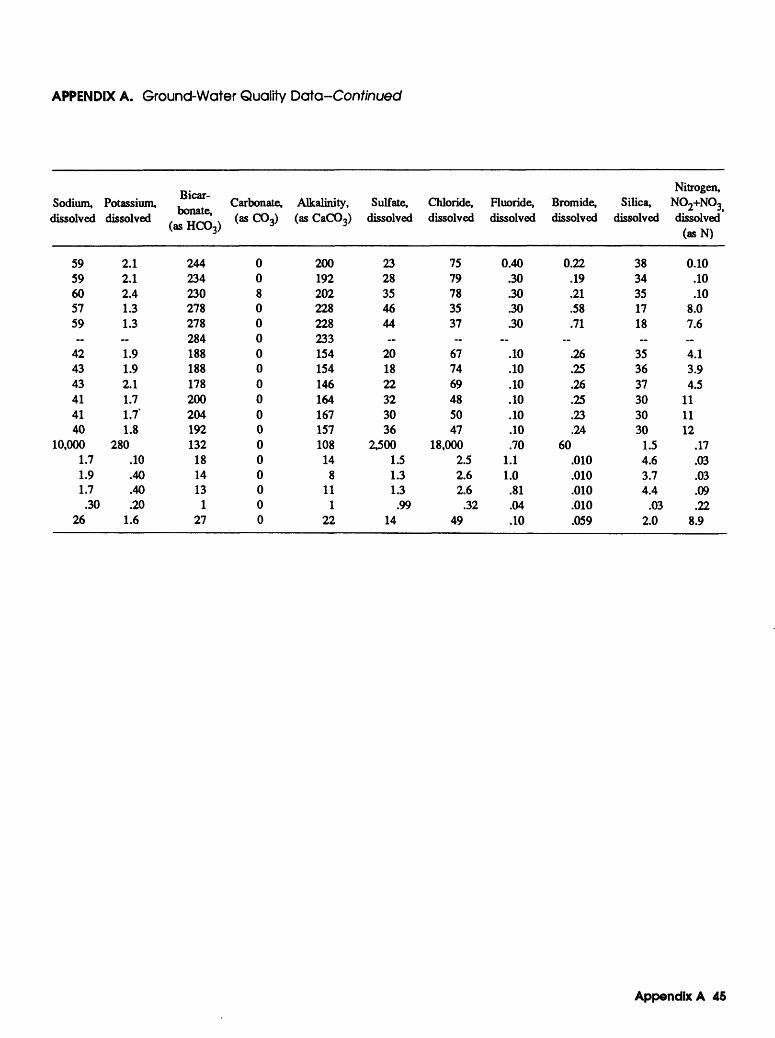
APPENDIX A. Ground-Water Quality Data-Conf/nued
Sodium, Potassium, dissolved dissolved
5959605759
424343414140
10,0001.71.91.7
.3026
2.12.12.41.31.3 1.91.92.11.71.7'
1.8280
.10
.40
.40
.201.6
Bicar- , , Carbonate, bonate,
(asHC03) (a§C°3>
244234230278278284188188178200204192132
181413
127
008000000000000000
Alkalinity, (as CaCO3)
200192202228228233154154146164167157108
148
111
22
Sulfate, dissolved
2328354644~
201822323036
2,5001.51.31.3
.9914
Chloride, dissolved
7579783537
677469485047
18,0002.52.62.6
.3249
Fluoride, dissolved
0.40.30.30.30.30
.10.10.10.10.10.10.70
1.11.0
.81
.04
.10
Bromide, dissolved
0.22.19.21.58.71
.26.25.26.25.23.24
60.010.010.010.010.059
Nitrogen, Silica, NO2+NO3
dissolved dissolved (asN)
3834351718
353637303030
1.54.63.74.4
.032.0
0.10.10.10
8.07.6~4.13.94.5
111112
.17
.03
.03
.09
.228.9
Appendix A 45