geohydrology and ground-water quality on … · appendix c. analyses of chemical constituents of...
TRANSCRIPT

GEOHYDROLOGY AND GROUND-WATER QUALITY ON SHELTER ISLAND,
SUFFOLK COUNTY, NEW YORK, 1983-84
by Dale L. Simmons
U.S. GEOLOGICAL SURVEY
Water-Resources Investigations Report 85-4165
Prepared in cooperation with
TOWN OF SHELTER ISLAND
Syosset, New York
1986

UNITED STATES DEPARTMENT OF THE INTERIOR
DONALD PAUL HODEL, Secretary
GEOLOGICAL SURVEY
Dallas L. Peck, Director
For additional information write to:
U.S. Geological Survey 5 Aerial Way Syosset, New York 11791 (516) 938-8830
Copies of this report may be purchased from:
Open-File Services Section Western Distribution Branch U.S. Geological Survey Box 25425, Federal Center Denver, CO 80225 (303) 234-5888
ii
CONTENTS
Page
Abstract. ............................... 1Introduction. ............................. 3
Purpose and scope. ........................ 3Methods of investigation ..................... 5Related investigations ...................... 5Acknowledgments. ......................... 6
Description of study area ....................... 6Climate. ............................. 6Topography ............................ 6Surface drainage ......................... 7Development. ........................... 7
Population. ......................... 7Water use .......................... 7
Geology ................................ 9Hydrology ............................... 11
The hydrologic cycle ....................... 11Recharge and discharge of ground water .............. 11Boundary between fresh and saline ground water .......... 13
Ghyben-Herzberg relationship. ................ 13Geologic controls on the distribution of fresh and saline
ground water ....................... 15Depth of freshwater/saltwater interface at selected
locations ......................... 15Water table. ........................... 19
Altitude in December 1983 .................. 19Fluctuations. ........................ 19
Chemical quality of ground water. ................... 21Chloride ............................. 22Iron and manganese ........................ 22pH ................................ 23Dissolved solids ......................... 23Nitrate. ............................. 24
Summary and conclusions ........................ 24References cited. ........................... 27Appendix A. New York State, U.S. Public Health Service, and U.S.
Environmental Protection Agency drinking-water standards . 29 Appendix B. Analyses of selected chemical constituents of water from
observation wells, 1983-84, and physical characteristicsof wells ......................... 30
Appendix C. Analyses of chemical constituents of ground water,Shelter Island, 1983-84. ................. 33
ILLUSTRATIONS
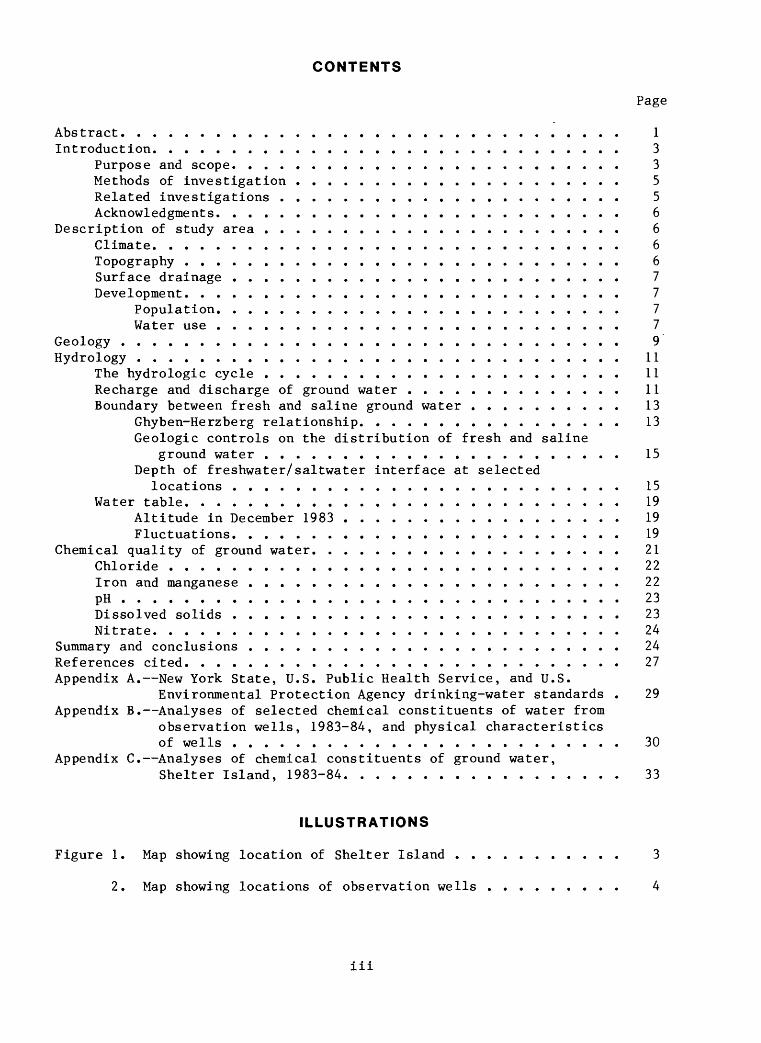
Figure 1. Map showing location of Shelter Island ........... 3
2. Map showing locations of observation wells ......... 4
iii
ILLUSTRATIONS (CONTINUED)
Page
Figure 3. Hydrogeologic section through Shelter Island ........ 10
4. Generalized hydrogeologic section showing hydrologic cycleand pattern of ground-water movement on Shelter Island ... 12
5. Generalized hydrogeologic sections showing theoretical relationship between fresh and saline ground water under hydrostatic conditions and with seaward discharge of fresh ground water ........................ 14
6. Graph showing relationship between specific conductance and chloride concentration of ground water in observation wells on Shelter Island. ..................... 18
7. Map showing water-table altitude on Shelter Island inDecember 1983. ....................... 20
8. Graph showing water-level fluctuations in three water-tablewells and monthly precipitation, 1974-83 .......... 21
TABLES
Table 1. Year-round and summer population, Town of Shelter Island,1938-84 ........................... 8
2. Public water-supply pumpage, Town of Shelter Island, 1983 . . 9
3. Chloride concentrations in shallow ground water on ShelterIsland, 1983-84 ....................... 16
4. Chloride concentration and specific conductance of ground water at various depths and approximate altitude of freshwater/saltwater interface in 10 observation wells on Shelter Island, September through October 1983. ....... 17
5. Concentration of selected constituents of native ground waterin the upper glacial aquifer. ................ 22
iv
Conversion Factors and Abbreviations
For those who prefer to use metric (International System) units rather than the inch-pound units in this report, the following conversion factors may be used:
Multiply Inch-Pound Units
inch (in) foot (ft) mile (mi)
square mile
gallon (gal)
gallon per day (gal/d) million gallons per day
(Mgal/d)million gallons per day
per square mile [(Mgal/d)/mi2 ]
degree Fahrenheit (°F)
by_
Length
25.400.30481.609
Area
2.590
Volume
3.785
Flow
3.785
0.04381
1,460
Temperature
'C = 5/9 (°F-32)
To Obtain Metric Units
millimeter (mm) meter (m) kilometer (km)
square kilometer (km2 )
liter (L)
liter per day (L/d) cubic meter per second
(m3/s)cubic meter per day per
square kilometer Km3 /d)/km2 ]
degree Celsius (°C)
Other Abbreviations
mo (month)yg/L (micrograms per liter)
mg/L (milligrams per liter) yS/cm (microsiemens per centimeter
at 25°C)
GEOHYDROLOGY AND GROUND-WATER QUALITY ON SHELTER
ISLAND, SUFFOLK COUNTY, NEW YORK, 1983-84
by Dale L. Simmons
Abstract
Shelter Island, with an area of about 11 mi^, lies between the north and south forks of eastern Long Island in Suffolk County. The thin upper glacial (water-table) aquifer contains the lens-shaped freshwater body that is the sole source of freshwater for the Town's population of about 2,200 year-round and 10,000 summer residents. The aquifer consists of permeable sand and gravel deposits that readily permit intrusion of saline ground water in coastal areas. Underlying clay units that contain saline ground water form the lower boundary of the freshwater lens and limit its thickness.
Chloride concentrations in ground water above the freshwater/saltwater interface, defined as 40 mg/L (milligrams per liter) Cl~, are relatively constant with depth. Below the interface, however, chloride concentrations increase rapidly as much as an order of magnitude within 10 feet until they reach 19,000 mg/L, the chloride concentration of seawater.
Chloride concentrations in shallow ground water from wells screened in or near the zone of diffusion may range over two orders of magnitude in response to variations in recharge and ground-water withdrawal. After the summer season of relatively low recharge and peak water demand, the thickness of the freshwater lens is less than 20 ft in many nearshore areas.
A map showing the configuration of the water table in December 1983 indicates freshwater mounds in the center of the island, in the Mashomack Preserve, on the Dering Harbor-Hay Beach peninsula, and in the area between Shelter Island Heights and West Neck Bay. Areas in which the supply of fresh ground water is severely limited include all coastal areas, the southernmost part of the West Neck peninsula, and Little Ram Island. Water levels in most locations are less than 6 ft above sea level. During 1974-83, seasonal water-table fluctuations were greater than variations that occurred from year to year.
Ground-water quality on Shelter Island is generally good and usually meets Federal and State drinking-water standards. However, many wells contain water that has excessive concentrations of dissolved iron and manganese (up to 5.0 mg/L and 3.0 mg/L, respectively), and elevated chloride and dissolved- solids concentrations (up to 310 mg/L and 585 mg/L, respectively) have been found in some nearshore wells, especially during late summer and early fall.
Total pumpage on Shelter Island in 1983 was about 260 million gallons, which represents an increase of about 20 percent since 1974. Increased withdrawal of fresh ground water in nearshore areas will cause further landward movement of saline ground water; in other areas, excessive pumping may cause upconing. A system of widely spaced pumping wells that avoid nearshore areas would minimize these effects. Continued monitoring of observation wells would enable early detection of further landward movement of saline ground water.
INTRODUCTION
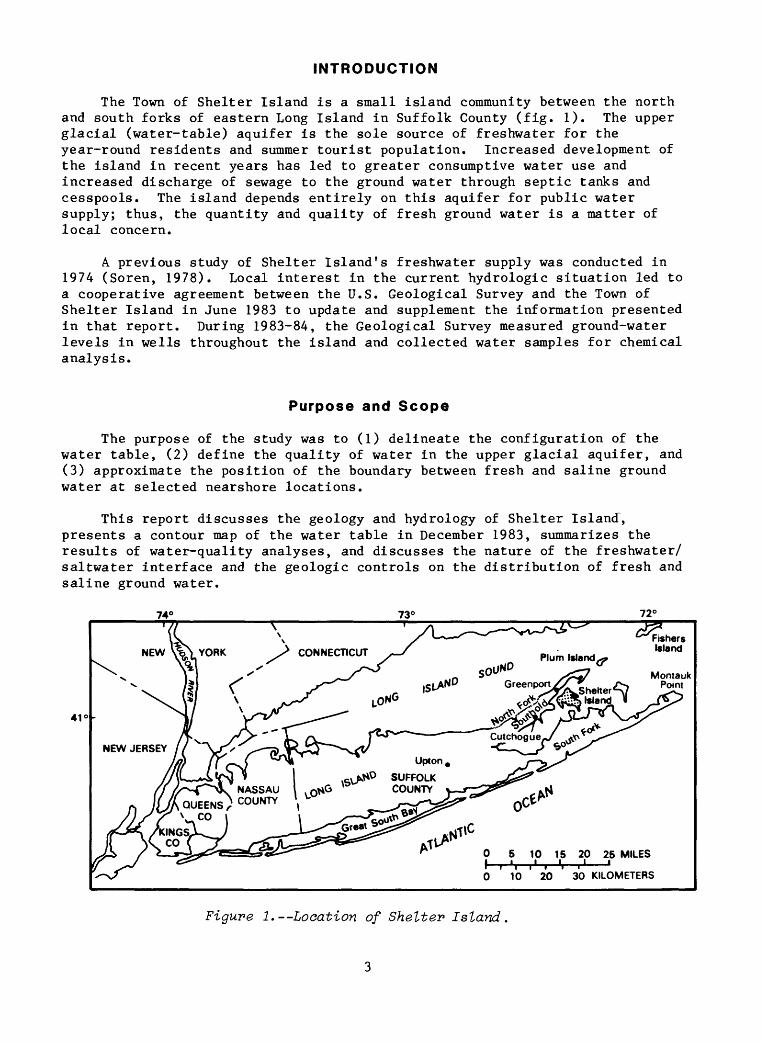
The Town of Shelter Island is a small island community between the north and south forks of eastern Long Island in Suffolk County (fig. 1). The upper glacial (water-table) aquifer is the sole source of freshwater for the year-round residents and summer tourist population. Increased development of the island in recent years has led to greater consumptive water use and increased discharge of sewage to the ground water through septic tanks and cesspools. The island depends entirely on this aquifer for public water supply; thus, the quantity and quality of fresh ground water is a matter of local concern.
A previous study of Shelter Island's freshwater supply was conducted in 1974 (Soren, 1978). Local interest in the current hydrologic situation led to a cooperative agreement between the U.S. Geological Survey and the Town of Shelter Island in June 1983 to update and supplement the information presented in that report. During 1983-84, the Geological Survey measured ground-water levels in wells throughout the island and collected water samples for chemical analysis.
Purpose and Scope
The purpose of the study was to (1) delineate the configuration of the water table, (2) define the quality of water in the upper glacial aquifer, and (3) approximate the position of the boundary between fresh and saline ground water at selected nearshore locations.
This report discusses the geology and hydrology of Shelter Island, presents a contour map of the water table in December 1983, summarizes the results of water-quality analyses, and discusses the nature of the freshwater/ saltwater interface and the geologic controls on the distribution of fresh and saline ground water.
41°
MILES
0 T 10 ' 20 ^0 KILOMETERS
Figure 1.--Location of Shelter Island.

72° 22'30"
41° 05'
41° 02' 30"
41
GREENPORT
72° 20'
HAY BEACH
72° 17'30"
51182 75434SHELTER ISLAND
BERING RARSQR7543,5 I > 51181 p v I <
52084
GARDINERS BAY
CHASE \ CREEK \ yL^
/ ^5V180^
>"" / \/ 1 \ N -f"5TT76f
Bowditch Rd / \ ! ^''i-53175!
51171 \^ »38462
\ 1/52050
75432RAM ISLAND
MASHOMACK /PRESERVE y
75440 __^, V51183
75441
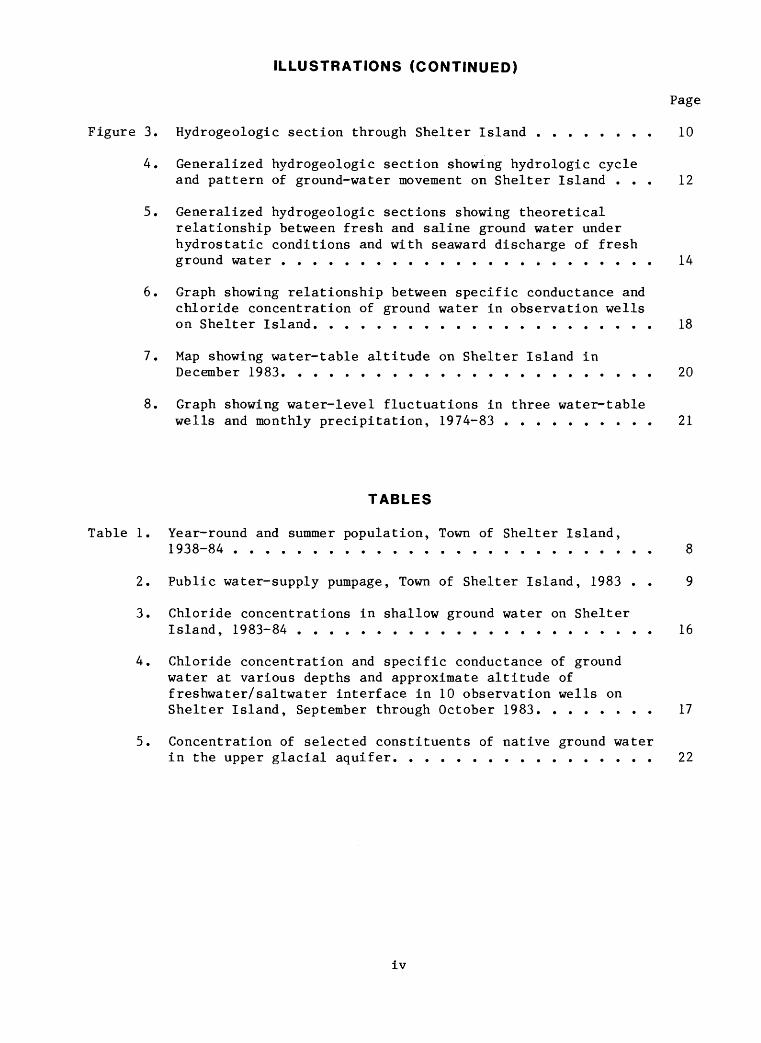
.52050 OBSERVATION WELL AND . COUNTY WELL NUMBER (Prefix S is omitted) x
f\ P PUBLIC WATER-SUPPLY FACILITY
NORTH HAVEN
A A' HYDROGEOLOGIC SECTION shown in figure 3
3A 1 MILE
% 1 KILOMETER
Base from U.S. Geological SurveyGreenport, NY, andSouthold, NY, 1:24,000 scale
Figure 2.--Locations of observation wells.

Methods of Investigation
Ten observation wells (S75432 to S75441) were installed at locations shown in figure 2 to supplement the 17-well network. The locations were chosen to (1) improve the geographic coverage of the island with respect to water-level and water-quality data, (2) obtain information on the chloride concentration of ground water in nearshore areas, and (3) provide permanent facilities for monitoring saltwater movement.
The new wells have a 2-inch inside diameter. Four are cased with steel and finished with 2-ft-long screens, and six are cased with PVC (polyvinyl chloride) and finished with 5-ft-long screens. All screen tops were installed about 10 ft below the water table. (The screened interval and casing material of each well are given in appendix B.)
Wells were installed by auger to a depth of 85 ft. Each was then pumped with a suction pump until specific conductance values stabilized. Ground- water samples were collected for specific conductance and chloride analyses. The screen was subsequently raised 10 ft, the well was pumped again, and another sample was collected. This procedure was repeated at 10-ft intervals until the screen top was approximately 10 ft below the water table, where it was left for ground-water monitoring.
These 10 wells, in addition to the 17 observation wells installed during the previous study (Soren, 1978), were sampled either two or three times at 3-month intervals for a suite of water-quality characteristics, including temperature, pH, specific conductance, chloride, dissolved and total iron, dissolved and total manganese, and nitrate. (Complete water-quality analyses are given in appendix C.) Wells were sampled by suction pump or, if the water table was more than 20 ft below land surface, with a submersible pump. In each case, the well was pumped long enough for the volume of water in the casing to be evacuated three times to ensure that the ground water being sampled was from the formation. Temperature, pH, and specific conductance were measured in the field. Chloride analyses were made in the U.S. Geological Survey laboratory in Syosset, N.Y., with an Orion^ combination chloride electrode; the remaining analyses were done by the U.S. Geological Survey Water-Quality Laboratory in Doraville, Ga.
Related Investigations
Jensen and Soren (1974) depicted the hydrogeology of Suffolk County in a series of geologic and hydrologic maps. Soren (1978) made a preliminary investigation of the geology and ground-water resources of Shelter Island, including a water-table map and selected water-quality data.
Several studies of nearby areas with hydrogeologic characteristics similar to Shelter Island's are available. Crandell (1962) discussed the geology and ground-water resources of Plum Island (fig. 1). Hoffman (1961) and Crandell (1963) described, respectively, the hydrologic and geologic
Use of brand names is for identification purposes only and does not constitute endorsement by the U.S. Geological Survey.
environment of the Town of Southold on the north fork (fig. 1). Perlmutter and DeLuca (1963) discussed the availability of fresh ground water in the Montauk Point area (fig. 1). Nieter and others (1975) gave information on the late Quaternary geology of the south fork; Nemickas and others (1977) presented ground-water, surface-water, and water-quality data compiled during an investigation of the same area. These data formed the basis for an exhaustive appraisal of the south fork's water resources (Nemickas and Koszalka, 1982). A recent assessment of the ground-water resources of the Montauk area is given in Prince (1986).
Acknowledgments
Observation wells were installed by Suffolk County Department of Health Services under the direction of Steven Gary and Richard Markel. Mr. Gary also assisted in the September 1983 water-quality sampling. J. Michael Laspia, director of the Nature Conservancy's Mashomack Preserve, allowed access to the property for well installation and sampling. Malvin Nevel, Town Supervisor of the Town of Shelter Island during the greater part of this study, helped in securing permission for the use of local road rights-of-way for well installation.
DESCRIPTION OF STUDY AREA
Shelter Island is bounded on the east and northeast by Gardiners Bay, and on the west, northwest, and south by Shelter Island Sound (fig. 2). The island is predominantly a residential and summer-resort community that, in 1983, had 2,200 year-round residents and a summer population of 10,000 (Dorothy Ogar, Town Clerk, oral commun., 1984). Access to the island is by ferry from Greenport on the north and from North Haven on the south.
Climate
Because of its latitude and proximity to Long Island Sound and the Atlantic Ocean, Shelter Island has a temperate marine climate characterized by moderate temperatures and abundant precipitation, especially during the fall, winter, and spring. Mean annual temperature at Cutchogue (fig. 1) was 51°F over a 54-year period, and mean annual precipitation at the same station was 45 inches over a 51-year period (Crandell, 1963). Miller and Frederick (1969) estimated mean annual precipitation on Shelter Island during 1951-65 to be between 43 and 45 inches. Measured precipitation at Greenport (fig. 1) averaged 47 inches during 1974-83.
Topography
Altitudes on Shelter Island range up to 180 ft. The highest altitudes are in the western part of the island in Shelter Island Heights and north and west of West Neck Bay (fig. 2). A steep bluff about 100 ft high faces Shelter Island Sound. Most of the remainder of the island is lower than 70 ft. The
land surface gradually descends to the shore as a rolling plain characterized by small ponds and both dry and marshy depressions, which are especially common in the southeastern part of the island. Dry depressions range from 10 to 40 ft in depth, whereas ponds and marshes are mostly in shallow depressions that are less than 10 ft above sea level.
Surface Drainage
Shelter Island has no significant streams. A small part of the Village of Shelter Island Heights has a storm-sewer system that discharges to tidewater, but most precipitation either evaporates, transpires, or infiltrates through the soil to recharge the ground-water system. Overland runoff may occur during storms of high intensity or long duration, especially in the high areas in the northwestern part of the island and in areas where the surficial material is underlain by clayey or silty deposits. Runoff may discharge to surface-water bodies such as Shelter Island Sound or Chase Creek (fig. 2), or it may become ponded. Most of the ponded water eventually seeps into the ground; the remainder evaporates.
Development
The southeastern third of Shelter Island consists of the Mashomack Preserve (fig. 2) an undeveloped, virtually uninhabited area owned and maintained by the Nature Conservancy. The remainder of the island is characterized by single-family houses, large open areas, a few public buildings, stores, restaurants, motels, yacht and country clubs, and boat marinas. The Town has a waste-disposal site east of Menantic Road and south of Bowditch Road (fig. 2).
Population
The year-round population of Shelter Island has been increasing at a slow but steady rate; the part-time population (primarily summer tourists) has been rising much more rapidly. Table 1 shows year-round and summer population estimates at irregular intervals during 1938-84.
An increase in population has several significant implications for the hydrologic system, among which are (1) increased housing and services (stores, etc.), which causes an increase in paved and impervious surfaces and a decrease in pervious areas that allow precipitation to infiltrate and recharge the ground-water system; (2) increased demand for water (which is highest during the summer, when recharge is lowest), which increases the stress on the system and in turn may result in upconing and intrusion of saline ground water; and (3) increased volume of sewage, which is discharged to the ground-water system through cesspools and septic tanks and may eventually have detrimental effects on the quality of the ground-water supply.
Water Use
Shelter Island has three local public water-supply facilities that serve the Villages of Shelter Island Heights, Bering Harbor, and West Neck (fig. 2),

These facilities supply water to a population of 535, or 25 percent of the year-round residents on the island. The remaining homes have private wells that supply water for domestic use, lawn sprinkling, and swimming pools.
Only the Shelter Island Heights Association and Bering Harbor Water District reported their actual 1983 pumpage to the New York State Department of Environmental Conservation in Stony Brook, Long Island. Pumpage by West Neck Water Supply was estimated by Suffolk County Department of Health Services; these values, shown in table 2, indicate that total daily public-supply pumpage on Shelter Island during 1983 was about 0.094 Mgal/d. Assuming this to be an average daily pumpage adequate to supply the water needs of a population of 535, annual pumpage for the island may be calculated as follows:
Summer only: (0.094 Mgal/d) (10,000 persons/535 persons) (3 mo) (30 d/mo) = 158 Mgal
Rest of year: (0.094 Mgal/d (2,200 persons/535 persons) (9 mo) (30 d/mo) =104 Mgal
for a total annual pumpage of 262 Mgal.
Soren (1978) estimated a per-capita water use of 200 gal/d during the summer and 100 gal/d during the rest of the year. From these estimates, the following pumpage calculations may be made:
Summer only: ([200 gal/d]/person) (3 mo) (30 d/mo) (10,000 persons) = 180 Mgal
Rest of year: (100 gal/d/person) (9 mo) (30 d/mo) (2,200 persons) = 59 Mgal
for a total annual pumpage of 239 Mgal.
Table 1---Year-round and summer population, Town of Shelter Island, 1938-84.
[Dashes indicate data are unavailable]Approximate population
Year-round Summer Year residents residents
19381968196919741984
500al,600al,700a2,000a2,200b
6,500a8,000a10,000b
a Data from Soren (1978). " Oral commun., Dorothy Ogar, Town
Clerk, April 30, 1984.

These estimates of total annual pumpage are in close agreement (within 10 percent); the first is preferred because it is derived from actual pumpage data. Therefore, 262 Mgal may be considered to approximate total annual pumpage on Shelter Island, and Soren's estimates of per-capita daily water use may be considered reasonable.
The value derived by Soren (1978) for total annual pumpage in 1974 was 198 Mgal; the value derived above for total annual pumpage in 1983, by the same method of calculation, was 239 Mgal. Therefore, total annual pumpage increased approximately 21 percent during 1974-83.
Table 2.--Public water-supply pumpage. Town of Shelter Island, 1983.
Water-supply facility
Numberof
wellsa
Numberof
services3Population served3
PumpageTotal (Mgal) Mgal/d
Shelter IslandHeights Association
Bering Harbor WaterDistrict
West Neck WaterSupply
Total
4
2
2
125
35
27
310
130
95
b27.1
b2.99
4.38
0.074
.008
a .012
187 535 34.5 .094
a Data from Suffolk County Department of Health Services estimate ° Data from New York State Department of Environmental Conservation
GEOLOGY
Shelter Island consists of Pleistocene deposits of mostly stratified, poorly to moderately sorted glacial drift that are underlain by two Pleistocene clay units. The clays are in turn underlain by an Upper Cretaceous sand unit informally known as the Magothy aquifer.
The stratified drift constitutes the upper glacial (water-table) aquifer. Particle size ranges from clay to boulders; the most common constituent is fine to coarse, light- to dark-brown sand. Clay and silt are found mostly in the northwestern part of the island, especially along the coast, where they form topographic highs. Abundant silty and clayey material was also found at the site of well S75436 on Shore Road (fig. 2), from 28 to 88 ft below land surface. Cobbles and boulders were common at the site of well S75434, on the Hay Beach peninsula.
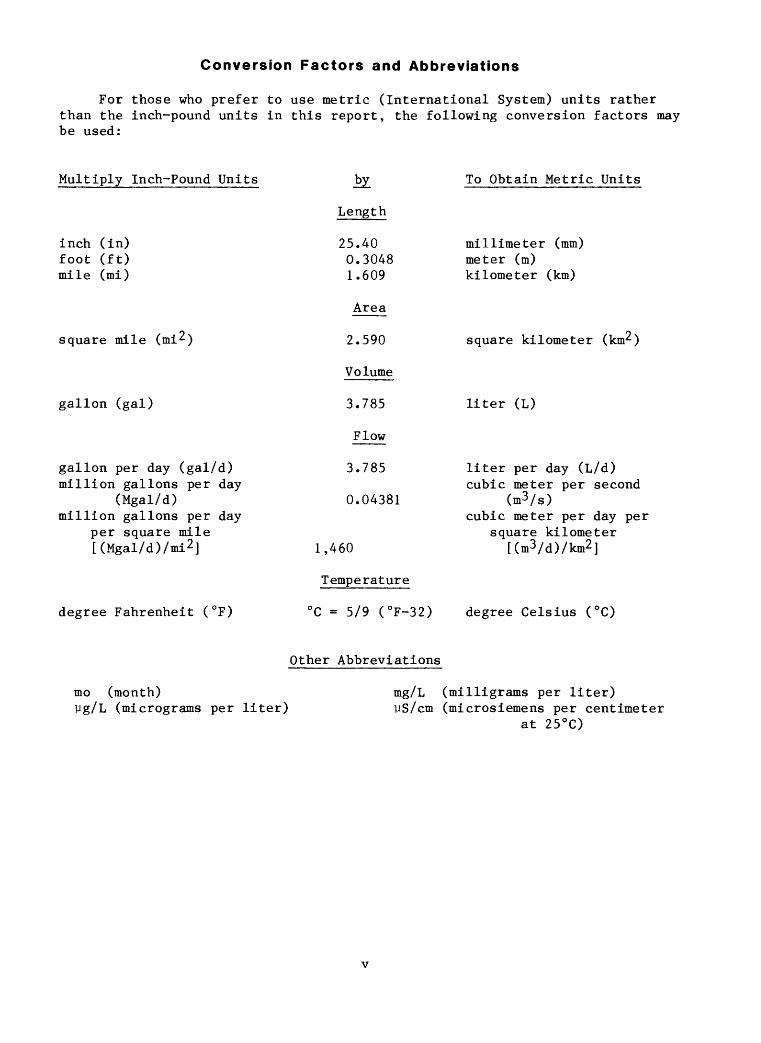
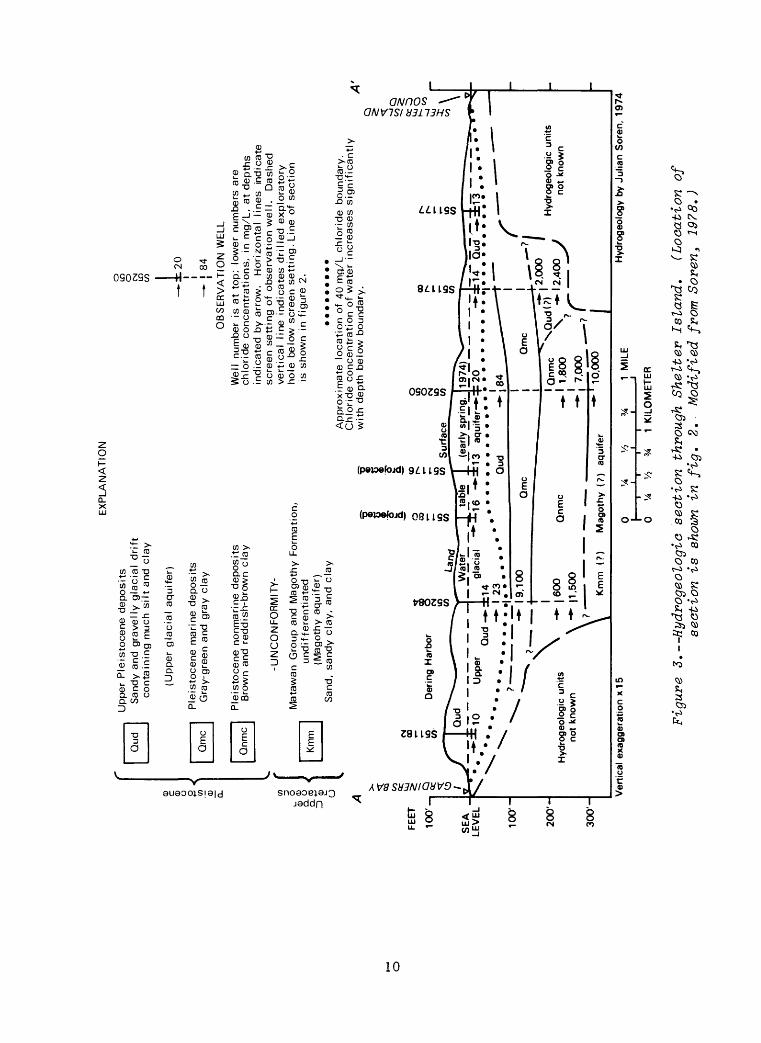
Three exploratory wells penetrated the geologic units that underlie the stratified drift on Shelter Island; these units are described in detail by Soren (1978). A hydrogeologic section constructed from geologic and gamma-ray logs of these wells is shown in figure 3.
EX
PLA
NA
TIO
N
,_ o
0 9, O
Up
pe
r P
leis
toce
ne d
ep
osits
Sandy
and g
ravelly
gla
cia
l drift
co
nta
inin
g m
uch
silt
and c
lay
(Upper
gla
cia
l aquifer)
Ple
isto
cene m
arine d
ep
osits
Gra
y-gre
en a
nd g
ray
cla
y
Ple
isto
ce
ne
nonm
arine d
eposits
Bro
wn
and
reddis
h-b
row
n c
lay
-UN
CO
NF
OR
MIT
Y-
Ma
taw
an
G
roup a
nd M
ag
oth
y F
orm
atio
n,
undiffe
rentiate
d
(Ma
go
thy
aq
uife
r)
San
d, s
an
dy
cla
y,
and c
lay
o CM
IT)
20
j 84
OB
SE
RV
AT
ION
WE
LLW
ell
nu
mb
er
is a
t to
p;
low
er
nu
mb
ers
are
ch
lorid
e c
on
ce
ntr
atio
ns,
in m
g/L
, at
depth
s in
dic
ate
d b
y arr
ow
. H
orizonta
l lin
es
indic
ate
sc
reen s
ett
ing
of
ob
se
rva
tio
n w
ell.
D
ash
ed
vert
ical
line in
dic
ate
s d
rille
d e
xp
lora
tory
hole
belo
w s
cre
en
se
ttin
g.
Lin
e o
f section
is s
how
n
in f
igu
re 2
.
Ap
pro
xim
ate
lo
ca
tio
n o
f 40
mg
/L c
hlo
ride
bo
un
da
ry.
Ch
lorid
e c
oncentr
ation o
f w
ate
r in
cre
ase
s sig
nific
antly
>- 5 f
FEE
T ^
10
0'-,
Q
SE
A
_LE
VE
L
10
0'-
200'-
300'-
2 ^
=-
p
witn a
eptn
oe
iow
oo
un
aa
ry.
6 S
I
B
%
5"
CM 00 ">
Der
ing
Har
bor
J
Qud^~
"
^
.
,~*"
^ 1
0
Upp
er
^ """' ..
"^
Hyd
roge
olog
ic u
nits
^
"*"
not
know
n
\
*
Y-^ CM in
* _
_ ta
nd
4 o CO in
a. (O
Sur
face
S O
CM
1 3§ £5^
CD
r»
K. -
r>
r>
-J
f.en
_T^
Wa
ter
_J
tabl
e J_
(e
arly
spr
ing,
1 1
9 /4
)"s^
"'1'
"' [^
_
p _^_
1 gl
acia
l
19
,10
0\
I | 60
0
|1,5
00
Km
m
(?)
Ver
tical
exa
gger
atio
n x
1 5
-^^1
6"^
^1
3
aquife
r-^-
+
Q
Qm
c
Qnm
c
Magoth
y (?
)
0 t
0
V4
1/4
1/2
ud aqui
fer
V2
3/
-^]
* '
1
20
*
84 -
Qm
c
"
Qnm
c \Q
ud(?
) 1,
800
>?
~*~
7,0
00
__
^?
(~
10,0
00
1
1 M
ILE
t I I
14
Qud
-^
±13
. .
. "
^
-71
\ -*
** ""
"f*2
,000
/
1 H
ydro
geol
ogic
uni
ts
1 2,4
00
J
not
know
n
Hyd
roge
olog
y by
Ju
lian
Sor
en,
1974
3/4
1 K
ILO
ME
TE
R
Figure 3. Hydrogeologic
sect
ion
thro
ugh
Shel
ter
Island.
(Loc
atio
n of
sect
ion
is sh
own
in f
ig.
2.
Modi
fied
from Soren, 1978.)

Directly beneath the stratified drift is a gray-green to dark-gray marine clay; its thickness ranges from 50 to 95 ft at the three exploratory sites and increases southward. This unit was first encountered at depths of 130 ft, 139 ft, and 85 ft at wells S52084, S52050, and S51178, respectively (figs. 2 and 3).
The lower clay unit is a red-brown to brown nonmarine deposit; it is 123 ft thick at well S52050 and thicker at well S52084, where it was not fully penetrated. This unit was absent at well S51178, where the marine clay is directly underlain by glacial sand and gravel. The top of the nonmarine clay is 180 ft and 218 ft below land surface at wells S52084 and S52050, respectively (figs. 2 and 3).
Only one well (S52050) penetrated the Upper Cretaceous Matawan Group and Magothy Formation, undifferentiated (Magothy aquifer), which consists of gray to white, fine to coarse sand with interstitial clay, silt, and lignite (Jensen and Soren, 1974). The upper surface of this unit is about 300 ft below sea level (Soren, 1978). Below the Magothy are, in descending order, the clay member and Lloyd Sand Member (Lloyd aquifer) of the Raritan Formation, and crystalline bedrock. Additional information on these deep strata is given in Jensen and Soren (1974).
HYDROLOGY
The Hydrologic Cycle
Water circulates continually between the ocean and the atmosphere in a process known as the hydrologic cycle (fig. 4). Solar radiation causes sea water to evaporate and become part of the atmosphere. Precipitation returns the water to the land surface, where it may re-evaporate, be transpired back to the atmosphere by vegetation, run off impermeable surfaces or steep slopes to ponds, marshes, or bays, or infiltrate through the soil to become part of the ground-water flow system.
Pond or marsh water may evaporate, be transpired, or infiltrate to the aquifer. Most ground water on Shelter Island discharges directly to the ocean as subsurface outflow; from there it is evaporated back to the atmosphere.
A more generalized description of the hydrologic cycle would also include overland runoff to streams, ground-water discharge to streams, and streamflow to bays and the ocean as major components. However, Shelter Island has no significant streams.
Recharge and Discharge of Ground Water
Precipitation is the sole source of fresh ground water on Shelter Island. Because less than 1 percent becomes overland runoff (Nemickas and Koszalka, 1982), virtually all precipitation on the island ultimately takes one of two routes evapotranspiration (evaporation plus transpiration) or recharge to the ground-water system.
11

Average annual precipitation at Greenport (fig. 1) during 1974-83 was 47 inches. If evapotranspiration and overland runoff are assumed to be about 50 percent and 1 percent of precipitation, respectively (Nemickas and Koszalka, 1982), then average annual ground-water recharge during this 10-year period is calculated as follows:
Recharge = Precipitation - (Evapotranspiration + Overland Runoff) = 47 inches - (23.5 inches + 0.5 inches) = 23 inches
or about 4.4 billion gallons annually. This represents an average recharge rate of about 12 Mgal/d islandwide, or slightly more than 1 (Mgal/d)/mi2.
Fresh ground water on Shelter Island continually flows from the high areas of the water table toward the perimeter of the island and discharges into the surrounding saline water (fig. 4). The interface between fresh and saline water is not a sharp boundary, but a zone of diffusion in which the chloride concentration of the freshwater gradually increases with distance from the island until it equals the salinity of the surrounding bays.
Under natural conditions, recharge and discharge are in equilibrium, so that the freshwater/saltwater interface is maintained in a relatively constant position. When water is pumped from the aquifer, however, the flow of fresh ground water toward the zone of diffusion is decreased, which allows landward movement of the interface and reduces the volume of fresh ground water in storage.
Where most of the pumped water is returned to the aquifer through cesspools and septic tanks, this imbalance is minimized. However, some of the pumped water is directed to consumptive uses that is, it is not returned
FRESHWATER/SALTWATER INTERFACE AND ZONE OF DIFFUSION
Precipitation
Evaporation
Infiltration Transpiration
Runoff i
Surface seepage,
Ocean
Evaporation
/'/ / / /Water
Not to scale
Figure 4. Hydrologic cycle and pattern of ground-water movement on Shelter Island.
12

directly to the aquifer system. Examples of consumptive use on Shelter Island are evaporation from lawn sprinkling, irrigation, and swimming pools, and transpiration by plants, whereby water is returned to the atmosphere and is thus lost from the ground-water system.
To maintain an adequate ground-water supply over the long term, recharge must balance both consumptive use and the natural outflow of fresh ground water to surrounding saltwater bodies. Total annual pumpage and total annual recharge on Shelter Island have been estimated to be 260 Mgal and 4,380 Mgal, respectively. Thus, 6 percent of annual recharge is "used" (not all of it consumptively), leaving more than 94 percent available to maintain the position of the interface. From an islandwide perspective, significant land ward movement of saline ground water would be unlikely under these conditions. However, the geographic distribution of pumping wells is a critical factor. Excessive withdrawal of fresh ground water in nearshore areas will undoubtedly cause a local disturbance of the freshwater-saltwater equilibrium that will result in locally increased chloride concentrations in water near the pumping well. The degree of saltwater encroachment is dependent on the distance of the well from the shore, the amount of pumping, and the local characteristics of the aquifer. In other areas, excessive ground-water withdrawals may result in upconing of the saline ground water into the freshwater lens.
Boundary Between Fresh and Saline Ground Water
The thickness and position of the freshwater/saltwater interface depend on several factors, which are discussed below with respect to Shelter Island.
Ghyben-Herzberg Relationship
The simplest analysis of the relationship between fresh and saline ground water in a coastal aquifer assumes that the aquifer is homogeneous (of uniform composition), that the ground water is under unconfined (water-table) conditions, and that the interface is under hydrostatic conditions (no recharge or discharge).
Under these conditions, the interface between saltwater of density p g and freshwater of density Pf projects into the aquifer as shown in figure 5A. The interface will remain stationary if the weight of a unit column of freshwater that extends from the water table to the interface is balanced by the weight of a unit column of saltwater that extends from sea level to the same depth as the point on the interface.
This relationship can be expressed mathematically as follows:
PfpsSzs = pfg < z s + zw> or zs = zw
P s - Pf
where: p g = density of saltwater; Pf = density of freshwater;g = acceleration due to gravity;
z g = depth of interface below sea level; and zw = altitude of water table above sea level.
13

Taking the densities of fresh and saltwater to be 1.0 and 1.025, respectively,
z s = 40 zw
This equation is the Ghyben-Herzberg relationship. It states that, at any particular location, for every foot of water-table altitude above sea level, fresh ground water will extend 40 ft below sea level. For example, if the water table at a given site is 2.5 ft above sea level, the interface at that site is 100 ft below sea level; the thickness of the fresh ground-water body is, therefore, 102.5 ft at that spot. This principle also implies that, if the water table in a homogeneous, unconfined coastal aquifer is lowered 1 ft, the interface will rise 40 ft, and that the total thickness of saturated aquifer will be reduced by 41 ft (fig. 5B).
The following factors limit the usefulness of the Ghyben-Herzberg relationship for Shelter Island:
1. The Ghyben-Herzberg relationship generally underestimates the depth to the freshwater/saltwater interface because ideal (hydrostatic) conditions do not occur in most real settings. Intermittent freshwater recharge from precipitation and continuous discharge of fresh ground water to the sur rounding saline water as subsurface outflow (fig. 5B) push the interface to a greater depth than predicted by the Ghyben-Herzberg relationship.
2. As stated earlier, the interface separating freshwater from saline water in a coastal aquifer is not a sharp boundary but a zone of diffusion in which mixing occurs. The width of this zone depends on the character istics of the aquifer material. Where the zone of diffusion is wide, the flow pattern may be altered sufficiently to cause the position of the interface to depart considerably from the Ghyben-Herzberg prediction.
Island Island
/°s = DENSITY OF SALTWATER
P! ^ DENSITY OF FRESHWATER
Zs = DEPTH OF INTERFACE BELOW SEA LEVEL
Zw = ALTITUDE OF WATER TABLE ABOVE SEA LEVEL
Ah = CHANGE IN WATER-TABLE ALTITUDE
Figure 5. Theoretical relationship between fresh and saline ground water: A. Under hydrostatic conditions. B. With seaward discharge of fresh ground water. (Modified from Freeze and Cherry,, 1979.)
14
3. The geologic units underlying Shelter island are anisotropic. Geologic variations both laterally and with depth contradict the assumption of homogeneity (uniform composition).
Geologic Controls on the Distribution of Fresh and Saline Ground'Water
On Shelter Island, the clay units beneath the upper glacial aquifer tend to confine saline ground water beneath them and prevent the water from mixing with the freshwater above. The nearly horizontal arrangement of the geologic units, however, enhances the lateral movement of saline ground water from shore areas toward pumping wells in the aquifer above the clay units. Thus, Shelter Island's geologic framework permits lateral infiltration of saline water into the aquifer and also limits the thickness of the freshwater lens.
As shown in figure 3, all fresh ground water in storage on Shelter Island lies between the water table and the top of the marine clay unit, which ranges from 65 to 100 ft below sea level (Soren, 1978). The lower boundary of the freshwater lens rises seaward near the shores.
The saline water in the clay strata is probably residual from the period when the marine (upper) clay was deposited. The chloride in this water has probably been diluted over time, and additional freshening is possible if the water table remains at present levels or rises. The clays cannot be relied upon for future water supply, however, because (1) the freshening process would require thousands to tens of thousands of years owing to the clays' thickness and low hydraulic conductivity; (2) potentiometric heads in the overlying fresh ground water are relatively low, which limits its rate of downward movement; and (3) even if the clays contained freshwater, the yield would almost certainly be insufficient to warrant the installation of wells.
The presence of fresh ground water beneath the clay units is highly improbable. Extrapolation of potentiometric heads in both the Magothy and the underlying Lloyd aquifers from nearby parts of Suffolk County to Shelter Island indicates that the heads are approximately at sea level (Jensen and Soren, 1974). This evidence, in conjunction with the high chloride concentration (10,000 mg/L) in the Magothy aquifer at well S52050 (fig. 3), indicates that both these aquifers beneath Shelter Island contain saline ground water. Thus, the freshwater supply of Shelter Island is limited to the thin freshwater lens in the upper glacial aquifer between the top of the marine clay unit and the water table.
Depth of Freshwater/Saltwater Interface at Selected Locations
The leading edge of the zone of diffusion can be represented by a plane of equal chloride concentration beyond which chloride levels increase seaward. In this report, a chloride concentration of 40 mg/L is interpreted as the beginning of the freshwater/saltwater boundary. Although this concentration is low compared with the Federal and State drinking-water standard of 250 mg/L, it is greater than background chloride levels in native ground water «10 mg/L) and indicates the mixing of freshwater with seawater (Lusczynski and Swarzenski, 1960).
15
The position of the freshwater/saltwater interface is not fixed; rather, it continuously shifts in response to fluctuations in recharge and ground- water withdrawal. It moves seaward with increased recharge and landward with increased withdrawal. Any attempt to define its location is therefore valid only within a relatively short time span.
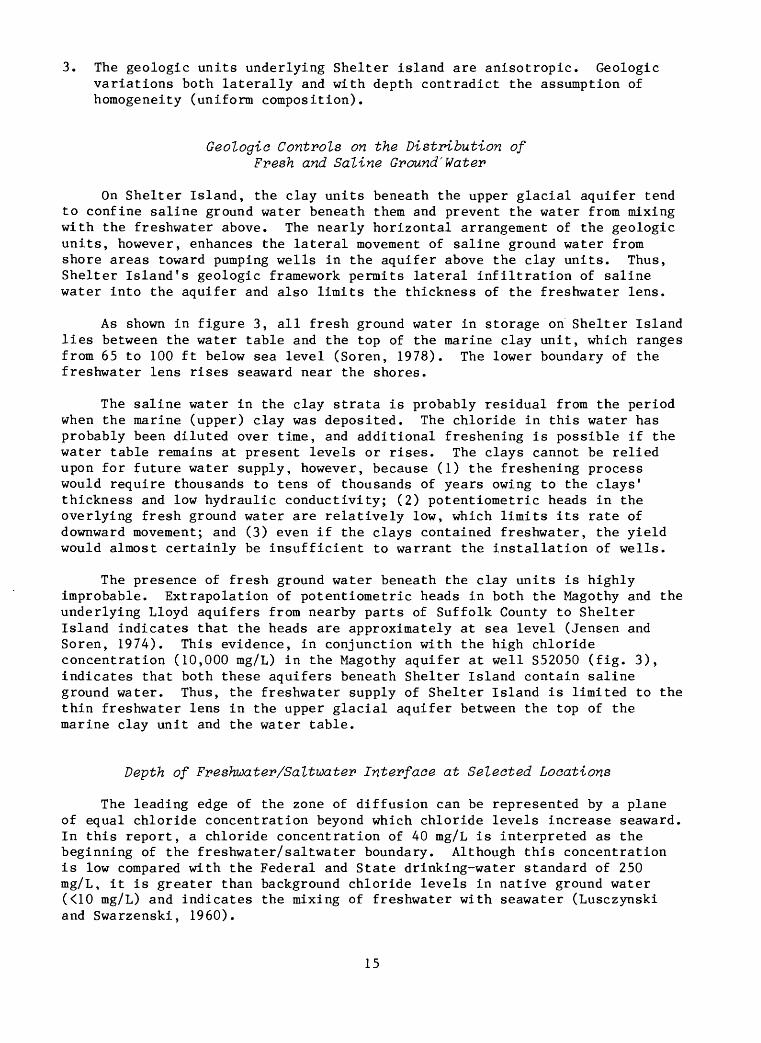
Chloride concentrations in shallow ground water in the 10 new observation wells were measured during well installation and twice subsequently. The concentrations, shown in table 3, illustrate the extreme variability of chloride in water in or near the zone of diffusion and reflect its changing position with time. At nine wells, the chloride concentration was highest during September-October, immediately after the summer period of little recharge and high ground-water use. At seven wells, the chloride concentration was lowest in early spring, a period of high recharge and relatively low ground-water use.
Table 3.--Chloride concentrations in shallow ground water on Shelter Island, 1982-84.
[Well locations are shown in fig. 2; values are in mg/L; a dash indicates
no sample was collected]
Well number
S75432S75433S75434S75435S75436S75437S75438S75439S75440S75441
September - October 1983
15022036
12538
2,400152271520
December 1983
2523216428
310180207.8
18
March - April 1984
221101914 1820201111
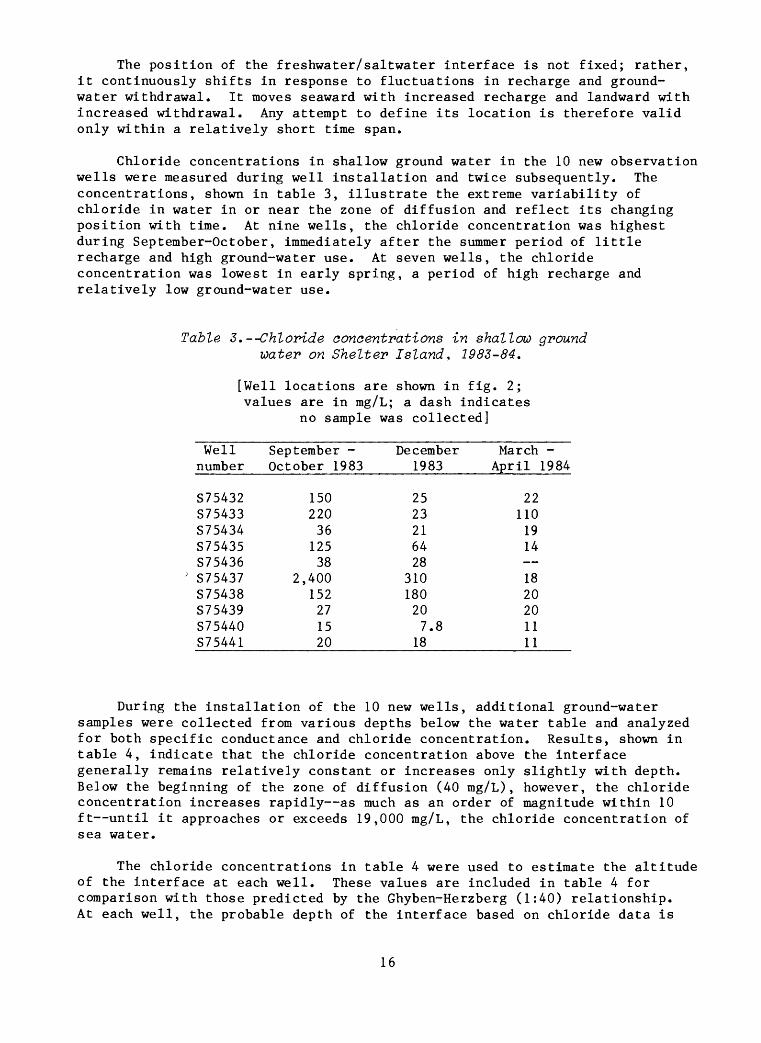
During the installation of the 10 new wells, additional ground-water samples were collected from various depths below the water table and analyzed for both specific conductance and chloride concentration. Results, shown in table 4, indicate that the chloride concentration above the interface generally remains relatively constant or increases only slightly with depth. Below the beginning of the zone of diffusion (40 mg/L), however, the chloride concentration increases rapidly as much as an order of magnitude within 10 ft until it approaches or exceeds 19,000 mg/L, the chloride concentration of sea water.
The chloride concentrations in table 4 were used to estimate the altitude of the interface at each well. These values are included in table 4 for comparison with those predicted by the Ghyben-Herzberg (1:40) relationship. At each well, the probable depth of the interface based on chloride data is
16
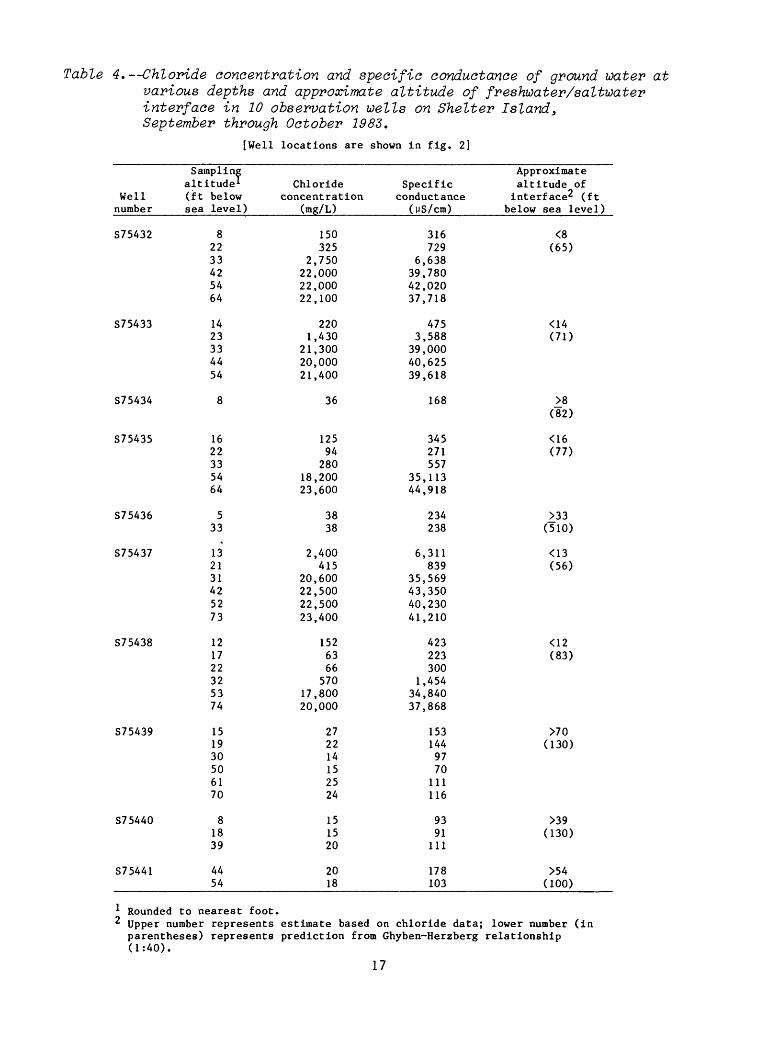
Table 4. Chloride concentration and specific conductance of ground water at various depths and approximate altitude of freshwater/saltwater interface in 10 observation wells on Shelter Island, September through October 1983.
[Well locations are shown in fig. 2]
Well number
S75432
S75433
S75434
S75435
S75436
S75437
S75438
S75439
S75440
S75441
Sampling altitude* (ft below sea level)
82233425464
1423334454
8
1622335464
533
132131425273
121722325374
151930506170
81839
4454
Chloride concentration
(mg/L)
150325
2,75022,00022,00022,100
2201,430
21,30020,00021,400
36
12594
28018,20023,600
3838
2,400415
20,60022,50022,50023,400
1526366
57017,80020,000
272214152524
151520
2018
Specific conductance
(MS/cra)
316729
6,63839,78042,02037,718
4753,588
39,00040,62539,618
168
345271557
35,11344,918
234238
6,311839
35,56943,35040,23041,210
423223300
1,45434,84037,868
1531449770
111116
9391
111
178103
Approximate altitude of interface2 (ft
below sea level)
<8(65)
<14(71)
>8(82)
<16(77)
>33(510)
<13(56)
<12(83)
>70(130)
>39(130)
>54(100)
1 Rounded to nearest foot.2 Upper number represents estimate based on chloride data; lower number (in
parentheses) represents prediction from Ghyben-Herzberg relationship (1:40).
17

significantly less than that predicted by the Ghyben-Herzberg formula, principally because of the geologic controls on the distribution of fresh and saline ground water discussed earlier. These data, in conjunction with the water-table-contour map discussed in the following section (fig. 7, p. 20), show that by the end of the summer, the thickness of the freshwater body (depth of interface plus height of water table) had decreased to less than 20 ft at many of the nearshore wells (S75432, S75433, S75435, S75437, S75438).
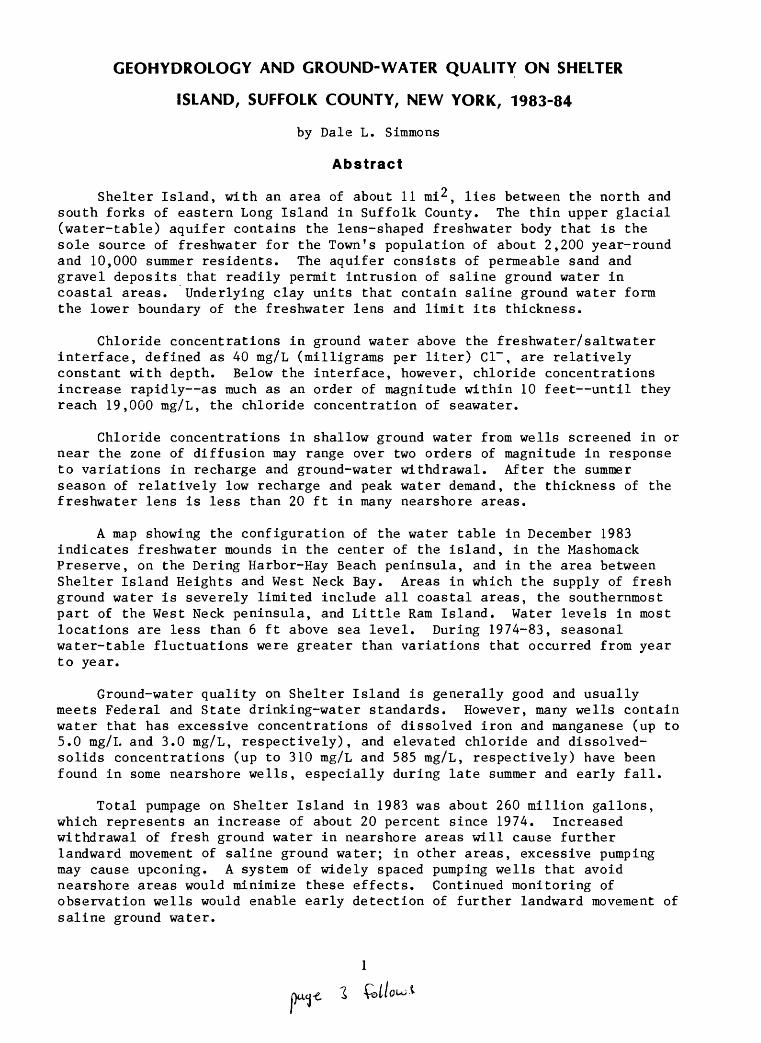
Where chloride analyses are unavailable, concentrations can be roughly estimated from measurements of specific conductance. Figure 6 is a log-log plot that illustrates the approximate straight-line relationship between chloride concentration and specific conductance in the 42 ground-water samples listed in table 4.
Specific conductance is a measure of the ability of a water sample to conduct an electric current. The conductance is due to the presence of dissociated ions in solution. In a simple dilute solution of a single salt (such as NaCl), the relationship between the concentration of dissolved solids and specific conductance is linear. As the concentration increases, the slope of the line steepens. In natural waters, which commonly contain a mixture of salts, the other ions cause aberrations in the relationship (Hem, 1959, p. 38-39).
Because the concentration of dissolved solids other than chloride in ground water on Shelter Island is generally low, and because the island is surrounded by saline ground water, chloride is the major contributor to the water's conductance, especially near the freshwater/saltwater interface. The relationship between chloride concentration and specific conductance therefore tends toward a straight line, although the slope generally increases with increasing chloride concentration. Thus, chloride concentrations on Shelter Island can be roughly estimated from specific conductance values in the graph in figure 6, but only within the range of conductance values shown.
o 100,000o inCM
~" QCUJ LLJO "" - LLJ
<I
J LLJo o z co a!O COt zUJ 2a. LLJ">co
OQCO
10,000
1,000
100
6010 100 1,000 10,000 100,000 CHLORIDE CONCENTRATION, IN MILLIGRAMS PER LITER
Figure 6.
Relationship between specific conductance and chloride concen tration of ground water in observation wells on Shelter Island.
18

Water Table
The configuration of the water table is controlled by (1) the thickness and hydraulic conductivity (water-transmitting properties) of the aquifer and underlying units; (2) the quantity and location of recharge; (3) the location and type of natural discharge points (streams, springs, etc.), and (4) the quantity and location of man-induced discharge (wells). Its altitude on Shelter Island during this study and its fluctuations during the preceding 10-year period are described below.
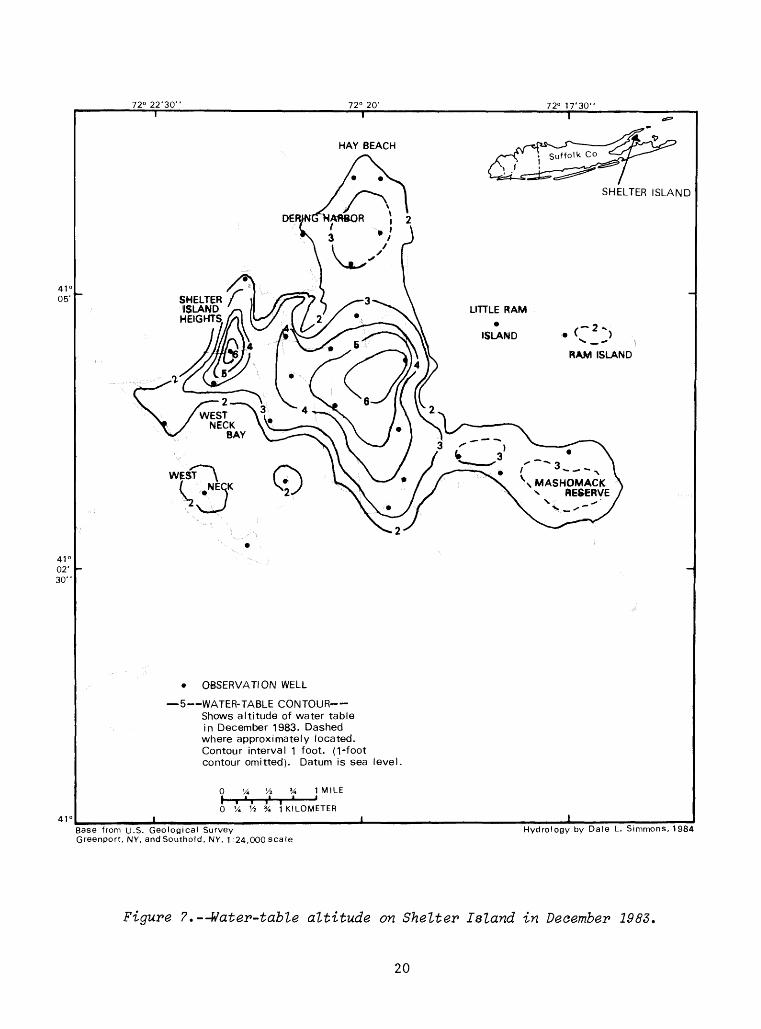
Altitude in December 1983
A contour map of the water table on Shelter Island (fig. 7) was drawn from water levels measured in 26 of the 27 observation wells in December 1983. (Well S51181, which supplies water to the country club, was excluded because it has a submersible pump that cannot be turned off long enough to obtain a static water-level measurement.)
Areas of greatest fresh ground-water availability may be discerned from the water-table map. Several major water-table mounds are evident; the largest of these is centered in the middle of the island. Two other ground- water highs are in the Mashomack Preserve and on the Bering Harbor-Hay Beach peninsula. Smaller freshwater mounds are indicated on the south-shore necks, on Ram Island, and in the western part of the Mashomack Preserve.
An additional mound, between Shelter Island Heights and West Neck Bay, is probably caused by fine-grained (silty and clayey) deposits within the aquifer. These deposits retard the downward movement of water and allow the buildup of a mound. Areas in which fresh ground water is severely limited include all coastal areas, the southernmost part of West Neck, and Little Ram Island.
Fluctuations
The water table, like the freshwater/saltwater interface, fluctuates in response to changes in inflow (recharge) and outflow (evapotranspiration, discharge to streams, and ground-water withdrawal) to and from the ground-water system. Precipitation acts in combination with other climatic variations, mainly increased evaporation during the summer and increased transpiration during the growing season, to produce annual water-table fluctuations that range from a high in early to mid-spring to a low in late fall. On Shelter Island, the effect of increased pumping during the summer is superimposed on these climatic variations.
Water-table fluctuations in two wells on Shelter Island over a 10-year period, and in a third well over a 4-year period, are shown in figure 8 with corresponding monthly precipitation data. The water table generally tends to rise during the early part of the year and declines from the beginning of summer through late fall. Thus, monthly variations in precipitation are a better predictor of water-table fluctuations than climatic generalizations. For example, the water table rose in response to unusually high precipitation in January 1979 and June 1982.
19
72° 22'30"
05'
41° 02' 30"
4V
72° 20'
HAY BEACH
72° 17'30"
I
SHELTER ISLAND
OBSERVATION WELL
5 WATER-TABLE CONTOUR Shows altitude of water table in December 1983. Dashed where approximately located. Contour interval 1 foot. (1-foot contour omitted). Datum is sea level.
V< Vi 3/i 1MILE
0 Vi '/a 3/i 1 KILOMETER
Base from U.S. Geological SurveyGreenport, NY, and Southold, NY, 1:24,000 scale
Hydrology by Dale L. Simmons, 1984
Figure 7. Water-table altitude on Shelter Island in December 1983,
20

The 10-year period illustrated in figure 8 shows no discernible trend in water levels. On Shelter Island, water-table fluctuations within a single year (as much as 4 ft in well S38461 in 1979) are greater than those observed over a period of several years.
1982 1983
Figure 8.--Water-level fluctuations in three water-table wells and monthly precipitation, 1974-83.
CHEMICAL QUALITY OF GROUND WATER
The chemical analysis of a sample from a well in Upton, N.Y. (fig. 1) is shown in table 5. This sample is considered to be representative of ground water in the upper glacial aquifer on Long Island before alteration by human activity. Concentrations of constituents are much less than Federal and State maximum recommended limits for drinking water (listed in appendix A) and indicate the approximate background levels of these constituents. Table 5 shows approximate background concentrations of iron to be 0.01 mg/L; chloride, 5 mg/L; nitrate, 0.1 mg/L; and dissolved solids, 36 mg/L.
The chemical quality of ground water on Shelter Island is generally good suitable for human consumption and most other uses and most samples were well within Federal and State drinking-water standards (appendix A) for the constituents selected for analysis. Exceptions include excessive concentrations of dissolved iron and manganese at many wells and occasionally excessive concentrations of chloride in some nearshore wells.
Selected results of chemical analyses of ground-water samples collected during the study are given in appendix B; a complete list of chemical analyses is given in appendix C.
21

Table 5. Concentration of selected constituents of native ground water in the upper glacial aquifer.
Concentration Constituent_______________(mg/L)
Iron (Fe)Calcium (Ca)Magnesium (Mg)Sodium and Potassium (Na + K)Bicarbonate (HC03 ) Sulfate (S04 ) Chloride (Cl)Nitrate (N03 ) Total dissolved solids
0.011.51.33.84 6 50.1
36
Data from Cohen, Franke, and Foxworthy (1968, p. 50)
Chloride
Chloride concentrations in shallow ground water from the 27 observation wells were generally less than 40 mg/L and ranged from 7.8 mg/L in the Hay Beach and Mashomack areas (wells S51182 and S75440) in December 1983 to 310 mg/L at the southern end of the West Neck peninsula (well S75437) in December 1983. Although the drinking-water standard for chloride (250 mg/L) was exceeded only in the latter sample, three other samples showed elevated concentrations 64 mg/L in Dering Harbor (well S75435) in December 1983, 110 mg/L at Little Ram Island (well S75433) in March 1984, and 180 mg/L near the south end of Menantic Road (well S75438) in December 1983. Concentrations in previous or subsequent samples from these three nearshore wells were near 20 mg/L, which illustrates that chloride concentrations in wells near the zone of diffusion are subject to large and rapid fluctuations in response to such factors as short-term or seasonal increases in pumpage and reduced recharge during periods of below-average precipitation.
Areas of present or potential chloride contamination from seawater intrusion include, in order of increasing severity, the nearshore part of Dering Harbor, Little Ram Island, the peninsula at the south end of Menantic Road, and the extreme south end of the West Neck peninsula.
Although chloride in moderately excessive concentrations is not harmful, it gives a salty taste to foods and beverages. In addition, the sodium usually found in association with chloride may contribute to hypertension and other health problems in some individuals, and to pregnancy-related toxemia (U.S. Environmental Protection Agency, 1976b).
Iron and Manganese
Drinking-water standards are written in terms of total iron and total manganese; however, much of the suspended material included in the analyses for total metals listed in appendix B is derived from particulate matter that results from inadequate development of the observation wells. Consequently,
22

dissolved, rather than total, iron and manganese concentrations are used in this discussion because they are more representative of those in water from sufficiently developed domestic or public-supply wells.
Concentrations of dissolved iron in shallow ground water ranged from the detection limit «0.001 mg/L) to 5 mg/L. Although they were generally less than the recommended limit for iron in drinking water (0.3 mg/L; see appendix A), they exceeded this standard in approximately 20 percent of the samples. Dissolved iron concentrations in the Mashomack area ranged from 0.20 to 0.39 mg/L, indicating that the natural formation water is relatively high in dissolved iron, which is probably derived from iron hydroxide coatings on the sediment grains.
Elevated iron concentrations in water used for domestic or industrial supply are objectionable because they adversely affect the taste of foods and beverages and can stain laundry and build up deposits in plumbing fixtures. For these reasons the iron criterion for drinking water is set at 0.3 mg/L; however, this amount constitutes only a small fraction of the iron normally consumed and is of esthetic rather than toxicological significance (U.S. Environmental Protection Agency, 1976b).
Concentrations of dissolved manganese in ground water ranged from <0.001 mg/L to 3.00 mg/L. Approximately 33 percent of the samples exceeded the recommended limit of 0.05 mg/L. In the relatively undisturbed Mashomack area, dissolved manganese concentrations ranged from 0.01 to 0.22 mg/L.
Manganese is commonly found in association with iron; it causes laundry stains and has an objectionable taste. Although manganese dust can be toxic if inhaled, only extremely large doses of ingested manganese cause disease in humans (U.S. Environmental Protection Agency, 1976b). Therefore, the drinking-water recommendation is based largely on esthetic rather than health considerations.
PH
The pH of water from the observation wells ranged from 5.1 to 7.2, and about 85 percent of the values were less than or equal to 6.0. The pH of seven ground-water samples from the Mashomack Preserve ranged from 5.3 to 6.1, indicating that the natural ground water on Shelter Island is acidic. Water with pH values in this range is sufficiently acidic to corrode pipes and plumbing fixtures and to mobilize some metal ions occurring in sediments or as suspended material. A pH range of 5.0 to 9.0 is acceptable for water serving as a source of public water supply (U.S. Environmental Protection Agency, 1976b).
Dissolved Solids
Concentrations of dissolved solids ranged from 40 to 585 mg/L; more than 95 percent of the samples had values less than 250 mg/L. Only two samples had dissolved solids concentrations greater than 250 mg/L they were 372 mg/L at the south end of Menantic Road (well S75438) and 585 mg/L at the south end of the West Neck peninsula (well S75437). In both samples the dissolved solids were a direct result of proximity to the freshwater/saltwater interface and of the high concentrations of chloride and other ions associated with seawater.
23

The recommended maximum allowable concentration of dissolved solids in drinking water is 500 mg/L (U.S. Public Health Service, 1962). Excessive dissolved solids are objectionable because of possible physiological reactions including laxative effects and other problems related to sodium (as described in the Chloride section), as well as unpalatable mineral tastes and the potential for pipe and fixture corrosion.
Nitrate
Nitrate concentrations (measured as nitrogen) in shallow ground water from the observation wells ranged from <0.1 to 9.1 mg/L. (One sample from well S75436, which had a nitrate concentration of 14 mg/L, was excluded because the well had been vandalized.) All but four analyses showed nitrate concentrations less than 5.0 mg/L. The exceptions are 5.5 and 5.6 mg/L between West Neck Bay and Menantic Road (well S51172), and 8.7 and 9.1 mg/L just south of the school (well S52050). These concentrations are all lower than the recommended drinking-water limit of 10 mg/L (U.S. Environmental Protection Agency, 1976).
Nitrogen concentrations in water from the Mashomack Preserve were all 0.1 mg/L or less, indicating that the amount of nitrate present in natural ground water on Shelter Island is negligible. Nitrate in the ground water of Shelter Island originates mostly from cesspool and septic-tank effluent in developed areas and from fertilizers in farmed and cultivated areas. The highest nitrate concentrations, which were found at well S52050 near the school, are attributed to cesspool effluent.
Excessive nitrate in drinking water can cause methemoglobinemia ("blue- baby disease"), a potentially fatal disease in infants less than 3 months of age. For adults and older children, the U.S. Public Health Service indicates the possibility of a wide latitude in the 10-mg/L limit (Soren, 1978).
SUMMARY AND CONCLUSIONS
Shelter Island, which lies between the north and south forks of eastern Long Island, contains 11 mi^. The thin upper glacial aquifer, which consists mostly of permeable sand and gravel deposits that readily permit infiltration of saline ground water in coastal areas, is the sole source of freshwater for the Town's population (1982) of about 2,200 year-round and 10,000 summer residents. The thickness of the freshwater lens is limited by underlying clay units, which contain saline ground water. Increased development of the island in recent years has led to both greater consumptive water use and increased discharge of sewage to the ground water through private septic tanks and cesspools.
The purpose of this study was to (1) delineate the configuration of the water table; (2) investigate the chemical quality of water in the upper glacial aquifer; and (3) approximate the position of the boundary between fresh and saline ground water at selected nearshore locations.
24

Ten observation wells were installed to supplement the 17 previously existing ones; their locations were chosen to (1) improve the geographic coverage of the island with respect to water-level and water-quality data, (2) obtain information on the chloride concentration of ground water in nearshore areas, and (3) provide permanent facilities for monitoring saltwater movement. In addition, all 27 wells were sampled two or three times during 1983-84 for such constituents as nitrate, dissolved and total iron, dissolved and total manganese, and dissolved solids.
Shelter Island's ground-water system is not in equilibrium. Total annual pumpage increased about 20 percent during 1974-83 to about 260 million gallons, or about 6 percent of total annual recharge. This implies that saline ground water has already moved landward, a conclusion corroborated by the elevated chloride concentrations (up to 310 mg/L) in shallow ground water in some nearshore wells.
Chloride concentrations in ground water above the zone of diffusion (less than 40 mg/L Cl~) remain relatively constant or increase slightly with depth. Below the interface they increase rapidly, as much as an order of magnitude within 10 feet, until they reach 19,000 mg/L, the chloride concentration of seawater.
Chloride concentrations in wells screened in or near the zone of diffusion may range over two orders of magnitude in response to variations in recharge and ground-water withdrawal. After a summer season of relatively low recharge and peak water demand, the thickness of the freshwater body decreases to less than 20 ft in many nearshore areas.
A water-table-contour map prepared from ground-water levels measured in December 1983 shows freshwater mounds in the center of the island, in the Mashomack Preserve, on the Bering Harbor-Hay Beach peninsula, and in the area between Shelter Island Heights and West Neck Bay. Areas in which the supply of freshwater is severely limited include all coastal areas, the southernmost part of West Neck peninsula, and Little Ram Island.
Ground-water levels measured in December 1983 ranged from 1.62 ft above sea level at well S75432 (Ram Island) to 12.77 ft at well S75436 (West Neck Road and Shore Road). The latter water level is unusually high and is attrib uted to ground-water mounding above the silt and clay at this site. Water levels at most locations on Shelter Island are less than 6 ft above sea level.
No long-term trend in water levels was discernible during 1974-83. Seasonal water-table fluctuations are greater than variations that occur over a period of several years.
Ground-water quality on Shelter Island is good and generally meets Federal and State drinking-water standards. Exceptions are excessive concentrations of chloride and dissolved solids in one sample from a nearshore well, and excessive concentrations of iron and manganese in numerous samples. Moderately excessive concentrations of these ground-water constituents may be esthetically objectionable but do not constitute a health hazard.
25
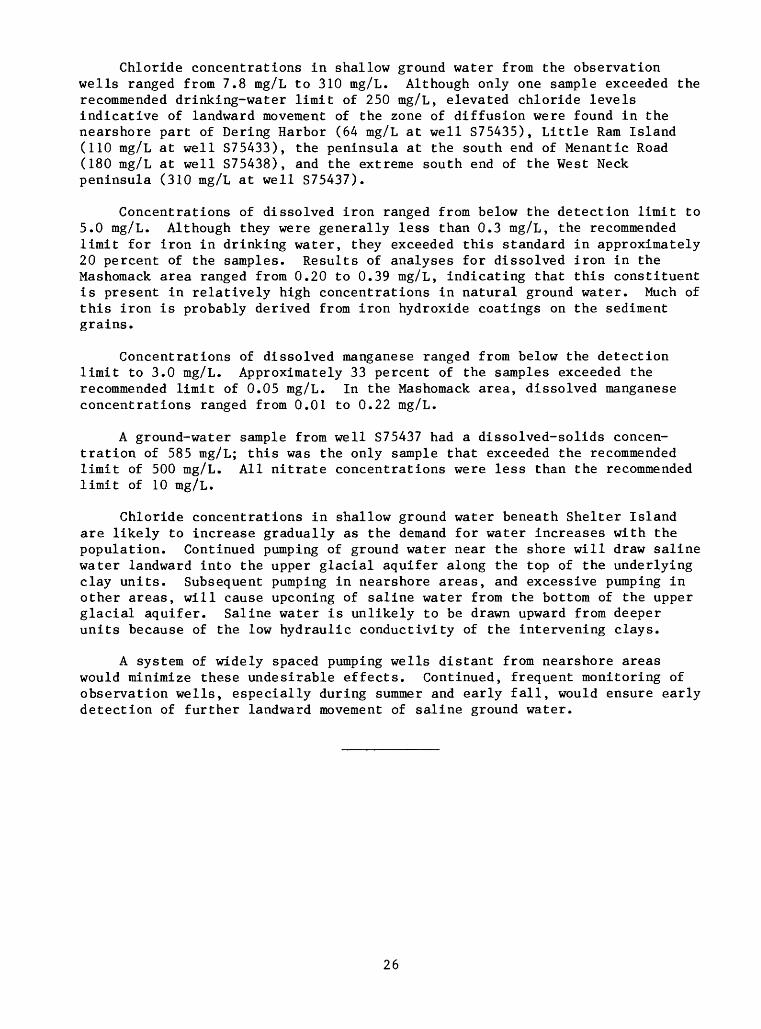
Chloride concentrations in shallow ground water from the observation wells ranged from 7.8 mg/L to 310 mg/L. Although only one sample exceeded the recommended drinking-water limit of 250 mg/L, elevated chloride levels indicative of landward movement of the zone of diffusion were found in the nearshore part of Bering Harbor (64 mg/L at well S75435), Little Ram Island (110 mg/L at well S75433), the peninsula at the south end of Menantic Road (180 mg/L at well S75438), and the extreme south end of the West Neck peninsula (310 mg/L at well S75437).
Concentrations of dissolved iron ranged from below the detection limit to 5.0 mg/L. Although they were generally less than 0.3 mg/L, the recommended limit for iron in drinking water, they exceeded this standard in approximately 20 percent of the samples. Results of analyses for dissolved iron in the Mashomack area ranged from 0.20 to 0.39 mg/L, indicating that this constituent is present in relatively high concentrations in natural ground water. Much of this iron is probably derived from iron hydroxide coatings on the sediment grains.
Concentrations of dissolved manganese ranged from below the detection limit to 3.0 mg/L. Approximately 33 percent of the samples exceeded the recommended limit of 0.05 mg/L. In the Mashomack area, dissolved manganese concentrations ranged from 0.01 to 0.22 mg/L.
A ground-water sample from well S75437 had a dissolved-solids concen tration of 585 mg/L; this was the only sample that exceeded the recommended limit of 500 mg/L. All nitrate concentrations were less than the recommended limit of 10 mg/L.
Chloride concentrations in shallow ground water beneath Shelter Island are likely to increase gradually as the demand for water increases with the population. Continued pumping of ground water near the shore will draw saline water landward into the upper glacial aquifer along the top of the underlying clay units. Subsequent pumping in nearshore areas, and excessive pumping in other areas, will cause upconing of saline water from the bottom of the upper glacial aquifer. Saline water is unlikely to be drawn upward from deeper units because of the low hydraulic conductivity of the intervening clays.
A system of widely spaced pumping wells distant from nearshore areas would minimize these undesirable effects. Continued, frequent monitoring of observation wells, especially during summer and early fall, would ensure early detection of further landward movement of saline ground water.
26
REFERENCES CITED
Cohen, Philip, Franke, 0. L. , and Foxworthy, B. L., 1968, An atlas of Long Island's water resources: New York State Water Resources Commission Bulletin 62, 117 p.
Crandell, H. C. Jr., 1962, Geology and ground-water resources of Plum Island, Suffolk County, New York: U.S. Geological Survey Water-Supply Paper 1539-X, 35 p.
_________ 1963, Geology and ground-water resources of the Town ofSouthoId, Suffolk County, New York: U.S. Geological Survey Water-Supply Paper 1619-GG, 36 p.
Freeze, R. A., and Cherry, J. A., 1979, Groundwater: Englewood Cliffs, N.J., Prentice-Hall, 604 p.
Hem, J. D., 1959, Study and interpretation of the chemical characteristics of natural water: U.S. Geological Survey Water-Supply Paper 1473, 269 p.
Hoffman, J. F., 1961, Hydrology of the shallow ground-water reservoir of the Town of Southold, Suffolk County, Long Island, New York: New York State Water Resources Commission Bulletin GW-45, 49 p.
Jensen, H. M., and Soren, Julian, 1974, Hydrogeology of Suffolk County, Long Island, New York: U.S. Geological Survey Hydrologic Investigation Atlas HA-501, 2 sheets.
Lusczynski, N. J., and Swarzenski, W. V., 1960, Position of the saltwater body in the Magothy(?) Formation in the Cedarhurst-Woodmere area of south western Nassau County, Long Island, New York: Economic Geology, v. 55, p. 1739-1750.
Miller, J. F., and Frederick, R. H., 1969, The precipitation regime of Long Island, New York: U.S. Geological Survey Professional Paper 627-A, 21 p.
Nemickas, Bronius, and Koszalka, E. J., 1982, Geohydrologic appraisal of water resources of the South Fork, Long Island, New York: U.S. Geological Survey Water-Supply Paper 2073, 55 p.
Nemickas, Bronius, Koszalka, E. J., and Vaupel, D. E., 1977, Hydrogeologic data from investigation of water resources of the South Fork, Suffolk County, New York: Suffolk County Water Authority, Long Island Water Resources Bulletin 7, 31 p.
New York State Department of Environmental Conservation, 1977, Proposed ground water classifications, quality standards, and effluent standards and/or limitations Title 6, Official compilation of codes, rules and regulations of the State of New York, part 703, lip.
27

REFERENCES CITED (CONTINUED)
Nieter, William, Nemickas, Bronius, Koszalka, E. J., and Newman, W. S., 1975, The late quaternary geology of the Montauk peninsula Montauk Point to Southampton, Long Island, New York, in New York State Geological Association, 47th annual meeting, Hofstra University, N.Y., Guidebook to Field Excursions: p. 129-156.
Perlmutter, N. M., and DeLuca, F. A., 1963, Availability of fresh groundwater, Montauk Point area, Suffolk County, Long Island, New York: U.S. Geological Survey Water-Supply Paper 1613-B, 39 p.
Prince, K. R., 1985, Ground-water resource assessment of the Montauk area, Long Island, New York: U.S. Geological Survey Water-Resources Investigations 85-4013, 93 p.
Soren, Julian, 1978, Hydrogeologic conditions in the Town of Shelter Island, Suffolk County, Long Island, New York: U.S. Geological Survey Water- Resources Investigations 77-77, 22 p.
U.S. Environmental Protection Agency, 1976a, National Interim Primary Drinking Water Regulations: U.S. Environmental Protection Agency, EPA-570/9-76-003, 159 p.
________ 1976b, Quality criteria for water: U.S. Environmental ProtectionAgency, EPA-440/9-76-023, 501 p.
U.S. Public Health Service, 1962, Public Health Service drinking-water standards, 1962: U.S. Public Health Service Publication 956, 61 p.
28
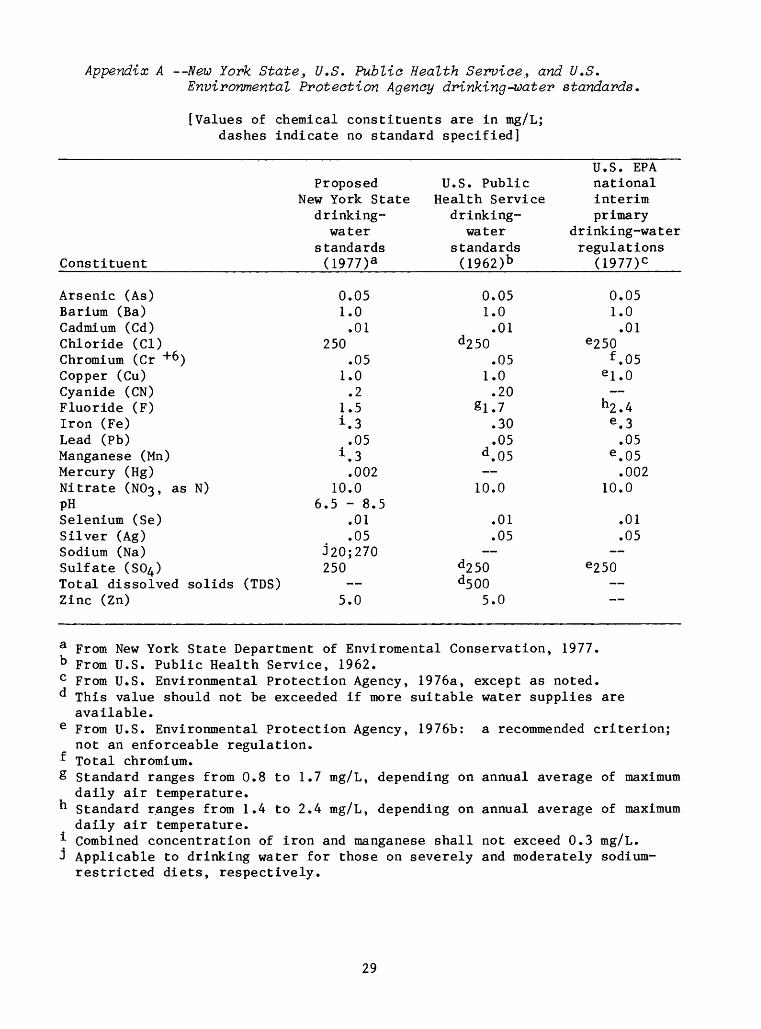
Appendix A New York State, U.S. Public Health Service, and U.S.Environmental Protection Agency drinking-water standards.
[Values of chemical constituents are in mg/L; dashes indicate no standard specified]
Constituent
Arsenic (As)Barium (Ba)Cadmium (Cd)Chloride (Cl)Chromium (Cr +6 )Copper (Cu)Cyanide (CN)Fluoride (F)Iron (Fe)Lead (Pb)Manganese (Mn)Mercury (Hg)Nitrate (N03, asPHSelenium (Se)Silver (Ag)Sodium (Na)Sulfate (804)Total dissolvedZinc (Zn)
a From New York
ProposedNew York State
drinking-water
standards(1977) a
0.051.0.01
250.05
1.0.2
1.5i.3.05
i.3.002
N) 10.06.5 - 8.5
.01
.05J20;270250
solids (TDS)5.0
U.S. PublicHealth Service
drinking-water
standards(1962) b
0.051.0.01
d250.05
1.0.20
§1.7.30.05
d .05 10.0
.01
.05
d250d500
5.0
State Department of Enviromental Conservation,
U.S. EPAnationalinterimprimary
drinking-waterregulations
(1977)°
0.051.0.01
e250f.05
e i.o
h2.4e .3.05
e .05
.00210.0
.01
.05
e250 """"
1977.b From U.S. Public Health Service, 1962.C T?Tr»m TT . Q . F.-ntr-i yr»nmor»f-n1 P-mf-oof- 1 r»n Acronr»\7 1Q7fia ovnfs-nf- ac nr»t"f»r1 -
This value should not be exceeded if more suitable water supplies are available.From U.S. Environmental Protection Agency, 1976b: a recommended criterion; not an enforceable regulation. Total chromium.Standard ranges from 0.8 to 1.7 mg/L, depending on annual average of maximum daily air temperature.Standard ranges from 1.4 to 2.4 mg/L, depending on annual average of maximum daily air temperature.Combined concentration of iron and manganese shall not exceed 0.3 mg/L. Applicable to drinking water for those on severely and moderately sodium- restricted diets, respectively.
29

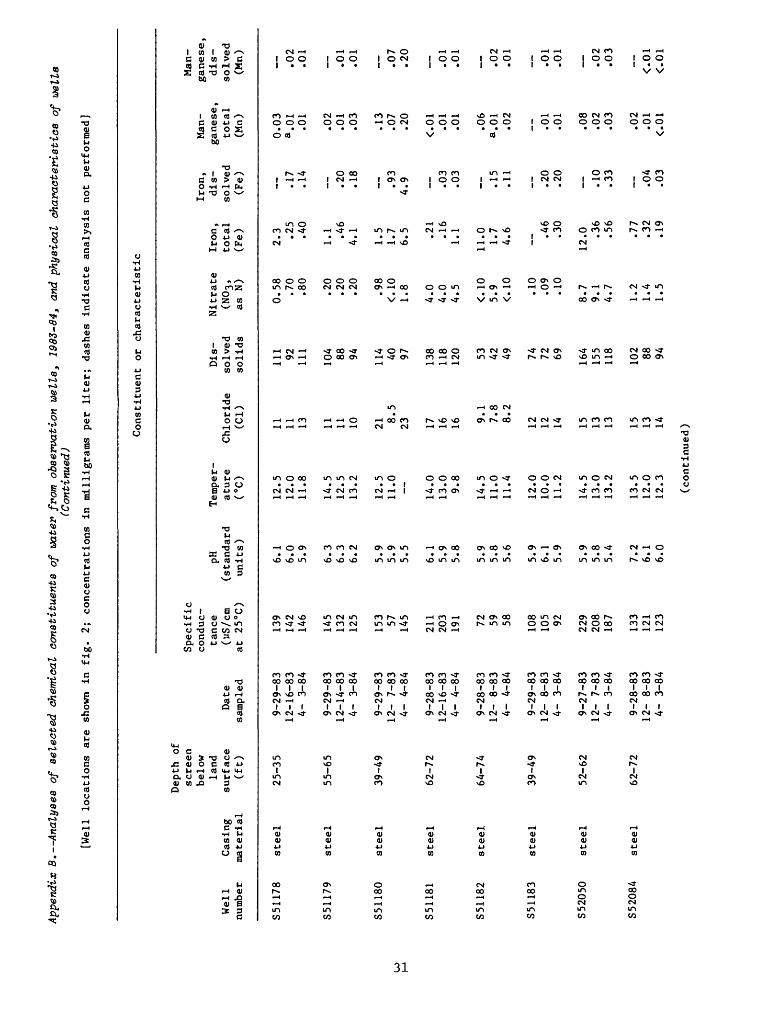
Appe
ndix B. Analyses of s
elected
chem
ical
constituents of w
ater from
observation
wells, 19
82-8
4, and
phys
ical
ch
arac
teri
stic
s of uel
le
[Wel
l lo
cati
ons
are
show
n in
fi
g. 2; concentrations in
mi
llig
rams
per
lite
r; dashes in
dica
te an
alys
is no
t pe
rfor
med]
u> o
Cons
titu
ent
or ch
arac
teri
stic
Well
numb
er
S51169
S511
70
S51171
S511
72
S511
73
S511
74
S511
75
S511
76
S511
77
Casing
mate
rial
stee
l
stee
l
steel
steel
stee
l
steel
stee
l
steel
stee
l
Depth
of
scre
enbelow
land
surface
(ft)
44-54
21-31
43-5
3
25-35
39-49
51-61
48-5
8
47-57
27-37
Date
samp
led
9-28
-83
11-29-83
4- 2-84
9-28
-83
11-2
9-83
4- 2-84
9-28-83
12-
1-83
4- 2-84
9-27-83
12-
1-83
4- 2-84
9-27-83
12-
5-83
4- 4-84
9-27-83
12-
7-83
4- 2-84
9-27-83
12-
5-83
4- 2-84
9-27
-83
12-
7-83
4- 4-84
9-29-83
12-14-83
4- 3-84
Spec
ific
conduc
tance
(US/
cmat 25°C)
131
127
125
129
140
122
208
216
122
326
194
305
137
122
116
168
161
174
161
160
164
156
134
135
108
126
109
pH(standard
unit
s)
5.9
5.9
5.6
5.8
5.8
5.7
5.8
5.7
5.6
5.7
5.4
5.5
6.0
6.0
5,5
5.7
6.0
5.7
5.9
6.0
5.7
5.7
5.8
5.4
5.4
5.5
5.3
Temper
atur
e(°
C)
14.0
11.5
11.5
14.0
14.0
12.0
12.0
11.0
12.0
12.0
12.0
11.8
14.5
13.0
13.4
13.0
12.0
13.0
13.0
11.0
11.5
13.0
10.0
11.9
11.5
12.0
12.3
Chloride
(Cl)
13 12 14 28 28 27 19 19 17 40 37 46 16 15 14 18 19 21 17 16 18 18 15 17 15 23 17
Dis
solved
solids
97 93 88 99 99 86 143
138 79 205
216
195 98 83 81 115
106
120
119
108
108
102 89 90 70 71 80
Nitrate
(N03
,as N)
0.86 .90
1.1 .40
.10
<.10
4.9
4.4
4.6
5.5
5.6
4.3
1.1
1.0
1.0
2.2
2.2
2.8
1.5
1.4
1.8
1.2
1.1
1.5
<.10 .90
<.10
Iron
,total
(Fe) 2.0 .43
.62
.11
1.9
1.2 .50
.34
1.0
1.2 .56
5.5 .80
.95
12.0 .4
8.25
.52
.30
1.0
6.7
21.0
10.0 .5
11.
3a4.8
Iron
,dis
solv
ed(F
e)
.... .14
.13
1.4 .22
.22
.20
.22
.29
.14
.18
.10
.17
.25
.28
1.1 .58
.81
5.0
Man
gane
se,
total
(Mn)
0.03 .02
.02
.02
.10
.04
.03
.04
.02
.01
.01
.02
.02
.01
.03
.03
.02
.02
a. 06
.04
.04
.04
.04
<.01 .03
.05
Man
ganese,
dis
solved
(Mn) _ .02
.01
_ .09
.04
.02
.01
.01
.02
.01
.01
__ .02
.02
.07
.04
_ .04
.04
.03
.05
(continued)
Appe
ndix
B. Analyses of
sel
ecte
d chemical co
nsti
tuen
ts o
f wa
ter from o
bservation w
ells,
1983
-84
, an
d physical characteristics
of w
ells
(Continued)
[Wel
l lo
cati
ons
are
shown
in fig. 2; concentrations in
milligrams per
lite
r; da
shes
in
dica
te analysis no
t pe
rfor
med]
Cons
titu
ent
or ch
arac
teri
stic
Well
numb
er
S511
78
S511
79
S511
80
S511
81
S511
82
S511
83
S520
50
S520
84
Casi
ngmaterial
steel
steel
stee
l
steel
stee
l
stee
l
stee
l
steel
Dept
h of
sc
reen
below
land
surf
ace
(ft)
25-35
55-6
5
39-4
9
62-72
64-7
4
39-49
52-62
62-72
Date
samp
led
9-29
-83
12-1
6-83
4- 3-84
9-29-83
12-1
4-83
4- 3-84
9-29-83
12-
7-83
4- 4-84
9-28-83
12-1
6-83
4- 4-84
9-28
-83
12-
8-83
4- 4-84
9-29-83
12-
8-83
4- 3-84
9-27
-83
12-
7-83
4- 3-84
9-28-83
12-
8-83
4- 3-84
Specific
conduc
tance
(US/
cmat
25°C)
139
142
146
145
132
125
153 57 145
211
203
191 72 59 58 108
105 92 229
208
187
133
121
123
pH(s
tand
ard
unit
s)
6.1
6.0
5.9
6.3
6.3
6.2
5.9
5.9
5.5
6.1
5.9
5.8
5.9
5.8
5.6
5.9
6.1
5.9
5.9
5.8
5.4
7.2
6.1
6.0
Temp
er
atur
e(°C)
12.5
12.0
11.8
14.5
12.5
13.2
12.5
11.0 14.0
13.0 9.8
14.5
11.0
11.4
12.0
10.0
11.2
14.5
13.0
13.2
13.5
12.0
12.3
Chlo
ride
(Cl)
11 11 13 11 11 10 21 8.5
23 17 16 16 9.1
7.8
8.2
12 12 14 15 13 13 15 13 14
Dis
solv
edsolids
111 92 111
104 88 94 114 40 97 138
118
120 53 42 49 74 72 69 164
155
118
102 88 94
Nitr
ate
(N03
,as N)
0.58 .70
.80
.20
.20
.20
.98
<.10
1.8
4.0
4.0
4.5
<.10
5.9
<.10 .10
.09
.10
8.7
9.1
4.7
1.2
1.4
1.5
Iron,
tota
l(Fe) 2.3 .25
.40
1.1 .46
4.1
1.5
1.7
6.5 .21
.16
1.1
11.0 1.7
4.6
.4
6.30
12.0 .3
6.56
.77
.32
.19
Iron,
dis
solv
ed(F
e)
__ .17
.14
.20
.18
.93
4.9 .03
.03
.15
.11
__ .20
.20
__ .10
.33
_ .04
.03
Man
ganese,
total
(Mn)
0.03
a.01
.01
.02
.01
.03
.13
.07
.20
<.01 .01
.01
.06
a. 01
.02
.01
.01
.08
.02
.03
.02
.01
<.01
Man
gane
se,
dis
solved
(Mn)
*_-*
.02
.01
.01
.01
.07
.20
.01
.01
.02
.01
.01
.01
__ .02
.03
_ <.01
<.01
(con
tinu
ed)

Appendix B. Analyses o
f se
lect
ed c
hemical
cons
titu
ents
of water fr
om observation w
ells
, 1983-84, and
physical ch
arac
teri
stic
s of
vei
ls(Continued)
[Well
loca
tion
s are
show
n In
fig. 2;
co
ncen
trat
ions
In
mi
llig
rams
per
lite
r; da
shes
In
dica
te an
alys
is not
performed]
Constituent
or characteristic
Well
Ca
sing
number
material
S75432
PVCb
S 7 54
33
PVC
S754
34
steel
S754
35
PVC
S75436
stee
l
S754
37
PVC
S754
38
PVC
S 75439
PVC
S75440
PVC
S754
41
PVC
Depth
of
scre
en
below
land
surface
(ft)
24-2
9
30-35
60-62
32-37
60-6
2
20-2
5
18-2
3
24-29
51-5
3
31-3
3
Date
sampled
12-1
5-83
3-26
-84
12-1
5-83
3-26
-84
12-15-83
3-26
-84
12-1
4-83
4- 5-84
ci-
4-84
12-15-83
4- 6-84
12-19-83
4- 6-84
12-16-83
4- 6-84
12-1
9-83
4- 5-84
12-19-83
4- 5-84
Spec
ific
co
nduc
ta
nce
(US/
cmat
25°C)
131
128
132
420
175
156
347
161
318
1,410
104
694
148
174
155 83 80 106 79
pH(standard
units)
5.5
5.7
5.6
5.4
5.8
5.8
6.0
6.0
6.6
6.7
5.8
5.5
5.3
5.5
5.1
5.3
5.4,
5.9
5.7
Temper
atur
eCO
13.0
11.5
12.0
10.5
11.5
11.0
12.0
11.9
11.0
13.0
12.2
13.0
11.5
12.0
12.3
10.0
11.2
12.0
10.9
Chlo
ride
(Cl)
25 22 23 110 21 19 64 14 28
310 18 180 20 20 20 7.
811 18 11
Dis
solv
edsoli
ds
75 77 71 229 96 93 177 93 186
585 57 372 87 104 99 52 53 64 54
Nitr
ate
(N03
,as
N)
<0.1
0<
.10
< .1
0<
.10
4.8
2.8
1.4
1.5
14.0 .3
8<
.10
.40
.20
2.0
3.6
< .1
0<
.10
< .1
0<
.10
Iron,
total
(Fe) 0.33 .61
3.3 .21
13.0 2.6 .66
.39
15.0 2.5 .39
.10
.18
.63
.21
9.5
1.6 .69
.56
Iron,
dis
solv
ed(F
e)
<0.01
< .01
.14
.10
.48
.12
< .0
1.03
.08
< .0
1.0
1
.01
.01
.01
.27
.39
.39
.21
Man
ganese,
tota
l(M
n)
0.14 .04
.23
.19
.28
.03
.15
.04
.34
.36
.11
1.7 .35
3.1
»2.8 .6
4a. 08
.15
.05
Man
ga
nese
,di
sso
lved
(Mn)
<0.01
.02
.19
.19
.19
.03
.11
.03
.18
.30
.11
1.5 2.9
3.0 .22
.10
.15
.05
a va
lue
for
total
cons
titu
ent
repo
rted
by
lab
is less than th
at fo
r di
ssol
ved
cons
titu
ent.
" po
lyvi
nyl
chloride
c well ta
mper
ed wi
th;
samp
le co
ntam
inat
ed.
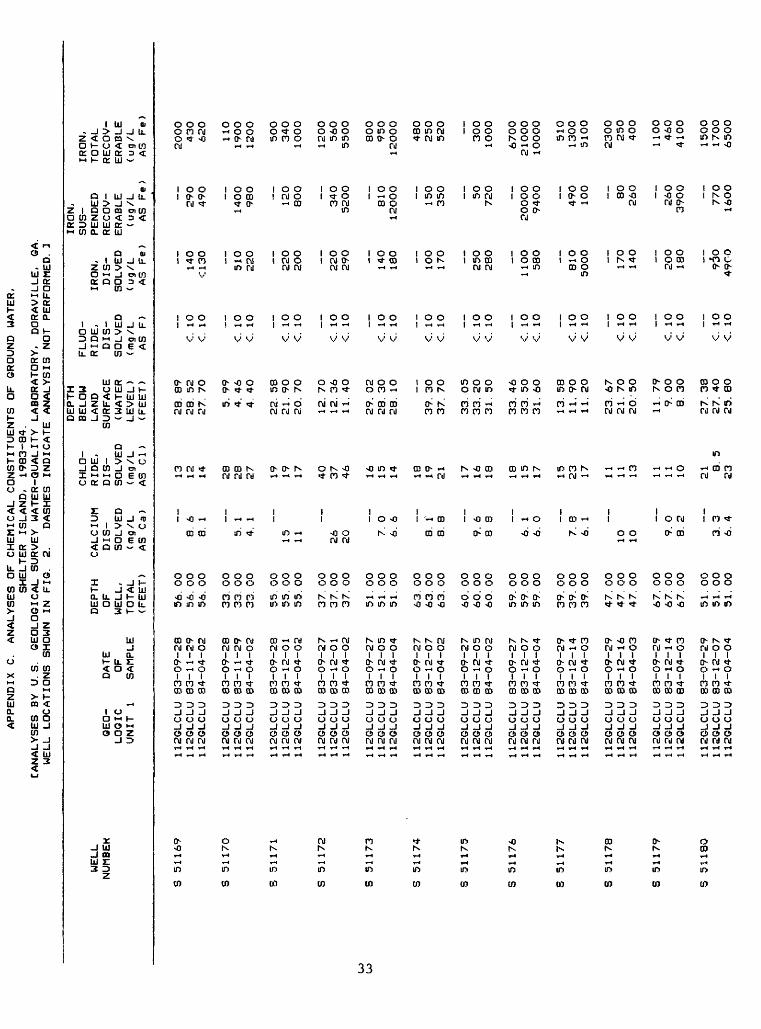
APPENDIX C. ANALYSES OF CHEMICAL CONSTITUENTS OF GROUND WATER,
SHELTER ISLAND,
1983-84.
CANALYSES BY U.
S.
GEOLOGICAL SURVEY WATER-QUALITY LABORATORY, DORAVILLE,
GA.
WELL LOCATIONS SHOWN IN FI
G.
2.
DASHES INDICATE ANALYSIS NOT PERFORMED. 1
WELL
NUMBEK
S S S S
> » s s s s s s s s
51169
51170
51171
51172
51173
51174
51175
51176
51177
51178
51179
51180
GEO
LOGIC
UNIT
1
112GLCLU
112GLCLU
112GLCLU
112GLCLU
112GLCLU
112GLCLU
112GLCLU
112GLCLU
112GLCLU
112GLCLU
112GLCLU
112GLCLU
112GLCLU
112GLCLU
112GLCLU
112GLCLU
112GLCLU
112GLCLU
112GLCLU
112GLCLU
1 12GLCLU
112GLCLU
112GLCLU
112GLCLU
112GLCLU
112GLCLU
112GLCLU
112GLCLU
112GLCLU
112GLCLU
112GLCLU
112GLCLU
112GLCLU
112GLCLU
112GLCLU
112GLCLU
DATE
OF
SAMPLE
83-09-28
83-11-29
84-04-02
83-09-28
83-11-29
84-04-02
83-09-28
83-12-01
84-04-02
83-09-27
83-12-01
84-04-02
83-09-27
83-12-05
84-04-04
83-09-27
83-12-07
84-04-02
83-09-27
83-12-05
84-04-02
83-09-27
83-12-07
84-04-04
83-09-29
83-12-14
84-04-03
83-09-29
83-12-16
84-04-03
83-09-29
83-12-14
84-04-03
83-09-29
83-12-07
84-04-04
DEPTH
OF
WELL,
TOTAL
(FEET)
56. 00
56. 00
56. 00
33. 00
33. 00
33. 00
55. 00
55. 00
55. 00
37. 00
37. 00
37. 00
51. 00
51. 00
51. 00
63. 00
63. 00
63. 00
60. 00
60. 00
60. 00
59. 00
59. 00
59. 00
39. 00
39. 00
39. 00
47. 00
47. 00
47. 00
67. 00
67. 00
67. 00
51. 00
51. 00
51. 00
CALCIUM
DIS
SOLVED
(mg/L
AS Ca)
8. 8. 5. 4.
15
11 2620 7. 6. 8. 8. 9. 8 6. 6. 7. 6.
1010 9. 8. 3. 6.
6 1 1 1 __
__
0 6 __ i 8 6 g
1 0 __
8 1 0 2 _ 3 4
CHLO
RIDE,
DIS
SOLVED
(mg/L
AS Cl )
13 12 14 28
28
27 19 19 17
40
3746 16 1514
1819
21 17
16 18
18 15
17
15 23 17
11 11 13 11 11 10
21 8.
5
23
DEPTH
BELOW
LAND
SURFACE
( WATER
LEVEL)
(FEET)
28. 89
28. 52
27. 70
5. 99
4. 46
4. 40
22. 58
21. 90
20. 70
12. 70
12. 36
11. 40
29. 02
28. 30
28. 10
39. 30
37. 70
33. 05
33. 20
31. 50
33. 46
33. 50
31. 60
13. 58
11. 90
11. 20
23. 67
21. 70
20. 50
11. 79
9. 00
8. 30
27. 38
27. 40
25. 80
FLUO-
RIDE,
DIS
SOLVED
(mg/L
AS F)
<. 10
<. 10
. <.
10
<. 10
C 10
C 10
<. 10
C 10
<. 10
<. 10
C 10
C 10
<. 10
C 10
C 10
C 10
<. 10
<. 10
C
. 10
<. 10
C 10
C 10
C 10
<. 10
IRON,
sus-
IRON,
PENDED
DIS-
RECOV-
SOLVED
ERABLE
(ug/L
(ug/L
AS Fe)
AS Fe)
140
<130
510
220
220
200
220
290
140
180
100
170
250
280
1100
580
810
5000
170
140
200
180
__
9^0
4900
290
490
1400
980
120
800
340
5200
810
12000
150
350
50
720
20000
9400
490
100
80
260
260
3900
__
770
1600
IRON,
TOTAL
RECOV
ERABLE
(ug/L
AS Fe)
2000
430
620
110
1900
1200
500
340
1000
1200
560
5500
800
950
12000
480
250
520
300
1000
6700
21000
10000
510
1300
5100
2300
250
400
1100
460
4100
1500
1700
6500

APPENDIX C.
ANALYSES OF CHEMICAL CONSTITUENTS OF GROUND WATER,
SHELTER ISLAND,
1983-34. CONTINUED.
WED.
NUMBER
S 51169
S 51170
S 51171
5 51172
S 51173
j *»
S 51174
S 51175
S 51176
S 51177
S 51178
S 51179
5 51180
DATE
OF
SAMPLE
83-09-23
83-11-29
84-04-02
83-09-28
83-11-29
84-04-02
83-09-28
83-12-01
84-04-02
83-09-27
83-12-01
84-04-02
83-09-27
83-12-05
84-04-04
83-09-27
83-12-07
84-04-02
83-09-27
83-12-05
84-04-02
83-09-27
83-12-07
84-O4-04
83-09-29
83-12-14
84-04-03
83-09-29
83-12-16
84-04-03
83-09-29
83-12-14
84-04-03
83-09-29
83-12-07
84-04-04
MAGNE
SIUM,
DIS
SOLVED
(mg/L
AS Mg )
5. 2.
2. 5. 4. 5. 4. 2. 2 3. 3. 4 4. 3. 3. 2. 2 4. 4. 5. 5. 1 2
0
8 7 4 5 3 5 7 A 5 3 7 5 4 4 4 5 0 __
4 4 6 1 4 8
rirtNGA-
MANGA-
NE5E,
NESE,
SUS-
DIS-
FENDED
SOLVED
RECOV.
(ug/L
(ug/L
AS Mn )
AS Mn )
20
<1 3 92
38
24 12 7 16 __ 7 9
20 16 71 35
42
42
2846
165
10 6
74
200
0 7 8
2
20 3
3 4
320
0 4
0 5
0 0
2 4
0 5
0
20
__ 0 0
MANGA
NESE,
TOTAL
RECOV
ERABLE
(ug/L
AS Mn) 30
20
20
20
100
40
3040
20 1010
20
20 10
30
30
2020 6040
4040
40
<103050
30 10
10
20 10
30
13070
200
NITRO
GEN,
NITRITE
TOTAL
(mg/L
AS N)
. 040
<. 010
<:. 01
0
C 010
< 010
:. 01
0
'.. 010
<. 010
-'.. 010
. 020
'.. 010
<. 010
. 040
'.. 010
<:. 01
0
C 010
- :. 010
<. 010
. 030
<. O10
<. 010
. 030
<. 010
<. 010
. 030
<. 010
. 010
. 020
<. 010
<:. 01
0
<. 010
<. 010
'.. 010
. 020
<. 010
. 020
NITRO
GEN,
N02+N03
TOTAL
(mg/L
AS N)
1. 4. 4. 4. 5 5. 4. 1. 1. 1. 2 2 2-
1. 1. 1. 1. 1. 1. ,:: ' .. 1. <. 1.
900
900
10 400
100
100
9040
60
50
60
30 10
0000
20
20
00
50
4080
20 10
5O 100
900
100
600
700
800
200
200
200
00 100
80
NITRO-
NITRO-
GEN, AM-
GEN,
MONIA
+
PH
AMMONIA
ORGANIC
LAB
TOTAL
TOTAL
(STAND-
(mg/L
(mg/L
ARD
AS N)
AS N)
UNITS)
<. 010
< 010
<: 010
020
170
<. 010
' 010
. O7O
'".. 010
040
<. 010
--:. 010
--: 010
090
C. 010
. 040
040
<:. 010
<:. 010 100
-:. oto
<: 010
. 100
<. 010
<: 010
. 090
--: 010
'.. 010
. 090
<. 010
030
. 020
<: 010
130
. 180
. 220
. 30
. 20
. 30
. 30
. 40
. 50
. 20
. 40
. 30
. 50
. 40
. 40
. 4O
<. 10
. 60
. 40
C 10
. 20
. 30
C 10
. 50
. 20
-:. 10
. 60
. 30
. 20
. 70
. 20
1. 7 . 20
. 50
. 40
. 30
. 40
C. 10
. 70
5.
5.
5. 5.
5. 5. 5 5. 5. 5 5. ^ 6 5. 5 6. 5. 5 6. 5 5 5. 5. 5. 5 5. 6. 6. 5. 6 6. 6. 3 5 5
9
9
6 8
3 7 3 7 6 7 4 5 0 o 5 ~7 0 7 9 0 7 7 8 4 4 5 3 1 0 9 3 3 2 9 9 5
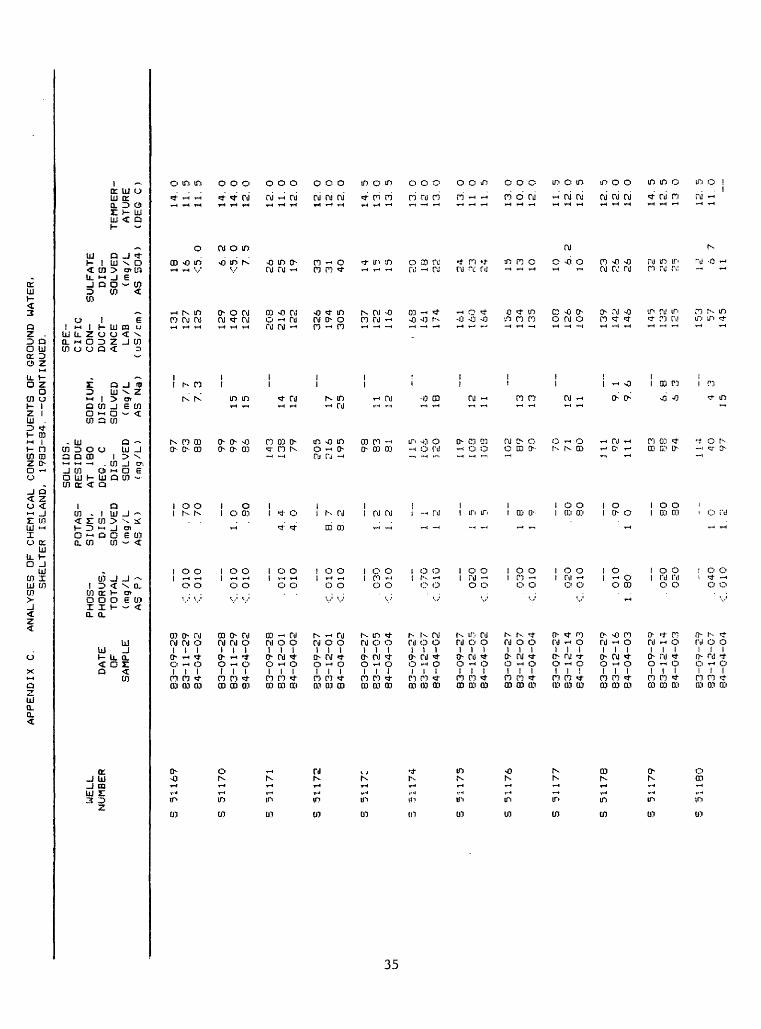
APPENDIX C.
ANALYSES OF CHEMICAL CONSTITUENTS OF GROUND WATER,
SHELTER ISLAND, 1983-84. CONTINUED.
UfELL
NUMBER
c g C S S
i i
5 S S S S S s
51169
51170
51171
51172
5117C
51174
51175
51176
5 1
1 77
51178
51179
51180
DATE
OF
SAMPLE
83-09-28
83-11-29
84-04-02
83-09-28
83-11-29
84-04-02
83-09-28
83-12-01
84-04-02
83-09-27
83-12-01
84-04-02
83-09-27
83-12-05
84-04-04
83-09-27
83-12-07
84-04-02
83-09-27
83-12-05
84-04-02
83-09-27
83-12-07
84-04-04
83-09-29
83-12-14
84-04-03
83-09-29
83-12-16
84-04-03
83-09-2^
83-12-14
84-04-03
83-09-29
83-12-07
84-04-04
PHOS
PHORUS,
TOTAL
(mg/L
AS P>
C 010
<:. 010
<. 010
<. 01
0
. 0 1 0
. 010
-:.
010
C 010
. 030
C 010
. 070
C 010
020
<. 010
. 030
C 010
020
C 010
.010
1. SO
. 020
020 __
. 040
<:. 01
0
POTAS
SIUM,
DIS
SOLVED
(mg/
AS K 1. 4 4. 8. 8. 1. 1. 1 i 1
.i 1. J 1 1 1.
L 7070
0 SO
4 o ~r 2
2 2 _._
1 2 __
n; 5 8 9 _-_
8O
80
__
90
0 __
80SO o 2
SOLIDS,
RESIDUE
AT 180
DEC.
CDIS
SOLVED
(mg/L) 979388
99
99
86
143
138
79
205
216
195
9883
81
.! 15
106
J20
1 19
108
1 08
102
8990
70
71 80
1 11 72
111
83
RP
94
i i-
11097
SODIUM,
DIS
SOLVED
(mg/L
AS Na)
7. 7
7 3
1515
1412
17 25
11 12
1618
12
1 1
1313
12 1
1
_._
9.
19.
6 6.
86
3 4
°1 5
SPE
CIFIC
CON
DUCT
ANCE
LAB
(uS/cm)
131
127
125
129
140
J Tl
208
216
122
326
194
305
137
122
116
168
161
174
161
160
164
15o
134
135
100
126
109
139
142
146
14 '5
132
125
15357
145
SULFATE
DIS
SOLVED
(mg/L
AS S04)
18 16
<5. 0
6. 2
<5. 0
7. 5
2625 19 33
31 40 14 15 15 20 18 22
2423
24 15 13 10
10 6.
210 232626
322525
i 2 6 7
1 1
TEMPER
ATURE
(DEC C
14.
11.
11.
14.
14.
12.
12.
11.
12.
12.
12.
12.
14.
13.
13.
13.
12 13.
13.
11 11.
13.
10.
12.
11.
12.
12.
12.
12.
12.
14.
12.
13 12.
11.
- > 0 5 5 0 0 0 0 0 0 O 0 0 5 0 5 0 0 0 0 0 5 0 0 0 5 0 5 5 0 0 5 5 0 5 0 .._

APPENDIX C.
ANALYSES OF CHEMICAL CONSTITUENTS OF GROUND WATER,
SHELTER ISLAND, 1983-84. CONTINUED.
WELL
NUMBER
S 51181
S 51182
S 51183
S 52050
S 52084
U> ON
S 75432
S 75433
S 75434
S 75435
5 75436
S 75437
S 75433
S 7543?
3 75440
GEO
LOGIC
UNIT
112GLCLU
112GLCLU
112GLCLU
112GLCLU
112GLCLU
112GLCLU
112GLCLU
1 12GLCLU
1 12GLCLU
112GLCLU
112GLCLU
112GLCLU
112GLCLU
1 12GLCLU
112GLCLU
1 12GLCLU
112GLCLU
I12GLCLU
112GLCLU
112GLCLU
112GLCLU
112GLCLU
112GLCLU
112GLCLU
112GLCLU
112GLCLU
112GLCLU
112GLCLU
112GLCLU
112GLCLU
1 12GLCLU
112GLCLU
U2GLCLU
112GLCLU
DATE
OF
SAMPLE
83-09-28
83-12-16
83-12-21
84-04-04
83-09-20
83-12-08
84-04-04
83-09-29
83-12-O8
84-04-03
83-O9-27
83-12-07
84-04-03
83-09-28
83-12-03
34-04-03
83 1 -
1 1 "
>84-03-26
83-12-15
84-03-26
83-12-15
84-03-26
83-12-1*
84-O4-O5
84-01-04
83-12-15
84-04-06
83-12-19
84-04-06
53-12-16
84-O4-06
63-12-1=?
S3- 12- 21
84-04-05
DEPTH
CALCIUM
OF
DIS-
WELL,
SOLVED
TOTAL
(mg/L
(FEET)
AS Ca)
74.
74.
74.
74.
76.
76.
76.
51.
51 51.
64
64.
64.
7474
7*1
2?
29.
35.
35
62.
62.
37.
37.
62
2525
23.
23
2929 5353
53.
00
00
00
00
000000
000000
000000 oo 00
00 oo 00
00 oo 00CO
0000
00
0000
0000
0000
00 oo 00
14
13 2. 2. 5. 5.
12
1 3 8. 9 3 o 9. S. 7. 6.
12
19 9 i
18 1O 9 "3 -
T 0 9 1 __
5 1 O*^
c; 0 3 5 o 6 2 1 --
3 i -
CHLO
RIDE,
DIS
SOLVED
(mg/L
AS Cl )
17
16
16 9.
17. 8
8. 2
12 12 14
151313
15 13
14
2522
23
110
21 19
64 14 28
310 18
180
20
2020 7 S
11
DEPTH
BELOW
LAND
SURFACE
(WATER
LEVEL)
(FEET)
51.
33
49.
31.
30.
29.
37.
37.
35.
24.
T!3
22 13.
19.
19.
19.
51.
52 19.
19
44 10.
1O. 9. 8. 10. 9.
42
43.
42.
14
2070
08 50 10 858070
039O
40
SO
20
OO
80
9000
40OO
70
70
40
0040
6090
9000
20
FLUO-
RIDE,
DIS
SOLVED
(mg/L
AS F)
<. 10
C 10 _._
<:. 1
0C 10
<. 10
<.. 10
C 10
C 10
::.
10'.
10
:. 10
'.. 10
<:. 1
0C 10
c 1
0 c
10
'... 10
:. 1
0
:. 1
0
. 30
. 10
<:. 1
0<.
10
-.:. 1
0<
10
C 10
__<:.
10
IRON
, DIS
SOLVED
(ug/L
AS Fe) 28
30
150
110
200
200
_-98
330 44
26 ."3 6
1*0
^8
430
120
. D
30
78 7 7
12 -- 12 6
P70
'J90
IRON,
SUS
PENDED
RECOV
ERABLE
(ug/L
AS Fe)
130
80
1600
4500
260
100
__
260
230
280
160
600
3200
1 10
13000
2500 __
360
15000
2500
380
90--
62O
200
9200
1200
IRON,
TOTAL
RECOV
ERABLE
(ug/L
AS Fe)
210
160
110
11000
1700
4600
460
300
12000
360
560
770
32O
[= 0
330
6 1 0
3300
^10
1 3000
2600
6oO
39Q
1 5000
2500
3^0
100
180
630
?10
950O
1600

APPENDIX C.
ANALYSES OF CHEMICAL CONSTITUENTS OF GROUND WATER,
SHELTER ISLAND, 1983-84. CONTINUED.
WELL
NUMBER
S S S S
I S S S S S 3 S S S S
51181
51182
51183
52050
52034
75432
75433
75434
75435
75436
75437
75438
75439
75440
DATE
OF
SAMPLE
83-09-28
83-12-16
83-12-21
84-04-04
83-09-28
83-12-08
84-04-04
83-09-29
83-12-08
84-04-03
83-09-27
83-12-07
84-04-03
83-09-28
83-12-08
84-04-03
83-12-15
84-03-26
83-12-15
84-03-26
83-12-15
84-03-26
83-12-14
84-04-05
84-01-04
83-12-15
84-04-06
83-12-19
84-04-06
83-12-16
84-04-06
83-12-19
83-12-21
84-04-05
MAGNE
SIUM,
DIS
SOLVED
(mg/L
AS Mg )
6. 3
5. 9
n
"?
2. 0 __
2. 9
2. 5
3. 6
4.
1 __
3 9
4.
1
. 07
2 9
2. 8
13
5. 4
5. 0
5. 9
* 7
7. 0
15 3 3
11
5. 8
5. 5
1. 9
2. 2
MANGA
NESE,
DIS
SOLVED
(ug/L
AS Mn) 12 9
19 13 7 6
22
30
4 3
,:1
19
190
190
190
26
110
W 1
180
300
110
1500
2900
3000
220 97
MANGA
NESE,
SUS
PENDED
RECOV.
(ug/L
AS Mn) 0
1
0 7
3 4
__ 0 0
__ 6 20
40 0
90 4
40 7
160
60 0
200
200 0
420 O
MANGA
NESE,
TOTAL
RECOV
ERABLE
(ug/L
AS Mn )
< 1 0
10 10
60 10 20
_._
10 10
80
2030
20 10
< 1 0
140
40
?30
190
2SO
30
150
40
340
360
110
1700
350
3100
2000
640 80
NITRO
GEN,
NITRITE
TOTAL
(mg/L
AS N)
. 050
'. 010
c. 010
. 030
<. 040
C 010
C 010
. 010
<:. 010
C 010
. 010
C. 010
. 040
:. 010
C. 010
C 010
<. 010
<. 010
.:. 01
0
. O40
C 010
02O
'. 010
. 040
. 020
<. 010
<. 010
<. 010
-'.. 010
-'.. 010
-::. 010
. 010
NITRO
GEN,
N02-1-N03
TOTAL
(mg/L
AS N)
4. 4. 4
< 5 .
< 8. 9. 4 1. 1. 1. .:;.
<- < A 2-
1. 1
1«. < -> o ,' <*.
0000 50 100
''O
100
100
100
100
70 10 70
2040 50 100
100
100
100
8O00
4050
0 4OO
100
400
200
0060 100
100
NITRO-
NITRO-
GEN, AM-
GEN,
MONIA
<- PH
AMMONIA
ORGANIC
LAB
TOTAL
TOTAL
(STAND-
(mg/L
(mg/L
ARD
AS N)
AS N)
UNITS)
'. 010
1 40
< 010
-:. 010
300
< 010
'. 010
190
C 010
. 050
. 060
< 010
020
. 050
-: 010
oeo
< 010
060
C60
300
< 010
030
< 010
. 220
. 070
C 010
. 020
< 010
. 030
-: 01
0
080
<. 010
. 40
2. 5 --
. 30
. 10
<1. 0
. 40
. 80
C 10
. 50
. 40
<. 10
. 50
. 20
C 10
<:. 1
0
. 20
<:. 1
0
. 10
C 10
. 50
C 10
<:. 1
0. 60
. 30
. 10
. 50
. so
. 50
1. 4
. 80
. 80
. 50
6. 5.-
5. 5. 5. 5. 5. 6. 5. 5. 5. 5. 7. 6. 6. 5. 5. 5. 5. 5. 5. 6. 6. 6. 6. 5. 5. 5. 5. 5. 5. 5.
1 9 - 8 9 8 6 9 1 9 9 8 4 2 1 0 5 7 6 4 8 8 0 0 6 7 8 5 3 5 1 3 4
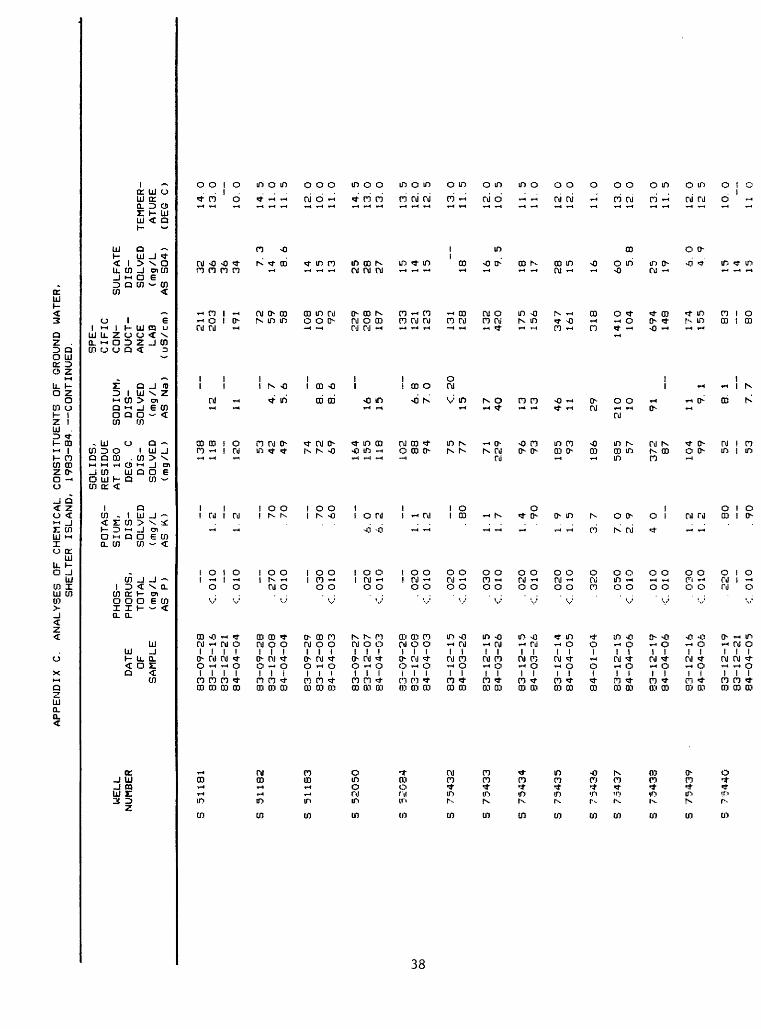
APPENDIX C.
ANALYSES OF CHEMICAL CONSTITUENTS OF GROUND WATER,
SHELTER ISLAND,
1983-84. CONTINUED.
WELL
NUMBER
S 51181
S 31182
S 51183
S 52050
5 55084
IjO
00
S 75432
S 75433
S 75434
S 75435
S 75436
S 75437
S 75433
S 75439
S 75440
DATE
OF
SAMPLE
83-09-28
33-12-16
83-12-21
84-04-04
83-09-28
33-12-08
84-04-04
83-09-29
33-12-08
34-04-03
83-09-27
83-12-07
84-04-03
33-09-28
33-12-08
84-04-03
83-12-15
34-03-26
83-12-15
84-03-26
83-12-15
84-03-26
33-12-14
84-04-05
84-01-04
83-12-15
84-04-06
83-12-19
84-04-06
83-12-16
84-04-06
33-12-19
83-12-21
84-04-05
PHOS
PHORUS,
TOTAL
(mg/L
AS P)
C. 010
<. 010
. 270
C 010
. 030
<:. 010
. 020
C 010
. 020
C 010
. 020
<. 010
. 030
<. 010
. 020
<. 010
. 020
C 010
. 320
. 050
C 010
. 010
C 010
. 030
C 010
. 220
__
<. 010
SOLIDS,
POTAS-
RESIDUE
SIUM,
AT 180
DIS-
DEG.
C
SOLVED
DIS-
(mg/L
SOLVED
AS K)
(mg/L)
1. 1. 6. 6. 1. 1. 1. 1. 1. 1. 1. 3. 7. 2. 4 1. 1.
~> 2 7070
70
60
__
0 2 1 2 80 1 7 4 90
9 5 7 0 9 0 2 > 80 90
138
118 120
53
4249
7472
69
164
155
118
102
8894
75
77
71
229
9693
18593
186
585 57
37287
10499 52 53
SPE
CIFIC
SODIUM,
CON-
SULFATE
DIS-
DUCT-
DIS
SOLVED
ANCE
SOLVED
TEMPER-
(utg
/L
LAB
(utg
/L
ATURE
AS Na)
(uS/
cut)
AS S04)
(DEG C)
12
11
4. 5. 8. 8. 16
15 6. 7. <.15
17 40 13
13
46 11 29
210 10
91 119. 8. 7.
7 6 8 6 8 0 20
1 1 7
211
203
191
7259
58
108
105
92
229
208
187
133
121
123
131
128
132
420
175
156
347
161
318
1410
104
694
148
174
155
83 80
3236
3634 7.
314 8.
6
14 15 13 25
2827 15 14 15
18 169.
5
18 17 28 15 16 60 5.
8
25 19 6.
04. 9
15 14 15
14.
13. -
10.
14.
11.
11 12.
10.
11.
14.
13.
13.
13.
12.
12.
13.
11.
12.
10.
11.
11.
12.
12.
11.
13.
12 13.
11.
12.
12
10. -
11
0 0 - 0 5 0 5 0 0 0 5 0 0 5 0 5 0 5 0 5 5 0 0 0 0 0 0 0 5 0 5 0 - 0

APPENDIX C.
ANALYSES OF CHEMICAL CONSTITUENTS OF GROUND WATER,
SHELTER ISLAND,
1983-84. CONTINUED.
WELL
NUMBER
GEO-
DATE
LOGIC
OF
UNIT
SAMPLE
S 75441
112GLCLU 83-12-19
112GLCLU 84-04-05
MAGNE-
WELL
SIUM,
NUMBER
DATE
DIS-
OF
SOLVED
SAMPLE
(mg/L
AS Mg )
a 75441
83-12-19
2. 3
84-04-05
1. 8
WELL
NUMBER
DATE
OF
SAMPLE
S 75441
83-12-19
84-04-05
DEPTH
OF
WELL,
TOTAL
(FEET)
33. 00
33. 00
MANGA
NESE,
DIS
SOLVED
(ug/L
AS Mn)
15047
PHOS
PHORUS,
TOTAL
(mg/L
AS P)
. 020
C 010
CALCIUM
DIS
SOLVED
(mg/L
AS Ca)
4. 3
3. 0
MANGA
NESE,
SUS
PENDED
RECOV.
(ug/L
AS Mn) 0 3
POTAS
SIUM,
DIS
SOLVED
(mg/L
AS K) 1. 5
1. 4
CHLO
RIDE,
DIS
SOLVED
(mg/L
AS Cl )
18
11
MANGA
NESE,
TOTAL
RECOV
ERABLE
(ug/L
AS Mn)
15050
SOLIDS,
RESIDUE
AT 180
DEG.
C DIS
SOLVED
(mg/L) 64 54
DEPTH
BELOW
LAND
SURFACE
(WATER
LEVEL)
(FEET)
18. 80
16. 40
NITRO
GEN,
NITRITE
TOTAL
(mg/L
AS N)
<. 010
<. 010
GODIUM,
DIS
SOLVED
(mg/L
AS Na)
118. 3
FLUO-
RIDE,
DIS
SOLVED
(mg/L
AS F)
C 10
C 10
NITRO
GEN,
N02+N03
TOTAL
(mg/L
AS N)
<. 100
<. 100
SPE
CIFIC
CON
DUCT
ANCE
LAB
(uS/cm)
106
79
IRON,
DIS
SOLVED
(ug/L
AS Fe)
390
210
NITRO
GEN,
AMMONIA
TOTAL
(mg/L
AS N;
. 070
<:. 01
0
SULFATE
DIS
SOLVED
(mg/L
AS S04)
12 12
IRON,
SUS-
IRON
,PENDED
TOTAL
RECOV-
RECOV
ERABLE
ERABLE
(ug/L
(ug/L
AS Fe)
AS Fe)
200
690
350
560
NITRO
GEN, AM
MONIA +
FH
ORGANIC
LAii
TOTAL
( STAND -
(mg/L
ARD
AS N:
UN I T3
/
.20
"? 9
11
3. 7
TEMPER
ATURE
(DFG C)
12. 0
11. 0
.IGLCL'J =
UPPER GLACIAL AQUIFER