gas turbine efficiency and ramp rate improvement through
TRANSCRIPT

Original Article
Gas turbine efficiency and ramprate improvement throughcompressed air injection
Kamal Abudu1, Uyioghosa Igie1 , Orlando Minervino2 andRichard Hamilton2
Abstract
With the transition to more use of renewable forms of energy in Europe, grid instability that is linked to the intermit-
tency in power generation is a concern, and thus, the fast response of on-demand power systems like gas turbines has
become more important. This study focuses on the injection of compressed air to facilitate the improvement in the
ramp-up rate of a heavy-duty gas turbine. The steady-state analysis of compressed airflow injection at part-load and full
load indicates power augmentation of up to 25%, without infringing on the surge margin. The surge margin is also seen to
be more limiting at part-load with maximum closing of the variable inlet guide vane than at high load with a maximum
opening. Nevertheless, the percentage increase in the thermal efficiency of the former is slightly greater for the same
amount of airflow injection. Part-load operations above 75% of power show higher thermal efficiencies with airflow
injection when compared with other load variation approaches. The quasi-dynamic simulations performed using constant
mass flow method show that the heavy-duty gas turbine ramp-up rate can be improved by 10% on average, for every 2%
of compressor outlet airflow injected during ramp-up irrespective of the starting load. It also shows that the limitation of
the ramp-up rate improvement is dominated by the rear stages and at lower variable inlet guide vane openings. The
turbine entry temperature is found to be another restrictive factor at a high injection rate of up to 10%. However, the 2%
injection rate is shown to be the safest, also offering considerable performance enhancements. It was also found that the
ramp-up rate with air injection from the minimum environmental load to full load amounted to lower total fuel con-
sumption than the design case.
Keywords
Flexibility, gas turbine, ramp rate, power augmentation
Date received: 5 January 2020; accepted: 13 May 2020
Introduction
The increased renewable energy subscription andlegislation on emissions is changing the role of con-ventional forms of power generation, such as gas andcoal-fired plants. However, to maintain a stable gridin the developing energy mix, these fossil-fuelled com-bustion engines need to ramp-up to high power, tomake up for the shortfall of renewable forms ofenergy (that are typically intermittent), in a shorttime. The rate of response of a gas turbine (GT)also called its ramp-up rate is an important perform-ance indicator of operational flexibility, as well as aselling point for original equipment manufacturers(OEMs). GT ramp rates are primarily limited by therate of change of turbine entry temperature (TET),due to the thermo-mechanical stresses that determineengine life.
The ramping requirements of a geographical regionare set by grid codes; these documents specify theminimum required ramp rates for its generators toensure a resilient grid. With more renewable powerutilization, it is expected that these grid codesbecome more stringent, allowing only the mostresponsive of conventional plants to operate. TheUK grid code (regarded as the most stringent inEurope) requires that engines can provide 10% ofthe rated capacity in 10 s, following a 0.5Hz drop in
1School of Aerospace, Transport and Manufacturing, Cranfield
University, Cranfield, UK2Mitsubishi Hitachi Power Systems Europe, London, UK
Corresponding author:
Uyioghosa Igie, Cranfield University, College Road, Cranfield,
Bedfordshire MK43 0AL, UK.
Email: [email protected]
Proc IMechE Part A:
J Power and Energy
2021, Vol. 235(4) 866–884
! IMechE 2020
Article reuse guidelines:
sagepub.com/journals-permissions
DOI: 10.1177/0957650920932083
journals.sagepub.com/home/pia

frequency. This is in addition to the capability of gen-erating full power output (PO) for a minimum of5min during a 0.5Hz frequency drop.1 These require-ments have caused OEMs and plant operators toexplore technologies for improving ramp rates andpeaking capabilities. Based on Table 1, the averageramp rate of an F-class heavy-duty GT is about25MW/min that corresponds to 10%/min of ratedcapacity. This is expected to increase to a minimumof 38MW/min, to accommodate renewable energygeneration, noted in Gonzalez-Salazar et al.8
Balling9 study is based on Siemens technology; thearticle explains the Fast Cycling concept that enablesfaster combined cycle gas turbines (CCGTs) start-up,by combining GT and ST ramping using their Starton the Fly technology. The study suggests that theycan satisfy the frequency requirements of the UK gridcode by fast variation of the variable inlet guide vanes(VIGVs) and an optimized fuel control system thatensures power ramp-up without adverse impacts oncombustion. A combination of software and hard-ware has been considered by General Electric (GE)as shown in GE Power.10 The upgrade includes anadvanced gas path installation, which involves betterturbine blade design and materials to improve aero-dynamic efficiency, durability, and firing tempera-tures; a DLN2.6þ combustor system; and OPFlexSuite consisting of fast start, fast ramp, and turndowncontrol modules.10,11 The critical improvements whichenable the faster ramp-up are the improved turbinefiring temperature and controls.12
Other methods of improving the flexibility of a GTwith respect to power ramp-up have involved add-itional system integration. The GE LM6000 HybridEGTTM (electric GT) combines the benefits of a bat-tery storage system and the fast ramping up capabilityof this engine that is related to its aero-derivativemulti-spool design. The technology features a10MW battery storage system which enables immedi-ate power response and high-fidelity frequencyresponse.13 Perri14 indicates that an improvementof 5MW/min at International Organization forStandardization (ISO) conditions can be achievedfor heavy-duty GT with compressed airflow injection
from add-on multi-stage intercooled centrifugal com-pressor modules powered by natural gas.
With regards to compressed air injection technol-ogy, a few studies have explored this for GT poweraugmentation and ramp rate improvements. Salvini15
investigated a recuperated GT, considering two con-figurations: compressed air energy storage (CAES)air injection and CAES air injection with expanders.The latter approach proved better as a result of pre-heating of the injected air, as well as an additionalexpander. This study identified that the short dis-charge duration causes high storage efficiencies ofup to 70%, also concluding that additional expan-ders are beneficial for power augmentation but notso for the storage efficiency. Wojcik and Wang,16 onthe other hand, studied the feasibility of integratingadiabatic CAES systems with a CCGT. Their con-figuration uses the GT compressor for first stageCAES compression, a thermal energy store and airexpanders, all of which leads to a power augmenta-tion of 47.5% over the recorded CCGT plant cap-acity. Salvini17 presents a performance analysis for aCAES integrated CCGT. Like the previous work ofthe author, the compression train was powered by amotor, with an air heater used to increase injectionair energy. Using a modified storage efficiency equa-tion, over 58% storage efficiency for the CCGT com-bined with CAES was achieved. The study alsoshows a trade-off between storage efficiency andplant cost, with a variation of initial pressure ofthe storage tank.
Igie et al.18 focus on the stand-alone GT withrespect to an assumed CAES. This study shows theperformance benefits of different injection air tem-peratures, as well as the influence of the design stagepressure ratio distribution on stall margin. ThoughPO increased with more air injection, its valuereduced for a given rate when the injection tempera-ture increased. However, this brought about anincrease in thermal efficiency due to the increased spe-cific heat. This work did not consider transient oper-ations as presented in Kim and Kim19 that evaluatethe potential ramp rate benefit from injectingcompressed air at the discharge of a 15MW GT
Table 1. Ramp-up rates for F-class GTs by different OEMs.
OEM Model
Power output
(MW)
Ramp rate
(MW/min)
Ramp rate
(%/min) Reference
GE 9F.05 314 24 8 GE Power2
GE 7F.04 198 30 15 GE Power3
GE 6F.03 88 7 8 GE Power4
Siemens SGT6-5000F 360 40 11 Siemens5
Mitsubishi M501F 185 12 6 Mitsubishi Hitachi Power Systems6
Mitsubishi M701F 385 38 10 Mitsubishi Hitachi Power Systems7
GE: General Electric; GT: gas turbine; OEM: original equipment manufacturer.
Abudu et al. 867
compressor, taking into account the variability in therotational speed. The study optimizes the injectionschedule and concludes that a linear increase anddecrease of injection airflow is required for optimumramp-up. Consequently, the authors theoreticallyconfirm the potential of using compressed air fromCAES to improve GT ramp rates. This study, unlikeprevious works, explores the potentials of compressedairflow injection for heavy-duty GT operating at aconstant rotational speed that is set by grid require-ment. It presents:
. the benefits and limitations of air injection that isrestricted by the surge margin and the TET
. improvements in part-load efficiency are shownand compared with other load variation strategies
. a quasi-dynamic analysis to quantify the improve-ments in the load ramp rates from 50% of the loadat maximum VIGV opening
. the improvements in ramp rates attainable fromthe minimum environmental load (MEL) to fullload (FL), when VIGV schedules are included
This study shows the ramp rate capability of com-pressed air injection with an emphasis on operability.The combination of VIGV operations with thelumped compressor stages employed to replicatemulti-stage operations has demonstrated more indica-tive compressor limitation that was previously not evi-dent in studies that model the compressor as one‘brick’. The impact of this is highlighted in the latterpart of this paper.
Set-up under investigation
The single shaft 185MW engine under investigation isinspired by a generic Mitsubishi F-class GT. Thedesign and off-design behaviour have been modelledand simulated using Cranfield University’s in-housesoftware – Turbomatch. The zero-dimensional codewas written in FORTRAN language, with the cap-ability to run both steady-state and transient GT per-formance simulations.
The tool accounts for turbomachinery effects in thecompressor and turbine using embedded standardcomponent maps. There is also a generalized combus-tor map used to evaluate the combustion efficiencyvariations. For design point (DP) computations, thesoftware performs an energy balance for the simulatedsystem using defined inputs. However, first, it rescalesthe selected component maps to new maps used,based on user-defined inputs such as pressure ratio,component efficiency, and corrected mass flow(CMF). Their scale factors (SF) are defined asshown in equations (1) to (3)
SFPR ¼PRDP � 1
PRDPMap � 1ð1Þ
SF�is ¼�isDP
�isDPMap
ð2Þ
SFCMF ¼CMFDp
CMFDPMapð3Þ
where
CMF ¼Min �101325 Pa
Pin�
ffiffiffiffiffiffiffiffiffiffiffiffiffiffiffiffiffiffiTin
288:15K
rð4Þ
In the design and off-design analysis, the computa-tions must satisfy the work balance and compatibilityof flow and rotational speed as indicated in equations(5) to (7). In addition to this, the Newton–Raphsonmethod is used to determine convergence for off-design calculations
PO ¼ M17 � Cp17 � T17 � T21ð Þ� �� M17 � Cp2 � T9 � T2ð Þ� �
ð5Þ
M17
ffiffiffiffiffiffiffiT17
p
P17¼
M2
ffiffiffiffiffiffiT2
p
P2�P2
P9�P9
P17�
ffiffiffiffiffiffiffiT17
T2
r�M17
M2ð6Þ
NffiffiffiffiffiffiffiffiffiTout
p ¼NffiffiffiffiffiffiffiTin
p �
ffiffiffiffiffiffiffiTin
p
ffiffiffiffiffiffiffiffiffiTout
p ð7Þ
Operational requirements can be attained byadjusting the VIGV, which is achieved through fur-ther scaling of maps. The models generated can becontrolled using shaft speed, combustor outlet tem-perature (COT), or fixed PO, depending on the appli-cation. The combustor mean temperature (CMT) andexhaust gas temperature (EGT) can also be set asmodel controls.
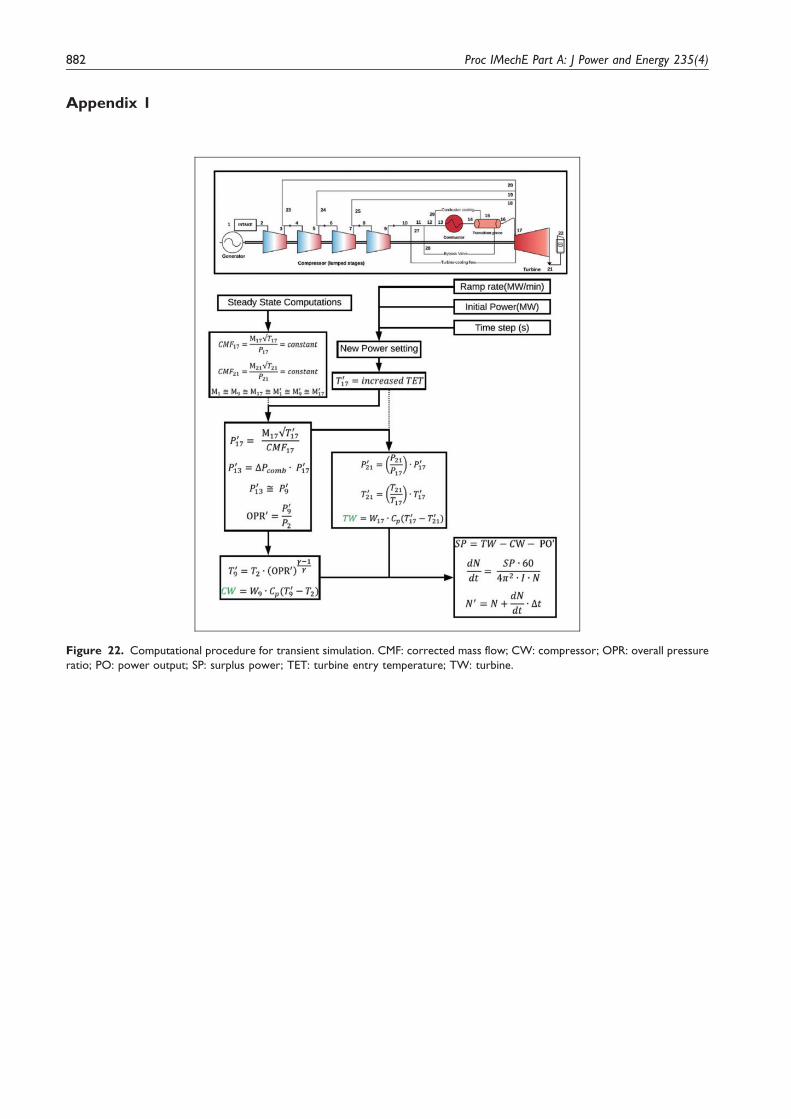
Figure 1 illustrates the simulation set-up of theengine model that consists of four compressorbricks, each of which are lumped stages. The individ-ual lumped stages have between them air extractionsfor cooling the turbine. It can also be observed thatsome of the discharge air from the compressor exit isused for the turbine and combustor cooling. A uniquefeature of this engine is the cooling of the combustorexit flow through a bypass into the transition piece.The amount of air through this bypass varies at dif-ferent loads, unlike the other cooling flows that areactive and constant for all the operations. The flowleaves the dummy CAES into the GT; this type ofoperation is referred to as discharging of the storagesystem. The injection is assumed to occur behind thediffuser, between stations 10 and 11, that is immedi-ately after the turbine cooling flow extraction. Inpractice, the storage pressure is greater than the max-imum operating pressure of the GT, by using auxiliarycomponents as described in Wojcik and Wang16 andSalvini.17 Thus, the air pressure is sufficient to allowfor injection into the GT. The pressures and tempera-tures of the added flows are assumed to be the same as
868 Proc IMechE Part A: J Power and Energy 235(4)

the corresponding compressor exit values. This sim-plification ensures the integration of the injected andcompressor discharge airflow with minimum supple-mentary compressor work and minimal distortions. Inaddition, similar temperatures enable a constant fuel–air ratio to attain the desired combustion tempera-ture. The average TET at station 17 is a result ofthe cooling flows. The turbine is modelled as onebrick for simplicity, as it is least prone to aerodynamicproblems for the study under investigation. The tur-bine drives all four compressor bricks on the sameshaft, and the total driven work of the compressor isthe sum of the individual bricks. The surge marginutilization (SMU) defines the proximity of the operat-ing point and the surge line of the individual lumpedstages. This is mathematically represented in equation(8); an assumed SMU of 85% (i.e. 15% surge margin)is specified for all the lumped stages at the DP.
SMU %ð Þ ¼PRworking � PRmin
PRstall � PRmin
� �� 100
� �ð8Þ
where PR is the individual pressure ratios of the indi-vidual compressor (comp. 1–4), whose productamounts to the compressor overall pressure ratio(OPR), i.e P9/P2.
The DP performance at which the engine is mod-elled is indicated in Table 2. These are typical valuesbased on the technology of the engine, some of whichare public information.
Table 3 shows the DP calculated parameters,also in comparison to the OEM published data inMitsubishi Hitachi Power Systems.6 This indicatesa low percentage error, and in addition, the off-design validation was conducted. Figure 2 illus-trates the validation of the off-design calculationsbased on the variation of ambient temperatures atfixed COT. It shows good agreement with the pub-licly available OEM data,6 having the highest per-centage error of 2% for one temperature; the meanerror across the nine cases is 0.2%. Further detailsof the design and off-design calculations are pro-vided in Igie et al.,18 MacMillan,21 and Pellegriniet al.22
Figure 1. Flow injection set-up with a dummy storage system. CAES: compressed air energy storage.
Table 2. Engine performance specification at DP.
Design parameters Comment
Ambient conditions ISO –
Intake mass flow 457 kg/s Evaluated from public data6
Compressor overall pressure ratio 16 Public information
Compressor overall efficiency 86% Assumed
Combustor pressure loss 4% Assumed
Combustor efficiency 99% Assumed
Turbine efficiency 89% Assumed
Combustor mean temperature 1786 K Evaluated from public data20
Fuel lower heating value 45.5 MJ/kg –
DP: design point; ISO: International Organization for Standardization.
Abudu et al. 869

Steady-state flow injection atDP – max. fixed VIGV opening
The first case of air injection investigated is that of asteady-state, with a fixed maximum opening of theVIGV, keeping the CMT (1786K) constant. Airflowinjections up to 15% of the compressor discharge flow(CDF) have been considered. Air injection allows formore fuel flow as shown in Figure 3(a), to maintainthe same value of CMT. With an increase in air andfuel flow in the engine, the PO rises such that the gains(in flow and useful work) are greater than the heatinput; thus, an improvement in the thermal efficiencyas indicated in the figure. Figure 3(a) also shows up to25% increase in PO with a 12% rise in the thermalefficiency when 15% of air is injected. Lower valuesare obtained at lower air injection rates, such as 5%flow injection that amounts to a 9% increase in thePO. Figure 3(b) shows the rise in OPR that is a resultof increased work output in the turbine that leads to ahigher compressor work. The increased work outputin the turbine is caused by the rise in the air and fuelflow, with a higher TET that is a function of the cool-ing scheme applied.
In these conditions (before and after air injections),the turbine is choked, this means that the inlet non-dimensional mass flow is unchanged or fixed. Hence,the inlet pressure of the turbine (at station 17 ofFigure 1) must be higher to satisfy the compatibilityof flow between the turbomachinery components asindicated in equation (6). The effect is an increase inthe compressor back pressure leading to higher OPRand a rise in the compressor discharge temperature
Figure 3. Effect of flow injection on engine performance. (a) Performance parameters and (b) OPR and temperatures. CDT:
compressor discharge temperature; OPR: overall pressure ratio; TET: turbine entry temperature.
Figure 2. Off-design validation of engine model – varying
ambient temperatures. OEM: original equipment manufacturer.
Table 3. DP performance of calculated parameters and %
error.
Performance
parameters OEM data Model % Error
Net power output 185.4 MW 185.4 MW 0.0
Thermal efficiency 37.0% 37.0% 0.1
Heat rate 9740 kJ/kW h 9723 kJ/kW h 0.2
Exhaust gas
temperature
886.0 K 895.3 K 1.0
Exhaust mass flow 468 kg/s 468 kg/s 0.0
OEM: original equipment manufacturer.
870 Proc IMechE Part A: J Power and Energy 235(4)

(CDT) that is due to the increase in the compressorwork. The implication of equation (6) is that the inletairflow into the compressor is reduced, as a result ofgreater back pressure of the turbine leading to a simi-lar effect at the back of the compressor. This inlet flowreduction is indicated in Figure 4 that shows the oper-ating point of the lumped stages (comp. 4) movingtowards surge, as injection airflow increases.
Figure 4 also shows the isentropic efficiency of thelumped stages that decreases with airflow injection,due to a higher rise in temperature ratios than itspressure ratios. Nevertheless, the entire compressorisentropic efficiency is almost constant in these cases,due to a similar order of magnitude in the increase inthe overall ratios. The SMU for the highest air injec-tion (that is 15%) is 97% based on equation (8). Thatof the 5 and 10% injections are 90 and 94%,respectively.
Steady-state flow injection at part-load –max. fixed VIGV closing
In this case, the VIGV is closed, to reduce the PO ofthe engine to low part-load before air injection. Therationale for this is that high PO obtained by flowinjection at FL may not be required in actual oper-ation, as this PO exceeds the rated capacity of theengine. Thus, it is of interest to investigate VIGV clos-ure with air injection. Similarly, a fixed CMT of1786K is also applied, and with reference to the pre-vious case, the operating point shifts to the top rightof the compressor map as shown in Figure 5. Thoughthe actual mass flow reduces, the CMF increase due toa higher drop in inlet pressure than the correspondingdrop in flow and temperature, respectively. As such,at the same rotational speed and higher correctedflow, more work is done in these last stages thatbrings about a rise in the pressure ratio. The
consequence of this is a reduction in the surgemargin after the closure of the VIGV. The SMU isalso shown on the left of Figure 6, where 0� is themaximum VIGV opening, while 40� is the maximumclosing. The injection of 5, 10, and 15% of the CDFincreases the surge utilization (or reduces surgemargin). At 15% air injection, the back compressorwould go into surge as shown in Figures 5 and 6.
In comparison to the flow injection at FL with maxVIGV opening, the finding suggests that more air canbe injected safely, for wider VIGV openings, relatedto higher values of PO. This also infers that with more
Figure 6. SMU at different operations. VIGV: variable inlet
guide vane.
Figure 5. Operating points of last lumped stages during flow
injection – max VIGV closing.
Figure 4. Operating points of last lumped stages during flow
injection – max VIGV opening. DP: design point.
Abudu et al. 871

closing of the VIGV, the maximum airflow that canbe injected will reduce with concern about the surge.This is demonstrated by the fact that in the case ofmax closing of the VIGV with an injection of 15%,the surge margin is �2%, while at the maximumopening it is 3%.
Figure 7 shows the performance of the respectiveinjection cases (5, 10, and 15%). The figure indicatesthat the PO at maximum closing is in fact 68% of therated FL without injection. That of the thermal effi-ciency and fuel flow are 92 and 74%, respectively. It isnoticeable when compared to Figure 3(a) that theincreases in the performance parameters due to injec-tions are a little smaller, due to slightly higher per-centage rise in fuel flow at low-load injections tomaintain the same constant CMT.
The thermal efficiency with air injection has beencompared to that obtained in normal operations, toquantify part-load efficiency improvements. This is acomparison of the thermal efficiencies for thesame PO, with and without injection as shown inFigure 8. The normal operations indicated here areof two types: first, the modulation of the VIGV tochange the PO and presented using the dashed line.Second, the variation of fuel flow to change the PO,for a fixed maximum opening of the VIGV. In thislatter case, the operating point on the line moves morevertically on the compressor map, as opposed to morehorizontally in the former case. The latter is referredto as TET variation, indicated by a dotted line.Operating the engine in this mode is generally moreefficient as shown, due to the better fuel-to-air ratio,with more air mass flow through the engine and ahigher OPR.
The case of airflow injections at a fixed VIGV pos-ition of 40� (maximum closing) is up to 10%. The
increasing air injections from the left to right signifyan increasing thermal efficiency that is greater thanthe other two cases from about 75% of the ratedPO onwards. Better thermal efficiency below this POis shown for the case of CMT variation. This is aresult of the higher OPR at low load, compared tothe former that operates from a closed VIGV pos-ition. However, this changes with increased injectionas explained. The VIGV variation (at fixed CMT) casefor which the thermal efficiency is the least, has advan-tages not shown here, with regards to higher EGT forCCGT operation.
With regards to the rationale of modelling theengine into split lumped compressor stages ratherthan one bulk compressor as shown in publishedwork, Figure 9 highlights the merit of the discretizedapproached used in this study. The figure indicates thevariation in SMU with 2% (top of each bar) and noinjection for both models, at different VIGV position.Where comp. 1/4 to 4/4 relates to the existing model,that of one bulk compressor is shown to be moreoptimistic with the SMU. Hence does not adequatelycapture the severity to surge when air is injected.
Transient flow injection at part-load –max. fixed VIGV opening
This part of the study onward focuses on the ramprates, and in this section, the emphasis is load rampfrom 50% of the PO when the VIGV is fully open.The response rate investigated here is that of a quasi-transient simulation of ramp-ups through airflowinjection. This analysis is based on the followingassumptions:
. heat soakage and volume storage effects are negli-gible for heavy-duty GTs23
. ramp-up rate is limited by combustion temperature(CMT) schedule
. a perfect control system in present: rotationalspeed is maintained at 100%
Figure 7. Effect of flow injection on performance parameters
– max VIGV closing.
Figure 8. Thermal efficiency versus PO – with air injection
and without (fixed and varied VIGV). CMT: combustor mean
temperature; VIGV: variable inlet guide vane.
872 Proc IMechE Part A: J Power and Energy 235(4)

. vibration effects are considered acceptable
. constant rate of opening and closing for airflowinjection valve
The constant mass flow (CMF) method for transi-ent simulation was used in this investigation. Themethod assumes continuous flow compatibilitybetween compressor and turbine and neglects theeffects of mass storage. This method also reducescomputation time and enables multiple cases to beexplored. The CMF method computes rotationalspeed change using the surplus work output, inertia,and rotational speed of the engine.24 However, in thisanalysis, the surplus work is added to the PO of theengine and the speed of the GT remains constant tosatisfy the assumption of a perfect control system.Table 4 shows some inputs for the time-based simu-lation that has been conducted without injection.Figure 22 of Appendix 1 shows a simplified computa-tional procedure for the constant mass flow transientmethod. The calculation proceeds with a steady-stateturndown to 50% PO, which initializes the quasi-dynamic simulation by providing the CMF of the tur-bine inlet and outlet (assumed constant). Applying theOEM ramp rate at the initial power and with thespecified time step, the TET (T017) increases to attainthe new power setting. The increased TET facilitatesthe evaluation of the new turbine inlet pressure (P017),which determines the compressor OPR0 and compres-sor work (CW). The constant CMFs (CMF17 andCMF21) define the expected turbine pressure ratiowhich implies temperature ratio through the isen-tropic relation. The new temperature difference(T017�T
021) across the turbine then dictates the
power generated. As the engine is a single shaft, thework difference between the turbine (TW) and
compressor (CW) gives the required load and resultsin no surplus power (SP). Consequently, the com-puted shaft acceleration tends to zero and the enginemaintains a constant speed at its new power setting(PO0). The sequence is repeated until the target powerof 100% is achieved. It should be noted that the sim-plified procedure assumes minor variations in CMFs,isentropic efficiencies, combustor pressure loss, andgas properties, which are accounted for in the soft-ware used. The operation described here is a loadramp which implies moving vertically on the compres-sor map.
The ramp rate simulation strategy is shown inFigure 10; a quasi-transient simulation was performedusing the defined PO schedule to obtain the CMT as afunction of time. This is conducted, starting from50% of the PO, up to 100%. For the injection caseon the right of the flow chart, a different PO scheduleis arrived at, that is a consequence of the injection
Figure 9. SMU for existing discretized compressor model and bulk case at different VIGV opening – with and without injection.
VIGV: variable inlet guide vane.
Table 4. Input data for design transient simulation.
Input data Value
Preceding steady-state simulations 12
Engine rotational speed (r/min) 3600
Rotor Inertia (kg/m2) 42,000
Ramp rate (MW/min) 12
Ramp rate (%/min) 6.5
Starting power output (%) 50%
Target power output (%) 100%
Time range (s) 700
Time step (s) 0.05
Rate of airflow injection (%/s) 0.01
Abudu et al. 873

rate. This operation is constrained such that the CMTtrend is identical to the case of no air injection on theleft-hand side. The iterative process stops when bothCMT trends are identical with a root mean squareerror (RMSE) less than a Kelvin. The respective POtrends are compared to evaluate the improvement inramp rate.
Figure 11 indicates the differences in PO with andwithout injections with the time duration. It shows noflow injection during the first 50 s of the ramp-up;afterwards, the air injection valve gradually opens todeliver 2% of CDF which corresponds to approxi-mately 7.5 kg/s to the plenum. The injection rate iskept constant, leading to an increase in fuel flowand OPR until the design PO is achieved. At thispoint, the air injection valve closes, and the combus-tion temperature increases to maintain full PO. The100% PO is achieved at 44 s earlier as shown, in thecase of 2% airflow injection. Figure 23 in Appendix 1shows the engine operating parameters during aramp-up for both cases. The figure shows the rapidincrease of most parameters as the air injection valveopens, although a slight reduction in inlet mass flow.The rotational speed is also shown to be constant,
while the thermal efficiency increases the most, dueto the OPR increase.
The ramp rate obtained is analysed in differentlikelihoods: the default case, optimistic, pessimistic,and average ramp rates as indicated in equations (9)to (12). As implied, the optimistic ramp rate calculatesthe best ramp rate achievable. This is defined by thechange in PO with time duration; for this case, it is thedifference between the maximum POf achieved andthe lowest POi(opt.) – 50% of PO, against their respect-ive time difference tf and ti(opt.). In a similar formula-tion, that of the pessimistic case still considers themaximum PO and earliest time to achieve this tf,with reference to a higher starting PO (that does notaccount for the initial gradual increase in airflow) andcorresponding time ti(pess.). An average is also con-sidered between the two scenarios as shown.Optimistic ramp rates include the benefits of the injec-tion valve opening period as a faster ramp is observedwhen the injection flow rate increases from none tothe desired injection amount. Following this, a moremodest ramp rate is obtained. This effect is primarilydue to the increased OPR accompanying the injectionand a corresponding fuel flow increase
Figure 10. Flow chart indicating the strategy for the ramp rate increase – max VIGV opening. OEM: original equipment
manufacturer.
874 Proc IMechE Part A: J Power and Energy 235(4)

RR def:ð Þ ¼POf � POiðopt:Þ
ðtfðdefÞ � ti opt:ð ÞÞ=60ð9Þ
RR opt:ð Þ ¼POf � POiðopt:Þ
ðtf � ti opt:ð ÞÞ=60
� �ð10Þ
RR pess:ð Þ ¼POf � POiðpess:Þ
ðtf � ti pess:ð ÞÞ=60
� �ð11Þ
RR avg:ð Þ ¼RR opt:ð Þ þRR pess:ð Þ
2ð12Þ
The procedure is repeated for airflow injections upto 10% at 2% intervals, and their ramp rates areshown in Figure 12. These are constant rates of injec-tion immediately after the gradual valve opening asshown in Appendix 1 (Figure 24). From the figure, itshows that the ramp rates increase with the flow injec-tions. These increments are presented in the threescenarios in Figure 12, showing that for the averagecase, at every 2% increase in the flow, the ramp rateimproves by about 10%. At 2% air injection, theaverage response rate is 12.9MW/min representing a7.5% augmentation. For this case, the correspondingmaximum SMU was 86%. The injection ramp ratesincreased up to 46% for the highest injection (10%),although the SMU approached 91%. Since the CMTschedule is maintained, airflow injection brings aboutan increase in fuel consumption for every ramp rateincrease case as shown in Figure 13. This figure high-lights the increase in fuel, in tonnes, with their corres-ponding mass of total air injected.
The RMSE between the CMT of the default caseand the injection ramp-up cases is 1K, and the left-hand side of Figure 14 shows their absolute values.That of the TET is indicated on the right of the figure.This shows that the gradients increase with injectionrate, which is attributed to higher cooling flow
Figure 11. PO and airflow injection with time – with and without injection. PO: power output.
Figure 13. Air and fuel quantity as a function of flow
injection.
Figure 12. Increase in ramp rate as a function of flow injec-
tion for different scenarios. RR: ramp-up rate; SMU: surge
margin utilisation.
Abudu et al. 875

temperatures that occur with a rise in compressorwork. Figure 25 of Appendix 1 shows the RMSEfor both CMT and TET for the cases of air injection.
Transient flow injection from MEL to FLwith variable VIGV
The focus of this section is the ramp-up rate of theengine from the MEL that relates to the lowest envir-onmentally compliant load that is limited by CO emis-sions. The aim is to reduce the time taken from MELto FL, facilitated by compressed air injection. Unlikethe previous investigation, it captures the operationfrom low load (with closed VIGV at 40�) and the
opening of the vanes. It also consists of the schedulingof the CMT from 88.5% of its design value, at inter-vals of 0.05%, until the maximum value of 1786K.The operation consists of segment 1 that involves theincrease of CMT and segment 2 that consist of theopening of the VIGV at fixed CMT as shown inFigure 15. The overall procedure for the air injectionis as follows:
1. From MEL, CMT is increased from 88.5% ofdesign value until 100% of its value (at closedVIGV – 40 �). This is achieved simultaneouslywith compressed air injection that increases grad-ually until its respective fixed values (2, 4,. . .10%).
Figure 15. PO, CMT, and VIGV schedules for default and injection ramp-ups. CMT: combustor mean temperature; MEL: minimum
environmental load; VIGV: variable inlet guide vane.
Figure 14. CMT and TET schedules for ramp-up – with and without injection.
876 Proc IMechE Part A: J Power and Energy 235(4)

2. At 100% of CMT, i.e 1786K, the VIGV is thenopened at 1� per 7 s while the CMT remains fixed;this occurs with the constant injection rate until FLis achieved and exceeded. It is worth noting that dueto the simultaneous injection of compressed air andVIGV opening, the FL is reached before the max-imum opening of the VIGV.
Figure 15 shows the outcome of the implementation ofthe strategy, highlighting the default ramp rate of12MW/min in the solid line. The implication of usingdifferent compressed air injection rate is shown; these arediscrete operations from 2 to 10% that have identicalVIGV and CMT schedules. For the 2% injection case,the compressed air is initially introduced at 0.14%/sbefore reaching 2% of the CDF. The injected airflowwas maintained at 2% through the CMT rise andVIGV opening until the engine FL was reached andexceeded. The duration to reach this PO was recordedand the augmented ramp rate was calculated. The timeto FL is seen to reduce consistently, as the airflow injec-tion increases from 2 to 10%. It also brings about higherPO earlier, thereby signifying an increase in the ramprate as can be calculated using equation (13). In thefigure, it can be observed that there is a slight variationof the gradient of the trends, especially beyond FL that ismore noticeable. This is due to the change in the com-bustor variable bypass flow at a different load
RR ¼POFL � POMEL
tFL � ðtMEL ¼ 0Þð13Þ
The computed improved ramp rates are displayedin a bar chart in Figure 16 which shows a steadyincrease in the ramp rate, with an increase in injection.Unlike the previous analysis which explores ramprates improvements in three perspectives, the analysishere focuses on the optimistic case to show the mostbenefit of airflow injection during ramp-up. The ramprate improvement rises to over 50% for the highestinjection percentage; at 2% of air injection, the ramprates of the engine increases from 12 to 13.2MW/minthat is a 10% increase as shown. A consistent increasein ramp rates of approximately 10% is noticed forevery 2% increase in injected airflow.
Figure 17 shows that the rise in air injection isaccompanied by a corresponding reduction in thefuel consumed. The consumption represents accumu-lated fuel flow over the duration of the ramp-upbetween MEL and FL. The injection ramp-up benefitsfrom a shorter duration (with regards fuel consump-tion) as less fuel flow is required to achieve the designTmax at FL, which occurs at partially closed VIGV.Figure 26 of Appendix 1 provides the method of com-puting the fuel consumed and suggests a reduced areafor the 10% injection, in comparison to the defaultinjection ramp-up, which indicates improved fuelconsumption.
As the current analysis involves the opening of theVIGV and rises in CMT to achieve higher power set-tings, there is more attention on compressor surge. Theearlier sections of this paper discuss the variation in thecompressor operating line for the front and rear stagesduring airflow injection at closed VIGV. For the ramp-up procedure from MEL here, the front stage map inFigure 18 shows the changes in the operating point atMEL with closed VIGV, the CMTmax operation, andthe FL (when VIGV is fully opened) with and withoutinjection. The map shows that there is a small rise in thepressure ratio when raising the CMT from MEL, and
Figure 16. Ramp rates increase as a function of airflow
injection from MEL.
Figure 17. Reduced fuel consumption as a function of airflow
injection from MEL.
Abudu et al. 877

the final pressure ratio of the lumped stage at maximumCMT with air injection is greater. The zoomed insetshows that higher injection ramp-ups increase theSMUmore than lower injection ramps, as the increasedcombustor flow requires a higher pressure ratio. Theramp-up proceeds with opening the VIGV which fur-ther increases the SMU as the ingested airflow into theengine increases. It should be noted that the surge linefor this compressor section moves downwards duringthe VIGV opening. Nonetheless, the ramp-up operationterminates at the FL DP with acceptable SMU valuesof 85 and 86.4% for the default and 10% injectionramp-up, respectively.
The compressor map of the rear stages (comp. 4) isprovided in Figure 19 with the default case, minimumand maximum injection ramp-up operating lines.Wider variations in SMU are observed for this com-pressor section in comparison to the front stages dueto its proximity to the combustor and the location ofinjection. The pressure ratio increase (from CMTincrement) raises the SMU in the first segment ofthe ramp-up as shown, with higher injection ratesraising the SMU higher. Conversely, the VIGV open-ing reduces the SMU as the CMF is seen to decrease.The FL points indicated in the figure suggest a veryhigh SMU of 97.9% for the 10% injection ramp-up incomparison to 88.4 and 85% for the 2% injection anddefault ramp-up, respectively. From the map, it isobserved that the CMTmax operating point incursthe highest SMU, for the ramp-up scenarios con-sidered, and predisposes compressor rear stages tosurge. It is noteworthy that the FL point for injectionramp-ups are achieved at partially closed VIGV andresults in a higher SMU. It should be noted that atMEL and CMTmax, the indicated non-dimensionalspeed is higher than at FL, which is a result of reducedinlet airflow temperature into the rear lumped stages.
Figure 20 shows the SMU of each lumped stage,inclusive of the middle ones (2 and 3) for the differentflow injection. It indicates that 2% injection is gener-ally the safest operation and that the back lumpedstages (comp. 4) are also the most prone to surge,with reduced risk towards the front of the compressor.The first segment operation on the left-hand side ofthe figure shows a similar increase in SMU for all thelumped stages with a rise in the airflow injection. Thisis not the case in the second segment when VIGVopens. In fact, the SMU of the front stages beginsto improve, by the signified reduction in the value,while the back stages increase.
Although the CMT is kept identical for all injec-tion cases, their TET varies. This is due to the increasein temperature of cooling flows during injectionramps that could be a limiting factor on the amountof airflow injected. More importantly (than theincrease in TET value) is the rate of increase in TETthat impacts thermal transients on the turbine bladesand can be life-limiting. The TET schedules for thedefault and 2% injection ramp-up are shown inFigure 21. The figure shows segment 1 and 2 oper-ations, indicating that the TET rises at different rates.Segment 1, for the default case, has a TET rate of1.06K/s, while that of the injection is an average of1.07K/s. For segment 2, it is 0.25 and 0.26K/s,respectively. The figure also shows how these changefor other injection rates in each segment. A maximumdeviation of 0.06 and 0.05K/s is observed for the 10%injection ramp-up in segment 1 and 2, respectively.The deviation implies a 6 and 20% increase in com-parison to the default ramp-up with respect to seg-ments 1 and 2. To contextualize, during everyminute of the ramp-up, the turbine blades experience
Figure 19. Operating points of last lumped stages during
ramp-up. CMT: combustor mean temperature; FL: full load;
MEL: minimum environmental load.
Figure 18. Operating points of first lumped stages during
ramp-up. CMT: combustor mean temperature; FL: full load;
MEL: minimum environmental load.
878 Proc IMechE Part A: J Power and Energy 235(4)

a 0.6 and 3.5K hotter flue gas temperature in com-parison to the default case. This suggests that the 2%injection ramp-up scenario is safest and reflects apotential concern for the maximum injection ramp-up. It should be noted that the hotter gas tempera-tures are not sustained as the airflow injection is ter-minated after the engine achieves FL.
Conclusions
This study has investigated the benefits of compressedair injection for GTs with respect to power augmen-tation, part-load efficiency improvement, andenhancements in ramp-up rates.
Figure 21. TET as a function of injection rate with time. CMT: combustor mean temperature; INJ: injection; TET: turbine entry
temperature; VIGV: variable inlet guide vane.
Figure 20. SMU as a function of airflow injection at end of segment 1 (left) and end of segment 2 at respective FL (right). CMT:
combustor mean temperature; FL: full load.
Abudu et al. 879

The simulations show the tendency of the compres-sor back stages to operate towards stall during flowinjection, especially at closed VIGV position. The air-flow injection is shown to:
. increase the OPR, CDT, TET, and slightly reducethe EGT.
. increase the PO, thermal efficiency, and fuel flow insimilar magnitude for fully closed and fully openVIGV positions.
. result in an earlier surge, when injection occurswith closed VIGV.
. significantly reduce the isentropic efficiency of thebulk compressor stages closer to the injectionlocation.
. improve the part-load efficiency when operatingabove 75% of PO, compared to other load vari-ation approaches.
. improve engine power/load ramp-up rates.
The steady-state simulations show a potentialpower augmentation of up to 25% with 15%flow injection. The quasi-transient analysis showsthat the load ramp rate improves from 12 to12.9MW/min on average when 2% (of compressordischarge) is injected at a fixed opened VIGV pos-ition. That of the optimistic scenarios is 13.3MW/min. An increment in airflow injection by 2% isshown to improve the ramp-up rates by approxi-mately 10%.
The ramp rate improvement from MEL shows thatwith 2% air injection, the ramp rate also increases byabout 10%. In this case, the VIGV modulationresulted in less optimistic SMU in parts of the oper-ation towards full closure, especially for high air injec-tions. The cases of air injections from MEL showreduced fuel consumption that is attributed to thereduced time of operation and less opening of theVIGV (with injection rate).
Finally, the study shows the potentials of com-pressed air injection capabilities. Aspects like delaysin the GT control system, heat soakage, and massstorage effects are not accounted for. The mechanicalintegrity (vibration limits) under these conditions arealso worthy of investigation. It is also important tonote that in CCGT operations, the ramp rates will belimited by ST ramp rate that is also a function of theboiler and ST mechanical integrity.
Declaration of Conflicting Interests
The author(s) declared no potential conflicts of interest with
respect to the research, authorship, and/or publication ofthis article.
Funding
The author(s) disclosed receipt of the following financial
support for the research, authorship, and/or publicationof this article: This study is part of TURBO-REFLEX pro-ject that has received funding from the European Union’s
Horizon 2020 research and innovation programme, undergrant agreement No. 764545.
ORCID iD
Uyioghosa Igie https://orcid.org/0000-0002-2708-0237
References
1. National Grid Electricity System Operator. The gridcode. Vol. 37. Warwick: National Grid Electricity
System Operator Limited, 2019.2. GE Power. 9F power plants, https://www.ge.com/con-
tent/dam/gepower-pgdp/global/en_US/documents/
product/gas%20turbines/Fact%20Sheet/2018-prod-specs/9F_Power_Plants_R3.pdf (2018, accessed 15August 2019).
3. GE Power. 7F.04, https://www.ge.com/content/dam/
gepower-pgdp/global/en_US/documents/product/gas%20turbines/Fact%20Sheet/7F.04-fact-sheet-2016.pdf(2015, accessed 15 August 2019).
4. GE Power. 6F.03 gas turbine, https://www.ge.com/con-tent/dam/gepower-pgdp/global/en_US/documents/product/gas%20turbines/Fact%20Sheet/6F.03-fact-
sheet-2016.pdf (2015, accessed 15 August 2019).5. Siemens. SGT6-5000F, https://new.siemens.com/
global/en/products/energy/power-generation/gas-tur-bines/sgt6-5000f.html (accessed 15 August 2019).
6. Mitsubishi Hitachi Power Systems. M501F series.Mitsubishi Hitachi Power Systems Global, https://www.mhps.com/products/gasturbines/lineup/m501f/
index.html (accessed 7 February 2019).7. Mitsubishi Hitachi Power Systems. M701F series.
MHPS, https://www.mhps.com/products/gasturbines/
lineup/m701f/index.html (accessed 15 August 2019).8. Gonzalez-Salazar MA, Kirstena T and Prchlikb L.
Review of the operational flexibility and emissions of
gas- and coal-fired power plants in a future with grow-ing renewables. Renew Sustain Energy Rev 2018; 82:1497–1513.
9. Balling L. Fast cycling and rapid start-up: new gener-
ation of plants achieves impressive results. ModernPower Syst 2011; 31: 35–40.
10. GE. Power FlexEfficiency, https://www.ge.com/con-
tent/dam/gepower-pgdp/global/en_US/documents/ser-vice/gas%20turbine%20services/power-flexefficiency-brochure.pdf (2014, accessed 15 August 2019)..
11. GE. GE advanced gas path (AGP), https://www.ge.com/content/dam/gepower-pgdp/global/en_US/docu-ments/service/gas%20turbine%20services/advanced-gas-path-brochure.pdf (2016, accessed 15 August 2019).
12. Appleyard D. How power plant upgrades are boostingflexibility. Power Engineering International, 2 February,https://www.powerengineeringint.com/articles/print/
volume-23/issue-2/features/retrofitting-flexibility.html(2015, accessed 20 August 2019).
13. DiCampli J and Laing D. State of the art hybrid solu-
tions for energy storage for grid firming. GE Power,June, https://www.ge.com/content/dam/gepower-pgdp/global/en_US/documents/product/hybrid/GE%
20PGE%202017%20Hybrid%20paper.pdf (2017,accessed 20 August 2019).
14. Perri P. A flexible generation and energy storage solu-tion, https://www.power-eng.com/articles/print/
volume-121/issue-11/features/a-flexible-generation-and-
880 Proc IMechE Part A: J Power and Energy 235(4)
energy-storage-solution.html (2017, accessed 20 August2019).
15. Salvini C. Performance analysis of small size com-
pressed air energy storage systems for power augmen-tation: air injection and air injection/expander schemes.J Heat Transfer Eng 2018; 39: 304–315.
16. Wojcik JD and Wang J. Feasibility study of combinedcycle gas turbine (CCGT) power plant integration withadiabatic compressed air energy storage (ACAES). Appl
Energy 2018; 221: 477–489.17. Salvini C. CAES systems integrated into a gas-steam
combined plant: design point performance assessment.Energies 2018; 11: 17.
18. Igie U, Abbondanza M, Szymanski A, et al. Impact ofcompressed air energy storage demands on gas turbineperformance. Proc IMechE, Part A: J Power and
Energy, Epub ahead of print 16 February 2020.DOI:https://doi.org/10.1177/0957650920906273.
19. Kim MJ and Kim TS. Integration of compressed air
energy storage and gas turbine to improve the ramprates. Appl Energy 2019; 247: 363–373.
20. Gulen SC. Modern gas turbine combined cycle.
Turbomach Int 2013: 31–35. https://www.bechtel.com/getmedia/a424a660-52dc-4487-aaa0-0ea6b2d0adb2/TMI-Gas-Turbines-Article_Nov-Dec-13/.
21. MacMillan WL. Development of a modular type com-
puter program for the calculation of gas turbine offdesign performance. Bedford: Cranfield University,1974.
22. Pellegrini A, Nikolaidis T, Pachidis V, et al. On theperformance simulation of inter-stage turbine reheat.Appl Therm Eng 2017; 113: 544–553.
23. Singh V, Axelsson L-U and Visser W. Transient per-formance analysis of an industrial gas turbine operat-ing on low-calorific fuels. J Eng Turbines Power 2016;
139: 7.
24. Kong C, Ki J and Koh K. Steady-state and transientperformance simulation of a turboshaft engine with freepower turbine. In: ASME 1999 international gas turbine
and aeroengine congress and exhibition, Indianapolis,1999.
Appendix
Notation
1–22 location on engine schematicDLN dry low NOxM mass flowMax maximumN rotational speed (r/min)SF Scale factort time (s)T temperature (K)�i isentropic efficiency
Abudu et al. 881
Appendix 1
Figure 22. Computational procedure for transient simulation. CMF: corrected mass flow; CW: compressor; OPR: overall pressure
ratio; PO: power output; SP: surplus power; TET: turbine entry temperature; TW: turbine.
882 Proc IMechE Part A: J Power and Energy 235(4)

Figure 23. Variation in operating parameters during ramp-up – with and without injection-fixed VIGV. CMT: combustor mean
temperature; OPR: overall pressure ratio.
Figure 24. Airflow injection schedules for ramp-ups.
Abudu et al. 883

Figure 26. Fuel schedules for default and 10% injection ramp-up – varying VIGV. FL: full load; MEL: minimum environmental load.
Figure 25. TET gradient and RMSE for CMT and TET during injection ramp-up. CMT: combustor mean temperature; RMSE: root
mean square error; TET: turbine entry temperature.
884 Proc IMechE Part A: J Power and Energy 235(4)