process improvement during ramp up - diva portal450971/fulltext01.pdf · process improvement during...
TRANSCRIPT

PROCESS IMPROVEMENT DURINGPRODUCTION RAMP UP
- C a s e s t u d y o f t h e M a n u f a c t u r i n g P r o c e s s V a l i d a t i o n -d u r i n g M I 0 9 c o n t r a c t a t B o m b a r d i e r - T r a n s p o r t a t i o n
Master Thesis
in the field of Quality Technology & Managementwritten at Linköping University, Sweden
and Bombardier Transportation, Crespin, FranceLinköping, October 2011
LIU-IEI-TEK-A- -11/01217- SE
Author:Benjamin TARET
Student of Master Program in Manufacturing Management
Supervisors:Bozena Poksinska
Quality Technology & Management Department, Linköping University
Jérome LamulleMI09 Methods Departments, Bombardier Transportation Crespin


ABSTRACT
Production ramp up corresponds to « the period between the end of the productiondevelopment and the full capacity utilization ». The manufacturing process often doesnot work perfectly during this early time of the new product production and someadjustments are necessary to obtain full capacity utilization. In order to assess theassembly process during this period, the train manufacturer Bombardier Transportationhas created an improvement process called “VPI” (which stands for “Validation duProcessus Industriel” or “Validation of the manufacturing process” in English). Itspurpose is to “validate the material and the documentation for every movementindependently” in order to ensure quality of final product and safety of the workers. Itaims at detecting and solving rapidly safety problems and deviation from the normalprocess.
This thesis is a case study of VPI during MI09 contract (new trains for ¨Paris subway).It aims at assessing VPI framework and identifies possible causes of the delay invalidation of MI09 production process.
Four main MI09 production line specificities have been identified: long assembly time,low production volume, system complexity and process variability. VPI frameworkmeets partially these production line prerequisites. VPI is a process that allowssystematizing problems detection, formalizing the improvement process and managinga high number of problems with a clear view of the VPI validation. The mostimportant drawbacks of the VPI seem to be the lack of problems detection after theinitial observation, problem definition framework and root cause analysis.
Four reasons could explain the delays during the realization of VPI on MI09 contract:undetected problems, normal treatment timeframe for the improvements, inadequateobjectives and lack of framework to select the best solution to solve problems. VPImay be improved by including root cause analysis, better problem definition andknowledge management between contracts. However, these methods are timeconsuming and a prioritization of the problem should be made. FMEA (Failure Modeand Effect Analysis) methodology may help to identify the problem on which the VPIshould focus on.
Keywords:Ramp-Up, Process Improvement, Railway industry, Bombardier

AKNOWLEDGMENTS
This Master thesis has been performed within the Methods department of BombardierCrespin. This very instructive internship would not have been possible without thesupport of many people that I would like to thank.
First of all, I wish to express my gratitude to J. Lamulle, my supervisor and manager atBombardier transportation, for the opportunity to perform my internship, for his trust,advices and support during these six months.
I would also like to thank M. Fayolle and A. Huet, who were VPI managers on theMI09 contract, for welcoming me, sharing their knowledge and above all for theirfriendship.
I would like to express my greatest thanks to all my colleagues of the Methodsdepartments. Besides working together, I really enjoyed the friendly and pleasantatmosphere.
I would like to thank as well all the workers on the MI09 production line forwelcoming me, for sharing their knowledge of the production line and helping me forimplementing the improvements.
I would like to thank all the others department’s members that I met during this sixmonths internship: Engineering, Production, Quality, Tooling and especially Trainhandling department who help me during VPI analysis of the handling on the train. Iwish them good luck in their work for implementing the needed improvements.
I would like to thank my supervisor at LiTH, Bozena Poksinska for her advices andcomments, for helping me to clarify my topic and answering all my questions.
I wish also to thank all my professors of the Master’s Program in ManufacturingManagement for teaching me the manufacturing theoretical background and providedme support during the time I have studied in Linköping University.
Linköping, SwedenOctober 2011Benjamin TARET

TABLE OF CONTENT
1. INTRODUCTION........................................................................................................................................................1
1.1 Railway industry.............................................................................................................................................1
1.1.1 Railway Industry history ...................................................................................................................1
1.1.2 Market Description...............................................................................................................................1
1.1.3 Main Railway industry Firms...........................................................................................................3
1.1.4 MI09 Contract and VPI........................................................................................................................3
1.2 Purpose of the Thesis....................................................................................................................................5
1.2.1 Research questions...............................................................................................................................5
1.2.2 thesis delimitations..............................................................................................................................5
1.2.3 Thesis organization..............................................................................................................................5
2. THESIS BACKGROUND...........................................................................................................................................7
2.1 Bombardier .......................................................................................................................................................7
2.2 Bombardier-Crespin...................................................................................................................................10
2.2.1 General presentation of the Plant................................................................................................10
2.2.2 BT production in Crespin site .......................................................................................................11
2.2.3 Crespin plant General organisation............................................................................................12
2.2.4 Methods department ........................................................................................................................12
2.3 MI09 contract ................................................................................................................................................12
2.3.1 MI09-Production line .......................................................................................................................13
2.3.2 MI09 production history.................................................................................................................13
3. METHODOLOGY.....................................................................................................................................................15
3.1 Methodology presentation.......................................................................................................................15
3.2 Data sources presentation .......................................................................................................................15
3.3 Methodology justification.........................................................................................................................19
4. THEORETICAL BACKGROUND.........................................................................................................................21
4.1 Ramp up phase..............................................................................................................................................21
4.1.1 Definition...............................................................................................................................................21
4.1.2 Learning during Ramp Up ..............................................................................................................22
4.2 Problem solving frameworks..................................................................................................................24
4.2.1 PDCA Methodology............................................................................................................................24
4.2.2 8 steps problem solving methodology (Purdy, 2010) ........................................................24
4.2.3 SEVEN RULES for problem solving (Sims, 2011)..................................................................25
4.2.4 Systematic innovative process (Sheu et al., 2010)...............................................................26
4.2.5 Comparison of frameworks ...........................................................................................................26
4.3 Problem solving Tools ...............................................................................................................................28

4.3.1 Root cause analysis: Ishikawa diagram ....................................................................................28
4.3.2 Triz methodology...............................................................................................................................28
4.4 Failure mode and effect analysis...........................................................................................................30
5 RAW DATA: VPI description .............................................................................................................................31
5.1 VPI: A Part of the Industrializatin phase............................................................................................31
5.2 VPI: systematic methodology for Problems Detection-...............................................................32
5.3 VPI: A Process in interaction...................................................................................................................34
5.4 VPI Framework.............................................................................................................................................40
5.4.1 Before the VPI – Planning and Team Building ........................................................................40
5.4.2 Observation phase - Systematic Analysis ..................................................................................40
5.4.3 Planning and implementing the solution.................................................................................41
5.4.4 AVM - Containing the problem ......................................................................................................41
5.4.5 VPI closure – Assembly Process Assessed...................................................................................41
5.5 VPI documents ..............................................................................................................................................41
5.6 Visualization of process Maturity .........................................................................................................43
4.1 VPI for MI09 contract.................................................................................................................................45
4.2 VPI: An evolving process ..........................................................................................................................46
5 CASE ANALYSIS......................................................................................................................................................48
5.1 Problem solving methodology ...............................................................................................................48
5.2 Specificities of Production line...............................................................................................................50
5.3 Links with the problem solving process ............................................................................................52
5.4 Needed reactivity – low production volume ......................................................................................53
5.5 System complexity- Lot of potential assembly problems ..............................................................59
4.2 Process Inertia - Long assembly time ...................................................................................................64
4.3 Variability - Non automated production line .....................................................................................67
4.4 Process Maturity visibility .......................................................................................................................68
5 CONCLUSION...........................................................................................................................................................70
5.1 Answer to the research questions ........................................................................................................70
5.2 Improvement suggestions for VPI ........................................................................................................72
5.3 Concluding remarks....................................................................................................................................79
6 REFERENCES...........................................................................................................................................................81
-Articles- .........................................................................................................................................................................81
-Master theses- ..............................................................................................................................................................82
-Books- ............................................................................................................................................................................82
-Websites-.......................................................................................................................................................................82
-Internal Bombardier documentation- ...................................................................................................................82
7 Appendix ...................................................................................................................................................................83
7.1 Appendix 1: Examples of VPI improvements...................................................................................84

7.2 Appendix 2: FMEA tables..........................................................................................................................85
7.3 Appendix 3: Theoretical articles research.........................................................................................86
4.1 Appendix 4: Crespin Plant organization.............................................................................................89
4.1 Appendix 5: method department organization...............................................................................90

GLOSSARY
Assembly Handbook - Handbook of 5 to 20 pages that explains how to perform aspecific “movement” with all critical parameters to obtain the required quality level.An “Assembly handbook” is written by the Methods department for each “movement”and is given to the workers as a reference for their work.
Assembly station - Part of the production line in charge of the realization of a specificlist of movements
BT - Bombardier Transportation
FMEA – Failure Mode and Effect Analysis - Methodology for “defining, identifyingand eliminating known and/or potential failures, problems, errors”
GAP – “ Groupe Autonome de Production » (or « Autonomous Production Unit » inEnglish). GAP is constituted by production line workers of an assembly station(around 7 to 15 per GAP) with defined roles. It should contain one GAP manager, onemethod manager, one quality manager, one logistic manager and one safety manager.This group is responsible for continuous improvement in its production area. Dailymeeting are organized to check all the problems encountered by the workers.
IPA - Validation of the assembly process by the client
KPI - “Key Performance Indicator”, indicators that are used to follow the keysparameters of the production line.
Met13 - VPI File for managing the implementation of the improvements
Met16 -VPI file for planning the realization of the VPI
Met27 - VPI Check list for the detection of possible improvements in each assembly
Movement - (internal meaning) A “movement” is a part of the assembly process thatconstitutes an organizational unit for the Method department. The assembly of a doorfor example constitutes a “movement”.
VPI - “Validation du Processus Industriel“(Validation of the Manufacturing process)Improvement process that aims to validate the material and the documentation to ensurethe safety and the quality of the assembly.

LIST OF FIGURES
Figure 1: World revenues for main companies in railway industry .............................................................3Figure 2: Thesis limitations ...........................................................................................................................................5Figure 3: Breakdown by the workforce and revenue of BT in 2011.............................................................7Figure 4: Revenues of BT by market segment and geographic region ........................................................8Figure 5: Examples of rail vehicles produced by BT ...........................................................................................8Figure 6: BT organizational Chart...............................................................................................................................9Figure 7: Trains produced at BT-Crespin..............................................................................................................11Figure 8: MI09 production line parts......................................................................................................................13Figure 9: Planning of the MI09 contract................................................................................................................14Figure 10: Thesis methodology presentation .....................................................................................................15Figure 11: Five phases for the development of new manufacturing product........................................21Figure 12: Source of improvement..........................................................................................................................22Figure 13: Effect of experimentation......................................................................................................................23Figure 14: Systematic problem solving proces...................................................................................................26Figure 15: Summary of the four selected frameworks....................................................................................26Figure 16: Proposed framework for problem solving .....................................................................................27Figure 17: Ishikawa diagram......................................................................................................................................28Figure 18: TRIZ framework ........................................................................................................................................29Figure 19: Triz matrix ...................................................................................................................................................29Figure 20: Example of link between contradiction and related inventive principle ..........................30Figure 21: Position of the VPI process in the MI09 contract.........................................................................31Figure 22: VPI objectives .............................................................................................................................................33Figure 23: Links between VPI and other ramp up processes .......................................................................34Figure 24: “Design Freeze” process.........................................................................................................................37Figure 25: Design Freeze evolution for the MI09 Contract ...........................................................................38Figure 26: VPI and IPA process description.........................................................................................................38Figure 27: Description of VPI process ....................................................................................................................40Figure 28: KPI for VPI during MI09 contract.......................................................................................................43Figure 29: KPI for open K1 and K2 during MI09 contract on assembly line..........................................44Figure 30: KPI for VPI for all Parts of the MI09 Production..........................................................................44Figure 31: VPI evolution throught the different contracts ............................................................................46Figure 32: Evolution of the VPI VS the n° of vehicle for the NAT and MI09 contracts.......................47Figure 33: Comparison between "ideal" and VPI's problem solving framework.................................48Figure 34: Effect of standardization on efficiency.............................................................................................52Figure 35: Links between production lines specificities and problem solving process ....................53Figure 36: Possible causes of loss of reactivity during VPI for MI09 contract ......................................54Figure 37: Detected problems during MI09 contract VS time......................................................................54Figure 38: Detected problems on the MI09 contract .......................................................................................55Figure 39: Complexity...................................................................................................................................................59Figure 40: Detected problems with VPI, pre –IPA and IPA during the MI09 contract .......................60Figure 41: VPI Versus process inertia ....................................................................................................................64Figure 42: Total K1+K2 open and solved..............................................................................................................65Figure 43: VPI Versus production line variability .............................................................................................67Figure 44: Design freeze example ............................................................................................................................69Figure 45: root cause analysis of delays in VPI...................................................................................................72Figure 46: Proposed framework for the problem prioritization.................................................................74Figure 47: Suggestion for VPI framework.............................................................................................................77Figure 48: Proposed framework for mitigation actions selections............................................................77Figure 49: Proposed framework for MET13........................................................................................................78

Figure 50: Traditional ratings for severity of a failure....................................................................................85Figure 51: Traditional ratings for detection of a failure .................................................................................85Figure 52: Traditional ratings for occurrence of a failure..............................................................................85Figure 53: Problem solving - EBESCO search......................................................................................................86Figure 54: Problem solving - SCOPUS search......................................................................................................86Figure 55: Problem solving – SCIENCE DIRECT search ..................................................................................87Figure 56: Ramp Up - EBESCO search ....................................................................................................................87Figure 57: Ramp Up - SCOPUS search.....................................................................................................................88Figure 58: Ramp Up – SCIENCE DIRECT search.................................................................................................88
LIST OF TABLES
Table 1: Division of main companies between railway industry segments ..............................................2Table 2: Vehicles and bogies production in Crespin from 2001 to 2011.................................................10Table 3: List of assembly stations for the MI09..................................................................................................13Table 4: Thesis Data sources......................................................................................................................................16Table 5: Keywords for articles...................................................................................................................................18Table 6: Case study quality assessment.................................................................................................................19Table 7: Example of possible problems detected during VPI .......................................................................32Table 8: Examples of risks detected during AMDEC on the MI09 contract ............................................36Table 9: Detected problems on MI09 production line divided by production departments...........45Table 10: Treatment time for problem solving on MI09 contract..............................................................58Table 11: Number of problems detected during VPI .......................................................................................59Table 12: Types of problems detected during IPA and Pre-IPA analyses on MI09 contract...........61Table 13: possible causes for the undetected problems.................................................................................62Table 14: Observed assemblies Vs number of produced vehicles in August 2010..............................65Table 15: Advantages and drawbacks of VPI.......................................................................................................70Table 16: Potential causes of delays........................................................................................................................71Table 17: Link beteween severity of failure and VPI criticality index ......................................................75Table 18: Link between detection of failure and VPI framework...............................................................75Table 19: Advantages and drawbacks of proposed improvements...........................................................79
LIST OF EQUATIONS
Équation 1: Learning curves equation ...................................................................................................................22Équation 2: FMEA risk priority equation..............................................................................................................30Équation 3: ARPAT criticality factor equation....................................................................................................35

1 PROCESS IMPROVEMENT DURING PRODUCTION RAMP UP
-Benjamin TARET- Linköping University
1. INTRODUCTION
1.1 RAILWAY INDUSTRY
1.1.1 RAILWAY INDUSTRY HISTORY
Lot of evolutions has occurred since the first railway vehicle with steam engine in the
beginning of nineteenth century. Around 1825 in Great Britain, the “Locomotion”
created by Stevenson was travelling on the first railway network. At this time, all
locomotives were using steam engines, but this situation has evolved with the
appearance of a new technology. The discovery of electricity has made possible the
production of electric railway vehicles in 1882. These first electric vehicles were
moving with a speed of 60km/h, a speed record which was amazing at this time but
which has been exceeded during the next century. Little by little, steam engines have
been replaced by electric engines in the beginning of twentieth century. In 1955,
electric locomotives were able to travel at a speed record of 331km/h and in 1972 the
well known TGV (“Train à Grande Vitesse” or “High Speed Train”) reached the
actual speed record of 500km/h.
During the last century, railway industry has evolved, at the same time that
performance, safety and comfort requirements have increased. According to the
Railway Industry Federation, this evolution was driven by three main changes. Firstly,
the responsibility of parts design and development has been transferred from railway
networks managers to trains manufacturers. Secondly, a new high technology
requirement for safety, comfort and performance has appeared. Finally, client was
requiring both increased reliability and availability of equipment and decreased costs.
These changes constitute opportunities but also challenges for railway industries. In
order to meet these challenges, train manufactures are merging to form bigger group,
sufficiently large to fund research and achieve economies of scale. In the same time,
train design has evolved and traditional passenger trains, which are constituted of a
locomotive pulling a rake of carriages, have been replaced by trains forming multiple
units. In order to deal with these increased quality standards, train manufacturers have
had to adapt their quality policies.
1.1.2 MARKET DESCRIPTION
Railway industry can be divided into three main segments:
-Locomotives and rolling stocks which include traction equipment, bogies,
suspension, body structures, braking systems control and diagnostic systems.
-Infrastructure which could be divided into “track” (rails, fastenings, support
structures, ballast) , “structures, and electrification” (overhead contact wire, catenary
wire and supporting fixtures, insulators, masts or portals, transformers and switching
equipment) and “power distribution sub-systems”
-Signaling and telecommunications which contains train protection equipment, train
operation equipment and train supervision equipment.

2 PROCESS IMPROVEMENT DURING PRODUCTION RAMP UP
-Benjamin TARET- Linköping University
Table 1: Division of main companies between railway industry segments
(Source: T Griffin, 2007, survey of competitiveness of the EU rail supply industry)
Table 1 describes the position of main railway industry actors in these segments.
Griffin (2007) argues that the Railway industry is characterized by powerful clients,
high technology and customized products. Clients of railway manufacturers are mainly
governments, from national to local level and product development is often jointly
realized by suppliers and customers. Rail equipment manufacturing requires
specialized technologies which need to be developed during a long period of time.
Therefore high investments are necessary, profit level is low and there is few risk of
new entrant. Moreover, products have long lifecycle and should be customized in
order to be adapted to specialized infrastructures and legal requirement.
The main barriers for entering in the railway market are the cost of bidding for
contracts, the long duration of contract (often more than 2 years), the complexity of
certification procedure and the risky and low profitability. Because of these barriers,
few strong competitors are dominating the market.

3 PROCESS IMPROVEMENT DURING PRODUCTION RAMP UP
-Benjamin TARET- Linköping University
1.1.3 MAIN RAILWAY INDUSTRY FIRMS
Figure 1 provides world revenues for the main European railway companies.
According to this figure, the biggest European railway companies are Bombardier
Transportation, Alstom and Siemens.
Figure 1: World revenues for main companies in railway industry
(Source: Griffin, 2007, survey of competitiveness of the EU rail supply industry)
1.1.4 MI09 CONTRACT AND VPI
In April 2009, Bombardier Transportation has been selected to produce a new
generation of 60 subway trains for Paris. This contract, called MI09, is managed by the
consortium Alstom-Bombardier. Bombardier will be in charge of the production of the
three center vehicles of this train (180 vehicles in total) and the others will be
produced by Alstom. The industrialization of this train has begun in January 2010. The
design of the MI09 trains is based on a previous contract produced by the consortium
during the 1990s: the Mi2N. Most of the design parts remain unchanged in these two
contracts.
Figure 2: Picture of the MI09
(Source: BT corporate presentation, 2011)

4 PROCESS IMPROVEMENT DURING PRODUCTION RAMP UP
-Benjamin TARET- Linköping University
Railroad industry manufacturing systems could be classified somewhere between the
mass production and job shop production. For this kind of production, a complete
production line is developed for each contract. Therefore, at the beginning of each new
contract occurs, a “test phase”. During this phase, production process and design are
assessed. Bombardier Transportation is trying to reduce this initial industrialization
phase in order to reach the full-capacity utilization as fast as possible. For this purpose,
they have created an improvement process called “VPI” (which stands for “Validation
du Processus Industriel” or “Validation of the manufacturing process” in English).
This process takes place in the beginning of the industrialization phase of each new
train’s production and is close to the “First Article Review” described by Massy
(2011) and used in other companies like Alstom for example.
According to the Bombardier Documentation, the purpose of the VPI process is to
“validate the material and the documentation for every movement independently” in
order to ensure the final product quality and the safety of the workers. It aims at
detecting and solving rapidly safety problems and deviations from the normal process.
The production process changes a lot during the initial industrialization phase. By
observing and analyzing the assembly of the very first produced vehicles, VPI aims at
stabilizing the production line by systematically checking and improving the industrial
equipment, process documentation, quality control and safety.
The VPI process is a young process, it has been applied on only two previous contracts
in the Crespin production site (MF2000, NAT) and is currently in process for two
other contracts (MI09 and Regio2n). So its framework is still evolving and
improvements could be made on this process.
During MI09 contract, it seems that delays in the realization of VPI have occurred.
According to the BT objectives, the VPI process improvement should have been
finished after the production of the fourth vehicles of the contract (around September –
October 2010 for the MI09).VPI has been used on the first produced vehicles during
the industrialization phase of the MI09, and it has ended lately in August 2011 with the
complete validation of all assemblies (after the 40th vehicle). This kind delay has also
appeared on VPI of previous contracts. So we may wonder if it is linked to hazardous
events that happen during these contracts, or if this situation is a consequence of the
structure of VPI process by itself.

5 PROCESS IMPROVEMENT DURING PRODUCTION RAMP UP
-Benjamin TARET- Linköping University
1.2 PURPOSE OF THE THESIS
1.2.1 RESEARCH QUESTIONS
This thesis is a case study of the VPI process during the MI09 contract. It aims at analyzing and suggesting improvements for the VPI process and answering the following research questions:
RQ1: Is VPI process adapted to the Bombardier Transportation production line
characteristics?
RQ2: What could be the reasons for the delay in the realization of the VPI during
the MI09 contract?
1.2.2 THESIS DELIMITATIONS
This thesis is limited to the analysis of VPI during the MI09 contract of Bombardier. It
focuses on the “assembly line” section which is one part of the MI09 production line
(MI09 production line sections is presented in part 2.3.1). Figure 3 presents these
delimitations. Because of the lack of information and thesis length limitation, this
thesis will not discuss about:
VPI in other sections of the MI09 production line
VPI in other BT contracts
Process improvement framework during ramp-up in other companies
Generalisibility of the results to these others areas is discussed in part 5.3.
Figure 3: Thesis limitations
(Source: own)

6 PROCESS IMPROVEMENT DURING PRODUCTION RAMP UP
-Benjamin TARET- Linköping University
1.2.3 THESIS ORGANIZATION
In order to answer these research questions, the thesis is divided in six parts.
First, the background of the MI09 contract is presented, the localization of the MI09
project and of the methods department within Bombardier Transportation organization
is described. In a second part, the methodology used for this analysis is analyzed and
justified. Data sources are described. In a third part, theoretical background for the
thesis is presented. The selected theories are focused on production ramp-up in
industry and problem solving methodologies. In a fourth part, VPI process objectives
and frameworks are described according to corporate guidelines provided by
Bombardier Transportation and data collected during observations and interviews.
Organizational links with other processes occurring during the ramp up phase are
presented. The fifth part is dedicated to analysis. VPI framework is analyzed based on
its results on MI09 contracts and theoretical frameworks found in literature. Its
compatibility regarding the identified production line specificities is assessed and VPI
advantages and drawbacks are identified. Possible causes for the delays are presented.
And finally, based on the analysis, possible improvements are proposed for this
improvement process in order to meet these production line specificities.

7 PROCESS IMPROVEMENT DURING PRODUCTION RAMP UP
-Benjamin TARET- Linköping University
2. THESIS BACKGROUND
- The Purpose of this part is to present the background the MI09 contract and to locate this
contract within BT organization –
2.1 BOMBARDIER
According to its website, Bombardier is a worldwide leader in aerospace and railroad
transportation which employs 65,400 employees, divided into 69 production and
engineering sites. Created in 1942 by J.A. Bombardier, this firm has focused first on
snowmobiles production and it has diversified its production in 1974 by producing the
subways of New York. In 1986, Bombardier has entered in the aeronautic industry
with the acquisition of CANADAIR. Then BT has produced the trains for the
subways of Toronto, New York, London and Montreal. In 2011, its manufacturing
activities are divided between Aerospace and Transportation as described in figure 3
Figure 4: Breakdown by the workforce and revenue of BT in 2011
(Source: BT, 2011)
Bombardier Aerospace is a manufacturer of innovative aviation products and related
services for the “business, commercial, amphibious and specialized aircraft markets”.
It also proposes technical services, aircraft maintenance and pilot training.
Bombardier Transportation (BT) is the rail equipment division of Bombardier
created in 1974. BT is now Operating in 36 countries with 34,900 employees divided
into 59 engineering and production sites. BT Global headquarters are located in Berlin
(Germany). BT develops and manufactures rail equipment solutions including: rail
vehicles, propulsion and controls, bogies, services, transportation systems and rail
control solutions. More than 100,000 vehicles have been set up by BT worldwide. BT
main commercial area is Europe as described in figure 4.

8 PROCESS IMPROVEMENT DURING PRODUCTION RAMP UP
-Benjamin TARET- Linköping University
Figure 5: Revenues of BT by market segment and geographic region
(Source: BT, 2011)
BT main market segment is the rolling stocks category, in which the MI09 contract
can be classified and especially the European market. Figure 6 presents some
examples of rolling stocks produced by BT organized according to their capacity and
speed. BT portfolio is broad; Bombardier produces vehicles from low speed and
capacity INNOVIA Monorail to high speed and capacity TRAXX locomotives. MI09
contract can be classified in the “regional and commuter trains” category with middle
speed and capacity.
Figure 6: Examples of rail vehicles produced by BT
(Source: BT, 2011)
9 PROCESS IMPROVEMENT DURING PRODUCTION RAMP UP
-Benjamin TARET- Linköping University
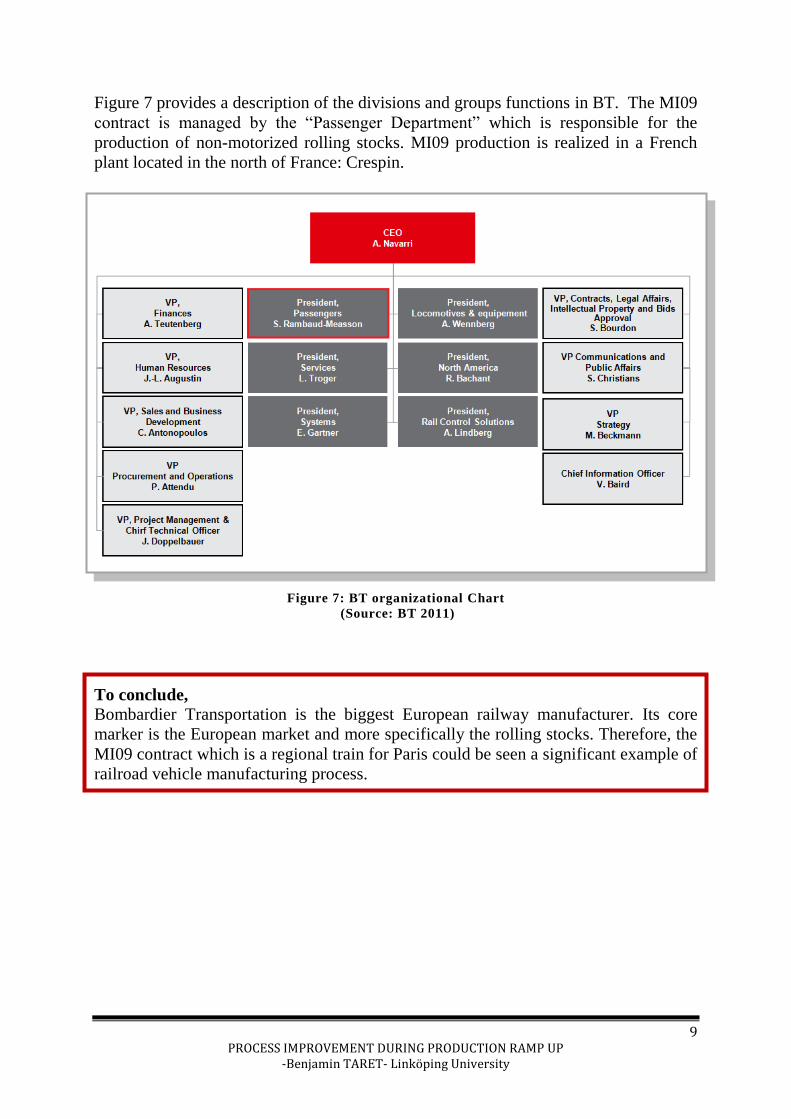
Figure 7 provides a description of the divisions and groups functions in BT. The MI09
contract is managed by the “Passenger Department” which is responsible for the
production of non-motorized rolling stocks. MI09 production is realized in a French
plant located in the north of France: Crespin.
Figure 7: BT organizational Chart
(Source: BT 2011)
To conclude,
Bombardier Transportation is the biggest European railway manufacturer. Its core
marker is the European market and more specifically the rolling stocks. Therefore, the
MI09 contract which is a regional train for Paris could be seen a significant example of
railroad vehicle manufacturing process.

10 PROCESS IMPROVEMENT DURING PRODUCTION RAMP UP
-Benjamin TARET- Linköping University
2.2 BOMBARDIER-CRESPIN
2.2.1 GENERAL PRESENTATION OF THE PLANT
The company ANF (North of France
Industries) was created in 1882. It was first
specialized in production of mining
equipment and then it had refocused on
railroad equipment production. ANF’s plants
have been destroyed during First World War
and rebuild during the 20s. Between the 2
world wars, ANF has extended itself by
acquiring an airplane production plant near
Paris and a railroad plant in the north of
France.
Involved in World War Two with its production of military equipment, it has been
destroyed and rebuild in the 50s. The period of time after World War Two was
flourishing for the ANF with a lot of orders for rebuilding the French railroad
equipment that has been destroyed during the war.
Bombardier acquired the ANF in 1989. In 2001, the biggest contract of Crespin plant
was signed for the production of 700 trains (called AGC) for the French Railroad
Company (SNCF). It was the largest series for rail vehicles in the world. In 2003, ANF
industry has changed its name and became “Bombardier Transport France”
In 2011, 2000 employees, including 550 engineers and managers, are working in
Crespin’s plant. 525 vehicles and 1055 bogies have been produced in 2010. Table 2
describes the strong growth of production volume of the plant during the last decade.
Between 2001 and 2011, production of vehicles had been multiplied by more than 10.
Table 2: Vehicles and bogies production in Crespin from 2001 to 2011
(Source: BT, 2011)

11 PROCESS IMPROVEMENT DURING PRODUCTION RAMP UP
-Benjamin TARET- Linköping University
2.2.2 BT PRODUCTION IN CRESPIN SITE
Four contracts are currently produced in Crespin Plant: the MF2000, the Francilien,
the Regio2n and the MI09. Pictures of these trains are presented in
Figure 8
The MF 2000 contract is a train for Paris
subway. It has been ordered by the RATP and
realized by a partnership of Alstom, Areva and
Bombardier. 800 vehicles will be produced for
this contract.
The Francilien (also called AGC) contract has
been ordered by the SNCF (french Railway
Company) and the STIF (Ile de France
Transport Authority) in 2006. This innovative
train has a capacity of up to 900 passengers and
proposes high or low-floor access, spacious
vestibules for optimum passenger flow,
automatic passenger counting for regulating the
air-conditioning and saving energy, panoramic
windows and wide walkthrough gangways.
The first Francilien has been delivered in
December 2009, 172 trains will be produced in
total.
The Régio2N is an innovative first double-deck
train ordered in 2010. 860 trains will be
produced in total for a first delivery in 2013.
This train offer more capacity and is
economically attractive thanks to reduced
maintenance costs and energy consumption.
The MI09 train is an improved version of the
MI121V for the Paris subway. It has been
ordered by the RATP and realized by a
partnership Alstom- Bombardier. 130 vehicles
will be produced for a delivery from September
2011 to March 2019
Figure 8:
Trains produced at BT-Crespin
(Source: BT, 2011)
12 PROCESS IMPROVEMENT DURING PRODUCTION RAMP UP
-Benjamin TARET- Linköping University
2.2.3 CRESPIN PLANT GENERAL ORGANISATION
Appendix 4 provides a description of the organization in Crespin. BT-Crespin has a
matrix organization which is divided by contracts (NAT, AGC, MF2000, MI09 and
Regio2n), role (production, methods, supplier management, engineering, performance,
product division) and type of product (Passenger, Service or Bogies). This thesis has
been conducted within the Methods department for passenger part of MI09 contact.
2.2.4 METHODS DEPARTMENT
Methods department has a key role all along the industrialization phase of each
contract. According to the internal documentation of BT-Crespin, Methods have
several purposes.
This department is responsible for:
Managing the total budget during each contract,
Analyzing and proposing investments to the production and to its own services,
including the safety areas,
Establishing the training plan for workers,
Transferring information and orders to workers and collecting remarks,
Analyzing the train design realized by the engineering department and create
the corresponding documentation,
Coordinating the production of the first vehicles of each type,
Initiating and managing the Manufacturing Process Assessment (called VPI).
This thesis focuses more specifically on the last two purposes through a case study of
the VPI during the MI09 contract. Appendix 5 provides the organization of methods
department in BT Crespin. It is divided between contracts (MF2000, MI09, NAT,
AGC and Regio2n) and methods for specific plant areas (carbody, testing, special
manufacturing process, maintenance and tooling) Data collection for this thesis has
been performed with the Methods for contract MI09 directed by J. Lamulle.

13 PROCESS IMPROVEMENT DURING PRODUCTION RAMP UP
-Benjamin TARET- Linköping University
2.3 MI09 CONTRACT
2.3.1 MI09-PRODUCTION LINE
To be produced, a train passes through several “assembly stations”. Table 3 provides
the list of assembly stations for the MI09 contract. The “passenger” production line of
the MI09 is divided in 26 different assembly stations linked to 5 different production
departments.
Production
departments
Assembly
stations
“Carbody workshop” 1 to 6
“Paint workshop” 8 to 16
“Assembly line” 17 to 24
“Test” 25
“Test on railroad” 26 Table 3: List of assembly stations for the MI09
In the Carbody workshop, the sub-
assemblies are welded in order to form the
carbody of the train. The Paint workshop
is constituted by 14 cabins used for all the
different steps of the process. First, the
carbody is blast with sand then it is sanded
and a Primary coat is set before the final
coat and varnish. On the “Assembly line”
part, the installation of the remaining parts
is completed: electrical and software
systems, doors and windows, seats, and
interiors, signaling system and bogies. At
the end, static and dynamic test are
performed to ensure the safety and the
quality of the train.
This thesis has been realized within the
“Assembly line “section which is linked to
the assembly stations number 17 to 24.
Figure 9: MI09 production line parts
(Source: BT corporate presentation ,2011)

14 PROCESS IMPROVEMENT DURING PRODUCTION RAMP UP
-Benjamin TARET- Linköping University
2.3.2 MI09 PRODUCTION HISTORY
Bombardier has been selected by RAPT (Paris railway managers) to realize the MI09
contract in April 2009 with a final delivery of the 130 vehicles between September
2011 and March 2019.
Figure 10 describes this evolution of MI09 contract.
The industrialization of this new train has begun in the beginning of 2010 with the first
produced vehicles on which the VPI processes has been launched. Between January
2010 and August 2011, the production line was involved in a ramp up phase with a
validation of the production process and important improvements in order to decrease
the process time and meet quality requirements. For the first trains, the process time at
each assembly stations was up 12 days and it has decreased to 3 days in August 2011.
Figure 10: Planning of the MI09 contract
(Source: own)

15 PROCESS IMPROVEMENT DURING PRODUCTION RAMP UP
-Benjamin TARET- Linköping University
3. METHODOLOGY
- This part aims at presenting and justifying the methodology for the case study analysis and
the data sources used for the thesis -
3.1 METHODOLOGY PRESENTATION
The purpose of this thesis is to identify the causes of delay in the realization of VPI
process during MI09 contract, and assess if VPI framework is adapted to MI09
production line specificities. Based on this analysis, improvements are proposed in
order to solve identified drawback of VPI framework. Figure 11 presents the selected
methodology for achieving this purpose. The input data for this analysis are based on
theoretical papers about three main areas (problem solving process, ramp up in
manufacturing and problem tools) and empirical study (observations of VPI,
interviews and collected quantitative data). First, theoretical “ideal” problem solving
framework is proposed based on a literature review. Then, MI09 production line
specificities are identified based on observations and theories about “ramp-up”. These
specificities are matched with the proposed “ideal” problem solving framework in
order to identify a list of specific requirements on VPI framework. VPI framework is
then analyzed regarding these requirements. Hypotheses based on data collected
during observation and interviews are formulated. These hypotheses are verified with
the analysis of quantitative data. Finally, problems solving tools identified in literature
are proposed to solve the drawbacks of VPI.
Figure 11: Thesis methodology presentation
(Source: own)

16 PROCESS IMPROVEMENT DURING PRODUCTION RAMP UP
-Benjamin TARET- Linköping University
3.2 DATA SOURCES PRESENTATION
This case study is a holistic case study (Casey, 2010) with a single unit of analysis: the
VPI process for MI09 contract on assembly line. It aims at evaluate a particular
improvement program and therefore can be defined as intrinsic according to Casey and
Houghton (2010) classification. This is a deductive case study (Lee et al., 2011) which
uses “theory to develop specific hypothesis to be tested”.
As presented in Table 4, data have been collected in the three data types (Merriam,
2010): interviews, observations and documents.
Interviews Observations Documents
Interview
of J. Lamulle
Informal
interviews
6 months Internship Official BT framework
Official BT corporate presentations
Master thesis written by previous VPI
managers
Theoretical articles
Table 4: Thesis Data sources
(Source: own)
Direct observations during a 6 months internship - I have been in charge of the VPI
process for “assembly line” section in the MI09 contract between January and July
2011. During this internship, I have used the VPI framework for validating and
improving assemblies. This internship was an opportunity to assess the pros and cons
of this process in real situation and to test some possible improvements for this VPI
process.
Informal interviews -According to Know et al. (2008), interview may not be “a
discrete event” but could also be continuous. During the internship, informal
interviews have been performed with members of methods, quality, production and
engineering departments. These informal talks have provided their point of view about
VPI process, its results, advantages and drawbacks. The results of these interviews
were used to find possible hypotheses for explaining the delays in VPI realization.
These hypotheses were then confirmed with the numerical data about VPI results.
Interview of J. Lamulle -The interviewee has been chosen because of his knowledge
in VPI. J. Lamulle has been the methods manager for the industrialization phase of the
MI09 contract. He has also been involved in the Methods team during the NAT
contract. Therefore he had observed and managed the evolution of the VPI process
between these two contracts.
Two types of interview protocol exit: structured or unstructured. Interviews with a
highly structured protocol are easier to compare but unstructured approach provides
more freedom and allows introducing new questions according to interviewed person
remarks (Knox et al., 2008). Because only one interview of this type has been
conducted, semi-structured interview technique has been chosen.
17 PROCESS IMPROVEMENT DURING PRODUCTION RAMP UP
-Benjamin TARET- Linköping University
Main questions and topics have been selected before the interview but new questions
have been added according to the answers to the open questions. Questions were focus
on the evolution of the VPI through the contracts, links with other processes like
design freeze and evaluation of the VPI results. It was a mix of open and focus
questions.
It was a single face to face interview performed at the end of my internship with open
questions focused. Face to face interview facilitate “authentic and deep description of
phenomena” and “clarify the information being communicated”. According to Knox et
al. (2008), “the strength of the interviewer-participant relationship is perhaps the most
important aspect”. This aspect is also underline in the criteria for interview assessment
developed by Tong A. et al. (2007). For this particular case, J. Lamulle was also the
supervisor of my internship. I have worked with him during six months before the
interview. This situation has facilitated the interview and has allowed me to prepare
questions.
Official Bombardier Transportation Frameworks -Bombardier provides an official
description of the VPI framework for its VPI managers. This document defines the
objectives of the VPI, the main steps of the process and responsibility of each
department in the process. This document describes how the VPI process should be
managed. During my analysis, it allowed me to compare this “ideal” process with the
way it is managed in reality. Official frameworks have also been used for the
description of the other ramp up processes.
Master Thesis Written by previous VPI managers -Two of the previous VPI
managers where master students and had written master thesis about this VPI process.
These master theses have been used as secondary data for this thesis. The first one
was written by Andrew Massy who was responsible for the beginning of the VPI
process for the “assembly line” section between January 2010 and July 2010. He has
performed most of the VPI observations for the MI09 contract. His report provides me
data about the initial phase of the VPI, the objectives and the results of the VPI until
July 2010. It has mainly been used as indications for the analysis of the VPI process.
The second report was written by Matthieu Fayolle who was one of the managers of
the VPI process on “assembly line” section between August 2010 and January 2011.
He has performed the remaining VPI observations in August 2010 and has managed
the closure of the VPI during these 6 months.
His report provides data about the evolution of the VPI, the problems encountered for
their closure and some indication of possible causes for the delay in the VPI closure.
VPI Actions Plans -The action plans of VPI and their outcomes are compiled in files
called “MET13” and “MET16”. I collected these files for the MI09 contract on which
I was working, for the NAT contract and for the Regio2n contract (whose
industrialization phase has just begun when I finished my internship). These data were
used to analyze the type of problem encountered, the type of selected solutions, the
resolution time, and the history of VPI on the MI09 contract in order to figure out the
causes of the delays in the VPI closure. Moreover the comparison between NAT and
MI09 data provided insights about the evolution of VPI process

18 PROCESS IMPROVEMENT DURING PRODUCTION RAMP UP
-Benjamin TARET- Linköping University
Official Bombardier Transportation Corporate Presentation - Official
presentations of Bombardier transportation have been used for describing the company
and the history of each contract. These presentations have been found externally
through the corporate website or internally through corporate communication
channels.
Theoretical Articles - In order to define the theoretical model for the analysis, articles
have been used from EBSCO, Science Direct and Scopus database. Two initial topics
have been identified: ramp-up and problem solving. Table 5 presents the keywords
used for the articles search and selected articles. Complete research framework is
available in Appendix 3.
Ramp-up Problem solving
Keywords
Ramp up
Production
New production process
Manufacturing
Problem solving
Step by step
Structured problems
Systematic method
Engineering
Industrial
Manufacturing
Papers
Terwiesch et al, 1999
Arthur et al. 2005
O'Hara, 1993
Sims, 2011
Purdy et al. 2010
Sheu et al. 2009
Li, 2010
Table 5: Keywords for articles
(Source: own)

19 PROCESS IMPROVEMENT DURING PRODUCTION RAMP UP
-Benjamin TARET- Linköping University
3.3 METHODOLOGY JUSTIFICATION
According to Lee et al. (2011), four main criteria should be used for assessing the
quality of qualitative study: transferability, credibility, confirmability and
dependability. Transferability refers to “how consistent findings are in similar context”
and can be achieve with comparison to other case studies. However, as defined
previously, this case study is “intrinsic” and transferability is not applicable to this
type of case studies (Casey and Houghton, 2010). Credibility, also called internal
validity, is linked to “establishing the causal relationship between intervention and
outcome”. It could be increased by multiple data sources and use of alternative
hypotheses. Confirmability, or construct validity, refers to using “reasonable
conceptual link among the constructs and the measure used”. Dependability, also
called reliability, is concerned whether the outcomes would have been the same if
study would be repeated. Methods for improving these criteria are presented in table 6.
Tra
nsf
era
bil
ity
Cre
dib
ilit
y
Co
nfi
rmab
ilit
y
Rel
iab
ilit
y
Methodology for this thesis
Res
earc
h d
esig
n Triangulation
X
Qualitative data reinforced with numerical analysis
Comparison of theories
Logic model
X Assessment criteria presented before the analysis
Case study database
X Original data cannot be represented in appendix because of
the needed confidentiality
Dat
a co
llec
tio
n
Multiple sample X Unique sample
Multiple sources
X X X Objective (numerical) and subjective (interviews and
observations ) data sources
Multiple data collection points
X X Data collected during the whole MI09 VPI process (one year
and a half).
Intervention procedures
X Detailed description of the case background
Dat
a an
aly
sis Multiple units of
analysis X
Unique unit of analysis
Transparent interpretation of data
X Explicit methodology for creating the figure and tables
Table 6: Case study quality assessment
(Source: own)

20 PROCESS IMPROVEMENT DURING PRODUCTION RAMP UP
-Benjamin TARET- Linköping University
Research design -Triangulation may improve the credibility. This could be achieved
by using several data sources, theories, investigators or methods. During this thesis,
subjective data obtained during interview and observations are reinforced with analysis
of numerical data from VPI process. Moreover, several theories are compared for
finding the analysis criteria. The use of a logical model presented prior to data
collection also enhances the credibility of the analysis. In order to clarify the logical
model used during this thesis, theoretical model and criteria for assessment is
presented before the analysis. In order to improve the reliability, a case study database
should be presented in the appendix for allowing other possible future analysis. For
this thesis Original data cannot be represented in appendix because of the needed
confidentiality.
Data collection -Multiple samples may increase the confirmability. However, this
study has a unique unit of analysis, therefore it cannot be used. Lee et al. (2011)
recommend using multiple sources both objective (for clear analysis) and subjective
(for developing in depth and holistic description of participants’ experience).
Objective sources like numerical data and official framework and subjective sources
like interviews and observation have been used. Moreover, multiple data collection
points may enhance the credibility and confirmability of the study. The observation of
the VPI process has been performed during an internship of 6 months between January
2011 and August 2011, moreover previous thesis and process data have provided
information about the process between January 2010 and December 2010. So the
analysis of this thesis is based on data collected during the whole MI09 VPI process
(one year and a half). Finally, a detailed description of the “intervention procedure”
may enhance the transferability, but as described previously this criteria is not usable
here.
Data analysis -Lee et al. (2011) recommend using multiple unit of analysis to improve
the credibility of the study. However, this advice cannot be used here: the unit of
analysis has been defined before the study and is unique. A clear chain of evidences
improves the confirmability of the analysis. Therefore, in order to make the
interpretation of the data the most transparent, the methodology for obtaining the
presented data and figure from raw data is presented for each analysis.

21 PROCESS IMPROVEMENT DURING PRODUCTION RAMP UP
-Benjamin TARET- Linköping University
4. THEORETICAL BACKGROUND
-The purpose of this part is to present and develop the theories which will be used for the
analysis of VPI process. The theoretical background is focused on ramp-up definition,
learning curves and problem solving methodologies -
4.1 RAMP UP PHASE
The first part of this theoretical background is dedicated to define the ramp up phase,
and its specificities.
4.1.1 DEFINITION
Figure 12: Five phases for the development of new manufacturing product
(Source: O’Hara, Evans and Hayden, 1993)
O’Hara et al. (1993) divide the development process of new manufacturing product in
five phases represented in Figure 12. Firstly, there is the “initiation phase” in which
the market investigation are performed to define the customer requirement. The second
phase is the “concept definition” phase during which several alternatives to meet the
customer requirements are studied. Thirdly, the “concept validation” phase consists of
an implementation of the solution and a feasibility check of the design. Fourthly,
during the “Refinement and verification” phase, the manufacturing processes and tools
are set up in order to ensure the “production readiness”.
During the last fifth phase, the “production and support” phase, the manufacturing
process is translated into full scale process, and management focuses on the
improvements of the yield. The fourth phase of “refinement and verification” and the

22 PROCESS IMPROVEMENT DURING PRODUCTION RAMP UP
-Benjamin TARET- Linköping University
beginning of the last “production and support phase” described by O’Hara et al (1993)
are grouped into a period called “Ramp-up” by Terwiesch and Bohn, (1999).
According to them, the production ramp up corresponds to “the period between the
end of the production development and the full capacity utilization”. The
manufacturing process often does not work perfectly during the early time of the
production period and some adjustments are necessary to obtain full capacity
utilization. It constitutes a learning period for modifying the tools, the process and
developing new methods for reducing wastes etc... The most important variables
during this period are the production yield, speed and the quality of output.
4.1.2 LEARNING DURING RAMP UP According to Argote and Epple (1990) learning during ramp-up can be modeled by
“experienced curves”. This model is based on the observation that the production cost
of a unit falls at a decreasing rate. They provide a basic description of learning curves:
y = ax-b
Équation 1: Learning curves equation
(Source: Argote and Epple, 1990)
y is the number of direct labor hours required to produce the xth unit; a is the number
of direct labor hours required to produce the first unit; x is the cumulative number of
units produced and b is a parameter measuring the rate labor hours are reduced as
cumulative output increases.
Figure 13: Source of improvement
(Source: Terwiesch and Bohn, 1999)
Terwiesch and Bohn (1999) describe the same learning process. However, the authors
do not agree with this model which assumes that the learning during ramp up is
predetermined and beyond managerial control. Terwiesch and Bohn (1999) argue that
the learning process can be divided between “induced” and “autonomous” learning.
Figure 13 illustrate division in learning sources.

23 PROCESS IMPROVEMENT DURING PRODUCTION RAMP UP
-Benjamin TARET- Linköping University
Autonomous learning is defined as the sum of independent learning of each operator
and therefore is linked to the rate of production. Whereas this type of learning appears
without managerial control, induced learning is linked with conscious experimentation
on the production line. Arthur and Huntley (2005) highlight the same division of
learning between “autonomous” and “deliberate” learning and describe deliberate
learning as conscious process of “acquiring, codifying and transferring existing
knowledge within and between organizations”.
Figure 14: Effect of experimentation
(Source: Terwiesch and Bohn, 1999)
The authors argue that the importance of autonomous learning “is frequently
overestimated compared to the importance of controlled experiments”. Control
experimentation and the effectiveness of these experimentations are the key drivers of
learning, but the first drawback of experiments is the consumption of capacity which
could be used for normal production. Figure 14 shows this division of the capacity
between effective utilization and experimentation.
Arthur and Huntley (2005) propose another key driver for learning during ramp up.
According to the authors, the learning curves are not only influenced by experience but
also by “gainsharing”. Gainsharing is defined as the “deliberate transformation of tacit
employee knowledge into explicit organizational knowledge in the form of written
suggestions” and the implementation of these suggestions. In order to implement this
gainsharing system, the authors underline the importance of “group incentive
compensation plans” in order to stimulate employee’s improvement suggestions and of
the “delegation of authority to employees”.
In “Learning curves in manufacturing”, Argote and Epple (1990) propose other
possible causes for productivity evolution during this learning phase. The learning
curve may be also influenced by “Organizational forgetting”, employee turnover,
methodology for knowledge transfer and transfer of productivity gain between
contracts. “Organizational forgetting” occurs when employees forgot how to perform

24 PROCESS IMPROVEMENT DURING PRODUCTION RAMP UP
-Benjamin TARET- Linköping University
their task, because of a lack of process documentation for example, or when
employees leave the organization. The employee turnover has more impact in industry
in which the job is less standardized and if procedures for transferring knowledge to
new members do not exist.
To conclude,
The ramp-up phase is characterized by:
A huge evolution of the process in a short period of time
3 main parameters: production yield, speed and the quality of the output
It could be shortened by:
Organizing “deliberate”/ “induced” learning
Standardization and documentation of the process
4.2 PROBLEM SOLVING FRAMEWORKS
In order to improve the credibility of the analysis, four different problem solving
frameworks have been selected and compared: the well-known PDCA methodology
analyzed by Joyce (1995), the relatively new 8 steps problem solving methodology
(Purdy et al. ,2010), the seven rules of problems solving developed by Sims (2011)
and the systematic problem solving methodology developed by Sheu et al. (2010).
4.2.1 PDCA METHODOLOGY
The PDCA methodology, developed by Shewhart, refined by Deming and analyzed by
Joyce (1995) provides some basic framework for improvement. This framework for
incremental improvement is based on 4 steps:
“Plan” (establishing the fact, collecting the data,
identifying the root causes, developing solution), “Do”
(implementing the solution), “Check” (comparing the
progression and the plan, determining reason for the
deviation) and finally “Act” (correction actions if the
results do not meet the objectives, standardization the
successful solutions). Joyce (1995) emphasizes on the
importance of the last 2 steps to ensure the process
improvement. This methodology is iterative, it means that it must be done several time
for improving the process step by step.
4.2.2 8 STEPS PROBLEM SOLVING METHODOLOGY (PURDY, 2010)
Purdy et al. (2010) propose 8 steps problem solving methodology to ensure that the
improvements will fit the detected problem and will be successfully implemented. This
methodology is close to the PDCA methodology and can constitute an evolution of
this basic framework.
The first step is about how to identify and describe the most accurately the problem.
The authors recommend having a clear definition of the problem based on an
observation phase of the production line.

25 PROCESS IMPROVEMENT DURING PRODUCTION RAMP UP
-Benjamin TARET- Linköping University
The suggested framework is the “what? when? where? why? and how?” method for
problem description. Moreover, the authors recommend making the goal clear, concise
and measurable. In order to manage the improvement process, Purdy et al. (2010)
insist on the needed variety of skills in an improvement team and on the presence of
one coordinator. The second step is about implementing containment actions before
the implementation of the final solution. The third step is the analysis of the problem.
The authors underline the importance of identifying all possible causes before
selecting an improvement strategy. For this root-cause analysis, Shiba et al. (1993)
recommend using the 4 M framework (Man, Machine, Method, and Material) or the 4
P methods (People, Plant, Procedures, and Policies) explained in section 4.3.1. The
fourth step is the development and the selection of solutions. Purdy et al. (2010)
highlight the importance of developing several solutions for the same problem and
then selecting the best one. The fifth step is the implementation of the solution. The
authors recommend having a plan for each counter measure with a person in charge of
the implementation, a start and a targeted end date. The sixth step is the measure and
evaluation of effectiveness. The seventh step is the standardization of the process. The
last step is the recognition and sharing achievements. The first, second and fourth steps
correspond to the “PLAN” phase in the PDCA framework. The fifth and sixth steps are
quite similar to the “DO” and “CHECK” phases. The seventh step is linked to the
“ACT” phase.
The originality of this methodology, compared to a basic PDCA, is the fourth step
about the containment action, and the last step about recognition of the project
achievements.
4.2.3 SEVEN RULES FOR PROBLEM SOLVING (SIMS, 2011)
In his article “seven simple rules for problems solving” (2011), Daniel Sims underlines
seven mistakes often made by proposing guidelines for problem solving during
process improvement. The first advice is to identify clearly the problem before the
implementation of the solution. Without this clear identification, the solution may not
solve the root problem but only hide it during a short period of time. The second
advice is to avoid rejecting a possible cause without testing it out. Sims (2011) argues
that the first suggested cause is often the good one but is also often rejected because of
bias as “partiality to a supplier”, “protection of personal interest”, “failure to recognize
possible interaction of multiple factors” or “immediate dismissal of minor change to
the process as insignificant”.
The third common mistake is to jump directly to conclusion without testing and
analyzing the situation. The fourth proposed rule is to ensure that the detected cause is
really the root cause. This could be achieved by asking ”why?” for every proposed
causes in order to reach the lowest level of the causes. The fifth advice is a simple
methodology: replacing systematically a single component with a good one in order to
check if the component is a possible cause of the problem. If the problem seems to be
solved with a good component, the original one should be reinserted to check that the
problem effectively reappears. According to Sims (2011), this methodology is often
used but the last step of this methodology is also often forgotten. The sixth advice is
simple but useful: to analyze the changed parameters in case of a process that had
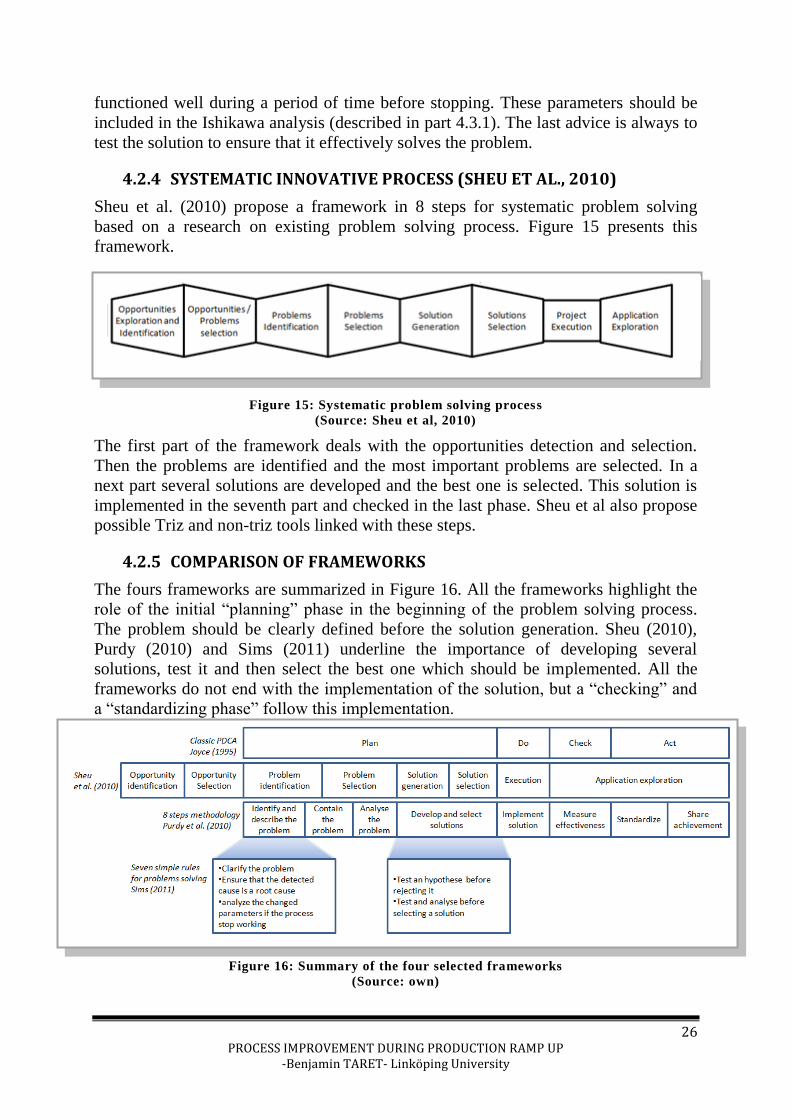
26 PROCESS IMPROVEMENT DURING PRODUCTION RAMP UP
-Benjamin TARET- Linköping University
functioned well during a period of time before stopping. These parameters should be
included in the Ishikawa analysis (described in part 4.3.1). The last advice is always to
test the solution to ensure that it effectively solves the problem.
4.2.4 SYSTEMATIC INNOVATIVE PROCESS (SHEU ET AL., 2010)
Sheu et al. (2010) propose a framework in 8 steps for systematic problem solving
based on a research on existing problem solving process. Figure 15 presents this
framework.
Figure 15: Systematic problem solving process
(Source: Sheu et al, 2010)
The first part of the framework deals with the opportunities detection and selection.
Then the problems are identified and the most important problems are selected. In a
next part several solutions are developed and the best one is selected. This solution is
implemented in the seventh part and checked in the last phase. Sheu et al also propose
possible Triz and non-triz tools linked with these steps.
4.2.5 COMPARISON OF FRAMEWORKS
The fours frameworks are summarized in Figure 16. All the frameworks highlight the
role of the initial “planning” phase in the beginning of the problem solving process.
The problem should be clearly defined before the solution generation. Sheu (2010),
Purdy (2010) and Sims (2011) underline the importance of developing several
solutions, test it and then select the best one which should be implemented. All the
frameworks do not end with the implementation of the solution, but a “checking” and
a “standardizing phase” follow this implementation.
Figure 16: Summary of the four selected frameworks
(Source: own)

27 PROCESS IMPROVEMENT DURING PRODUCTION RAMP UP
-Benjamin TARET- Linköping University
Based on these four methodologies, I tried to propose my own framework. Figure 17
proposes this framework which synthesizes these main steps for problems solving. VPI
methodology will be compared to this framework.
Figure 17: Proposed framework for problem solving
(Source: own)

28 PROCESS IMPROVEMENT DURING PRODUCTION RAMP UP
-Benjamin TARET- Linköping University
4.3 PROBLEM SOLVING TOOLS
Some of the tools cited in the previous problem solving frameworks have been
selected and their descriptions are developed in the following parts.
4.3.1 ROOT CAUSE ANALYSIS: ISHIKAWA DIAGRAM The Ishikawa diagram is one of the 7 quality tools. It helps to systematically identify
the possible root causes for a problem (Joyce, 1995).
Ishikawa proposes 4 categories for the causes in manufacturing industry (the 4M’s:
Manpower, Machine, Methods and Material). Joyce (1995) proposes 5 other categories
(the 5 Ps): Product, People, Plant, Process and Program. A diagram is drawn for each
problem, with arrows showing the possible causes in each category. An example of
diagram is presented in Figure 18. This diagram ensures the systematical inventory of
most of possible causes.
Figure 18: Ishikawa diagram
(Source: own)
4.3.2 TRIZ METHODOLOGY The Triz methodology has been developed by Altshuller (1999). This method aims at
solving technical problems. It structures the innovation by referring to a knowledge
base built from the analyses of approximately 2.5 million patents that are summarized
in a 40 contradiction principle and Triz matrix (Li et al., 2008).
For solving a specific problem, the Triz methodology refers to a generic class of
problems for which a generic solution exists through the Triz matrix (as represented in
Figure 19). Then this generic solution is specialized to find a solution for the specific
initial problem.

29 PROCESS IMPROVEMENT DURING PRODUCTION RAMP UP
-Benjamin TARET- Linköping University
Figure 19: TRIZ framework
(Source: Li et al., 2008)
A possible improvement means that a worsening engineering parameter (also called
avoiding degradation parameter, ADP) and an improving parameter (also called IP)
currently exist in the system. These simultaneous existences are called a
“contradiction”. In order to solve problems, these contradictions should be solved. 39
parameters have been identified by Altshuller, therefore 39*39 contradictions are
possible. These contradictions represent generic representations of problems. In the
same time, 40 inventive principles, which correspond to generic solutions, may be
associated with these contradictions. The Triz matrix represents the association of the
39*39 contradictions and the corresponding inventive principle (as represented in
Figure 20). An example of link between contradiction and inventive principle is
described in Figure 21. A specific solution for the problem could be found based on
the generic solution.
Figure 20: Triz matrix
(Source: Li et al, 2010)

30 PROCESS IMPROVEMENT DURING PRODUCTION RAMP UP
-Benjamin TARET- Linköping University
Figure 21: Example of link between contradiction and related inventive principle
(Source: Li et al, 2010)
4.4 FAILURE MODE AND EFFECT ANALYSIS
According to Liu et al. (2010), Failure mode and effects analysis (FMEA) is a
methodology for “defining, identifying and eliminating known and/or potential
failures, problems, errors and so on from system, design, process, and/or service
before they reach the customer”. This methodology is based on a prioritization of the
different failure modes. This prioritization is computed through the risk priority
number (RPN).
RPN = S* O *D
Équation 2: FMEA risk priority equation
(Source: Liu et al., 2010)
S is the severity of the failure,
O is the probability of the failure occurrence
and D is the probability of the failure being detected
The value of S, O, and D are based on a ranking on a 1-to-10 scale (appendix 2). The
failure modes are then classified based on the RPN.

31 PROCESS IMPROVEMENT DURING PRODUCTION RAMP UP
-Benjamin TARET- Linköping University
5 RAW DATA: VPI DESCRIPTION
-The aim of this part is to present the raw data for the case study. Based on the BT corporate
description and interviews, it describes VPI process, its objectives, framework and position in
BT production system –
5.1 VPI: A PART OF THE INDUSTRIALIZATIN PHASE -VPI Position in the New Product Manufacturing Process-
Figure 22 indicates the position of the VPI process within the new product
manufacturing process according to the steps described by O’Hara et al. (1993). The
VPI process is conducted during the “refinement and verification” phase. According to
O’Hara et al (1993), this phase aims at checking the production readiness which is
linked to 2 areas: “Manufacturability” and “Quality/reliability”.
The “ramp up” phase of the MI09 contract has begun in January 2010. In the
beginning of this period, the Methods department has organized the translation of the
engineering design of the trains into a feasible manufacturing process The process
documentation for operators has been written and the training of these operators has
begun. The end of the “ramp up” has been forecasted in August 2011 and the final
delivery of the last produced train has been forecasted for March 2019. This long ramp
up phase is consistent with the duration described by Terwiesch, R. E. Bohn (1999).
According to him ramp up can take to a quarter of the product lifecycle.
Figure 22: Position of the VPI process in the MI09 contract
(Source: own)
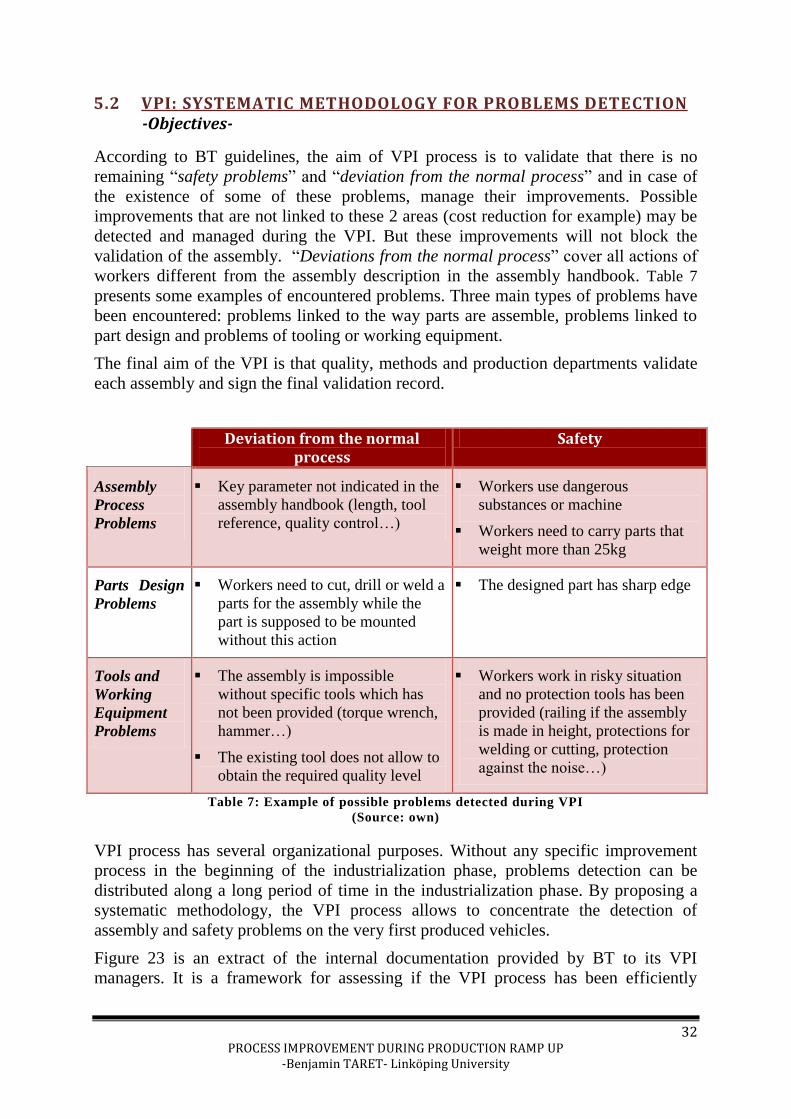
32 PROCESS IMPROVEMENT DURING PRODUCTION RAMP UP
-Benjamin TARET- Linköping University
5.2 VPI: SYSTEMATIC METHODOLOGY FOR PROBLEMS DETECTION -Objectives-
According to BT guidelines, the aim of VPI process is to validate that there is no
remaining “safety problems” and “deviation from the normal process” and in case of
the existence of some of these problems, manage their improvements. Possible
improvements that are not linked to these 2 areas (cost reduction for example) may be
detected and managed during the VPI. But these improvements will not block the
validation of the assembly. “Deviations from the normal process” cover all actions of
workers different from the assembly description in the assembly handbook. Table 7
presents some examples of encountered problems. Three main types of problems have
been encountered: problems linked to the way parts are assemble, problems linked to
part design and problems of tooling or working equipment.
The final aim of the VPI is that quality, methods and production departments validate
each assembly and sign the final validation record.
Deviation from the normal
process Safety
Assembly
Process
Problems
Key parameter not indicated in the
assembly handbook (length, tool
reference, quality control…)
Workers use dangerous
substances or machine
Workers need to carry parts that
weight more than 25kg
Parts Design
Problems
Workers need to cut, drill or weld a
parts for the assembly while the
part is supposed to be mounted
without this action
The designed part has sharp edge
Tools and
Working
Equipment
Problems
The assembly is impossible
without specific tools which has
not been provided (torque wrench,
hammer…)
The existing tool does not allow to
obtain the required quality level
Workers work in risky situation
and no protection tools has been
provided (railing if the assembly
is made in height, protections for
welding or cutting, protection
against the noise…)
Table 7: Example of possible problems detected during VPI
(Source: own)
VPI process has several organizational purposes. Without any specific improvement
process in the beginning of the industrialization phase, problems detection can be
distributed along a long period of time in the industrialization phase. By proposing a
systematic methodology, the VPI process allows to concentrate the detection of
assembly and safety problems on the very first produced vehicles.
Figure 23 is an extract of the internal documentation provided by BT to its VPI
managers. It is a framework for assessing if the VPI process has been efficiently

33 PROCESS IMPROVEMENT DURING PRODUCTION RAMP UP
-Benjamin TARET- Linköping University
managed. According these guidelines, the validation of the assembly should be
performed before the fourth vehicle for an “optimized” process.
Number of produced Vehicles
before the VPI closure
1- Out of control X > 10
2- Not completely
under control 5 < X < 11
3- Under control 3 < X < 6
4- Optimized X < 4 Figure 23: VPI objectives
(Source: BT, 2011)
Based on the interview of J. Lamulle and discussion with methods department
members, several benefits for this quicker detection have been identified:
Reducing the Ramp Up phase duration – An earlier detection of the problems
reduce the delay of the implementation of the solutions and therefore the period of
time before the full capacity utilization is reduced.
Reducing the number of impacted vehicles – A late detection of assembly problems
means that several vehicles had already been impacted by an assembly failure. These
produced vehicles will have to be modified later in order to repair this failures. So a
late detection of assembly problems means that more vehicles will have to be modified
later. This modification could represent a significant cost: if the vehicle has already
been completely assembled, it may require to disassembly a lot of existing parts in
order to access to the problematic area.
Reducing the Engineering and Methods departments’ costs – Improvement
management and design change require an engineering effort. By focusing on
problems detection in the beginning of the industrialization phase, it allows also to
concentrate the needed engineering work in the beginning. Therefore, it permits to
reduce the engineering and methods workload, and its cost, more rapidly.
Preparing the Client Validation of the process (IPA process) – Client validates the
assembly through a validation process called IPA. This process will be described in
part 5.3.4. Criteria for this validation are quite similar to those used during the VPI.
Therefore most of the problems should have already been detected and solved when
the client assessment is carried out on the assembly.
Improving visibility of the process maturity – VPI indicators based on the number
of existing and solved problems provide an indication about the process maturity and
visibility on the ramp up process.

34 PROCESS IMPROVEMENT DURING PRODUCTION RAMP UP
-Benjamin TARET- Linköping University
5.3 VPI: A PROCESS IN INTERACTION - Links with other processes during Production Ramp Up-
Several processes are used by BT during the Ramp Up period in order to validate the
design and production process. These processes, conducted by Methods, Engineering,
Quality and Production departments, are in interaction with the VPI process. Based on
the discussion with other departments’ members and internal BT guidelines, these
interactions are represented in Figure 24.
Figure 24: Links between VPI and other ramp up processes
(Source: own)
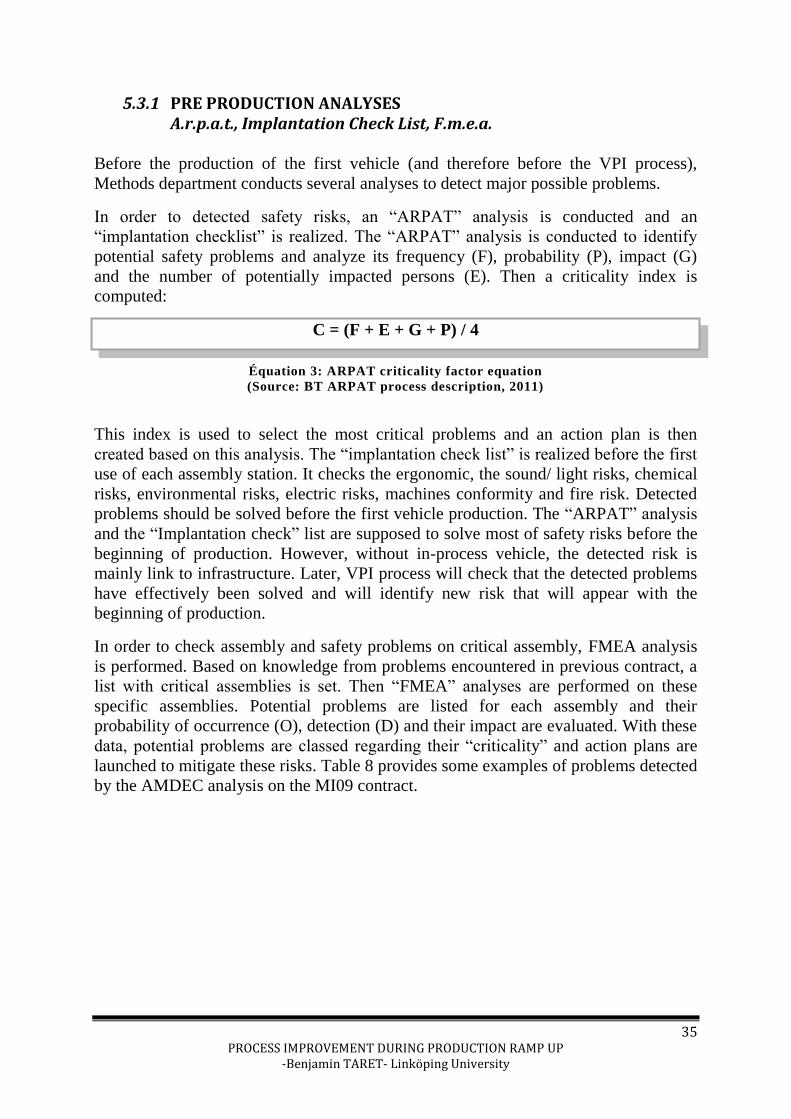
35 PROCESS IMPROVEMENT DURING PRODUCTION RAMP UP
-Benjamin TARET- Linköping University
5.3.1 PRE PRODUCTION ANALYSES A.r.p.a.t., Implantation Check List, F.m.e.a.
Before the production of the first vehicle (and therefore before the VPI process),
Methods department conducts several analyses to detect major possible problems.
In order to detected safety risks, an “ARPAT” analysis is conducted and an
“implantation checklist” is realized. The “ARPAT” analysis is conducted to identify
potential safety problems and analyze its frequency (F), probability (P), impact (G)
and the number of potentially impacted persons (E). Then a criticality index is
computed:
C = (F + E + G + P) / 4
Équation 3: ARPAT criticality factor equation
(Source: BT ARPAT process description, 2011)
This index is used to select the most critical problems and an action plan is then
created based on this analysis. The “implantation check list” is realized before the first
use of each assembly station. It checks the ergonomic, the sound/ light risks, chemical
risks, environmental risks, electric risks, machines conformity and fire risk. Detected
problems should be solved before the first vehicle production. The “ARPAT” analysis
and the “Implantation check” list are supposed to solve most of safety risks before the
beginning of production. However, without in-process vehicle, the detected risk is
mainly link to infrastructure. Later, VPI process will check that the detected problems
have effectively been solved and will identify new risk that will appear with the
beginning of production.
In order to check assembly and safety problems on critical assembly, FMEA analysis
is performed. Based on knowledge from problems encountered in previous contract, a
list with critical assemblies is set. Then “FMEA” analyses are performed on these
specific assemblies. Potential problems are listed for each assembly and their
probability of occurrence (O), detection (D) and their impact are evaluated. With these
data, potential problems are classed regarding their “criticality” and action plans are
launched to mitigate these risks. Table 8 provides some examples of problems detected
by the AMDEC analysis on the MI09 contract.

36 PROCESS IMPROVEMENT DURING PRODUCTION RAMP UP
-Benjamin TARET- Linköping University
Opération Détailled
opération Risks
Possible
Causes
Effect on Mitigation actions
Process Product
1 parts
reception
parts arrive
damaged
insufficient
protection
waste of
time
parts
damaged
A new transportation tool
should be design and be
validated during the first
assembly
2
mecanism
assembly
timing for
height
adjustability
after timing for
obtaining the
good height, a
second timing is
needed
the needed
height is not
obtained
waste of
time, 2
adjustme
nts
needed
Set a correction process which
considers the parts size, design
change?
3 mecanism
fixation
impossible
assembly
fixation plates
wrongly
positionned
waste of
time
change welding process of
fixation plates
Table 8: Examples of risks detected during AMDEC on the MI09 contract
(Source: own)
These analyses are precise but only based on previous experiences and focused on a
little number of selected assemblies. Later, the VPI process will check that these
detected risks have effectively been solved, and check that no other undetected
problem appears.
These 3 lists of potential risk (A.R.P.A.T., Implantation Check List and F.M.E.A.) are
used as entries for the VPI: during the VPI initial observation it should be checked that
these risks have effectively been mitigated. The biggest difference between these
processes and the VPI is that these processes are focused on possible future risks
whereas VPI is focused on actually existing assembly and safety problems. Moreover
ARPAT and implantation check list are focused on the production line infrastructure
assessment, whereas the VPI analyze the whole assembly process (infrastructure, tools
and production process).
5.3.2 ASSEMBLY HANDBOOKS Before the production of the first vehicle, methods department writes the assembly
handbook which contains all the assembly instructions for the workers on the
production line. This document is based on the drawings provided by engineering
department. These assembly handbooks are input data for the VPI process. It defines
the “normal process” from which deviations will be detected during the VPI.

37 PROCESS IMPROVEMENT DURING PRODUCTION RAMP UP
-Benjamin TARET- Linköping University
5.3.3 DESIGN FREEZE – Validation Of The Design This process is conducted by the Engineering department at the same time as the VPI
process. When an assembly is validated according to the VPI process, it is
theoretically free from any mounting or safety problems. And therefore, most of the
necessary design changes have been performed. The only remaining needed changes
would be linked to the reduction of the assembly costs.
Based on this idea, the engineering department has developed a “design freeze”
process. Figure 25 represents this process: when all assemblies in which a part is
involved are validated, the design of this part is “frozen”. It means that this design has
been validated and that any other change would have to pass a “cost/ benefit analysis”.
If an assembly linked to a part is not validated, the part design is not “frozen”. This is
the status of the part 2 in Figure 25. This part is linked to the assembly M1003 and
M1001. M1003 is not validated, therefore part 2 is not “frozen”. This design freeze
process allows having a clear view of the design maturity. When the designs of all the
parts are “frozen”, the ramp-up phase of the engineering department is considered as
finished, only improvements for reducing the cost may be remaining.
Figure 25: “Design Freeze” process
(Source: own)
Figure 26 represents the evolution (in percentage of the total design) of the “design
freeze” for the MI09 contract during the first year of the ramp up. The design parts
could have four different statuses:
Status 1 (Green) - design “frozen”: VPI records have been signed for all the
linked assemblies.
Status 2 (Blue): All the improvement points detected during the assemblies
have been solved, but the signatures of the VPI records are still missing.
Status 3 (Red): Some design modifications are still in process
Status 4 (Black): The assemblies have not been analyzed yet

38 PROCESS IMPROVEMENT DURING PRODUCTION RAMP UP
-Benjamin TARET- Linköping University
Figure 26: Design Freeze evolution for the MI09 Contract
(Source: BT, 2011)
5.3.4 IPA PROCESS – Client Assessment Of The Process The IPA process (or “First Article Inspection”) is an external validation conducted by
the quality department with the client once the assembly has been validated internally
with the VPI. This process is a validation of the assembly by the client, it checks that
the existing process ensure the expected level of quality.
An inspection of the assembly is made with the client and the quality, methods and
production managers. The detected problems are listed in an action plan and the
assembly is validated once all the problems are solved. Not all the assemblies are
studied by IPA process, only a small selection of assemblies agreed between the client
and Bombardier. Usually, a “pre-IPA” analysis is performed by the quality department
without the client in order to ensure that there is no remaining problem before the
client presentation. Figure 27 describes the chronology between VPI and IPA process.
IPA is quite close to VPI, but whereas IPA is client-oriented, VPI is more internally
oriented.
Figure 27: VPI and IPA process description
(Source: own)

39 PROCESS IMPROVEMENT DURING PRODUCTION RAMP UP
-Benjamin TARET- Linköping University
5.3.5 GAP - Continuous Improvement
GAP, which stands for « Groupe Autonome de Production » (or « Autonomous
Production Unit » in English), is constituted by production line workers (around 7 to
15 per GAP) with defined roles. It should contain one GAP manager, one Method
manager, one quality manager, one logistic manager and one safety manager. This
group is responsible for continuous improvement in its production area. Daily meeting
are organized to check all the problems encountered by the workers.
VPI aims at solving safety and assembly problems, but some improvement points that
are not linked to these areas could be also detected. These points do not come from an
error in the design or the industrialization of the product but are some opportunities to
reduce costs. If some of these improvements are detected during the VPI, the
corresponding action plan will be launched but their implementation will not block the
assembly validation. When all the safety and assembly problems will be solved and the
assembly will be validated, the management of the action plan for remaining
improvements will be transferred to the GAP as continuous improvement.
5.3.6 MEP PROCESS – Continuous Improvement
During the VPI, changes of design are always accepted because the production line
and the train design are in its assessment phase. After the VPI and design Freeze
validations, the train design is considered as mature. Therefore, any new changes have
to be justified by a cost/benefit analysis in order to be accepted by the Project
Department. This analysis is called “MEP”.

40 PROCESS IMPROVEMENT DURING PRODUCTION RAMP UP
-Benjamin TARET- Linköping University
5.4 VPI FRAMEWORK
A four pages document describing the VPI process framework is provided by
Bombardier transportation to its VPI managers. It describes the objectives, the actors
and the different steps of the VPI. Figure 28 describes this framework.
Figure 28: Description of VPI process
(Source: own)
5.4.1 BEFORE THE VPI – Planning and Team Building
A group is constituted before the beginning of the VPI process with a manager from
each affected department (production, quality and methods). A manager from the
methods department is designated to supervise the VPI process. A planning of the VPI
is prepared by this manager and sent to all the VPI team members.
5.4.2 OBSERVATION PHASE - Systematic Analysis
Each movement is observed once completely on the production line with all the VPI
group members. This observation should be done during the assembly of the first
vehicle on the production line. Based on this observation an analysis of the process is
made with the “met027” checklist composed of 119 questions. Every time the answer
of one of the questions is “no”, you should consider that there is a possible
improvement point.

41 PROCESS IMPROVEMENT DURING PRODUCTION RAMP UP
-Benjamin TARET- Linköping University
These improvements are then classified in 3 categories:
K1: VPI point that involves a safety problem or a situation that does not allow
to achieve the expected quality
K2: Deviation from the expected process (non- planned action is necessary to
obtain the expected quality)
K3: Improvement of the process
The purpose of the VPI process is to solve all the K1 and K2 problems to validate each
assembly. After the VPI closure, the remaining K3 will be transferred to the GAP (for
“Groupes Autonomes de production” or “Independent production groups” in English).
5.4.3 PLANNING AND IMPLEMENTING THE SOLUTION
The implementation of the solution is coordinated by the VPI manager. The planning
of the VPI and the implementation of the improvement are made through the
“MET13” and MET 16 files which are presented more in depth in the part 5.5. “VPI
documents”
5.4.4 AVM - Containing the problem
A process called AVM (for “Avis de modification” or “modification report” in
English) is used for solving temporarily a problem. Once the solution is selected, its
implementation can take several months. During the time frame between the detection
of the problem and the real implementation of the solution, the AVM process
organizes a “Retroactive change on the vehicles already partially or totally
assembled”. This process is initiated when the solution for the improvement has been
selected.
5.4.5 VPI CLOSURE – Assembly Process Assessed
When all the K2 and K1 points of a movement are solved and implemented on the
production line, the VPI for this movement is closed. This situation is validated with a
specific record that is signed by all members of the VPI team (Quality, Methods and
Production departments). The K3 that have not been solved during the VPI process are
transferred to the GAP.

42 PROCESS IMPROVEMENT DURING PRODUCTION RAMP UP
-Benjamin TARET- Linköping University
5.5 VPI DOCUMENTS
5.5.1 “MET27” CHECKLIST
The Met27 is a checklist for the analysis of each assembly. It contains 119 questions
that should be asked for checking the safety conditions, the quality control, the
industrial equipment and the technical documentation. This framework is based on the
5 aspects identified in an Ishikawa diagram: people, method, machines, material and
environment
Methods: Before the beginning of the process, the assembly process has been codified
into an “assembly notebook” written by the process engineers. This notebook contains
all the information the workers have to know to ensure that the quality level will be
obtained. The “met027” contains 33 questions to check that this documentation is clear
and enough precise to meet all the quality requirements.
Machines: The 59 questions of the “machine” part of the “met27” ensure that the tools
used by the workers are safe (conformity to CE norms, protection equipment,
ergonomics...), adapted for the expected quality level and controlled on a regular basis.
People: In this part, the ability of the workers for using the machines is checked.
Material: These 6 questions check the conformity of the material.
Environment: This section ensures that the environment is safe and adapted for the
workers, it contains 8 questions.
This checklist is printed and archived for each movement.
5.5.2 “MET13” FILE
This file is basically an action plan with a definition of the problem, a selected
solution, a person in charge of the implementation of the plan and a deadline. It is used
and managed by the VPI manager. The columns that should be filled are:
Problem definition: n° of assembly, name of the assembly, short definition of the
problem
Solution Implementation: short description of the solution, name of the person
currently responsible for solving the problem, forecasted ending date
State of the problem (open/closed)
Date for the closure of the problem
5.5.3 “MET16” FILE
The VPI manager uses this file to establish the planning of the VPI. It is supposed to
be sent to all members of the VPI team before the execution of the VPI. It is also used
for following the realization of VPI and validation of the assemblies
5.5.4 ENDING VALIDATION RECORD
This record contains all the detected problems with their priority level (K1, K2 or K3)
and a description of the implemented solutions with the date of implementation on the
production line. It is signed by all the VPI team members and archived.

43 PROCESS IMPROVEMENT DURING PRODUCTION RAMP UP
-Benjamin TARET- Linköping University
5.6 VISUALIZATION OF PROCESS MATURITY
Ramp up phase can constitute an important part of the production cycle. In order to
manage the global production system it is useful to be able to evaluate at which step of
the ramp-up the production process is located. The process maturity can be linked to
the number of assemblies that has been validated. One of the objectives of the VPI is
to improve the visibility of this process maturity. 3 Key Performance Indicators (KPI)
are used to illustrate this process maturity.
Figure 29 represents one of these indicators. It represents the status of each of the 144
assemblies assessed in “assembly line” for MI09 contract. 6 steps exist:
“Not started” - The assembly has not been observed yet. No information exists on
possible existing problems.
“VPI started” - The assembly has been partially observed, improvement points have
been detected but some aspects of the assembly still need to be observed.
“Analyzed” - The assembly has been completely observed. All improvement points
have been detected and corresponding change actions have been launched.
“To be checked” - All identified change actions should be finished. Their
implementation on the production line should be checked in order to ensure that the
problem is effectively solved.
“All problems solved” - All the identified problems have effectively been solved. The
ending record has not been signed yet.
“Validated” – The assembly has been validated through the signature of the ending
report.
Figure 29: KPI for VPI during MI09 contract
(Source: BT internal, 2011)
0
20
40
60
80
100
120
140
160
S35 S40 S45 S50 S03 S08 S13 S18 S23
Week number
Not started VPI started analysed to be checked all problems solved validated

44 PROCESS IMPROVEMENT DURING PRODUCTION RAMP UP
-Benjamin TARET- Linköping University
Figure 30 represents the second KPI for MI09 contract. It shows the evolution of
unsolved K1 and K2.
Figure 30: KPI for open K1 and K2 during MI09 contract on assembly line
(Source: BT internal, 2011)
The last KPI is shown in Figure 31. It represents the number of validated assembly and
remaining problems for all the parts of the MI09 production line (Assembly line,
Carbody, Painting and Test sections)
Figure 31: KPI for VPI for all Parts of the MI09 Production
(Source: BT internal, 2011)
0
20
40
60
80
100
120
140
160
s39 s44 s49 s02 s07 s12 S17 S22
K1 open
K2 open
85% 83%
92%
78%
2 0 1 1 21 40 18 1 10 0 1 2
308
45 23 27 0
50
100
150
200
250
300
350
70%
75%
80%
85%
90%
95%
Assembly line Carbody Painting Test
% validated assemblies
K1 open
K1 solved
K2 open
K2 solved
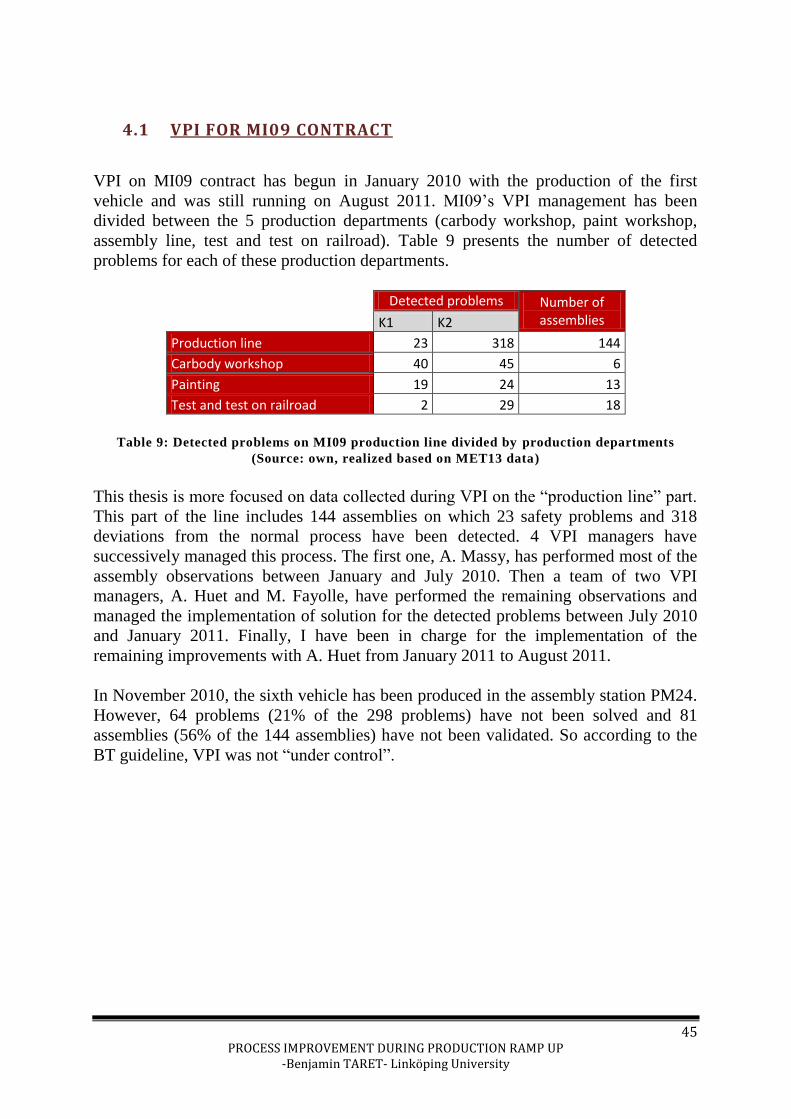
45 PROCESS IMPROVEMENT DURING PRODUCTION RAMP UP
-Benjamin TARET- Linköping University
4.1 VPI FOR MI09 CONTRACT
VPI on MI09 contract has begun in January 2010 with the production of the first
vehicle and was still running on August 2011. MI09’s VPI management has been
divided between the 5 production departments (carbody workshop, paint workshop,
assembly line, test and test on railroad). Table 9 presents the number of detected
problems for each of these production departments.
Detected problems Number of assemblies
K1 K2
Production line 23 318 144
Carbody workshop 40 45 6
Painting 19 24 13
Test and test on railroad 2 29 18
Table 9: Detected problems on MI09 production line divided by production departments
(Source: own, realized based on MET13 data)
This thesis is more focused on data collected during VPI on the “production line” part.
This part of the line includes 144 assemblies on which 23 safety problems and 318
deviations from the normal process have been detected. 4 VPI managers have
successively managed this process. The first one, A. Massy, has performed most of the
assembly observations between January and July 2010. Then a team of two VPI
managers, A. Huet and M. Fayolle, have performed the remaining observations and
managed the implementation of solution for the detected problems between July 2010
and January 2011. Finally, I have been in charge for the implementation of the
remaining improvements with A. Huet from January 2011 to August 2011.
In November 2010, the sixth vehicle has been produced in the assembly station PM24.
However, 64 problems (21% of the 298 problems) have not been solved and 81
assemblies (56% of the 144 assemblies) have not been validated. So according to the
BT guideline, VPI was not “under control”.

46 PROCESS IMPROVEMENT DURING PRODUCTION RAMP UP
-Benjamin TARET- Linköping University
4.2 VPI: AN EVOLVING PROCESS -Evolution between contracts-
The interview of J. Lamulle has provided insight about the history and evolution of
VPI process. VPI is a young process, it has been used in only 4 contracts and this
process has evolved between each contract as described in Figure 32
Figure 32: VPI evolution through the different contracts
(Source: own)
During the MF2000 and NAT contracts, VPI has not been launched on the very first
produced vehicles but after a preproduction. Figure 33 shows the evolution of VPI on
the NAT contract. The figure indicates the number of validated assembly and observed
assembly versus the vehicle number. Most of the assemblies have not been observed
before the twentieth vehicle. Some drawbacks had occurred with this strategy. The
first problem was that the improvement points have been detected very late and
therefore the implementation was delayed and the number of vehicle to modify
because of a wrong design was high. The second problem, and maybe the most
important one, was the involvement of the method team in the VPI. When the VPI was
launched, there were vehicles in process at each assembly station. Therefore, at this
time the work of the method team was already distributed all along the production line
and it was quite hard to have a focus just on the VPI process.
In order to compensate these drawbacks, it has been decided on the MI09 contract to
launch the VPI on the very first vehicle and to follow this vehicle. With this strategy, it
was possible reduce the detection time of the assembly problem. Moreover, for this
contract the VPI checklist has been created to ensure that all the possible existing
problems have been detected. As described in Figure 33, whereas 80% of the
assemblies were validated after 60 vehicles, this percentage was reached after only 20
vehicles in the MI09 contract.

47 PROCESS IMPROVEMENT DURING PRODUCTION RAMP UP
-Benjamin TARET- Linköping University
Figure 33: Evolution of the VPI VS the n° of vehicle for the NAT and MI09 contracts
(Source: BT internal, 2011)
For the Regio2n contract, the last launched contract, it has been decided to produce
only one vehicle and to follow this vehicle all along its progression through the
assembly station. No other vehicle will be produced before this first one will arrive at
the last assembly station. This solution enables to concentrate the effort of the entire
VPI team (methods, quality, engineering and production managers) on this vehicle,
and ensure the detections and solving of all industrialization problems before the
production of the second vehicle. Moreover a new “Access” database has been created
to manage all the VPI actions plans of the contract. This database uses a user-friendly
interface which allows to be used by several managers in the same time and generate
automatically the KPI.
0%
20%
40%
60%
80%
100%
120%
1
12
23
34
45
56
67
78
89
10
0
11
1
12
2
13
3
14
4
15
5
16
6
17
7
18
8
19
9
21
0
22
1
23
2
24
3
25
4
26
5
27
6
28
7
29
8
30
9
32
0
33
1
MI09 -Assemblies validated NAT - Assemblies validated
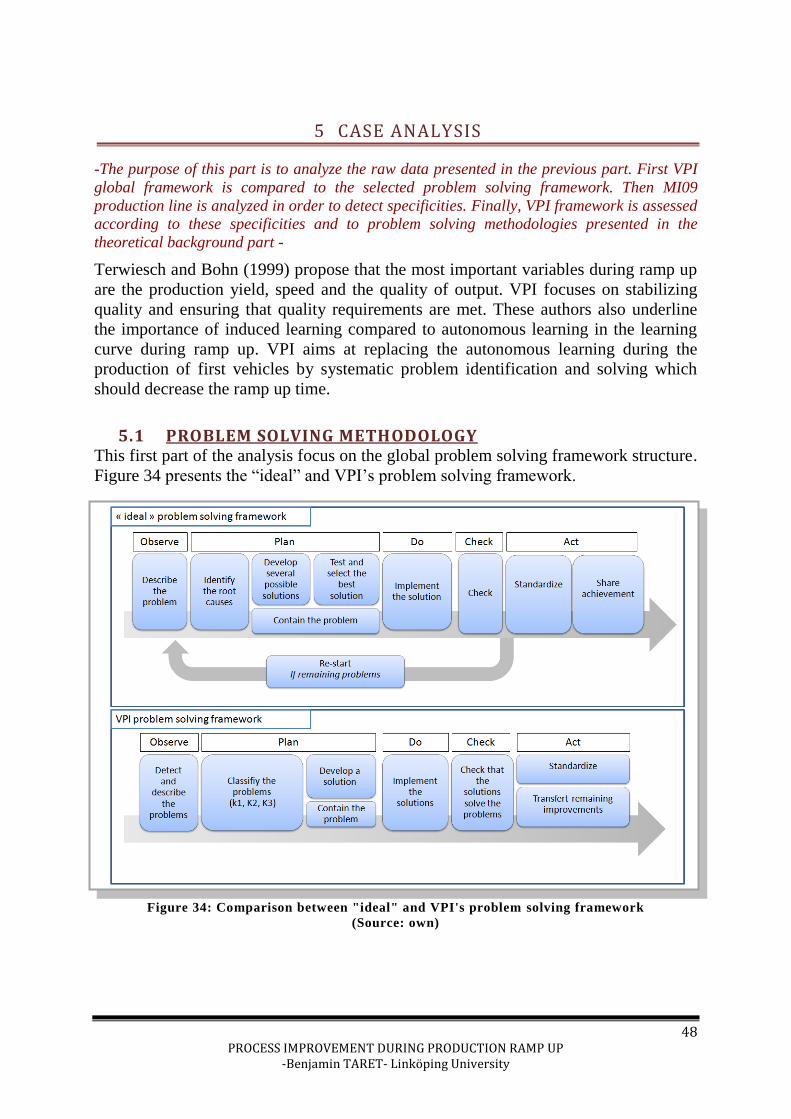
48 PROCESS IMPROVEMENT DURING PRODUCTION RAMP UP
-Benjamin TARET- Linköping University
5 CASE ANALYSIS
-The purpose of this part is to analyze the raw data presented in the previous part. First VPI
global framework is compared to the selected problem solving framework. Then MI09
production line is analyzed in order to detect specificities. Finally, VPI framework is assessed
according to these specificities and to problem solving methodologies presented in the
theoretical background part -
Terwiesch and Bohn (1999) propose that the most important variables during ramp up
are the production yield, speed and the quality of output. VPI focuses on stabilizing
quality and ensuring that quality requirements are met. These authors also underline
the importance of induced learning compared to autonomous learning in the learning
curve during ramp up. VPI aims at replacing the autonomous learning during the
production of first vehicles by systematic problem identification and solving which
should decrease the ramp up time.
5.1 PROBLEM SOLVING METHODOLOGY This first part of the analysis focus on the global problem solving framework structure.
Figure 34 presents the “ideal” and VPI’s problem solving framework.
Figure 34: Comparison between "ideal" and VPI's problem solving framework
(Source: own)

49 PROCESS IMPROVEMENT DURING PRODUCTION RAMP UP
-Benjamin TARET- Linköping University
OBSERVE- Identify and Describe the Problem During the VPI process, the team is composed by a manager from various
departments. This procedure offers the required large variety of skills. The coordinator
of this team is the VPI manager which a member of the methods department. This
situation is close to the advice given by Kathleen Purdy et al (2010). There is no
advice in the VPI framework about how to define the problems and the solutions.
Moreover, in the “Met13”, problem definition and cause analysis are not separated.
This situation could create confusion between the different members of the team about
how to solve the problems. Moreover, in the case of the VPI process for the MI09, the
improvement process has been managed by 4 different managers consecutively.
During the change of manager, the understanding of the list of problems became
difficult when it has not been defined in a clear way. The utilization of the “what?
When? Where? Why? And how?” method to describe the problems can solve this
confusion (Purdy, 2010). Shiba (1993) recommends defining the problem with its
consequences and avoiding defining it with it. No specific recommendation is made in
the VPI process about this point, and a lot of problems seem to be defined with their
potential causes as a definition.
PLAN -Analyze the Problem, develop and select the best Solutions During the VPI process, no specific tools are used for identifying the causes.
Therefore, nothing is made to ensure that the identified cause is really a root cause as
proposed by Sims (2011) in its fourth rule. Moreover, only one cause is often studied
for each problem. This framework is in contradiction with the second rule of Sims
(2011) which underlines the importance of testing each hypothesis before selecting the
most probable cause. This choice for the VPI framework may be explained by the
relatively simple problems that are present in the beginning of the industrialization
process, some solutions could seem to be quite easy to figure out and the use of a
systematic methodology is often considered as a waste of time. Even if this system
could work for some of the easiest problems, a systematic methodology (like a
fishbone diagram or the methodologies 4P and 4M recommended by S. Shiba et Al.
(1993)) could be an improvement for solving the most complicated problems.
Moreover it may ensure that all the existing causes are effectively suppressed. During
the VPI process often only one solution is developed for each problem. This could be
linked to the high number of problems managed during the same time. For the interior
equipment VPI, more than 600 improvement points have been identified (related to
144 movements). Most of encountered problems are simple, therefore one solution
scenario is often enough. Finally, the “Problem Containing” step can be linked to the
AVM process. Short term actions are taken to contain the problem before the
implementation of the solution
IMPLEMENT Kathleen Purdy recommends a plan for each counter measure with a person in charge
of the implementation, a start and a targeted finish date. For the VPI process, this
information is contained in the “MET013” file which is used for following the
implementation of the improvements.

50 PROCESS IMPROVEMENT DURING PRODUCTION RAMP UP
-Benjamin TARET- Linköping University
CHECK For the VPI process, the checking phase is done by the VPI manager before the
signature of the record for the movement. The VPI is closed only when the problems
detected during the initial observation are solved. The VPI framework does not
recommend any specific closure observation for checking that no un-detected
problems have appeared. Maybe an observation with all the VPI team before the
closure may ensure that all the solutions have been successfully implemented and that
no hidden problems have appeared after the initial observation.
ACT- Standardize the process and recognize and share Achievement The good practices, which are written in an “assembly book”, are modified to fit to the
modification implemented during the VPI process. Moreover, during the VPI, these
handbooks are checked in order to ensure that all the critical parameters are effectively
described. Nothing seems to be prepared for recognizing or sharing achievement once
the VPI is ended on a movement.
To conclude, Based on the analysis of the global VPI framework, the main drawbacks of VPI global
framework may be the:
- Lack of framework for problem definition
- Absence of root cause analysis
- Lack of checking phase
- Non iterative process
- Absence of achievement recognizing and sharing
The next sections will develop the impact of these drawbacks.
5.2 SPECIFICITIES OF PRODUCTION LINE
Train production line has specific characteristics which differ from the mass
production. This industry could be classified somewhere between mass production and
job shop production systems. Therefore improvement process should be designed to
meet these specificities. Four main characteristics of the MI09 production line have
been identified, based on observation of the production line and interviews.
Needed Reactivity - Low production volume 130 vehicles will be produced for the MI09 contract. This number of vehicles is quite
small compared to production series for example in the automobile industry. In 2011
more than 1 million vehicles has been produced for the Yaris contract at Toyota.
Therefore few vehicles are available for detecting and analyzing the problem and
testing the different solutions. This situation requires that the initial VPI improvement
phase should be finished after fewer produced vehicles compared to other industries.
The objective given by the internal documentation for the VPI process is to close this
VPI phase before the fourth vehicles.

51 PROCESS IMPROVEMENT DURING PRODUCTION RAMP UP
-Benjamin TARET- Linköping University
Process Inertia - Long assembly time The throughput on a train production line is quite small compared to the throughput in
automobile manufacturing process for example (1000 vehicles per days are
manufactured at Toyota in its plant in Valenciennes according to Toyota’s website).
For the MI09 contract, the targeted throughput is two vehicles per week. Most of the
improvement methods begin with an observation phase. This small throughput makes
the observation phase more complicated: the observation of each movement is long
and difficult to follow; some assemblies can cover up to 2 days. Because of this long
observation time, it is difficult to observe several time the same assembly process for
the validation. Therefore, the VPI process should be designed to ensure that most
improvement points can be detected with single observation.
Moreover, with this throughput only one vehicle per week is available for testing an
improvement solution during the beginning of industrialization phase and the needed
time for the implementation of a solution sometimes require up to 4 or 5 months.
Therefore, the VPI process should be designed with the minimal number of needed
experimentations in order to select efficiently the best solutions for solving the
problem.
System Complexity - High potential of assembly problems
The vehicles produced by Bombardier are complex systems that could be classified as
an “array” by Shenhar (1995). These types of systems are made by the assembly of a
high number of interacting subsystems. This high number of interacting sub systems
may create a lot of potential assembly problems. For example, more than 500
improvements points have been discovered during the interior assembly VPI in the
MI09 contract. Therefore the VPI process should be designed to detect systematically
and deal efficiently with this high number of potential improvements.
Process Variability - Non-automated production line
In the MI09 contract, the carbody is made by huge steel parts and the tolerances of
these parts are high. Because of this variability in the structure, the workers have to
realize a lot of assembly adjustments for the assembly of the interior equipment. The
work is not repetitive and is closer to handwork. Moreover, trains are highly
customized products. For example, for the MI09 contract 2 different types of trains
should be produced. Each train is composed of three different vehicles. So, in total 6
different types of vehicles should be produced. Because of this high customization
associated with a lot of needed adjustments, a high complexity and low production
volume, the automation of manufacturing process would be difficult and expensive.
Therefore, trains production lines use few robots and the assembly is mainly made by
workers. For example, the production line of MI09 is completely non-automated.
Because of the needed adjustments, only the most important steps of the assembly can
be standardized in the assembly book in order to leave enough freedom to the worker
to adapt his work to the situation.
Figure 34 presents the theory developed by Shiba et al. (1993) According to him, the
level of standardization should be adapted to the process.

52 PROCESS IMPROVEMENT DURING PRODUCTION RAMP UP
-Benjamin TARET- Linköping University
An increase in the standardization will improve the efficiency in the beginning, but too
much standardization could have drawbacks by making the work process rigid.
Therefore, only the most important steps of the assembly should be standardized in the
assembly book in order to leave enough freedom to the worker to adapt his work to the
situation.
Figure 35: Effect of standardization on efficiency
(Source: SHIBA, 1993)
This situation creates a learning phase in the beginning of each contract in order to
realize the first vehicles. During this learning phase, the production line is not stable
and the working methods considerable change over time. Despite this needed
freedom, the assembly handbook should ensure that the working knowledge will be
kept even if the workers leave. Nevertheless, this freedom given to the workers for
accomplishing their job can also act as a “filter” for the detection of problem.
For example: workers, that are annoyed in their work by a little welded part that have
been wrongly positioned, can change the position of this part and weld it in the good
position without signaling it. Without a good problem detection system, this problem
will not be detected.
VPI process should be designed in order to take into account this process variability in
order to avoid undetected problems.
5.3 LINKS WITH THE PROBLEM SOLVING PROCESS
These four main specificities may impact the problem solving process. Based on the
observation of the production line and interviews, possible requirement on the problem
solving process are proposed and described in
Figure 36. In order to be adapted to the MI09 production line, VPI framework should
meet these requirements. This table will be used in the following sections to analyze
VPI framework according to MI09 production line specificities

53 PROCESS IMPROVEMENT DURING PRODUCTION RAMP UP
-Benjamin TARET- Linköping University
Figure 36: Links between production lines specificities and problem solving process
(Source: own)
5.4 NEEDED REACTIVITY – low production volume
Because of the little production volume, there is a high pressure for reducing the
ramp up duration. Problem detection and solving should be made on the very first
vehicles in order to reach the full capacity utilization as fast as possible. The objective
given by Bombardier for the closure of the VPI process is to finish this improvement
phase before the fourth vehicle in order to have an “optimized” process. This objective
is consistent with the little number of vehicles produced during the contract and the
time pressure on the improvement phase. However in reality, for the MI09 contract, 22
on the 144 existing VPI were not closed in January 2010 after the 24th
vehicle.
Figure 37 represents possible causes of loss of reactivity that could impact some of the
steps of problems solving framework. The main causes of delays are undetected
problems in the initial observation phase, the lack of involvement of the others
departments in VPI process and the normal treatment timeframe. These causes are
developed in the following sections.

54 PROCESS IMPROVEMENT DURING PRODUCTION RAMP UP
-Benjamin TARET- Linköping University
Figure 37: Possible causes of loss of reactivity during VPI for MI09 contract
(Source: own)
5.4.1 OBSERVE: UNDETECTED PROBLEMS A short ramp-up requires that all the improvement should be detected as early as
possible. A delay in the detection will directly impact the final validation of the
assembly. The description of the VPI process recommends an observation only phase
in the beginning of the VPI. The short improvement time for the VPI Process require
that all the improvement points should to be detected during this observation in order
to validate all the movements before the fourth vehicles.
Based on the detection date for each problem contain in the MET13 of MI09 contract,
Figure 38 has been created. According to the VPI planning, most of the initial
observations have been performed between January and September 2010. However, it
seems that some problems have been detected after September 2010.
Figure 38: Detected problems during MI09 contract VS time
(Source: own, realized based on MET13 data)
0
20
40
60
80
100
120
140

55 PROCESS IMPROVEMENT DURING PRODUCTION RAMP UP
-Benjamin TARET- Linköping University
Informal interview with a VPI manager has also underlined the impact of problems
undetected, during initial observation phase, on the delay of VPI. Based on this
observation, the hypothesis H1 has been formulated:
H1: Problems undetected during the initial observation phase is a cause of the delay
in VPI realization.
In order to evaluate the number of undetected problems during the first observation,
detection date of each problem has been compared to the initial observation date
contained in the MET13. The result of this analysis is presented in Figure 39.
According to these results, 43% of the improvements have not been detected during
the initial observation. The remaining problems have been detected by the production
department and given to the methods departments. The delay in the detection of these
problems directly impact the duration of the ramp up phase. Therefore, the hypothesis
H1 is validated and the delay due to this cause may be evaluated between 1 to 10
months and may impact up to half of the detected problems.
Figure 39: Detected problems on the MI09 contract
(Source: own, realized based on MET13 data)
Based on the observation of the VPI process, some possible explanations for this delay
in the detection are proposed:
Production line analyzed during a non-stable phase
The aim of the VPI process is to validate all the movement before the 4th vehicle
produced. During this early period, the operators are not completely formed for each
movement and therefore the production line is not completely stable and evolves a lot
during the first vehicles. The production lead time at each assembly station was up to
12 days for the first vehicle in august 2011 and then drop to 6 days in January 2011.
Moreover, Massy (2010) explains in his report that, during the VPI on the assembly
station n°18 and 19 the movements were in a “deteriorated way”. It means that the
assembly was not performed as it was planned because of the lack of equipment.
Therefore, the way people work has changed a lot during this initial phase and these
evolution of the work may have hide some possible problems that has appeared later.

56 PROCESS IMPROVEMENT DURING PRODUCTION RAMP UP
-Benjamin TARET- Linköping University
Most critical problems can hide the others
During the observation, the VPI team may be focused on the most critical problems
and forget some less important problems. These less critical problems tend to be
signaled only when the most important are solved.
No formal system to communicate the problems after the observation
In VPI process, no formal system exists to communicate the problems that have not
been detected during the observation phase. This kind of information is only accessible
informally through the GAP reports or the quality controllers. Even if the VPI
managers may access this information informally, no there formal links between
problem during GAP meeting and VPI has been included in VPI official framework.
Non-observed assemblies
In the beginning of the VPI, between January to July 2010, only one was responsible
for all VPI on the “assembly line” part for the MI09. Most of the observations have
been performed during this period of time. The duration of assemblies could be quite
long: it may vary between 10 minutes to several days. Moreover, several assemblies
are performed in the same time in the same vehicle. Therefore, it is quite difficult for a
manager alone to observe all the assemblies on the first vehicle. According to the
interview of J. Lamulle, it has been decided to not observe completely all assemblies:
some assemblies have been partially observed and non-observed problems have
collected by discussing with production responsible during GAP meeting. Some of the
undetected problems may come from this non-observed part of the assemblies.
5.4.2 OBSERVE: LACK OF INVOLVEMENT OF OTHER DEPARTMENTS Based informal interviews with VPI managers and within Methods departments; it
appears that involvements of other departments may be a cause of the delay of
problem detection. Based on this observation, H2 has been formulated:
H2: Lack of involvement of other department is a cause of the delay in VPI realization.
Even if Quality and Production Departments are supposed to be involved in the VPI
process in the same way as the Method, in reality they are mainly involved in the first
observation and during the ending validation. According to the VPI coporate
framework, the only formal responsibilities of Production and Quality department are
the initial observation and the final validation. According to the MET27checklists,
which are supposed to be signed by all the present managers, quality and production
managers have not attend to most of the initial observations. For the final validation,
all managers have to sign an ending record to assess that there are no remaining K1
and K2 problems. These two departments do not receive any counterpart from this
signature. Therefore they are often reluctant to sign the final report and begin to be
committed to signal possible improvements only at this moment.
This confirms the lack of involvement of other departments and hypothesis H2.
However, it is hard to evaluate exactly the delay which results from this cause. A
better involvement of the Production and Quality departments in the detection of the
problems before the end of the VPI may reduce the number of undetected problems.
IPA process, which is managed by the quality department, is close to VPI and

57 PROCESS IMPROVEMENT DURING PRODUCTION RAMP UP
-Benjamin TARET- Linköping University
therefore a link between these two processes may enhance the involvement of quality
department.
5.4.3 IMPLEMENT: LONG TREATMENT TIME FRAME The VPI is closed only when the improvement is implemented on the production line.
Therefore, even if the analysis and the definition of the solution are made in a short
timeframe, the implementation of the solution can take several months. In order to
reduce the ramp up phase, the time required for the implementation of the solution
should be should be as little as possible. During the informal interview of VPI
managers, one of the proposed causes of delay was the normal treatment time frame
for problem implementation. Based on this observation, hypothesis H3 has been
proposed:
H3: The normal treatment time frame is a cause of the delay in solution
implementation.
Based on the problem definition contained in the MET13 file for MI09 contract, four
main types of problems have been identified:
Change in the Assembly Process: Some improvements are linked to some little
change in the assembly process. (Change in the order of assembly, adding some
missing assembly instruction...). It often results in minor change in the “assembly
handbook”. This kind of changes can be implemented in a short time.
Change of Tools: Some of the improvements could also require a specific tool. This
change process includes a design of the tool, an approval of the budget and then the
realization of the tool. This kind of changes usually takes two or three month
depending on the complexity of the tool.
Change of Design: Some of the improvements require a change in the design of an
equipment part. This kind of change usually requires one month for the engineering
design and two to three months for the purchasing and the implementation of this
modified part. It means that at least 3 months will be necessary between the choice of
the solution and the observable improvement on the production line.
Change in an Outsourced Design: For most of the equipment parts, the design is
made by the Bombardier engineering department and then the design is send to the
suppliers for the production of the parts. However, some of the engineering designs are
outsourced and made by the supplier itself. For this kind of parts, the change of design
follows a specific process.
Mean time before closure has been computed from MET13 file for the longer of these
changes and listed in Table 10.

58 PROCESS IMPROVEMENT DURING PRODUCTION RAMP UP
-Benjamin TARET- Linköping University
Detected
problems (on a total of
621
problems)
Related
Assemblies (on a total of
144
movements)
Minimum time
before closure
Real Mean
time before
closure (in days)
Delay (compared to
the objective)
Design
modification
215 79 90 to 120 days
(3 to 4 months) 118
4 weeks
34,68% 57,66%
Tools
modification
28 22 60 to 90 days
(2 to 3 months) 94
4,52% 16,06% 2 weeks
Outsourced
design
17 11
88
2,74% 8,03%
No delay
Table 10: Treatment time for problem solving on MI09 contract
(Source: own, realized based on MET13 data)
The lead time for the production of the first vehicles was 2 weeks. A Process “under
control” (as it is defined in the VPI documentation) should close all the VPI before the
fourth vehicle; it means that all the improvement should be implemented within 12
weeks (84 days). This objective is structurally quite difficult to achieve in case of a
design or tools modifications. During the MI09 VPI, 73% of the assembly movements
were affected by at least one design or tool modification. It means that there were at
least 73% of the VPI that could not be closed within the objective of 6 vehicles. This
analysis validated the hypothesis H3.
NEEDED REACTIVITY - To conclude,
Observe
- Only one observation does not seem to be enough to be consistent with the time
pressure on the detection of all the problems. Even if the MET27 framework
helps to systematically detect the problem, un-detected problems often appeared
after the first observation Maybe a formal system to gather direct feedback
from workers on each vehicle and not only during the observation phase can
improve the process.
- A better involvement of the other department before the end of the VPI process
may enhance the motivation for the problem detection, and reduce the number
of un-detected problems. This could be achieved by
Implement
- For most of the detected problems in the MI09 project, the objective of closing
the VPI after the fourth vehicle is structurally very difficult to achieve because
of the required minimum time for the implementation of the selected solutions.

59 PROCESS IMPROVEMENT DURING PRODUCTION RAMP UP
-Benjamin TARET- Linköping University
5.5 SYSTEM COMPLEXITY- Lot of potential assembly problems
Because of the high complexity of the train and the huge number of interacting
subsystems, lot of potential problem can appear during the industrialization phase. VPI
framework should be designed in order to avoid undetected problems and deal
efficiently with this high number of action plans. Figure 40 indicates the specificities
of VPI framework that are linked to its capacity to deal with the production line
complexity.
Figure 40: Complexity
(Source: own)
5.5.1 OBSERVE: SYSTEMATIC METHODOLOGY FOR DETECTION According to its corporate description, VPI is a systematic framework for problems
detection. Based on this assertion, hypothesis H4 has been formulated:
H4: VPI offers a systematic methodology for problem detection
The VPI is based on the “met027” form with the 5 Ishikawa areas. The 119 questions
allow analyzing each movement in a systematic way and in a short period of time.
Table 11 presents the type of detected problems. For the “assembly line” part of the
MI09 contract, 635 problems have been detected on the 144 assemblies. In respect to
this high number of problems detected, “MET27” checklist seems to be adequate for
the problems detection, and hypothesis H4 is validated.
K1 - Safety K2 - Deviation from normal process K3 - Process Improvement
23 319 271 Table 11: Number of problems detected during VPI
for "Assembly line "part of the MI09 contract
(Source: own)

60 PROCESS IMPROVEMENT DURING PRODUCTION RAMP UP
-Benjamin TARET- Linköping University
VPI tools seem adapted to the complexity of the train production, but does this
framework really ensure that no problems will remain undetected? This question is
answered is the following sections
4.1.1 PLAN: SAME LEVEL OF ANALYSIS FOR ALL PROBLEMS As it has been explained previously, during the VPI process no specific tools are used
for checking the root causes and only one possible solution is found for each problem.
This kind of problem solving is suitable for relatively simple problems which
constitute a huge part of the VPI improvements. However, some of the problems are
too complex for being solved in this simple way and nothing is recommended in the
VPI process for this kind of problems. For these complex problems, the root causes are
difficult to figure out, and if the solution does not really solve the root causes, it will
cause delay in the solution of these problems. Therefore these kinds of problems often
are the bottlenecks for the validation of the movement and may result in delays for the
VPI validation .Errors in the implementation of the solution will directly impact the
final date for the validation of the movement. However, it is not possible to evaluate
precisely the impact of this cause on the delay.
4.1.1 CHECK: PROBLEMS UNDETECTED AFTER THE VPI CLOSURE Because of the high number of potential assembly problems, there is a potential of
“forgetting” to solve some problems. However, there is no final checking phase at the
end of VPI. Nothing is made to ensure that there are no remaining problems after VPI
closure. This is in contradiction with the theory described in part 4.2.5 which
highlights the importance of the final “check” phase. Based on this observation,
hypothesis H5 has been proposed:
H3: The absence of final checking during VPI results in problems undetected after the
VPI validation.
VPI and IPA are supposed to have a similar framework and are supposed to detect the
same types of problems. Therefore, if all the assembly and safety problems have
effectively been detected and solved during the VPI phase, no problems should be
detected during the IPA.
Figure 41: Detected problems with VPI, pre –IPA and IPA during the MI09 contract
(Source: own)
37 59
31
90 39 2
18
20 4
12
1
13
0
20
40
60
80
100
120
140
VPI pre-IPA IPA Total IPA - pre IPA
k1 - safety
k2 -assembly
k3 - improvements

61 PROCESS IMPROVEMENT DURING PRODUCTION RAMP UP
-Benjamin TARET- Linköping University
However, reality seems a little bit different from the theory. For the MI09 contract,
only 15 assemblies have been analyzed by the IPA, compared to the 144 assemblies
analyzed by VPI. Based on the Met 13 data and on the IPA data, Figure 41 compares
the number and type of problems detected during VPI, IPA and Pre-IPA. 20 K2
(assembly problems) and 13 K1 (safety problems) have been detected in total through
a pre-IPA observation and the final IPA validation. In comparison, 39 K2 and 4 K1
have been detected and solved for the same assemblies during the VPI.
Problems undetected during VPI and detected during the final client validation may be
explained by a difference in the client level of requirement compared to Bombardier’s.
But the points detected during the pre-IPA and undetected during VPI are more
difficult to explain: quality department, which has detected these problems during pre-
IPA analysis, is the same department which has signed the VPI validation record
approving that the assembly is free from any problems (and often the quality manager
who has observed the assembly during the VPI and sign the VPI record and the one
who has detected problem during the IPA is the same person). This could be explained
by the fact that quality department is not responsible of VPI outcomes and therefore is
less involved in the problems detection, whereas this department is directly responsible
of the client validation. If the problem is detected after the validation, design may
have already been frozen and a change in design may not been accepted by the
engineering department. If pre-IPA observation could be done before the final
validation of the assembly, it may allow involving the quality department in VPI and
detecting remaining problems before that the design is “frozen”. Table 12 provides the
types of problems detected during MI09 contract with IPA and pre-IPA analysis.
Assemblies validated by VPI 23
Assembly handbook informations are missing 4
Problems that should have been detected during VPI
Assembly process 3
Conformity assembly handbook/Engineering design 6
Parts specifications 1
Missing tools 3
Engineering layout information 2
not checked during VPI Quality document error 1
Client information demand 3
Assemblies not validated by VPI 10
Assembly process 3 Problems that could be detected by implementing a final VPI observation to check if any
problem is remaining
Engineering design 1
Tool missing 1
Production problem 1
not checked during VPI Engineering layout information 1
Client information demand 1
Quality control 2
Table 12: Types of problems detected during IPA and Pre-IPA analyses on MI09 contract
(Source: own, realized based on IPA data)

62 PROCESS IMPROVEMENT DURING PRODUCTION RAMP UP
-Benjamin TARET- Linköping University
Among the 33 detected problems:
11 were problems from areas not checked by VPI (because VPI focuses on
industrialization problem and not on quality documentation or engineering data).
5 points were from not validated assemblies: IPA analyses are supposed to be
launched after the VPI but because of delays in VPI validations some assemblies
have been presented to the client without being validated by the VPI. These points
may be detected before the IPA if a final observation is added before the VPI
validation.
17 were problems that should have been detected during VPI
Table 13 provides possible explanations for these 17 problems:
10 of these problems may not have occurred during the VPI observation because it
does not appear every time or because the problem appears after evolutions of the
production line (this problem is linked to the production line variability presented
in the beginning of this thesis). This could be mitigated by adding a formal
communication of the problems between GAP and VPI.
6 of these problems are errors in the VPI observation.
VPI errors 6
production ligne changes 5
problem does not appears every time 5
action plan currently solving the problem 1
Total 17
Table 13: possible causes for the undetected problems
(Source: own, realized based on IPA data)
Based on this analysis 11 on the 123 IPA detected problems (9%) are due to the lack
of final checking phase during VPI. 80 problems have been detected on these
assemblies during VPI, therefore 13% of problems have not been detected.
This validates the hypothesis H5. Even if this cause impacts few problems, the delay in
problem solving is high: IPA analysis has been conducted one year after the
production of the first vehicle. Moreover, problems detected during IPA are directly
detected by the client himself, and it impacts the credibility of BT.
4.1.2 DO: MANAGEMENT OF MANY IMPROVEMENTS AT THE SAME TIME During previous contracts, a file for management of actions plans was created for each
assembly. An improvement of the MI09 contract was to group together all the
improvement plans in only one file called “MET13”. This file allows having a clear
view of the whole VPI process, and easily creating indicators of the progression of
VPI validations on the whole contract. Moreover, this file allows grouping the
problems by person in charge of the problem closure, and therefore is efficiently for
the transversal management of these problems managers.
However, with a lot of problems to manage, it is hard to remember the definition of
each problem. Therefore the problem description should be as clear and precise as

63 PROCESS IMPROVEMENT DURING PRODUCTION RAMP UP
-Benjamin TARET- Linköping University
possible, especially when several VPI managers will have to manage it like it happens
during the MI09 contract. In order to define clearly the needed improvement, “Met13”
files contain a sheet that should be filled with pictures of the identified problems.
However, there is no recommendation in this file indicating clearly the reference
number of the problematic items and the moment when the problem appears during the
assembly. This information corresponds to the “what? When? Where? Why? And
how?” recommended method for problem description.
COMPLEXITY- to conclude,
Observe
- “Met27” framework is a good solution for the high complexity of the train
design but only one observation does not seem to be enough regarding the
complexity of the process
Plan
- Even if a prioritization of the problems is made through a classification between
K1 (safety problem), K2 (deviation from the expected process) and K3 (process
time improvement), all the problems are solved in the same way.
Do
- The “MET13” is a good solution for managing this huge amount of
improvements. However, the lack of clear framework for problem definition
may result in misunderstanding especially when the process is managed by
several VPI managers.
Check
- In order to detect and manage the high number of improvements, a high
involvement of all departments is needed; A Pre-IPA observation done before
the final validation of the assembly may allow involving the quality department
in VPI and detecting remaining problems before that the design is “frozen”.

64 PROCESS IMPROVEMENT DURING PRODUCTION RAMP UP
-Benjamin TARET- Linköping University
4.2 PROCESS INERTIA - Long assembly time
In order to compensate the long process time at each assembly station, VPI process
should be designed in order to detect systematically the improvement with only one
observation and select the best solution efficiently with few tests.
Figure 42: VPI Versus process inertia
(Source: own)
4.2.1 OBSERVE: LACK OF VPI MANAGERS Based on discussion with previous managers, it appears that the delay in VPI and the
undetected problems may come from the lack of time of VPI managers. Based on this
observation, hypothesis H6 has been proposed:
H6: The lack of VI managers is a cause of the delay in VPI realization.
As described previously, only one or two VPI managers where used for the whole VPI
process.. According to VPI guidelines, all assemblies should be observed on the first
produced vehicle at each assembly station. Table 14 has been extracted from A. Massy
thesis. It indicates the results of the VPI at the end of his internship in august 2010.
According to this table, most of the assemblies have been observed before or during
the production of the third vehicle for the assembly stations PM17 and PM18. So the
observations have effectively been realized on the first produced vehicles. However,
the observation is not the only role of VPI managers. They should also manage the
design and implementation of solutions. The observation of an assembly may be really
time-consuming: it could require between ten minutes to several days. Therefore, if all
the observations are realized in the same time, VPI manager may have a lack of time
for problem solving. This hypothesis seems to be confirmed for the MI09: in the
beginning of the VPI on MI09 only one VPI manager was responsible for observing all
the assemblies and solving the problems.

65 PROCESS IMPROVEMENT DURING PRODUCTION RAMP UP
-Benjamin TARET- Linköping University
Observation realised
Number of assemblies
assembly validated
# of vehicle
PM17 8 8 1 4
PM18 39 39 14 3
PM19 33 37 14 2
PM20 2 10 0 1
Table 14: Observed assemblies Vs number of produced vehicles in August 2010
(Source: A. Massy, 2010)
All the assemblies have been observed, but because of a lack of time, he did not have
time to check on the production line that the implemented solution effectively solve
the problem. Once a solution was found and the implementation launched, he
considered that the problem was solved. When the two new VPI managers arrived in
July 2010, they realized that lot of problems have not been solved by the implemented
solutions. Therefore, they had to re-study and check all the previously detected
problems considered as solved. Figure 43 represents the number of K1 and K2 open
and solved. Around the 38th
week, this number of solved problems is decreasing: it
corresponds to problems classified as solved but which did not really solve the
problems on the production line. 48 problems (14% of the 351 K1 and K2 problems)
are impacted by this modification. This situation has introduced a major delay in the
validation of the assemblies. Because these new managers were not alone and because
most of the observations have already been performed, they had more time for
solutions design, and implementation checking.
Figure 43: Total K1+K2 open and solved
(Source: M. Fayolle, 2011)

66 PROCESS IMPROVEMENT DURING PRODUCTION RAMP UP
-Benjamin TARET- Linköping University
The decision of increasing the number of VPI managers came from the high number of
detected problems between January and June 2010. However, it seems that the most
important workload occurred in the beginning of the VPI process. So using two VPI
managers instead of one in the beginning may have reduced the delay in VPI
validation.
This analysis validates hypothesis H6: the long observations time and the lack of VPI
managers in the beginning have resulted in lack of verification of the implemented
solution. This lack of checking has produced delays, but it could have been worth: if
these implemented solutions have not been checked by A. Huet and M. Fayolle in
August, it would have been detected only during the IPA in March.
4.2.2 PLAN: NO SPECIFIC FRAMEWORK FOR SOLUTION GENERATION OR
SELECTION
The absence of root cause analysis, of framework for the definition of the problem and
alternative solutions may increase the probability of selecting a solution that does not
solve the problems. Moreover, in the “Met13” file that describes the action plan, the
definition of problem is not separated from the description of the possible cause.
Therefore, lots of problems are directly described with their possible causes and not by
the consequences. This situation can lead to the selection of non adapted solutions that
will be detected only after its implementation.
The high complexity of the train design may produce a lot of possible problems.
However, the designs of most of the trains have some common aspects. Therefore the
problems encountered may be similar. A common database with all the problems
encountered in the previous contract may reduce the impact of the complexity of the
design by providing a list of potential problems and solutions. Moreover, this aspect
could be linked to the sixth rule of Sims (2011) which underlines the importance of
comparing the changed process parameters before and after the apparition of a
problem: if the problem is not present on a similar assembly in another contract, the
analysis of the process parameters that differ between contracts may help to identify
possible problem causes. While the VPI is conducted in the beginning of each
contract, the VPI for each contract are completely independent. No formal knowledge
transfer from the previous VPI seems to exist. There is no formal system to check if
the problems have been already detected and solved in another contract. For the
Regio2N contract that has been industrialized in the beginning of June 2011, a meeting
has been organized with the VPI managers of the MI09 contract. The aim of this
meeting was to have a feedback on the framework of the VPI process. However
nothing was made to use the list of improvements detected during the MI09 contract.
This knowledge management would have been really interesting for the MI09 contract.
The MI09 train has been design based on the MI2N previous train. Lot of subassembly
has been kept from the MI2N design and implemented in the MI09. Problems
encountered during the MI09 contract may have been linked to similar problems
during the MI2N contract and the access to the historical data of MI2N contract may
have helped for selecting the best solution.

67 PROCESS IMPROVEMENT DURING PRODUCTION RAMP UP
-Benjamin TARET- Linköping University
The re-opened problems described previously could be considered as example of
solutions that did not solve the problems. Therefore at least 14% of the solutions were
not adapted to the problems and the resulting delay was up to 6 months in this case.
PROCESS INERTIA- to conclude,
Observe
- The long time necessary for the observation phase create an important workload
in this initial stage of VPI. The lack of VPI managers during this phase may
explain some of the delays.
Plan
- The long process time limits the number of possible tests for implementing a
solution. A better framework for problem description and knowledge
management between contracts may enhance the probability of selecting the
most appropriate solution with few tests.
4.3 VARIABILITY - Non automated production line
MI09 production line is not automated. This situation leads to variability in the
assembly which should be taken into account during VPI. Figure 44 assess how VPI
take into account this variability.
Figure 44: VPI Versus production line variability
(Source: own)

68 PROCESS IMPROVEMENT DURING PRODUCTION RAMP UP
-Benjamin TARET- Linköping University
4.3.1 CHECK: PROCESS VARIABILITY
As described before, the assembly process is non-stable on the very first vehicles.
Some parts are missing and the observation is made partially. Moreover, lot of process
change will be implemented by the methods department and these changes may impact
accidently some assembly: for example the design modification of a part may result in
a non accessibility of others parts. These unwanted consequences of process change
could appear after the initial VPI observation. VPI framework does not explicitly
require a final observation to ensure that all the problem have been solved and no
formal link with daily production meeting for problem encountered is made.
Therefore, it seems that the VPI process does not take into account that the assembly
process may evolved during the first vehicles.
4.3.2 STANDARDIZE: FOCUS ON THE DOCUMENTATION
Argote and Epple (1990) argue that learning curves are influenced by “organizational
forgetting” which occurs when employees forgot how to perform task. This could be
reduced by adequate documentation. Documentation and standardization constitute an
important part of the VPI checklist (met27). The aim is to check if the operators have
the knowledge of all the main criteria for obtaining the expected quality. This is made
through the “Assembly book” and the technical specifications.
4.4 PROCESS MATURITY VISIBILITY
4.4.1 FOR THE METHODS DEPARTMENT
The selected KPI allows having a clear view of the evolution of the process maturity.
However, the forecasting of the problem solving, assembly validation and therefore
the end of the ramp up phase is based only on answer of person in charge of each
point. Therefore, this forecast can be made only when the solution has already been
completely defined and launched and is only valid for short term.
Maybe this forecast can be improved by using the data from previous contract. Mean
data for the treatment of problem may be computed and used to predict a forecasted
validation date based on the type of problems detected.
4.4.2 FOR THE ENGINEERING DEPARTMENT
A design part is frozen when the assembly in which it is mounted is validated. Figure
45 provides an example of the situation. Parts1 and 2 are mounted during the assembly
M1001 and parts 3 and 4 during assembly M1004.

69 PROCESS IMPROVEMENT DURING PRODUCTION RAMP UP
-Benjamin TARET- Linköping University
Figure 45: Design freeze example
(Source: own)
Let’s suppose that part 2 and 3 are mounted without any problem during M1001, so
M1001 is validated and the corresponding part designs are “frozen”.
However, even if part2 is not assembled during M1004, its design may block this
assembly. The improvement points are listed in the assembly as the problem is
discovered. So, the problem “part 2 is blocking the assembly” will be linked to M1004
and because this movement is not validated the corresponding action “modifying part2
design” will be launched. But this modification will be blocked because part 2 is
already frozen. This difference of references between VPI and design freeze may
result in error of interpretation of the product design maturity.
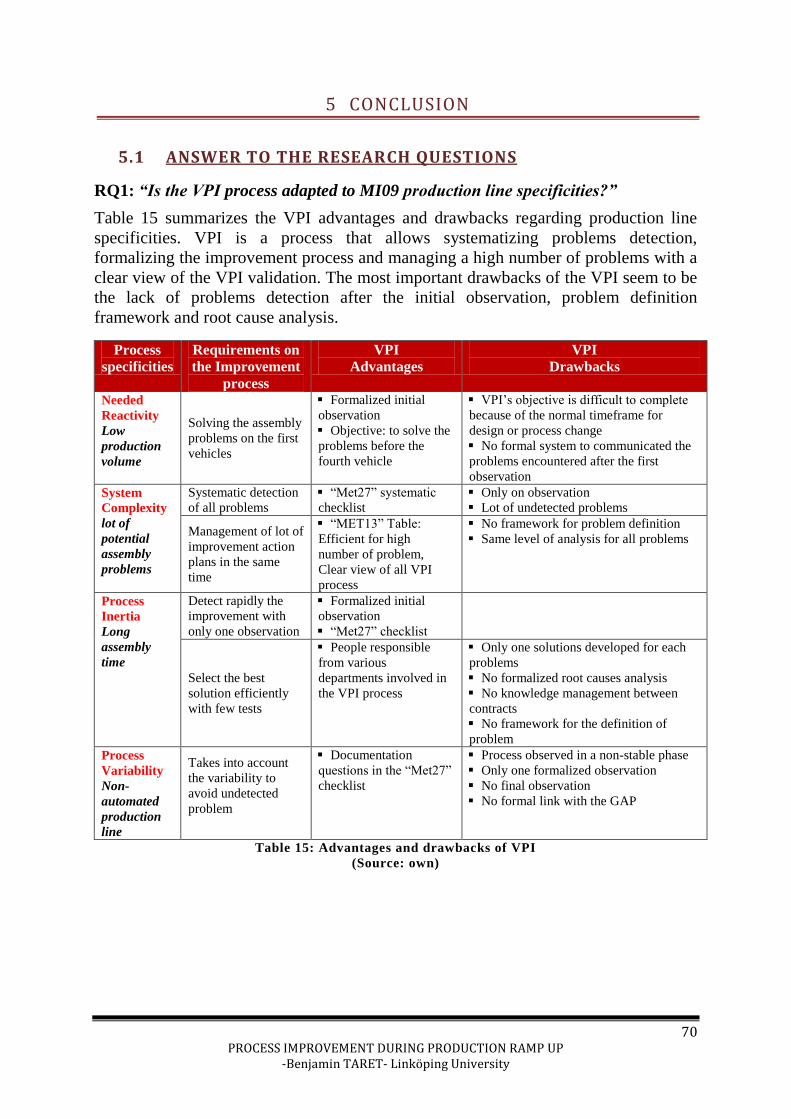
70 PROCESS IMPROVEMENT DURING PRODUCTION RAMP UP
-Benjamin TARET- Linköping University
5 CONCLUSION
5.1 ANSWER TO THE RESEARCH QUESTIONS
RQ1: “Is the VPI process adapted to MI09 production line specificities?”
Table 15 summarizes the VPI advantages and drawbacks regarding production line
specificities. VPI is a process that allows systematizing problems detection,
formalizing the improvement process and managing a high number of problems with a
clear view of the VPI validation. The most important drawbacks of the VPI seem to be
the lack of problems detection after the initial observation, problem definition
framework and root cause analysis.
Process
specificities
Requirements on
the Improvement
process
VPI
Advantages
VPI
Drawbacks
Needed
Reactivity
Low
production
volume
Solving the assembly
problems on the first
vehicles
Formalized initial
observation
Objective: to solve the
problems before the
fourth vehicle
VPI’s objective is difficult to complete
because of the normal timeframe for
design or process change
No formal system to communicated the
problems encountered after the first
observation
System
Complexity
lot of
potential
assembly
problems
Systematic detection
of all problems
“Met27” systematic
checklist
Only on observation
Lot of undetected problems
Management of lot of
improvement action
plans in the same
time
“MET13” Table:
Efficient for high
number of problem,
Clear view of all VPI
process
No framework for problem definition
Same level of analysis for all problems
Process
Inertia
Long
assembly
time
Detect rapidly the
improvement with
only one observation
Formalized initial
observation
“Met27” checklist
Select the best
solution efficiently
with few tests
People responsible
from various
departments involved in
the VPI process
Only one solutions developed for each
problems
No formalized root causes analysis
No knowledge management between
contracts
No framework for the definition of
problem
Process
Variability
Non-
automated
production
line
Takes into account
the variability to
avoid undetected
problem
Documentation
questions in the “Met27”
checklist
Process observed in a non-stable phase
Only one formalized observation
No final observation
No formal link with the GAP
Table 15: Advantages and drawbacks of VPI
(Source: own)
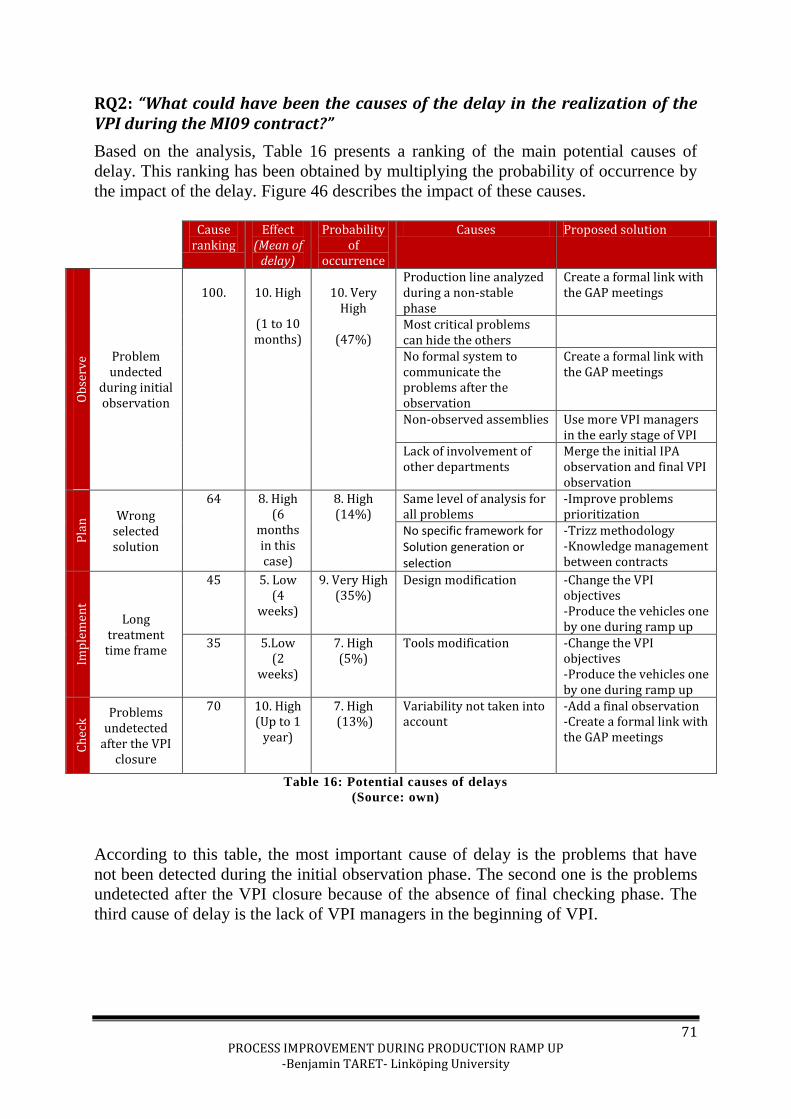
71 PROCESS IMPROVEMENT DURING PRODUCTION RAMP UP
-Benjamin TARET- Linköping University
RQ2: “What could have been the causes of the delay in the realization of the VPI during the MI09 contract?”
Based on the analysis, Table 16 presents a ranking of the main potential causes of
delay. This ranking has been obtained by multiplying the probability of occurrence by
the impact of the delay. Figure 46 describes the impact of these causes.
Cause ranking
Effect (Mean of
delay)
Probability of
occurrence
Causes Proposed solution
Ob
serv
e Problem
undected during initial observation
100.
10. High
(1 to 10 months)
10. Very
High
(47%)
Production line analyzed during a non-stable phase
Create a formal link with the GAP meetings
Most critical problems can hide the others
No formal system to communicate the problems after the observation
Create a formal link with the GAP meetings
Non-observed assemblies Use more VPI managers in the early stage of VPI
Lack of involvement of other departments
Merge the initial IPA observation and final VPI observation
Pla
n Wrong
selected solution
64 8. High (6
months in this case)
8. High (14%)
Same level of analysis for all problems
-Improve problems prioritization
No specific framework for Solution generation or selection
-Trizz methodology -Knowledge management between contracts
Imp
lem
ent
Long treatment time frame
45 5. Low (4
weeks)
9. Very High (35%)
Design modification -Change the VPI objectives -Produce the vehicles one by one during ramp up
35 5.Low (2
weeks)
7. High (5%)
Tools modification
-Change the VPI objectives -Produce the vehicles one by one during ramp up
Ch
eck
Problems undetected
after the VPI closure
70 10. High (Up to 1
year)
7. High (13%)
Variability not taken into account
-Add a final observation -Create a formal link with the GAP meetings
Table 16: Potential causes of delays
(Source: own)
According to this table, the most important cause of delay is the problems that have
not been detected during the initial observation phase. The second one is the problems
undetected after the VPI closure because of the absence of final checking phase. The
third cause of delay is the lack of VPI managers in the beginning of VPI.

72 PROCESS IMPROVEMENT DURING PRODUCTION RAMP UP
-Benjamin TARET- Linköping University
Figure 46: root cause analysis of delays in VPI
(Source: own)
5.2 IMPROVEMENT SUGGESTIONS FOR VPI
Based on the analysis of these VPI drawbacks, this part of the thesis aims at proposing
possible improvements.
5.2.1 ROOT CAUSE ANALYSIS AND PROBLEM DEFINITION
Clear framework for root cause analysis and problem definition would be useful to
ensure that the selected solution is the most suitable one. Clear problem definition may
be required for using a knowledge management system described in section 5.2.2.
Moreover, problem definition and cause analysis is confounded in the “Met13” actions
plan in, only one space called “problem description”. Problem definition and root
cause analysis should be clearly separated in this file. In order to define clearly the
problem, the methods “what, where, when, how, why” is proposed by PURDY et al.,
(2010)
73 PROCESS IMPROVEMENT DURING PRODUCTION RAMP UP
-Benjamin TARET- Linköping University
What: in the actual system, no specific indication is provided to define the impacted
parts. An improved file could contain the precise “reference number” of each
problematic parts. A field with the “type of problem” (interference between parts,
documentation problem etc...) may help to create indicators to improve the visibility
on the type of problems encountered during the VPI and may also be used for
identifying similar problems during other contracts.
Where: (Localization in the train) this information is already contained in the reference
number of the assembly.
When: An indication at which step of the assembly the problem occurs may improve
the problem definition.
How: this part corresponds to the root cause analysis
For the root cause analysis, VPI may be improved with the use of Ishikawa diagram
and knowledge management between contracts. This solution is presented in part 7.2.
However, these methods are time consuming; therefore a prioritization of the problem
should be made. A proposition for this prioritization is made in part 7.3
5.2.2 KNOWLEDGE MANAGEMENT BETWEEN CONTRACTS
Argote and Epple (1990), has underlined the impact of knowledge management
between contracts on the learning curve. The communication of problems encountered
and solutions found between contracts may reduce the ramp up phase duration.
Each type of train is customized and is different from the others. However, some
aspects of the designs and the manufacturing processes are common. Therefore
Knowledge management between contracts may improve VPI process. It may decrease
the number of undetected problem, reduce the treatment time and improve the
forecasting of VPI.
Decrease the number of undetected problems -With the list of problems
encountered during previous contracts, VPI managers may identify on which
subsystems and areas VPI should focused to ensure that the problems. Based on this
historical data, a FMEA analysis could be made to forecast the possible problems and
to detect the most critical possible problems. This could have decreased the number of
problems that have not been detected during the initial observation.
Reduce the treatment time - The root causes analysis and the definition of the
solutions could have been simplified with the list of solutions implemented during
previous contracts. This could have reduced the treatment time of the problems by
providing a list of causes and solutions. Another solution could be to use the TRIZZ
methodology to facilitate the problem solving process for the most common problems
and reduce the treatment time of the VPI.
Better forecasting -From the historical data of the MI2N contract, it may be possible
to compute a mean time for the treatment of each type of problem (modification of
design, modification of some tool, and modification of the “assembly book”...). These
data may help forecasting the closure of each movement in the MI09 contract based on
the types of problems detected for each movement and on the treatment mean time.
Actually, each “Met13” file for each contract is managed independently in an excel

74 PROCESS IMPROVEMENT DURING PRODUCTION RAMP UP
-Benjamin TARET- Linköping University
file. In order to achieve this knowledge management system, a common data base
could be built for all contracts. Problem definition should be precise and use keywords
that enable the easy identification of similar problems.
5.2.3 DIFFERENT METHODOLOGIES FOR DIFFERENT TYPES OF PROBLEMS
A framework for identifying the more complex problems and managing it in a specific
way, with a root cause analysis methodology and several scenario, could reduce the
time for the validation of each movement. This solution has been implemented in
Alstom process validation (Massy, 2010) where a specific framework, which includes
the utilization of a “8 steps problem solving form, is followed for the most critical
problem.
Figure 47 describes a possible framework for this problem prioritization. A RPN (or
“Risk Priority Number”) could be computed for each problem based on the FMEA
framework. Based on this number, the methodology for the problem mitigation is
selected: for a problem with low RPN, only one solution can be developed and
implemented. For a high RPN several solutions can be developed and a root cause
analysis can be used to ensure that all the causes have effectively been suppressed.
Figure 47: Proposed framework for the problem prioritization
(Source: own)
Table 17 describes a possible link between the traditional rating for the severity of
failure in FMEA analysis provided by HC Liu et al (2010) and the prioritization index
described in the VPI framework. Levels of failure 9 and 10 are directly linked to
safety problems. Levels 8 and 7 correspond to major quality problems that cannot be
mitigated. These levels of failure can be linked to the K1 classification. Problems from
the level of failure from 2 to 6 can correspond to K1 or K2. If the workers are
currently mitigating the defect by realizing an action that is not described in the
assembly handbook, this problem has been classified as a K2, otherwise it has been
classified as a K1. Failures with a level 1 do not impact the final quality or safety, it
can be linked to process improvement (reduction of cost for example) classified as a
K3.

75 PROCESS IMPROVEMENT DURING PRODUCTION RAMP UP
-Benjamin TARET- Linköping University
Table 18 presents a possible link between the index for the detection of the failure
presented by HC Liu et al (2010) and the time when the problem detection occurs
within VPI process. This classification is made for a problem that has occurred from
the first vehicle but not necessarily initially detected. The index for the probability of
occurrence can be estimated with the same index described by HC Liu et al (2010) and
presented in appendix 2.
Severity of Failure (FMEA theory) VPI criticality index
10 Hazardous without warning
K1 - Safety Problem or Quality Problem 9 Hazardous with warning
8 Very high (loss of primary function)
7 High (reduced level of performance)
6 Moderate -If the workers mitigate the problem by an
action not described in the “normal process”:
K2 -Deviation of the normal process
-If the defect will impact the final quality
without possibility to mitigate it:
K1- Quality Problem
5 Low
4 Very low (defect in finish)
3 Minor (defect in finish)
2 Very minor (defect in finish)
1 None (no effect) K3 - Process Improvement Table 17: Link between severity of failure and VPI criticality index
(Source: own)
Detection of Failure (FMEA theory) Detection of Problem (VPI framework)
10 Absolutely impossible
9 Very remote 8 Detected during a final observation
before the VPI closure 8 Remote
7 Very Low
6 Low 5 Undetected during the initial
observation, and detected before the
VPI last observation 5 Moderate
4 Moderate High
3 High 2 Detected during the initial VPI
observation 2 Very High
1 Almost Certain Table 18: Link between detection of failure and VPI framework
(Source: own)
Here are 2 examples to illustrate this framework: 1. For the assembly of the air conditioning system, the main air conditioning bloc
is lifted with rope on the top of the vehicle. During this lifting, the rope was sometime
rubbing on sharp parts of the roof of the vehicle. This problem was classified as a
“k1”, so the severity is 9 or 10. The problem does not occur every time, so the
probability of the occurrence of the failure is 6. And it is difficult to be seen by the
workers, so the probability of the failure to be detected is 8.
So the RPN is 9*6*7 =378. With this high RPN, several solutions will be studied in
order to mitigate the risk, and the process for the lifting of the air conditioning bloc on
the other contract should be studied.
2. A rubber part is put on the under-stair trap door to protect it during the closing.
This rubber part is fixed with an adhesive which was not enough sticking to fix it. This

76 PROCESS IMPROVEMENT DURING PRODUCTION RAMP UP
-Benjamin TARET- Linköping University
problem is classified as a “k2”, the severity is low: 2 or 3. The problem has been
detected during the initial observation and the probability of occurrence is low
(probability of occurrence = 2). So the RPN is 2*2*2 = 6. With this low RPN, only
one solution will be studied.
This framework would allow concentrating the improvement effort on the first
example rather than equivalently distribute it between problems.
5.2.4 INTEGRATE THE VARIABILITY OF THE PROCESS
As described previously, the assembly process evolves a lot during the production of
first vehicles. Lots of problems could appear between the initial VPI observation and
the VPI validation. The detection of these problems could be realized with a formal
link with the GAP daily meetings to know the problems encountered by the workers
every day. A final observation of the assembly process before the ending validation
should be clearly indicated in the VPI framework. Moreover, if this observation could
be merged with the initial pre-IPA observation, it could improve the involvement of
the quality department process.
5.2.5 FINAL PROPOSED FRAMEWORK
Figure 48 illustrates the proposed framework for VPI. A final observation of
assemblies and formal integration of problems presented during GAP meeting are
added to reduce the number of undetected point. The final observation is merged with
pre-IPA observation in order to involve the quality department. Moreover, this final
observation allows making the process iterative in case of remaining problems.
Figure 49 describes the proposed problem solving methodology. Problem prioritization
allow to focus on the most critical problems with root cause analysis, several solutions
developed and comparison with problems encountered in other contracts. However,
this knowledge management between contracts requires clear problem definition in
order to be able to identify similar problems.
Figure 50 proposed a new framework for problem and solution definition. It separates
the problem definition and root causes analysis originally merged in the “MET13” file.
Moreover, the problem definition is more detailed in order to be used for knowledge
management. The probability of occurrence and the detection time of the problems are
added in order to be used for the FMEA analysis.
Moreover, because of the more important workload in the initial stage of VPI, adding
more VPI managers in the beginning may improve the quality of the problems solving
and avoid delays.

77 PROCESS IMPROVEMENT DURING PRODUCTION RAMP UP
-Benjamin TARET- Linköping University
Figure 48: Suggestion for VPI framework
(Source: own)
Figure 49: Proposed framework for mitigation actions selections
(Source: own)

78 PROCESS IMPROVEMENT DURING PRODUCTION RAMP UP
-Benjamin TARET- Linköping University
Figure 50: Proposed framework for MET13
(Source: own)
The numerical objectives of the VPI should be revised in order to be more realistic. Or
if the original objectives are kept, the solution used on the Regio2n contract (and
described in section 4.1) should be used: produced only one vehicle at a time, and
follow this vehicle all along the production line.
The numerical data of problem solving duration regarding the type of problem may be
used to automatically compute a forecasted validation date of the assembly as soon as
the initial observation is performed. This would improve the visibility of process
maturity.
Proposed solutions drawbacks
These proposed solutions also have drawbacks which are presented in Table 19. It may
improve quality of the VPI process but is often time consuming because of parameter
and added observations. Database with an adequate interface to replace the excel
original file may decrease this drawback. The RPN calculation and selection of
identical problem in other contracts may be automatically performed and parameters
selection may be selected in predefined list. Moreover, the forecasted closure date may
be computed automatically to simplify the analysis.
This solution of a specific database with user friendly interface has already been
implemented for the last contract Regio2n.

79 PROCESS IMPROVEMENT DURING PRODUCTION RAMP UP
-Benjamin TARET- Linköping University
Impact on
reac
tiv
ity
com
ple
xit
y
Pro
cess
in
reti
a
Var
iab
ilit
y
Advantages Drawbacks
Objective change Better visibility on the
VPI process
Improved problem
definition X X
better solution selection
better problem
management
Time consuming
Root cause analysis X X better solution selection Time consuming Several solutions
developed X X
better solution selection
Knowledge
management between
contracts
X better solution selection
better forecasting
Time consuming
Data base management
Problem prioritization X
Better focus on critical
problem
Better Time management
Calculation of RPN
Time consuming
Final observation and
iterative process X X
better problem detection Time consuming
Final observation
merged with pre-IPA X X
implication of quality
department
Link with GAP X X X better problem detection Time consuming Forecasted closure date
based on type of
problems
X Better visibility Time consuming
Add VPI managers in
the beginning of the
VPI
X X Better problems
management
costly
Table 19: Advantages and drawbacks of proposed improvements
(Source: own)
Importance of including improvements in official VPI framework
It may be argued that some of these solutions (like root causes analysis, framework for
problem description and final checking phase) may be implemented during VPI
without being formally written in the official VPI framework. It may also argued that
the utilization of these methodologies depend on VPI manager’s preferences.
However, the main drawback of these improvements is that it is time-consuming.
Their implementations may produce an increase in the VPI manager’s workload and as
described before there was a lack of VPI manager during MI09. Therefore, even if VPI
managers know that it is better, he may not use it because of the lack of time.
Therefore, including these methodology improvements in the official framework may
be necessary to evaluate the needed human resource and increase the number of VPI
managers if necessary.

80 PROCESS IMPROVEMENT DURING PRODUCTION RAMP UP
-Benjamin TARET- Linköping University
5.3 CONCLUDING REMARKS
Results - VPI could be seen as a way to produce “deliberate” (Terwiesch and Bohn,
1999) or “induced” learning (Arthur and Huntley, 2005) in order to reduced the ramp-
up phase duration. This process is easy to use and allows managing rapidly a large
number of improvement points with a good visibility of process maturity. The delays
encountered for validation of assemblies during MI09 contract may be due to
overestimation in the corporate closure objectives and undetected problems.
VPI is a young process that is still evolving. It may be improved by including final
observation, continual detection of problems on the first vehicle, problems
prioritization and knowledge management between contracts. The implementation of
these changes may be helped by the use of common database between contracts with
user-friendly interface. The last changes that has appears on the last regio2n contract
(production of a unique vehicle in the beginning and database with user-friendly
interface) seems to be consistent with the results of this analysis.
Generalisability of the results -According to interviews, it seems that the problems
detected during VPI in MI09 contract have already been encountered in previous
contracts. Moreover, these conclusions are based on the analysis of production line
specificities which are common to most of the BT contracts. Therefore we may
postulate that these recommendations can be extended to VPI for others BT contracts.
Further study of the results of VPI on Regio2n (the last BT contract) may validate or
invalidate the advantages of these changes. A numerical study of ramp-up durations
between contracts may also provide a verification of the formulated hypothesis.
Production line specificities seem to be specific to train production line. A study of
other train manufacturers may validate this hypothesis and confirm the generalisability
of the results for BT competitors.
Because this analysis is based on production line specificities, results may not be
usable for other types of industry.
81 PROCESS IMPROVEMENT DURING PRODUCTION RAMP UP
-Benjamin TARET- Linköping University
6 REFERENCES
-ARTICLES-
ARGOTE L. AND EPPLE D, 1990
Learning Curves in Manufacturing
ARTHUR J. B. AND HUNTLEY C.I., 2005
Ramping Up the organizational learning curve: assessing the impact of deliberate
learning on the organizational performance under gainsharing.
CASEY D, HOUGHTON C, 2010
Clarifying case study research: examples from practice
GRIFFIN T., 2007,
Survey of competitiveness of the EU rail supply industry
KNOX S. AND BURKARD A. W., 2008,
Qualitative research interviews
LI T, HUANG H, 2008
Applying TRIZ and Fuzzy AHP to develop innovative design for automated
manufacturing systems
LEE E, MISHNA F, BRENNENSTUHL S, 2011
How to critically evaluate case study in social work
Liu H.C., Liu L., Bian Q., Lin Q-L, Dong N., Xu P.C., 2010
Failure mode and effects analysis using fuzzy evidential reasoning approach and grey
theory
MERRIAM SB, University of Georgia, 2010,
Qualitative case study
O’HARA J. P. et al., 1993
Developing new manufacturing processes: A case study and model
K.PURDY et al., 2010
Defect reduction through Lean methodology
SHENHAR A. J., DVIR D., 1995
Toward a typological theory of project management
SHEU D.D., LEE H.K., 2010
A proposed process for systematic innovation
SIMS D., 2011
Seven simple rules for problems solving
TERWIESCH C., BOHN R. E., 1999,
Learning and process improvement during production ramp-up
TONG A., SAINSBURY P,CRAIG J, 2007,

82 PROCESS IMPROVEMENT DURING PRODUCTION RAMP UP
-Benjamin TARET- Linköping University
Consolidated criteria for reporting qualitative research (COREQ): a 32-items
checklist for interviews and focus groups
-MASTER THESES-
M. FAYOLLE, 2011,
Rapport de stage : Validation du processus industriel au sein de l’entreprise
Bombardier transport
A. MASSY, 2010,
Validation du processus industriel lors du lancement de la production sur le contrat
MI09
-BOOKS-
M.E. JOYCE, 1995,
How to lead your business beyond TQM
S. Shiba et Al., 1993,
Révolutions du management par la qualité totale
-WEBSITES-
Railway Industry federation website: www.fif.asso.fr/ accessed on June 2011
Bombardier website http://www.bombardier.com accessed on January 2011
Toyota website: http://www.toyota.fr/ accessed on January 2011
-INTERNAL BOMBARDIER DOCUMENTATION-
VPI process description provided by Bombardier, 2009
AVM process description provided by Bombardier, 2009
ARPAT process description provided by Bombardier, 2009

83 PROCESS IMPROVEMENT DURING PRODUCTION RAMP UP
-Benjamin TARET- Linköping University
7 APPENDIX
Appendix 1: Examples of VPI improvements
Appendix 2: FMEA tables
Appendix 3: Theoretical articles research
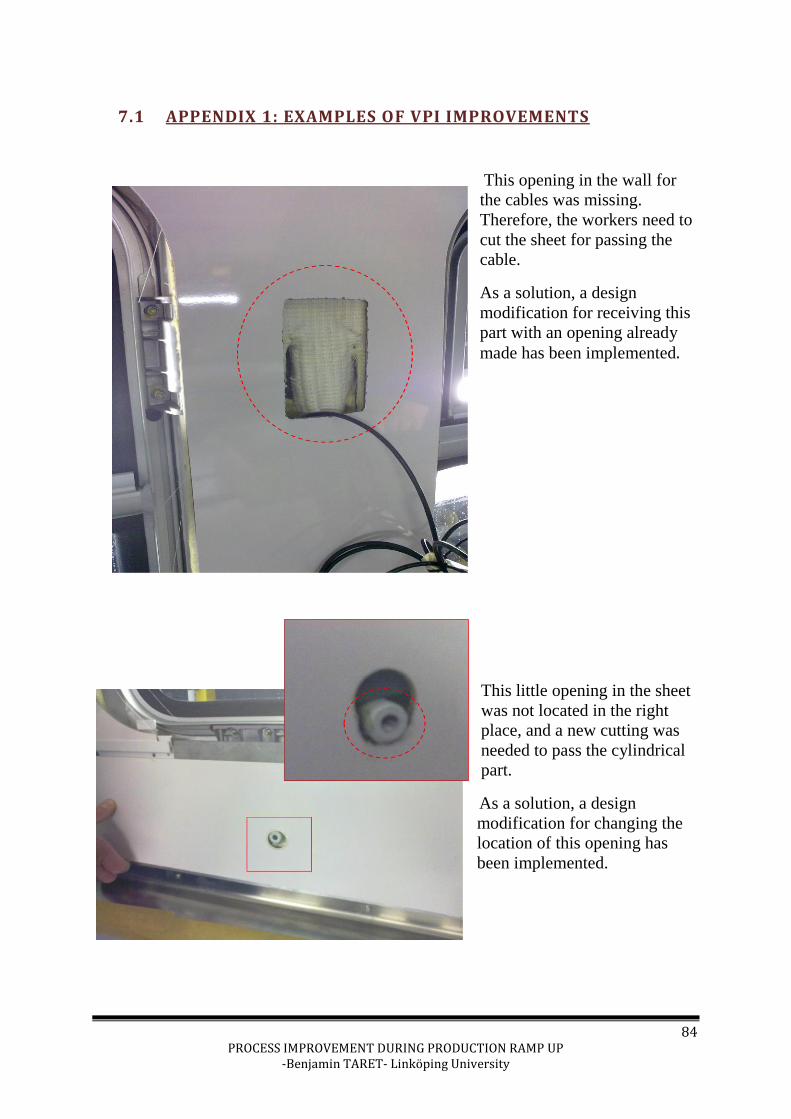
84 PROCESS IMPROVEMENT DURING PRODUCTION RAMP UP
-Benjamin TARET- Linköping University
7.1 APPENDIX 1: EXAMPLES OF VPI IMPROVEMENTS
This opening in the wall for
the cables was missing.
Therefore, the workers need to
cut the sheet for passing the
cable.
As a solution, a design
modification for receiving this
part with an opening already
made has been implemented.
This little opening in the sheet
was not located in the right
place, and a new cutting was
needed to pass the cylindrical
part.
As a solution, a design
modification for changing the
location of this opening has
been implemented.
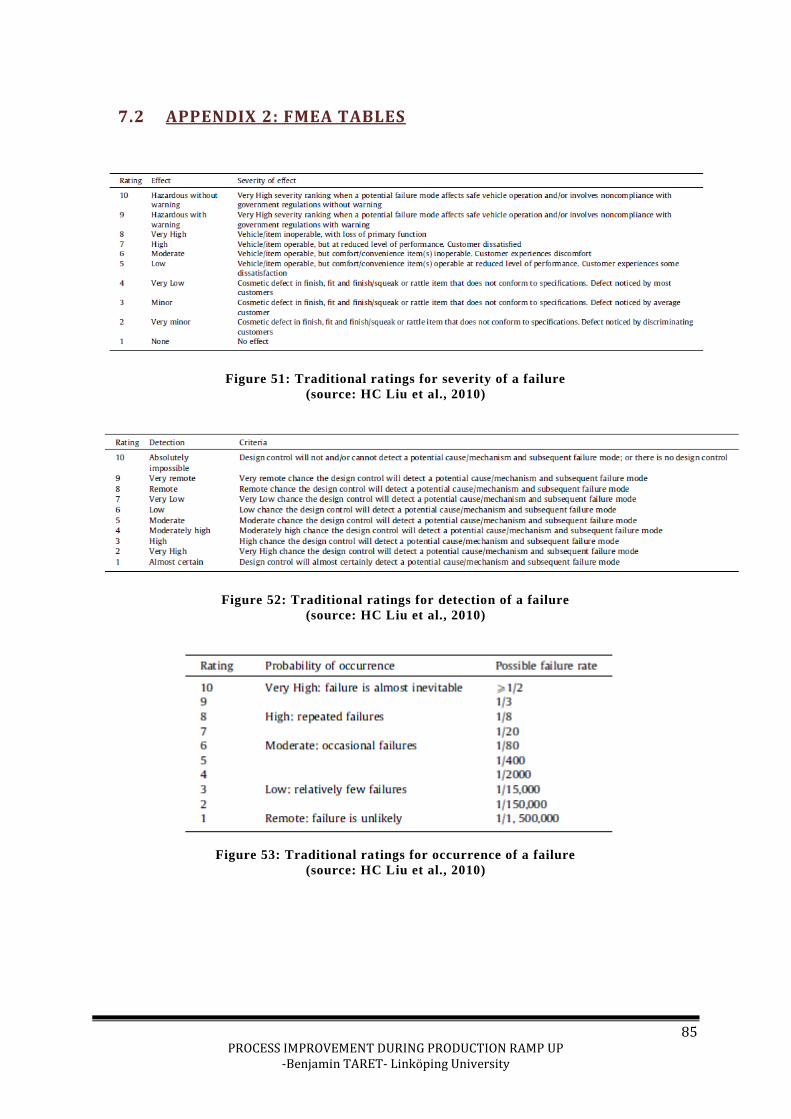
85 PROCESS IMPROVEMENT DURING PRODUCTION RAMP UP
-Benjamin TARET- Linköping University
7.2 APPENDIX 2: FMEA TABLES
Figure 51: Traditional ratings for severity of a failure
(source: HC Liu et al., 2010)
Figure 52: Traditional ratings for detection of a failure
(source: HC Liu et al., 2010)
Figure 53: Traditional ratings for occurrence of a failure
(source: HC Liu et al., 2010)

86 PROCESS IMPROVEMENT DURING PRODUCTION RAMP UP
-Benjamin TARET- Linköping University
7.3 APPENDIX 3: THEORETICAL ARTICLES RESEARCH
Figure 54, Figure 55 and Figure 56 present the framework for theoretical article research in the problem solving area.
Figure 54: Problem solving - EBESCO search
(Source: own)
Figure 55: Problem solving - SCOPUS search
(Source: own)

87 PROCESS IMPROVEMENT DURING PRODUCTION RAMP UP
-Benjamin TARET- Linköping University
Figure 56: Problem solving – SCIENCE DIRECT search
(Source: own)
Figure 57. Figure 58 AND Figure 59 present the framework for theoretical article research in the “ramp up” area.
Figure 57: Ramp Up - EBESCO search
(Source: own)
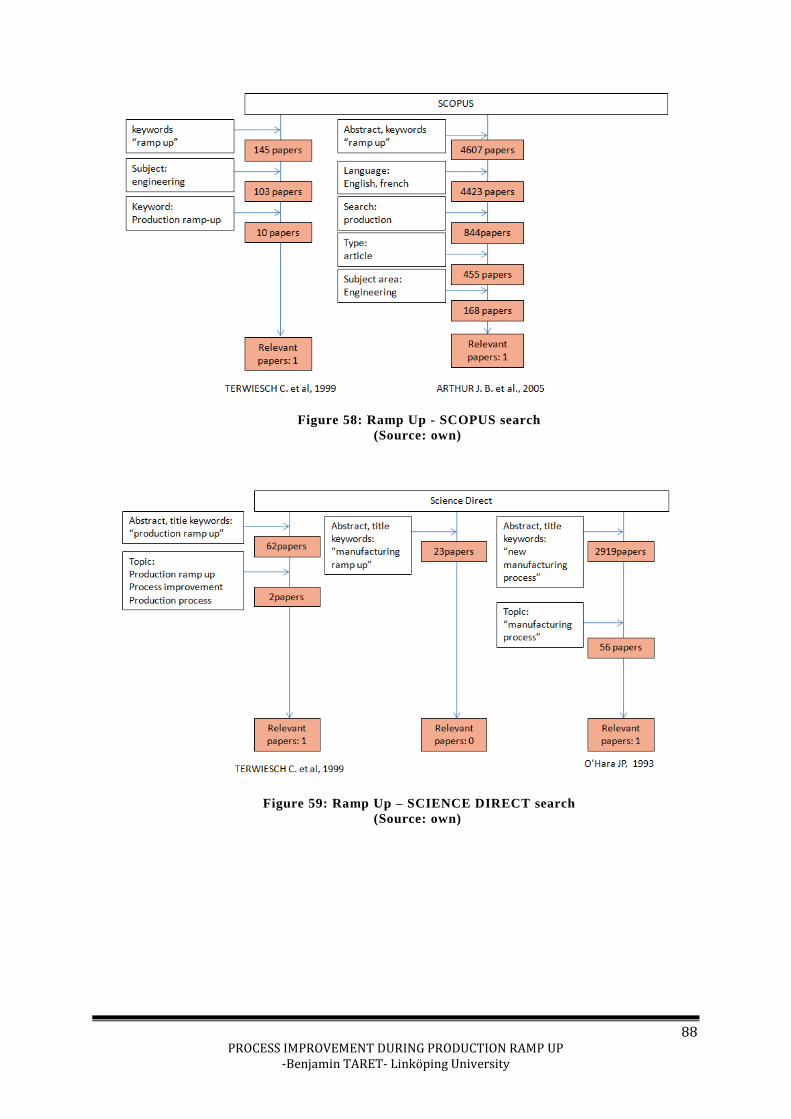
88 PROCESS IMPROVEMENT DURING PRODUCTION RAMP UP
-Benjamin TARET- Linköping University
Figure 58: Ramp Up - SCOPUS search
(Source: own)
Figure 59: Ramp Up – SCIENCE DIRECT search
(Source: own)

89 PROCESS IMPROVEMENT DURING PRODUCTION RAMP UP
-Benjamin TARET- Linköping University
7.4 APPENDIX 4: CRESPIN PLANT ORGANIZATION
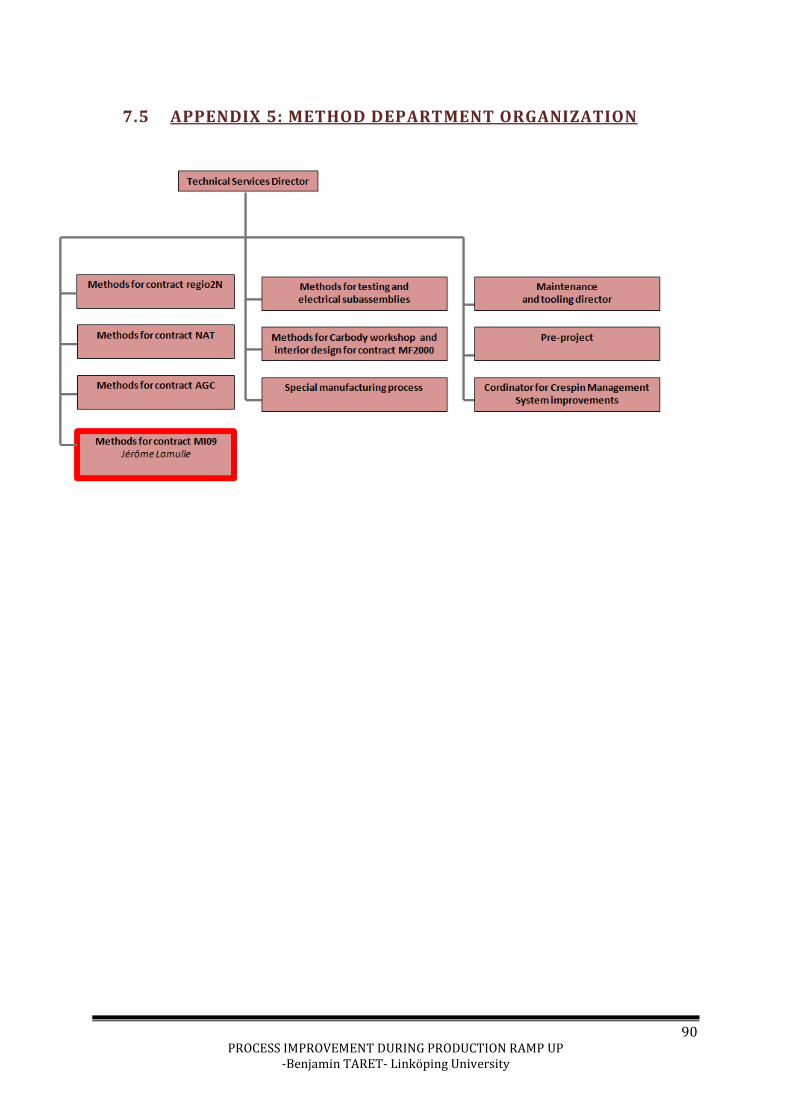
90 PROCESS IMPROVEMENT DURING PRODUCTION RAMP UP
-Benjamin TARET- Linköping University
7.5 APPENDIX 5: METHOD DEPARTMENT ORGANIZATION