fundamentals of data-driven decisions and drilling...
TRANSCRIPT

Fundamentals of
Data-Driven Decisions
and Drilling Optimization
in the Permian Basin
October 2015 Student Chapter AADE Meeting
University of Texas of the Permian Basin1
Andrew N. Hunter
“often we become satisfied with an established
procedure and only the press of circumstances will
bring about improvement in that procedure…
We need to be less self-satisfied with existing
programs or techniques and be more
venturesome in various other areas in which we
operate.”
J.H. Marsee
(Phillips Petroleum, Odessa, Texas, 1952)
Quoted in Leonard Franklin’s 1952 SPE Paper “Drilling & Completion Practices, Spraberry Trend”
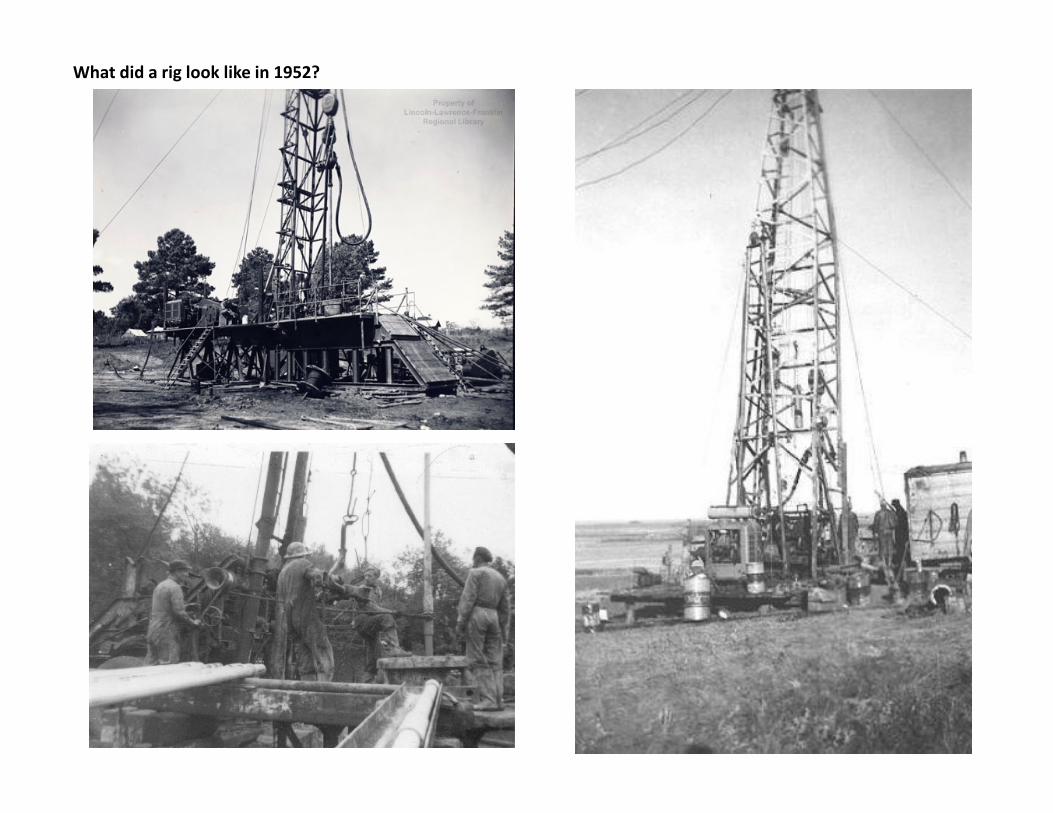
What did a rig look like in 1952?

1952 2015
No. Producing Wells 2,000 82,000
No. Rigs 200 500
Well MD (ft) 7,000 18,000
Drilling Days per well 33 25
Ft/Day Drilling 212 720
Bits per well 3
Foot per bit 6,000
Drill Tools Cable and rotary Bent motors and RSS
Well design 10-3/4" x 5-1/2" 3 String with 10,000' Hz
Completion Type Open hole Plug & Perf
Frac Design30 stages, 4.2 million gals
Well IP Oil 300 bpd 1,500 bpd
How does Permian Basin drilling data look 63 years later?
35
200
In 1952:
• 90% of vertical wells were 2 string (300’ of surface)
• 82% of wells were “hydrofraced”
• Majority of wells were open hole completions with 5-1/2” casing set into the top of the Spraberry
All 1952 data credited to Leonard Franklin, SPE 52-128. Number of producing wells from RRC website.
Single Stage
1,500 gals
2075
?
?
28,000
10
1,900
1 Laser ?
?
Automated Robot ?
20,000' Hz
?
Single Stage
1,500 gal nuclear frac ?
?

Outline
5
1. Fundamentals of Data-Driven Decisions in Unconventional Plays
2. Intermediate Drilling Optimization
3. Curve/Lateral Drilling Optimization
4. Takeaways
5.Tips for the Young Engineer

6
Data Fundamentals – Drilling Intervals or “Hole Sections”
Curve
Lateral
Intermediate

Data Fundamentals – Offset Wells, Best Practices, Lessons Learned
7
By nature, unconventional resource plays are large, continuous basins (vs. conventional structures)
Typical lease agreements with landowners require wells to be drilled continuously to hold leases
Thanks to these factors, among others, there will almost always be tens, if not hundreds of offset wells that have already been drilled by your company in the vicinity, in the recent past
Best engineering and operational practices are hidden in the data
You must take the time to read through the offset well reports, organize and normalize the data, and then analyze it to identify the top performing wells (and the worst)
No need to re-invent the wheel when starting work in a new position in an established field…. Start by identifying and repeating the top performing strategy (best practices) and try to avoid making the same mistakes twice (lessons learned)
If you plan to test a new strategy or technology, peer review it in advance, and ensure that your approach is methodical, and your results are communicated with the team
Data Fundamentals – Well Cost
8
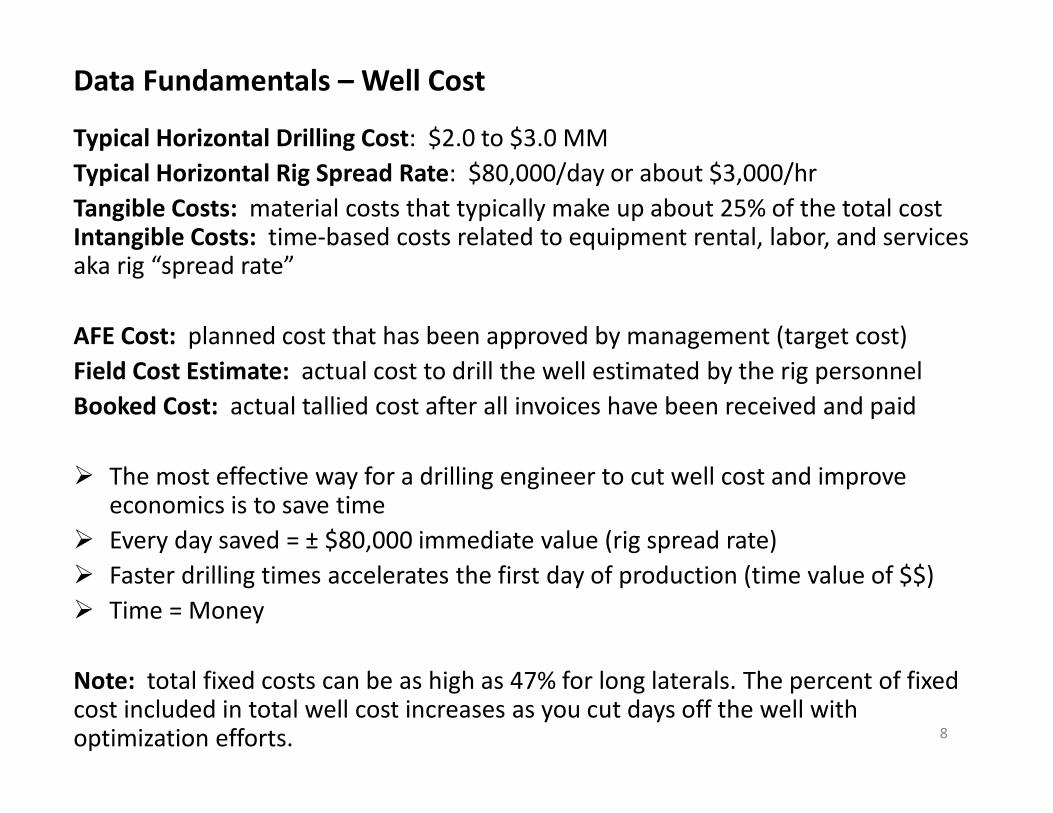
Typical Horizontal Drilling Cost: $2.0 to $3.0 MM
Typical Horizontal Rig Spread Rate: $80,000/day or about $3,000/hr
Tangible Costs: material costs that typically make up about 25% of the total cost Intangible Costs: time-based costs related to equipment rental, labor, and services aka rig “spread rate”
AFE Cost: planned cost that has been approved by management (target cost)
Field Cost Estimate: actual cost to drill the well estimated by the rig personnel
Booked Cost: actual tallied cost after all invoices have been received and paid
� The most effective way for a drilling engineer to cut well cost and improve economics is to save time
� Every day saved = ± $80,000 immediate value (rig spread rate)
� Faster drilling times accelerates the first day of production (time value of $$)
� Time = Money
Note: total fixed costs can be as high as 47% for long laterals. The percent of fixed cost included in total well cost increases as you cut days off the well with optimization efforts.
Data Fundamentals – Cycle Time
9
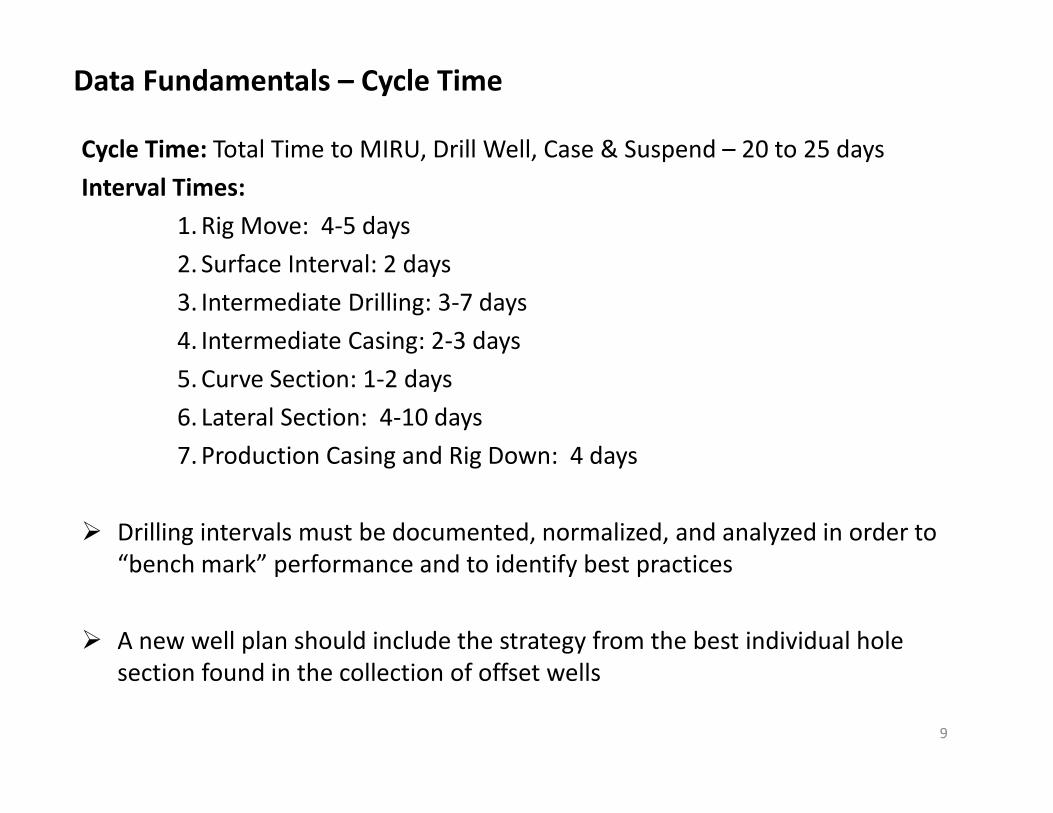
Cycle Time: Total Time to MIRU, Drill Well, Case & Suspend – 20 to 25 days
Interval Times:
1. Rig Move: 4-5 days
2. Surface Interval: 2 days
3. Intermediate Drilling: 3-7 days
4. Intermediate Casing: 2-3 days
5. Curve Section: 1-2 days
6. Lateral Section: 4-10 days
7. Production Casing and Rig Down: 4 days
� Drilling intervals must be documented, normalized, and analyzed in order to
“bench mark” performance and to identify best practices
� A new well plan should include the strategy from the best individual hole
section found in the collection of offset wells

Data Fundamentals – Normalization
10
Depth: Rate of Progress (ft/day)
1. Intermediate Drilling• Ex. 6,000 ft interval in 3.0 days = 2,000 ft/day (include any bit trips)
2. Curve/Lateral Drilling • Ex. 10,000 ft interval in 8 days = 1,667 ft/day (include any bit trips)
3. Spud to TD• Ex. 16,0000 ft well in 16 days = 1,000 ft/day
4. Rig Accept to Rig Release• Ex. 16,0000 ft well in 20 days = 800 ft/day
Cost: Cost per foot (cost/ft)• Ex. $2,500,000/ 16,000 ft = $156/ft
Time: Days per 10k (days/10k)• Ex. 20 days/(16,000 ft/10,000) = 12.5 days/10k
� Normalization allows one to compare performance on a set of wells with different depths in the same field to identify best practices

12-1/4” Intermediate Section Best Practices
11
Choose Bit & BHA design to minimize vibrations (impact damage)
• Stabilizer on bottom of motor (1/2” under gauge)
• Stabilizer right above motor (1/2” under gauge)
• 300 ft of 8” Drill Collars and 200 ft of 5” HWDP (transition)
Drilling Parameters are of utmost importance
• Drill with a target “differential pressure” of 400-700 psi (on bottom pressure –
off bottom pressure)
• Keep the bit engaged on bottom to prevent whirl and downhole vibration
• Each rig’s auto-driller settings must be calibrated for thru trial and error
• Adjust settings to achieve smooth ROP curve to avoid dumping weight on the
bit aka “see-sawing”
� Study Fred Dupriest Texas A&M Presentation
� Potential to save 2-4 days per well ($150-$300,000)

Drilling Optimization – Intermediate Section
12
Data from one Laredo 7500 psi Horizontal Rig, 2015 YTD, Upper and Middle Wolfcamp targets
17% improvement vs. top performing rig in fleet in 2014
Average of most recent 4 wells shows 74% improvement vs. first 3 wells
2014 Top Rig
FY Avg= 1,583

8-1/2” Curve Section Best Practices
13
Plan curve’s on 8 deg/100 dogleg (if possible)
• Eliminate two unplanned trips caused by insufficient build rates
• 1st trip to pick up bigger bend motor
• Second trip lay down big bend and to pick up small bend lateral BHA
Utilize short-bit-to-bend motors
• 4.2 – 4.6 ft length from bit box (bottom of motor) to bend in housing
• Three point geometry allows for higher build rates on smaller bend motors
• Study three-point geometry
• Allows for a “one-run” BHA strategy
• Drill the curve with a BHA that is optimal for lateral drilling (eliminates a trip)
� Potential to save 2 days per well ($150,000)
8-1/2” Lateral Best Practices
14
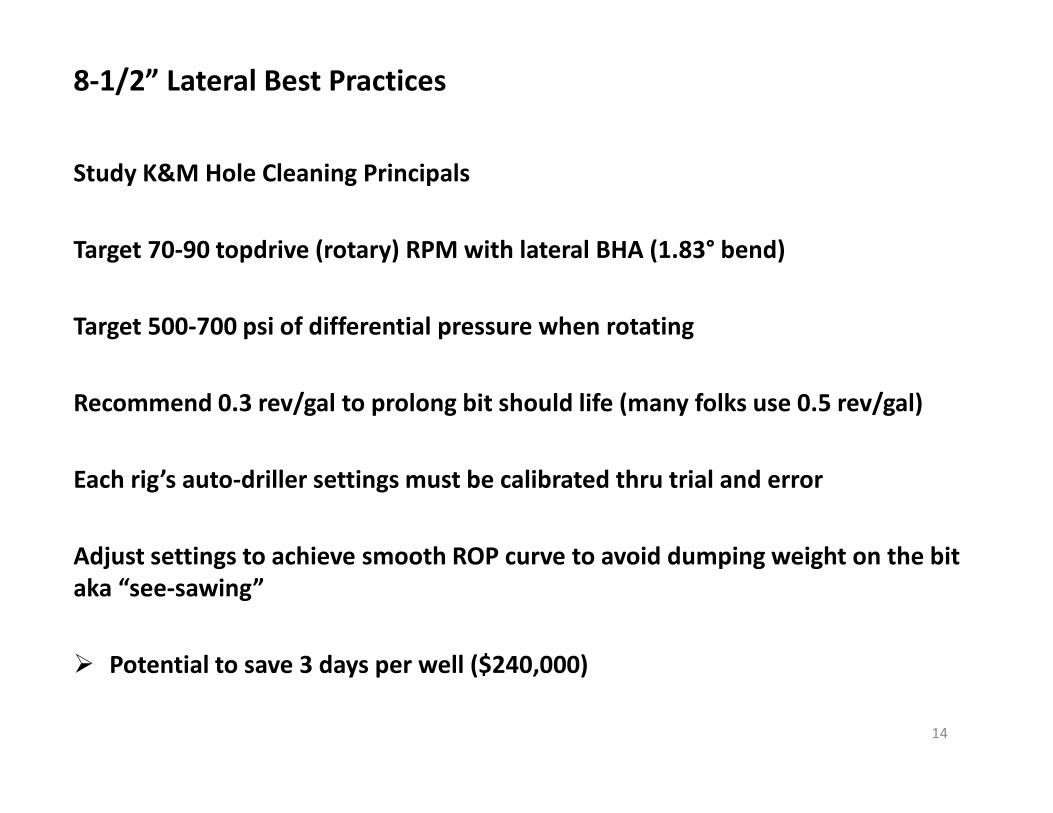
Study K&M Hole Cleaning Principals
Target 70-90 topdrive (rotary) RPM with lateral BHA (1.83° bend)
Target 500-700 psi of differential pressure when rotating
Recommend 0.3 rev/gal to prolong bit should life (many folks use 0.5 rev/gal)
Each rig’s auto-driller settings must be calibrated thru trial and error
Adjust settings to achieve smooth ROP curve to avoid dumping weight on the bit
aka “see-sawing”
� Potential to save 3 days per well ($240,000)

K&M Rotary RPM Recommendation for Lateral Drilling
15
• K&M recommends minimum of 70 rotary RPM’s to effectively clean an 8 ½” hole
• Direct correlation between increased RPMs and increased ROP
Sourced from K&M 5 day ERD
course manual

Drilling Optimization – Curve/Lateral
16
Data from one Laredo 7500 psi Horizontal Rig, 2015 YTD, Upper and Middle Wolfcamp targets
17% improvement vs. top performing rig in fleet in 2014
27% improvement without well #3 which encountered wellbore instability
2014 Top Rig
FY Avg= 1,410

Takeaways
Permian Basin is rich in learning opportunities
Some important best practices differ greatly by target zone
Hard to keep up with 4 Horizontal target zones
Best practices are often hidden in the data
Study failures and try not to make the same mistake twice
Question, investigate, and confirm anecdotal recommendations
Data collection/analysis is critical and must drive your decisions
Focus on continuous improvement and best practices to drive optimization
Methodically test boundaries and new technologies to reach the next level of performance

Questions

Tips for the Young Engineer
Technical writing, excel, presentation, and computer modeling skills are very important in the real world
Time management is key: keep detailed action item lists, project outlines, and calendar reminders
Keep organized files for all wells, all projects, and all technical info. Your ability to find and utilize previous knowledge/data can set you apart.
Field Experience is critical to gain first hand knowledge, rapport, and credibility
Study principals of teamwork, leadership, and emotional intelligence
Constantly seek out mentors
Don’t be afraid of failure. Seek out challenges and learning opportunities. Get out of your comfort zone on occasion.
Study public investor presentations for your employer and your competitors to understand big picture
Network with other engineers working in same field and/or at peer companies
Manage your own career. Set short and long term goals and review progress every year.
Document your results and accomplishments (include supporting data where possible)
Focus on data analysis, lessons learned, best practices. Be data-driven, not anecdotal.
You must have intellectual integrity. Be open minded. Don’t be afraid to admit that you were wrong to your peers or your supervisors.
Backup Slides 20

Project Background
• Garden City Project: SE Glasscock and NE Reagan Cty
• 3 String Well Design: 13-3/8” x 9-5/8” x 5-1/2”
• 1 to 4-well pads
Drilling Data Background
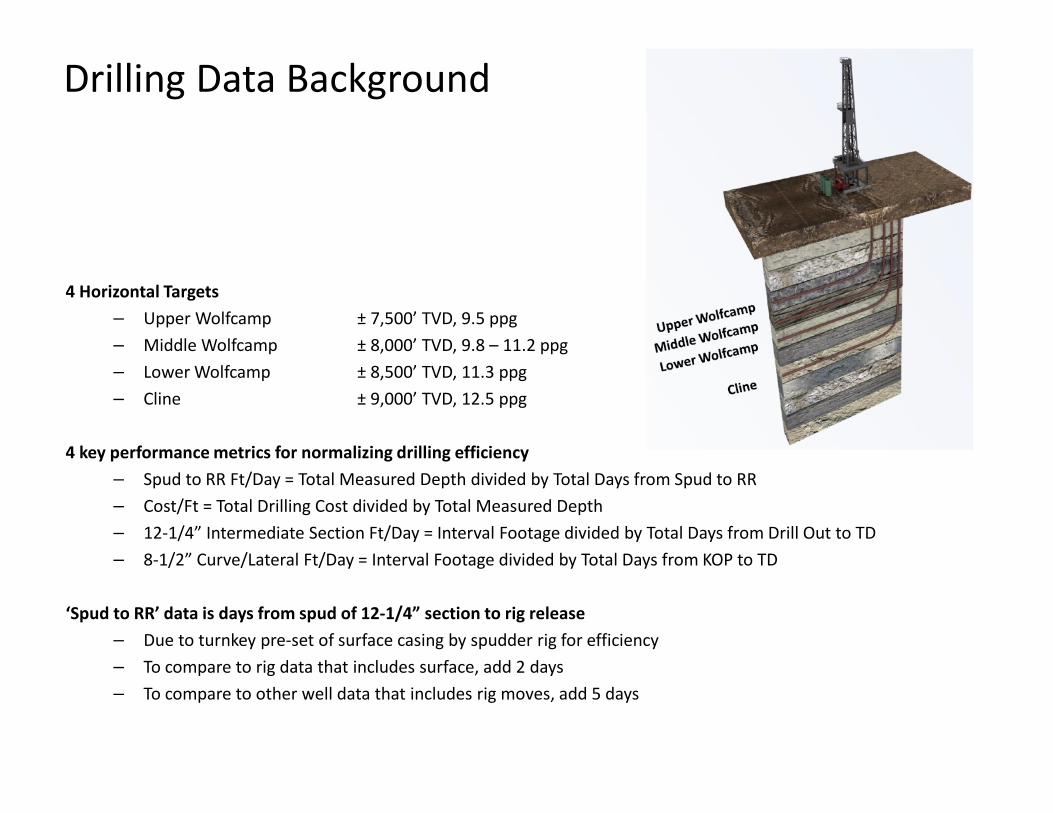
4 Horizontal Targets
– Upper Wolfcamp ± 7,500’ TVD, 9.5 ppg
– Middle Wolfcamp ± 8,000’ TVD, 9.8 – 11.2 ppg
– Lower Wolfcamp ± 8,500’ TVD, 11.3 ppg
– Cline ± 9,000’ TVD, 12.5 ppg
4 key performance metrics for normalizing drilling efficiency
– Spud to RR Ft/Day = Total Measured Depth divided by Total Days from Spud to RR
– Cost/Ft = Total Drilling Cost divided by Total Measured Depth
– 12-1/4” Intermediate Section Ft/Day = Interval Footage divided by Total Days from Drill Out to TD
– 8-1/2” Curve/Lateral Ft/Day = Interval Footage divided by Total Days from KOP to TD
‘Spud to RR’ data is days from spud of 12-1/4” section to rig release
– Due to turnkey pre-set of surface casing by spudder rig for efficiency
– To compare to rig data that includes surface, add 2 days
– To compare to other well data that includes rig moves, add 5 days

2014 Rig Team Results with a Data-Driven Approach
Looks even better when normalized for Depth and Lateral Length….
21 wells on 2 rigs in study April to Dec 2014. Spud to RR is spud of 12-1/4” section due to turnkey pre-set of surface with spudder rig for efficiency
Target Zone
Q1 2014
Days
Spud to RR
Q4 2014
Days
Spud to RR
Days
Reduced Improvement
Upper Wolfcamp 28 18 10 36%
Middle Wolfcamp 28 16 11.8 43%
Middle Wolfcamp - 26 - -
Lower Wolfcamp 37 24 12.5 34%
Cline - Wolfcamp - 30 - -
Target Zone
Q1 2014
Ft/Day
Spud to RR
Q4 2014
Ft/Day
Spud to RR Delta Improvement
Upper Wolfcamp 532 837 305 57%
Middle Wolfcamp 537 992 455 85%
Middle Wolfcamp - 600 - -
Lower Wolfcamp 426 672 246 58%
Cline - Wolfcamp - 644 - -
12-1/4” Intermediate Drilling Best Practices
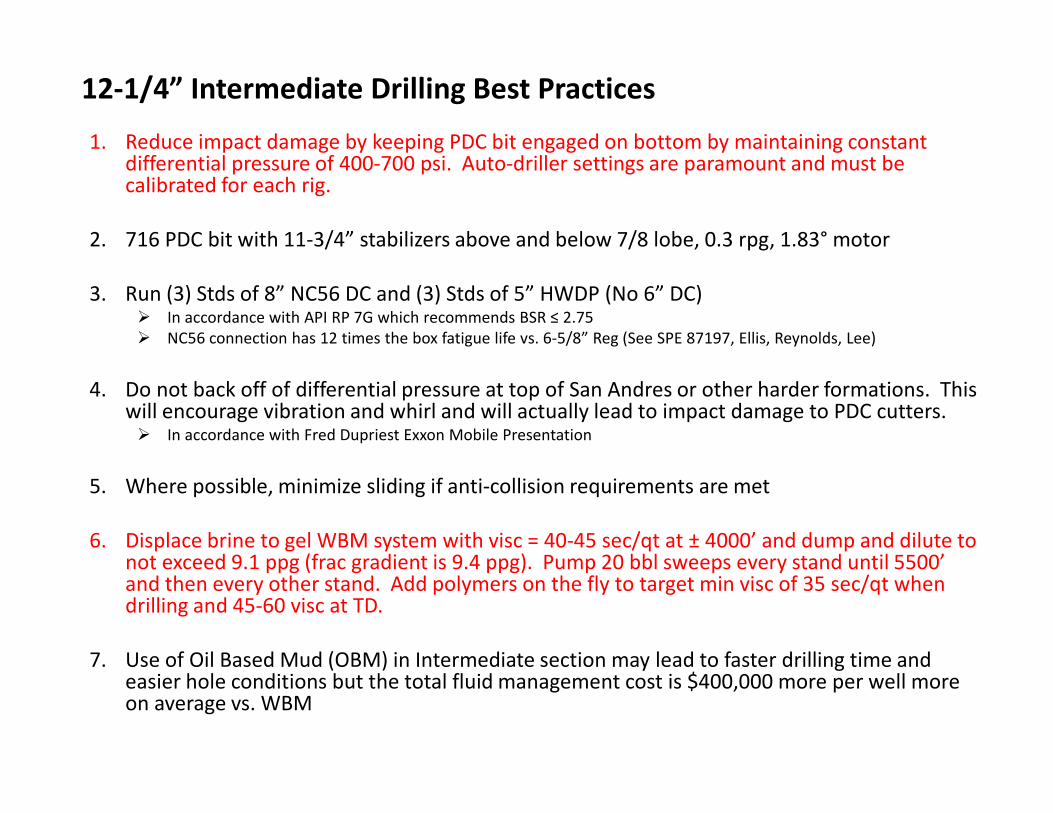
1. Reduce impact damage by keeping PDC bit engaged on bottom by maintaining constant differential pressure of 400-700 psi. Auto-driller settings are paramount and must be calibrated for each rig.
2. 716 PDC bit with 11-3/4” stabilizers above and below 7/8 lobe, 0.3 rpg, 1.83° motor
3. Run (3) Stds of 8” NC56 DC and (3) Stds of 5” HWDP (No 6” DC)� In accordance with API RP 7G which recommends BSR ≤ 2.75
� NC56 connection has 12 times the box fatigue life vs. 6-5/8” Reg (See SPE 87197, Ellis, Reynolds, Lee)
4. Do not back off of differential pressure at top of San Andres or other harder formations. This will encourage vibration and whirl and will actually lead to impact damage to PDC cutters.� In accordance with Fred Dupriest Exxon Mobile Presentation
5. Where possible, minimize sliding if anti-collision requirements are met
6. Displace brine to gel WBM system with visc = 40-45 sec/qt at ± 4000’ and dump and dilute to not exceed 9.1 ppg (frac gradient is 9.4 ppg). Pump 20 bbl sweeps every stand until 5500’ and then every other stand. Add polymers on the fly to target min visc of 35 sec/qt when drilling and 45-60 visc at TD.
7. Use of Oil Based Mud (OBM) in Intermediate section may lead to faster drilling time and easier hole conditions but the total fluid management cost is $400,000 more per well more on average vs. WBM

9-5/8” Casing & Cementing Best Practices
1. Place DV Tool and External Casing Packer 200’ above top of Clear Fork formation
2. Circulate BU with cement unit, then swap to rig pumps and circulate for 4 hours between stages to allow Stage 1 cement to set up in case the packer doesn’t fully isolate weak zones below
3. Plan minimum cement slurry density and height to meet RRC requirements to reduce the chances of lost returns� Stage 1: 500’ of 13.2 ppg H-plus tail, 11.9 ppg 50/50 H-Poz (10% excess)
� Stage 2: 300’ of 13.5 ppg C (100% excess), 11.9 ppg 50/50 C-Poz (250% excess )
� Understand cost/bbl of lead cement and compare to spread rate cost to run temp log. Break even point is circulating and dumping roughly 200 bbls of cement to surface (don’t be afraid to pump high excess on stage 2 lead)
4. Do not over-displace any portion of shoe tract. Not much downside to having to drill out a little extra cement (different for production casing)
5. For this geographical area, in this data set, we have been 100% successful in achieving required shoe integrity for all target zones when placing the 9-5/8” shoe 60’ above KOP with the curve planned on 8s
6. If insufficient cement top is achieved, and temp log is inconclusive, run Ultrasonic Inspection Log to determine top of cement. The lightweight lead cement often doesn’t show up on a traditional bond log but is visible on the USIT log.
7. Install rotating head rubber after drilling out 9-5/8” shoe tract and circulating out plug debris.

8-1/2” Curve/Lateral Best Practices
1. Where possible, utilize short bit-to-bend (4.2’ to 4.5’) 1.83° motors and 516 PDC bits that are efficient in both the curve and lateral which allows for one-run BHA strategy
2. Utilize 7/8 Lobe, 0.3 rev/gal slow speed motors in all zones. This allows you to run optimal topdrive rpms for hole cleaning (70-90) while reducing revs at the bit to prolong bit life (shoulder wear) in harder formations.
3. Utilize K&M drilling parameters (70- 90 RPMs) in the lateral for optimal hole cleaning and ROP
4. Target 450 – 650 differential pressure when rotating in the lateral
5. Weight up to max expected mud weight by 30° in the curve to avoid instability
6. Plan curves on 8° /100 to avoid cost of ± $180,000 2-trip scenario for insufficient BRs
7. Always know your lowest landing limit and your DL needed to land at the limit prior to tripping for a higher bend motor
8. Perform Formation Integrity Test after drilling out 9-5/8” shoe to confirm integrity of primary cement job and to confirm ability to achieve the mud weight required to drill the planned landing point
9. Prior to spending > $30,000 to pull rods and run a gyro survey in offset vertical wells, determine NPV of existing well, and utilize a risk-based calculation to determine chance of collision and risked cost of collision.
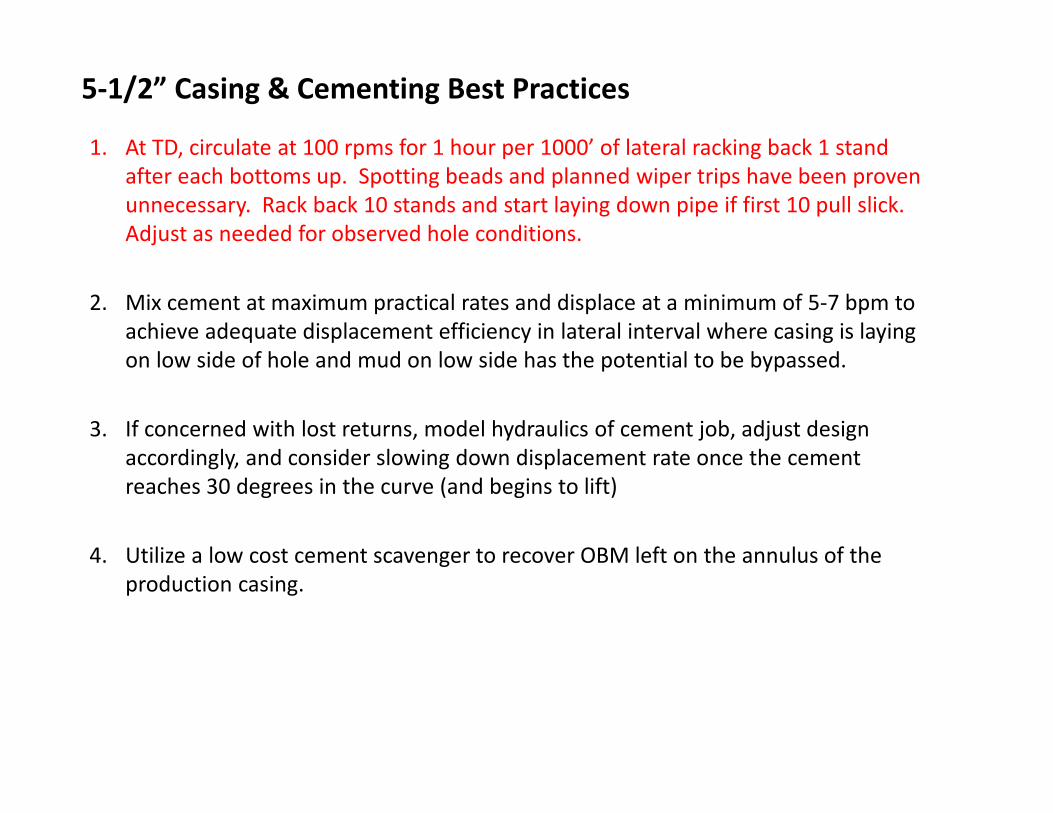
5-1/2” Casing & Cementing Best Practices
1. At TD, circulate at 100 rpms for 1 hour per 1000’ of lateral racking back 1 stand
after each bottoms up. Spotting beads and planned wiper trips have been proven
unnecessary. Rack back 10 stands and start laying down pipe if first 10 pull slick.
Adjust as needed for observed hole conditions.
2. Mix cement at maximum practical rates and displace at a minimum of 5-7 bpm to
achieve adequate displacement efficiency in lateral interval where casing is laying
on low side of hole and mud on low side has the potential to be bypassed.
3. If concerned with lost returns, model hydraulics of cement job, adjust design
accordingly, and consider slowing down displacement rate once the cement
reaches 30 degrees in the curve (and begins to lift)
4. Utilize a low cost cement scavenger to recover OBM left on the annulus of the
production casing.
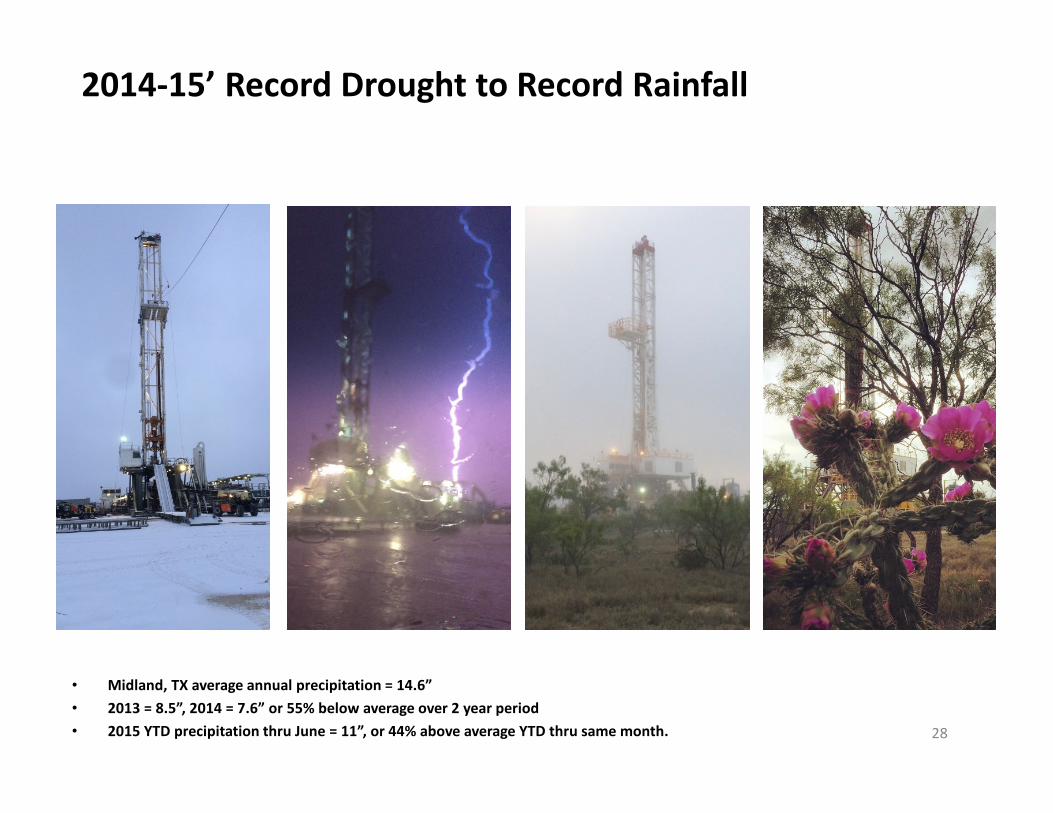
2014-15’ Record Drought to Record Rainfall
28
• Midland, TX average annual precipitation = 14.6”
• 2013 = 8.5”, 2014 = 7.6” or 55% below average over 2 year period
• 2015 YTD precipitation thru June = 11”, or 44% above average YTD thru same month.

Midland Basin Wildlife
29
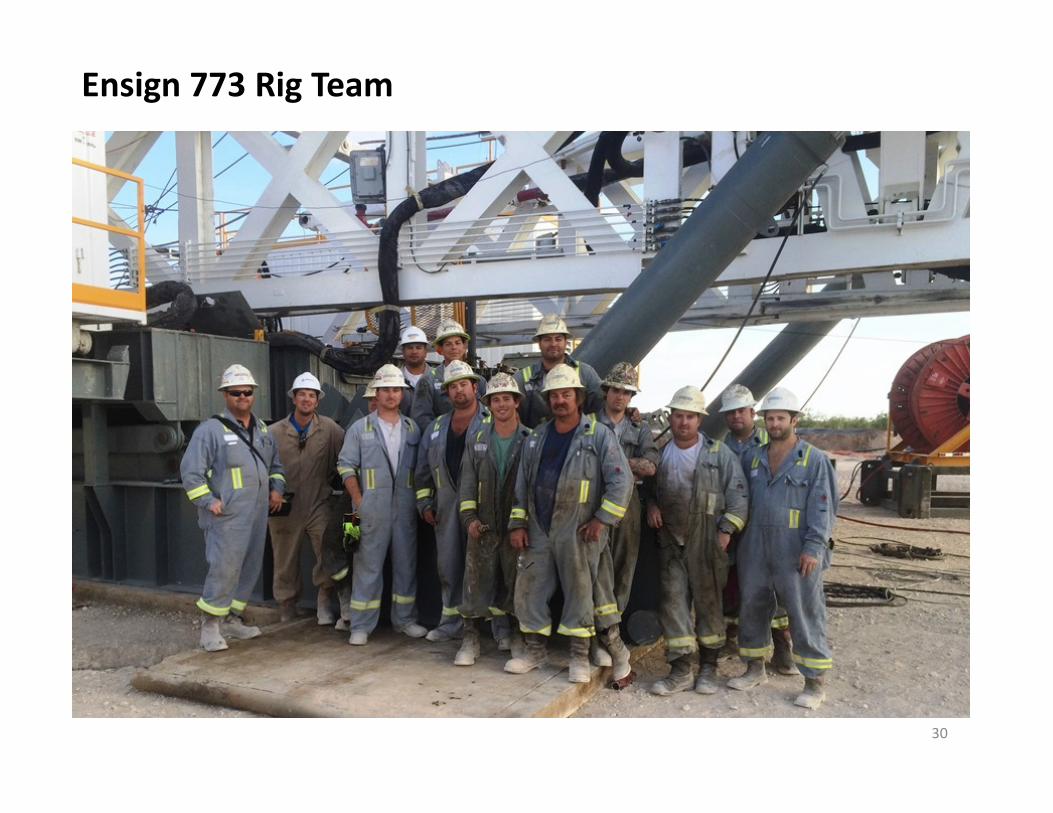
Ensign 773 Rig Team
30