from feelings and perceptions to data driven decisions
TRANSCRIPT

From Feelings & Perceptions to Data Driven Decisions: Data, Tools, People and Processes
ASUG New York – June 15, 2016
Pat Saporito, Sr. Dir., GCOE for Analytics, SAP
© 2016 SAP AG. All rights reserved. 2
Agenda
Intuition vs. Experiential Decisioning
Analytics Trends & Challenges
Data Driven Capabilities
Key Take Aways

© 2016 SAP AG. All rights reserved. 3
Are you data driven or HIPPO driven?
© 2016 SAP AG. All rights reserved. 4
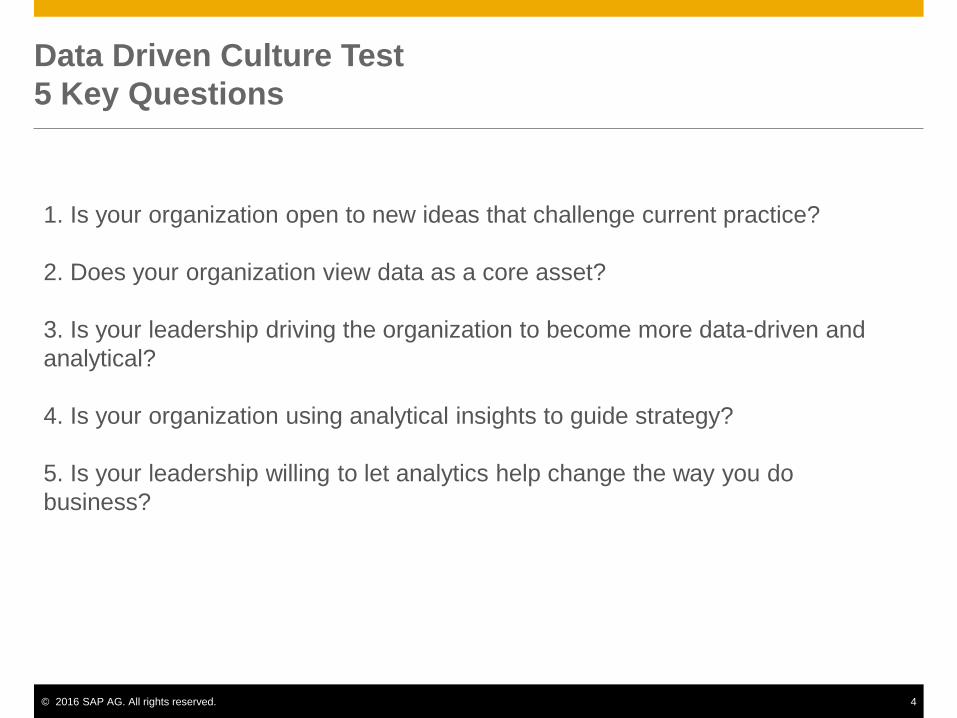
Data Driven Culture Test
5 Key Questions
1. Is your organization open to new ideas that challenge current practice?
2. Does your organization view data as a core asset?
3. Is your leadership driving the organization to become more data-driven and
analytical?
4. Is your organization using analytical insights to guide strategy?
5. Is your leadership willing to let analytics help change the way you do
business?
© 2016 SAP AG. All rights reserved. 5
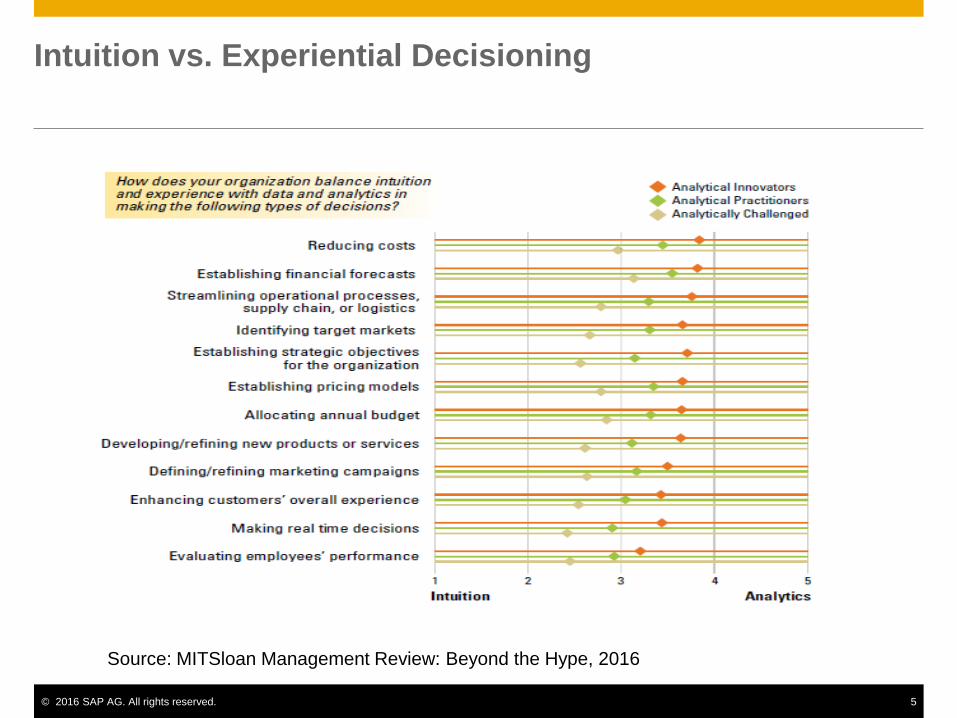
Intuition vs. Experiential Decisioning
Source: MITSloan Management Review: Beyond the Hype, 2016
© 2016 SAP AG. All rights reserved. 6
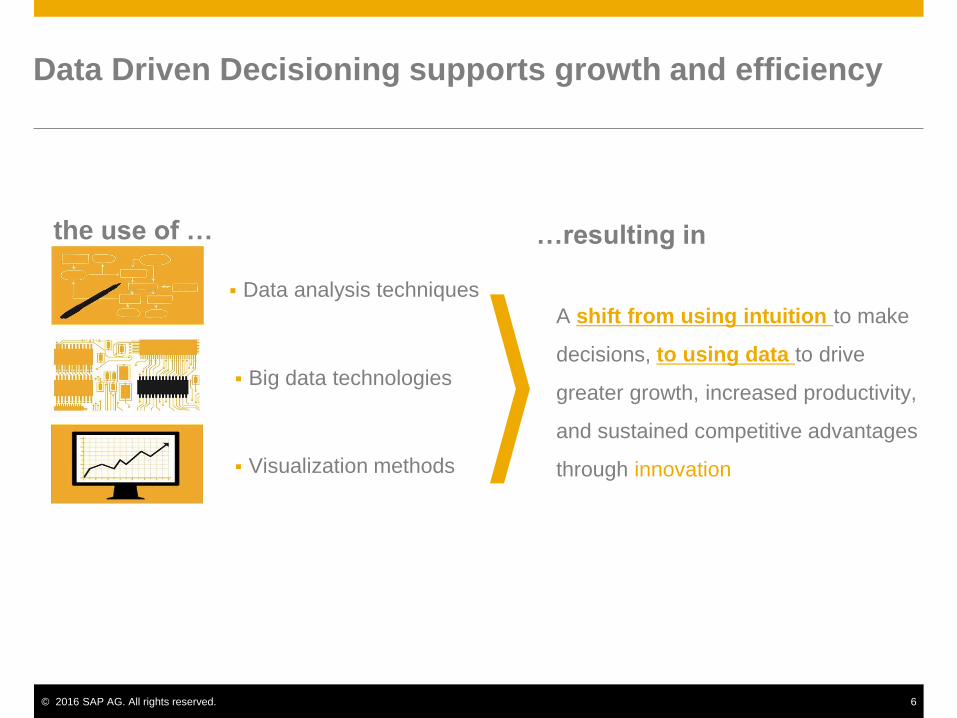
A shift from using intuition to make
decisions, to using data to drive
greater growth, increased productivity,
and sustained competitive advantages
through innovation
…resulting in
Data analysis techniques
Visualization methods
Big data technologies
Data Driven Decisioning supports growth and efficiency
the use of …
© 2016 SAP AG. All rights reserved. 7
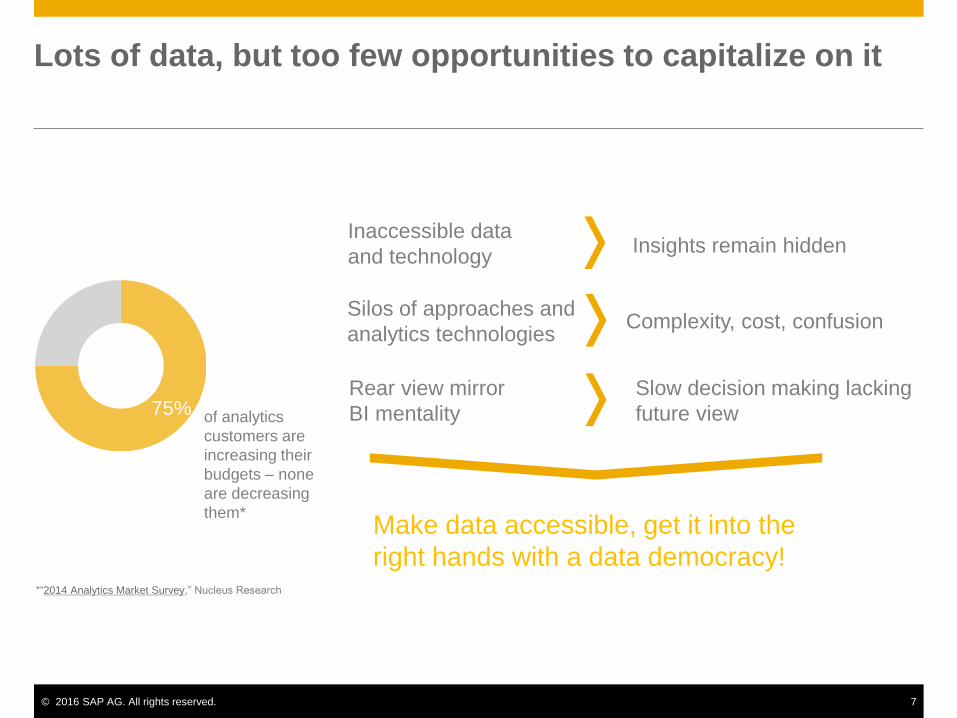
Lots of data, but too few opportunities to capitalize on it
Make data accessible, get it into the
right hands with a data democracy!
Inaccessible data
and technologyInsights remain hidden
Complexity, cost, confusionSilos of approaches and
analytics technologies
Slow decision making lacking
future view
Rear view mirror
BI mentality
*“2014 Analytics Market Survey,” Nucleus Research
of analytics
customers are
increasing their
budgets – none
are decreasing
them*
75%

© 2016 SAP AG. All rights reserved. 8
Business Requirements are Changing…
IT’s role is changing too!
Source: Forrester whitepaper

© 2016 SAP AG. All rights reserved. 9
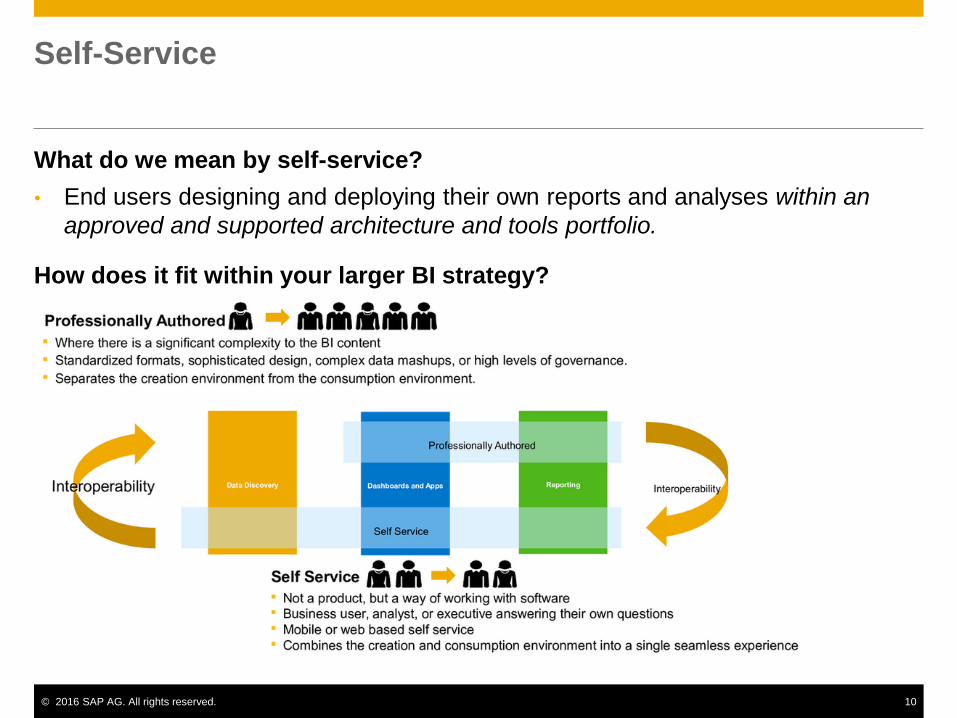
Provides professional authoring where there is significant complexity.
Addresses standardized formats, sophisticated design, complex data mash-ups, or high levels of governance.
Separates creation environment from the consumption environment.
Enables self-service
Business user, analyst, or executive can answer their own questions.
Mobile or web based self service.
Combines creation and consumption environment into a single seamless experience.
Enterprise Analytics Agile BI
Agile BIEnterprise Analytics
Self-Service Enabled
Enterprise Analytics & Agile BI
Standardize, Simplify, Eliminate
Common Data
Platform
© 2016 SAP AG. All rights reserved. 10
What do we mean by self-service?
• End users designing and deploying their own reports and analyses within an
approved and supported architecture and tools portfolio.
How does it fit within your larger BI strategy?
Self-Service

© 2016 SAP AG. All rights reserved. 11
BI/Analytics Strategy FrameworkBuilding Blocks of a Rock Solid Strategy
ObjectivesBusiness
Needs
Business
BenefitTechnology Organization
Background and
Purpose
Current State and
History
Objectives and
Scope
Summary of Needs
Envisioned To-Be
State
Priorities and
Alignment
Value Proposition
Expected Benefits
– Future State KPI
Business Case
Information
Categories
Architecture and
Standards
Tools &
Applications
Governance
Structure
Program
Management
Roadmap and
Milestones
Measurement
Education/ Training
Support
Self Service should be part of your overall strategy
© 2016 SAP AG. All rights reserved. 12
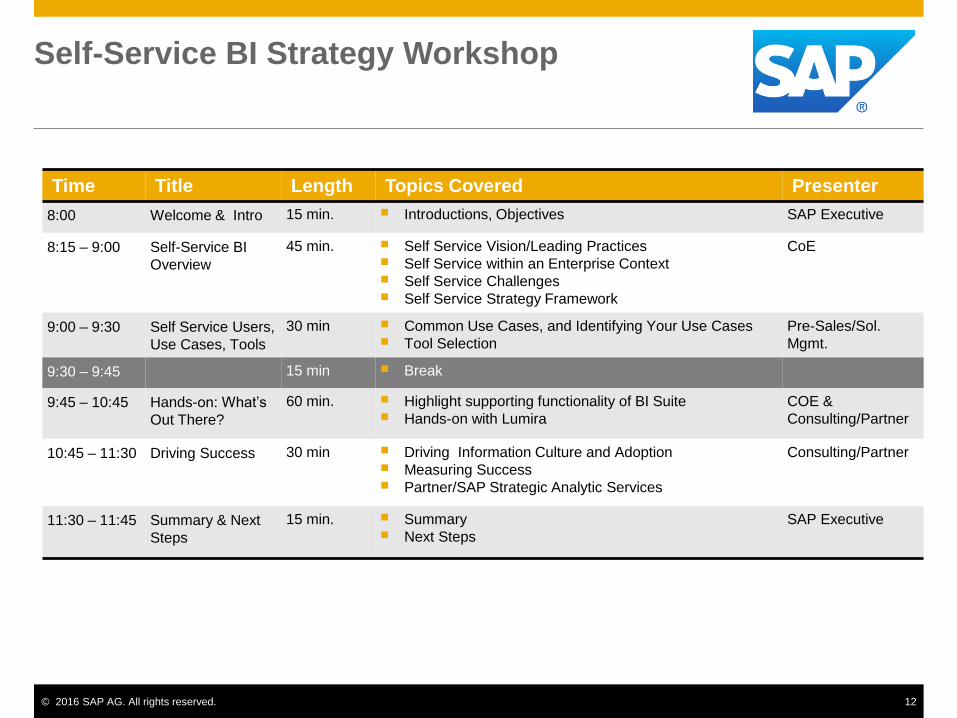
Self-Service BI Strategy Workshop
Time Title Length Topics Covered Presenter
8:00 Welcome & Intro 15 min. Introductions, Objectives SAP Executive
8:15 – 9:00 Self-Service BI
Overview
45 min. Self Service Vision/Leading Practices Self Service within an Enterprise Context Self Service Challenges Self Service Strategy Framework
CoE
9:00 – 9:30 Self Service Users,
Use Cases, Tools
30 min Common Use Cases, and Identifying Your Use Cases Tool Selection
Pre-Sales/Sol.
Mgmt.
9:30 – 9:45 15 min Break
9:45 – 10:45 Hands-on: What’s
Out There?
60 min. Highlight supporting functionality of BI Suite Hands-on with Lumira
COE &
Consulting/Partner
10:45 – 11:30 Driving Success 30 min Driving Information Culture and Adoption Measuring Success Partner/SAP Strategic Analytic Services
Consulting/Partner
11:30 – 11:45 Summary & Next
Steps
15 min. Summary Next Steps
SAP Executive

© 2016 SAP AG. All rights reserved. 13
Rx for Analytics Success: Strategy + Center of Excellence (COE)
Understand Business Pains
Identify technology gaps
Focus on change management and adoption
Strategy creates an information driven culture:
COE provides a sustainable framework to execute the strategy and
maintain it.

© 2016 SAP AG. All rights reserved. 14
Data Challenges
Challenges
• Data is everywhere
• Multiple data types
• Data integration
• Analytics tools
• Analytics skills
• Resistance to change
Impact
• Data silos
• Data credibility
• Data access
• Lack of data use
• GIGO – “Junk” analytics
• Gut based decisions
© 2016 SAP AG. All rights reserved. 15
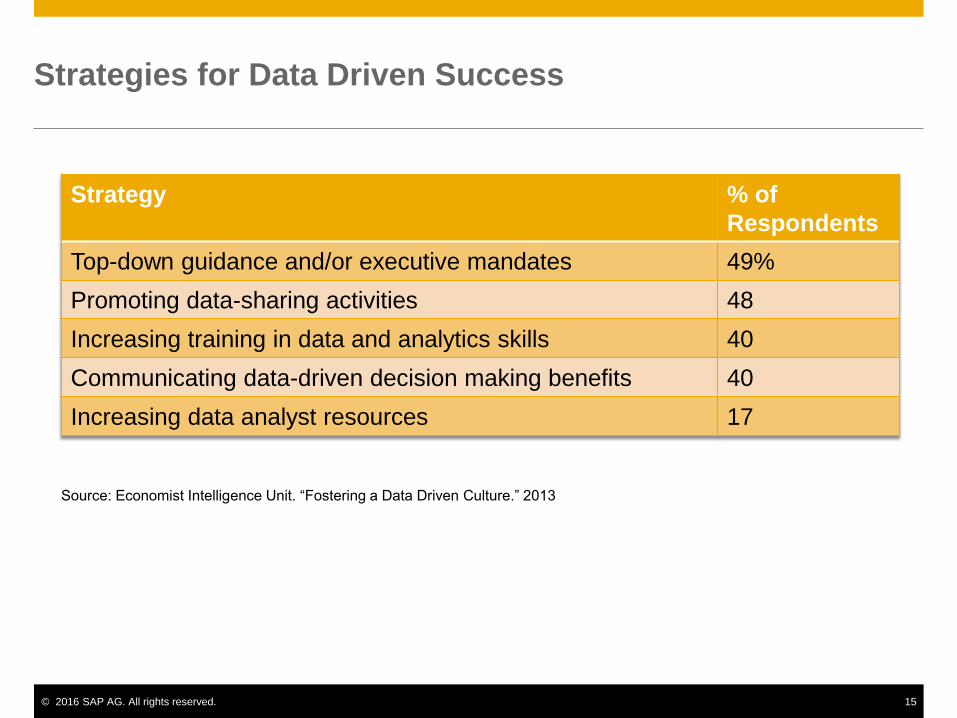
Strategies for Data Driven Success
Strategy % of
Respondents
Top-down guidance and/or executive mandates 49%
Promoting data-sharing activities 48
Increasing training in data and analytics skills 40
Communicating data-driven decision making benefits 40
Increasing data analyst resources 17
Source: Economist Intelligence Unit. “Fostering a Data Driven Culture.” 2013

© 2016 SAP AG. All rights reserved. 16
Key Data Driven Capabilities
CultureData & Analytics
LeadershipDecision Making
People Data Organization
Collaborative
Inclusive
Open
Inquisitive
Chief Analytics/Data
Officer
Executive sponsorship
Communicating value
Fact based
Not HIPPO driven
Skills & Training
Incentives & Recognition
Communities of Interest
Data Strategy
Accessible &
Understandable
Trusted
BI/Analytics Strategy
BI/Analytics COE
Governance

© 2016 SAP AG. All rights reserved. 17
Culture & Change Management
Lead from the top, but engage all levels
Build analytics into every strategic initiative
Understand your culture and potential barriers
Incent and recognize desired behavior
Provide constant, consistent communication
© 2016 SAP AG. All rights reserved. 18
Self-Service Success Factors
• Know your users, required functionality & data needs.
• Identify special requirements beyond standard content.
• Choose BI tools that serve multiple use cases.
• Use BI rationalization to simplify end user ease of use
and administrative effort
• Use BI on BI to measure and manage success

© 2016 SAP AG. All rights reserved. 19
BI on BI example
Report View by Usage Date and Folder
Sample BI on BI Assessment Using Sherlock for SAP BusinessObjects from EV Technologies
© 2016 SAP AG. All rights reserved. 20
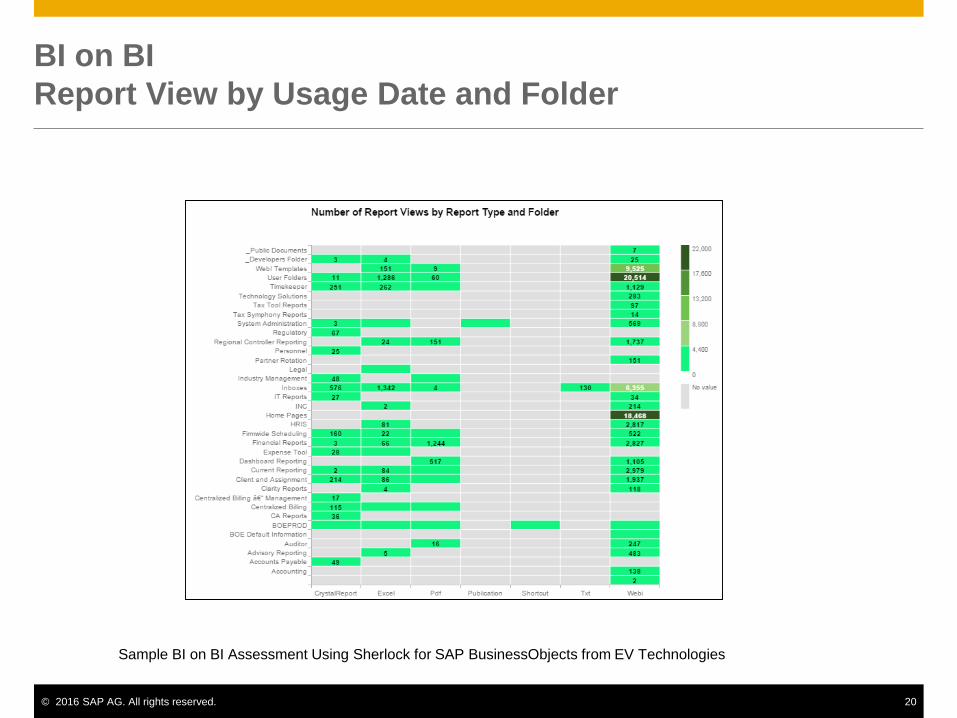
BI on BI
Report View by Usage Date and Folder
Sample BI on BI Assessment Using Sherlock for SAP BusinessObjects from EV Technologies
© 2016 SAP AG. All rights reserved. 21
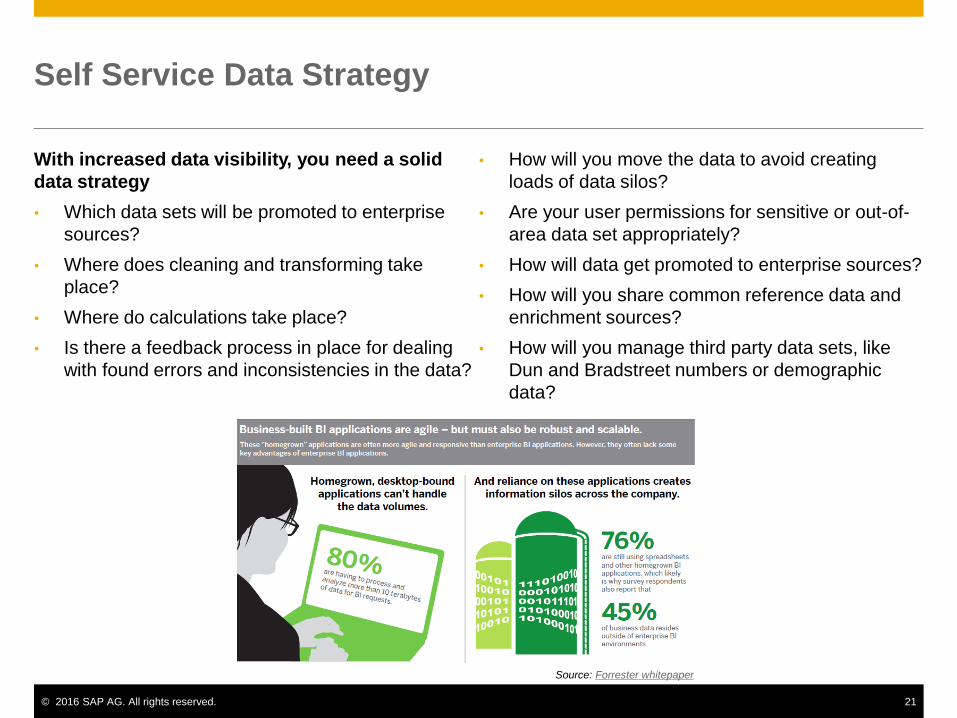
Self Service Data Strategy
With increased data visibility, you need a solid
data strategy
• Which data sets will be promoted to enterprise
sources?
• Where does cleaning and transforming take
place?
• Where do calculations take place?
• Is there a feedback process in place for dealing
with found errors and inconsistencies in the data?
• How will you move the data to avoid creating
loads of data silos?
• Are your user permissions for sensitive or out-of-
area data set appropriately?
• How will data get promoted to enterprise sources?
• How will you share common reference data and
enrichment sources?
• How will you manage third party data sets, like
Dun and Bradstreet numbers or demographic
data?
Source: Forrester whitepaper
© 2016 SAP AG. All rights reserved. 22
Communication is Key
Build and Nurture a Community
Face-to-face meetings
• Bring people together across silos: IT, Analysts, Business Leaders, Execs
• Presentations of successes best practices
• Invite external speakers
Virtual communities
• Leverage internal social tools for people to share information
• Community-driven BI content
Community self-policing
• Act as BICC eyes and ears to discover projects,
opportunities
• Social mechanisms to ensure the “right behaviors”
Provide support at all levels
• Not just executives — middle and users
© 2016 SAP AG. All rights reserved. 23
IT “Agency Services” for business users
• Innovation Services: helping find solutions to business problems
rather than being responsible for a technology infrastructure,
including running innovation workshops.
• Training: offering training on tools, data, and best-practice
techniques.
• Data Bureau: providing a one-stop shop for data, internal or
external, structured or unstructured. Work closely with the
information governance team.
• Tools Bureau: recommending which technologies to use.
• Sandbox Environments: providing sandbox environments that let businesses create their own large-
scale data stores, using a centralized infrastructure.
• Marketing and Community Building: communicating BI success and encouraging active participation
in the BI community.
• Support for BI Collaboration: Driving collaboration tools around proposing new opportunities and
iteratively getting to the right solution.

© 2016 SAP AG. All rights reserved. 24
Key Takeaways for Data Driven Decisioning Success
Define and prioritize your business needs
Assess your data and analytic strategy
Assess your user skills and tools
Establish a BI /Analytics competency center
Create an analytic sandbox to address emerging needs
Establish communities of interest
Address culture and change management effort needed
Communicate – Communicate – Communicate!

Thank you!Pat Saporito
Sr. Dir., Global COE for Analytics, SAP
@patsaporito
www.patsaporito.com
© 2016 SAP AG. All rights reserved. 26
Additional Tips
• Run a holistic BI/Analytics strategy workshop: www.sap.com/bistrategy
• Establish your data strategy with an Information Governance Assessment
workshop. Start by using the online assessment tool. (IT-Project Managers,
Directors, LOB Leads).
• For super-fast deployment, try out Cloud for Analytics! (Designers and Analysts)
• Get ready for the newest innovations by upgrading to BI 4.2. Schedule a BI
Upgrade Technical workshop (IT-Project Managers, System
Administrators/Architects).
• Dive deeper with Lumira and Design Studio Technical 2-3 day workshop (BI
Administrators, Designers, and Analysts).
• Play with the sample datasets that ship with Lumira Desktop
• Check out tutorial videos on YouTube and SCN
© 2016 SAP AG. All rights reserved. 27
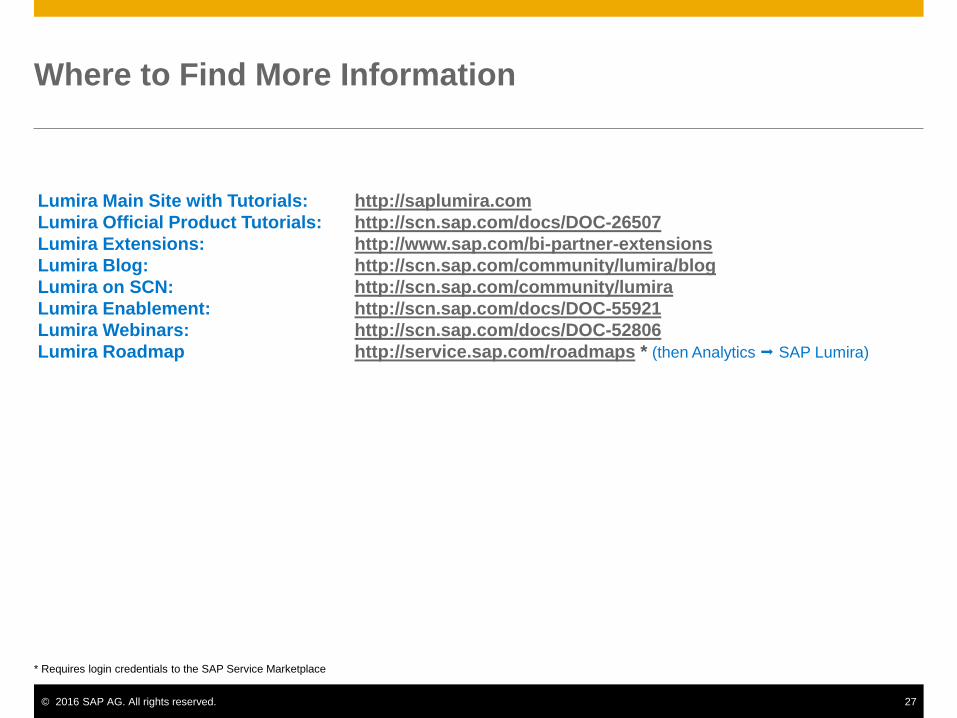
Where to Find More Information
Lumira Main Site with Tutorials: http://saplumira.com
Lumira Official Product Tutorials: http://scn.sap.com/docs/DOC-26507
Lumira Extensions: http://www.sap.com/bi-partner-extensions
Lumira Blog: http://scn.sap.com/community/lumira/blog
Lumira on SCN: http://scn.sap.com/community/lumira
Lumira Enablement: http://scn.sap.com/docs/DOC-55921
Lumira Webinars: http://scn.sap.com/docs/DOC-52806
Lumira Roadmap http://service.sap.com/roadmaps * (then Analytics SAP Lumira)
* Requires login credentials to the SAP Service Marketplace