from cradle to college and career education results network meeting june 7, 2012
TRANSCRIPT

From Cradle to College and Career
Education Results Network MeetingJune 7, 2012
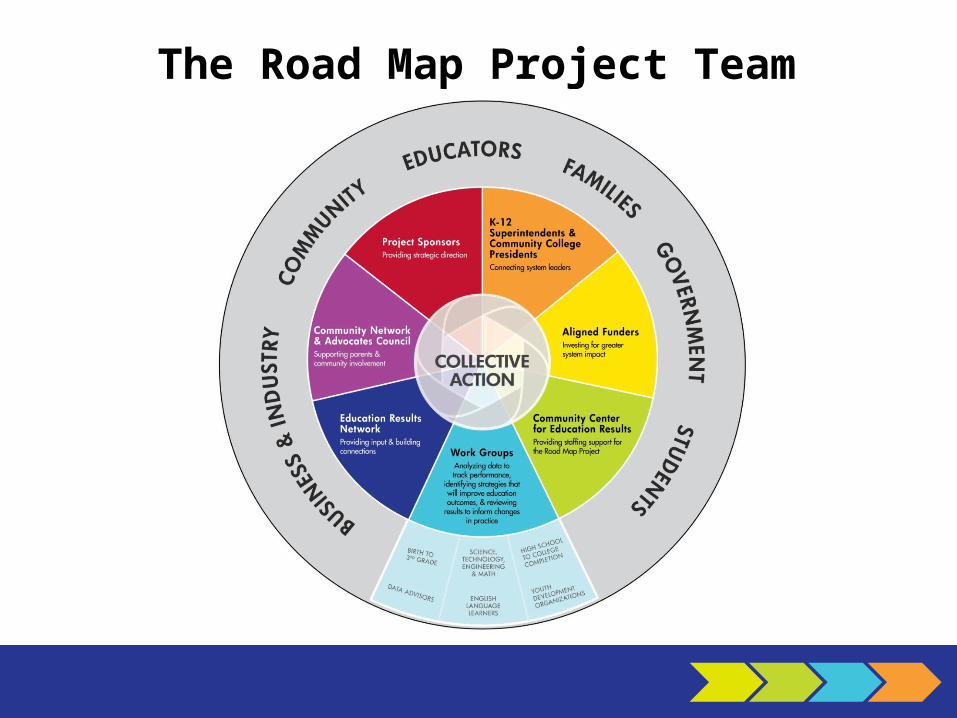
The Road Map Project Team

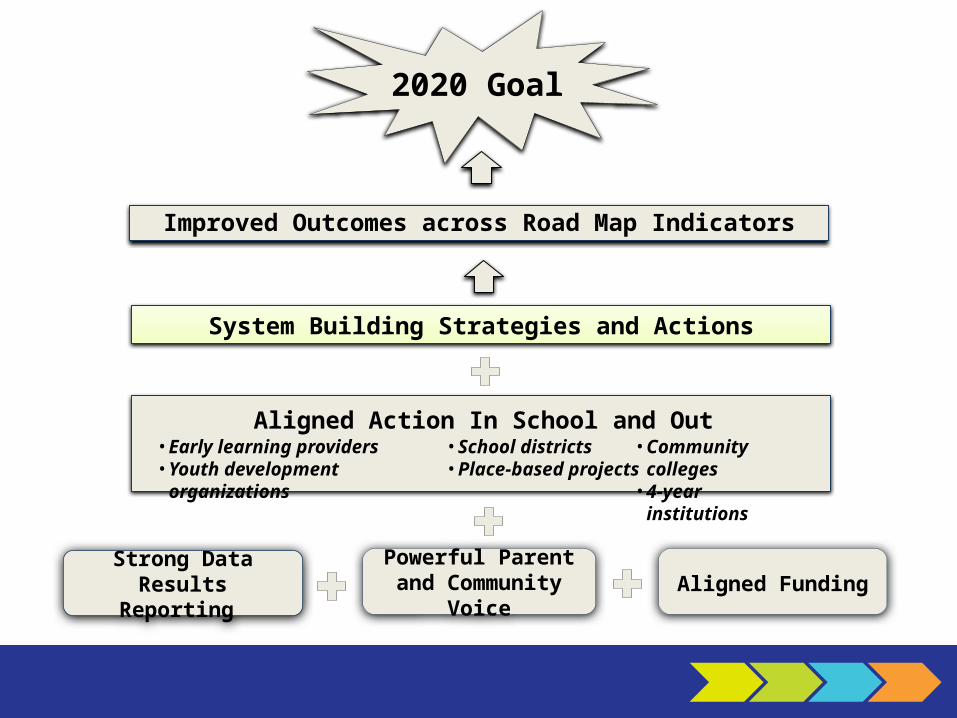
Strong Data Results Reporting
Powerful Parent and Community Voice Aligned Funding
• Early learning providers• Youth development organizations
• School districts• Place-based projects
• Community colleges• 4-year institutions
Improved Outcomes across Road Map Indicators
2020 Goal
Aligned Action In School and Out
System Building Strategies and Actions
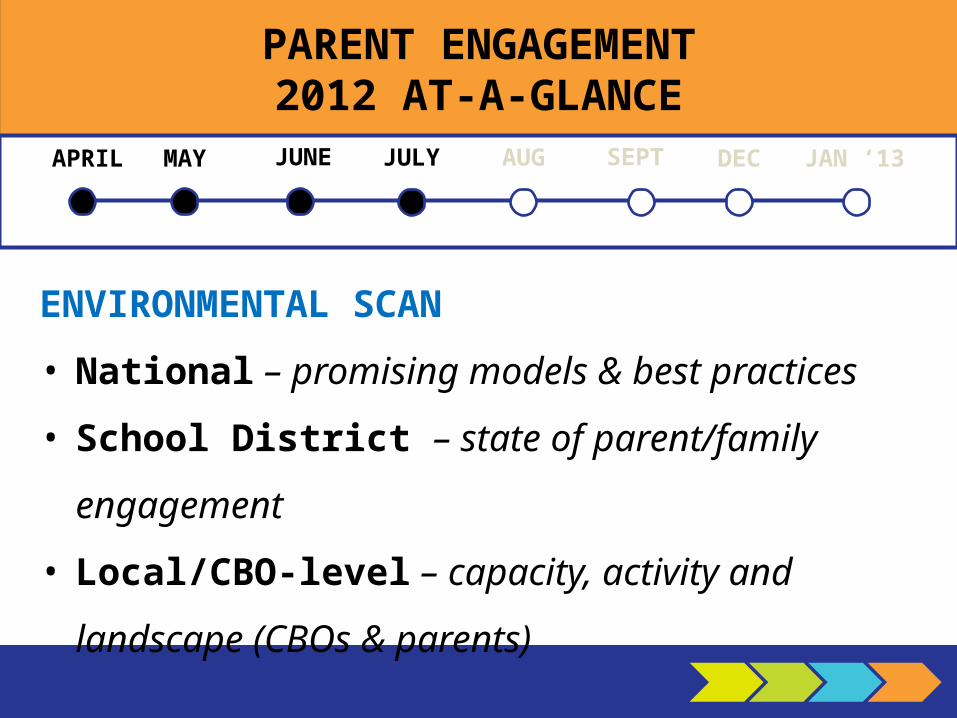
PARENT ENGAGEMENT2012 AT-A-GLANCE
JUNE JULY AUG SEPT DECAPRIL MAY JAN ‘13
ENVIRONMENTAL SCAN
• National – promising models & best practices
• School District – state of parent/family engagement
• Local/CBO-level – capacity, activity and landscape
(CBOs & parents)

PARENT ENGAGEMENT2012 AT-A-GLANCE
JUNE JULY AUG SEPT DECAPRIL MAY JAN ‘13
CONVENINGS OF PARENT ENGAGEMENT
ORGANIZATIONS
• June 5th │ 12:00 – 2:00pm │ 2100 Building
• June 28th │ 1:15 – 3:15pm │ Puget Sound ESD
• July 24th │ 12:00 – 2:00pm │ 2100 Building

PARENT ENGAGEMENT2012 AT-A-GLANCE
JUNE JULY AUG SEPT DECAPRIL MAY JAN ‘13
DEVELOPMENT OF MULTI-YEAR WORK PLAN
• Synthesis and analysis
• Vet recommendations
• *Reconvene key stakeholders

PARENT ENGAGEMENT2012 AT-A-GLANCE
JUNE JULY AUG SEPT OCT/NOV/DECAPRIL MAY JAN ‘13
LOGISTICAL PREPARATION: PARENT CONFERENCE
• Parents as primary audience
• Accessible, understandable, actionable
• Co-designed with community partners

Road Map Small Grants Fund
Campana Quetzal was awarded a Small Grants Award in December 2011. Jessica Salvador is here to talk about how their organization utilized the award.

Road Map Small Grants Fund
Recent Awards:
• Backpack Academy• Community and Parents for Public Schools (CPPS)• Service Learning Seattle• Community Network Council• Alpac Elementary School• Culturally Appropriate and Responsive Education
Center (CARE Center)

Strong Data Results Reporting
Powerful Parent and Community Voice Aligned Funding
• Early learning providers• Youth development organizations
• School districts• Place-based projects
• Community colleges• 4-year institutions
Improved Outcomes across Road Map Indicators
2020 Goal
Aligned Action In School and Out
System Building Strategies and Actions

Aligned Funders
Road Map Aligned Funders Network—Ways to Be Involved
1: Funders Align Education Investments With Road Map Goal and the Indicators of Student Success2: Funders Invest in System Building Actions and Strategies Recommended by Road Map Work Group Action Plans3. Funders Invest in Cross-Cutting Activities such as Data, Advocacy, and Parent and Community Engagement
Road Map Aligned Funders Network MeetingThursday, June 21, 10am – Noon; 2100 Building

Strong Data Results Reporting
Powerful Parent and Community Voice Aligned Funding
• Early learning providers• Youth development organizations
• School districts• Place-based projects
• Community colleges• 4-year institutions
Improved Outcomes across Road Map Indicators
2020 Goal
Aligned Action In School and Out
System Building Strategies and Actions

Aligned Action
Renton School District Strategic Improvement
Plan
School Board Resolutions
Treehouse is aligning its indicators with The Road Map Project to leverage collective impact for
middle and high school students in foster care

Road Map Project TreehouseMeet WA State Graduation requirements % of students accruing appropriate and
sufficient credits for their year
% of students meeting graduation requirements (sr. project, HSPE, service learning, WA history)% of students with greater than 2.0 GPA % of students passing all core courses with 2.0 or greater GPA
% of students in cohort graduating on-time and extended
% of students graduating on-time and extended
% of students with 4 or fewer absences % of students with 5 or fewer absences% of students without suspensions/ expulsions
No measure % of students remaining in same school for entire year
% of students whose parents actively support education
% of students whose parents actively support education
% of students experiencing 3 early warning indicators
% of students experiencing 3 early warning indicators
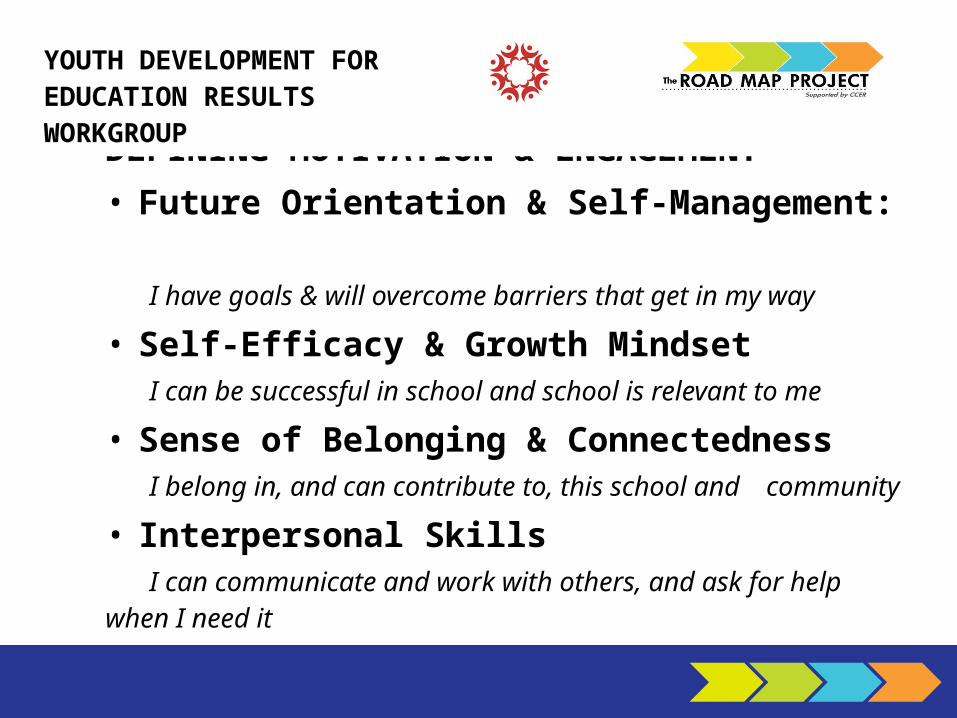
DEFINING MOTIVATION & ENGAGEMENT• Future Orientation & Self-Management:
I have goals & will overcome barriers that get in my way
• Self-Efficacy & Growth MindsetI can be successful in school and school is relevant to me
• Sense of Belonging & ConnectednessI belong in, and can contribute to, this school and
community
• Interpersonal SkillsI can communicate and work with others, and ask for help when I need it
YOUTH DEVELOPMENT FOR EDUCATION RESULTS WORKGROUP

YD FOR ED RESULTS WORK (Summer & Fall 2012)
• Pilot “Student Success Skills & Dispositions” section on CEE’s Educational Effectiveness Survey in Middle & High Schools in Road Map Region
• Continued focus on defining and measuring 21st Century Skills (Critical Thinking, Creativity, etc.) with STEM, arts and others
• Pursue “Survey Builder” and aligning youth development CBOs to measure same constructs + broader list of youth outcomes
• Focus Groups with Youth about Student Success Skills - Are these the right constructs? How are they built?
WHY? To increase strategies and practices to improve these “non-academic” - but critical to success - indicators
YOUTH DEVELOPMENT FOR EDUCATION RESULTS WORKGROUP

Strong Data Results Reporting
Powerful Parent and Community Voice Aligned Funding
• Early learning providers• Youth development organizations
• School districts• Place-based projects
• Community colleges• 4-year institutions
Improved Outcomes across Road Map Indicators
2020 Goal
Aligned Action In School and Out
System Building Strategies and Actions

Original Road Map
Healthy and ready for
Kindergarten
Supported and
successful in school
Graduate from high school --college and career-ready
Earn a college degree or
career credential
We will set targets and report our progress for on-track indicators across the continuum: 1
Readiness AttainmentAchievemen
t
• % of children meeting kindergarten readiness standards 2
• Pre-K indicator TBD
• % of students graduating high school meeting HEC minimum entrance requirements
• % of high school graduates who completed a career/technical education program
• % of students graduating from high school on time
• % of high school graduates who take developmental education courses in college
• % of students who earn a postsecondary credential by age 26
• % of students who enroll in postsecondary education
• % of students who persist year to year
We will set 2014, 2017 and 2020 targets for the following on-track indicators. 1
• % of students proficient in:- 3rd grade reading- 4th grade math- 5th grade science- 6th grade reading- 7th grade math- 8th grade science
• % of 9th graders who pass end of course algebra exam
• % of students triggering Early Warning Indicator #1 3
• % of students triggering Early Warning Indicator #2 4
1These indicators represent those the “on-track” indicators for the Road Map Project, and have associated targets for 2014, 2017, and 2020 against which the Road Map Project will track progress. We will also track progress for a longer set of indicators (see reverse side) where associated targets have not been set. Wherever possible we will disaggregate by race, ethnicity, income, and gender. 2Measured by WaKIDS = Washington Kindergarten Inventory of Developing Skills and/or DIBELS = Dynamic Indicators of Basic Early Literacy. 3 Triggering Early Warning #1 would entail having 6 or more absences and at least one course failure in the 9th grade. 4 Triggering Early Warning #2 would entail having a Suspension and/or Expulsion in the 9th grade.

Indicator Revision Process
Directions for Live Survey:
“On-track” indicators are the core measures representing the Road Map Project. They will be reported annually and have defined targets.
“Reported” indicators are monitored and included in the annual report without defined targets.
“Tracked” indicators are monitored and may be used in topical or special analyses but are not included in regular reports.
“Not collected” measures are beyond the scope of interest of the Road Map Project OR data is problematic or unavailable.

Please Fill Out The Survey Online
https://www.surveymonkey.com/s/RoadMapIndicators
Deadline: June 15th
Pause for a Special Recognition…
Tom “On-Track” Tierney
Thank you for everything..
Pause for a Special Recognition…
Monte Bridges
Thank you, and..
Strong Data Results Reporting
Powerful Parent and Community Voice Aligned Funding
• Early learning providers• Youth development organizations
• School districts• Place-based projects
• Community colleges• 4-year institutions
Improved Outcomes across Road Map Indicators
2020 Goal
Aligned Action In School and Out
System Building Strategies and Actions

System Building Actions:ELL Workgroups Report
Roxana will have slides

System Building Actions:STEM Business Plan
Josh will have a slide

High School to College Completion Work Group
Work Group Charge
Develop a Strategic Action Plan to improve college readiness and
postsecondary completion throughout the Road Map region.
Middle

Action Planning Process
Reviewresearch and Road
Map data
Use criteria, and focus on indicators
and targets
Draft strategies
Vet
May 2011 May 2012
Revise Action Plan strategies
Work Group Meetings
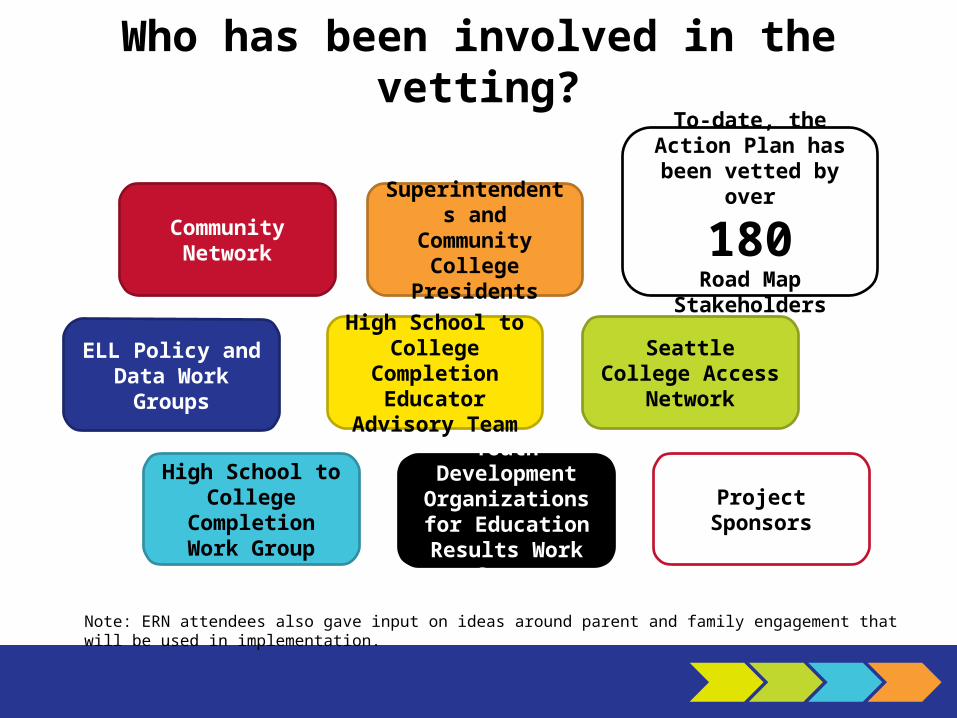
Who has been involved in the vetting?
Youth Development Organizations for Education Results
Work Group
Seattle College Access Network
Community Network
ELL Policy and Data Work Groups
Superintendents and Community College
Presidents
High School to College Completion
Work Group
High School to College CompletionEducator Advisory
Team
To-date, the Action Plan has been vetted by over
180Road Map Stakeholders
Project Sponsors
Note: ERN attendees also gave input on ideas around parent and family engagement that will be used in implementation.

Examples of Feedback• This work needs to start in middle school• Incorporate “nontraditional” students, including students on alternative
pathways• Importance of parent/family involvement in ALL of this work• Where do specific strategies for ELL students and undocumented students
fit in?• Help students connect education to career, students need to see the
purpose• Get more specific on policies, and identify policies that address the
“tracking” of students• Incorporate out-of-school time; community-based organizations play an
important role and need to be more visible in the Action Plan• We need to support College Bound students once they are enrolled in
postsecondary• Need to include universities too, not just community colleges

Action Planning Process
Reviewresearch and Road
Map data
Use criteria, and focus on indicators
and targets
Draft strategies
VetRevisit the research and effect modeling
May 2011 May 2012
Revise Action Plan strategies
Work Group Meetings
Approved Action Plan!
Begin detailed implementation
planning

High School to College Completion Action Plan
33

Strategy Implementation

Road Map Transcript Follow-Up Study
Does math course-taking matter for college enrollment and persistence?

Agenda
• Study Purpose• Guiding Questions• Study Demographics• Types of Findings Available in the Report• Summary/Discussion

Study’s Purpose
• Study designed to further analyze 2010 graduates’ high school transcripts from the Road Map schools to provide additional information about math course-taking patterns in relation to college enrollment.
Guiding Questions
What is the highest level of math students are taking in high school and middle school? When do students take their last math course?
Does math course-taking matter for whether students attend college and what type of college (2-year or 4-year college)?
Does math course-taking matter for whether students persist in college?
Study Definitions• College Enrollment:
– Not-College Direct - high school graduates who did not attend either a two- or four-year college any time in the academic year immediately following their high school graduation
– College Direct - high school graduates who attended either a two- or four-year college any time in the academic year immediately following their high school graduation
• College Path:
– 2-year college– 4-year college

What is the highest level of math students are taking in high school?
• By District:
District Mean of Most Advanced Math Course
Auburn 4.37 (4.22)
Federal Way 4.54 (4.00)
Highline 4.55 (4.34)
Kent 4.67 (4.25)
Seattle 4.80 (3.98)
Renton 3.83 (3.42)
Tukwila 4.17 (3.31)
Level Course
1 Pre-Algebra
2 Algebra
3 Geometry
4 Algebra 2
5 Pre-Calculus
6 Calculus
7 Calculus 2 or above

What level of math are students taking in middle school?
• 36% of students took algebra or beyond in middle school
% of Students who Enrolled in Middle School Algebra0%
10%
20%
30%
40%
50%
60%
70%
80%
90%
100%
22.7%
30.0%
59.4%
Non-college Direct 2-Year College Four-Year College
Percent taking Middle School Algebra or Beyond Disaggregated by Enrollment Types

What percentage of students take algebra or beyond in middle school (by ethnicity)?
Whit
e (n
=3199
)
Asian
(n=13
33)
Amer
ican
India
n/Alas
ka N
ative
(n=80
)
Two or
Mor
e Rac
es (n
=71)
Hispan
ic/La
tino
(n=58
3)
Black/
Africa
n Am
erica
n (N
=922)
Native
Haw
aiian
/Oth
er P
acific
Islan
der (
n=80
)0%
20%
40%
60%
80%
100%
44.0% 42.9% 41.6% 40.0%
18.9% 16.5% 13.9%
Percent of Students Taking Algebra or Beyond in Middle School by Ethnicity

What percentage of students take algebra or beyond in middle school (by district)?
Aubur
n Sch
ool D
istrc
t
Feder
al W
ay S
choo
l Dist
rict
Highlin
e Sch
ool D
istric
t
Kent S
choo
l Dist
rict
Rento
n Sch
ool D
istric
t
Seattl
e Sch
ool D
istric
t
Tukwila
Sch
ool D
istric
t0%
10%
20%
30%
40%
50%
60%
70%
80%
90%
100%
39.0%45.5%
28.3%31.9% 28.7%
38.6%
18.2%
Percent of Students Taking Algebra or Beyond in Middle School by District

When do students take a math course?
Middle School Junior/3rd Year Senior/4th Year0%
20%
40%
60%
80%
100%
23%
88%
73%
30%
90%
74%
59%
94%
84%
Percentage of Graduates Taking Algebra or Beyond in Middle School and Percentage of Graduates Taking Math in their Junior or Senior Year based on Post Secondary Path
Non-College Direct Two-Year College Four-Year College

Does math course-taking matter for whether students attend college and what type of college?
• Set of logistic regressions to predict college enrollment and college path
• Findings:
• Entry level and Exit level math course significantly related to college enrollment and to college path
• Taking middle school algebra significantly related to college enrollment and to college path
• Last year of math important for college enrollment and college path
• GPA also an important predictor

Does math course-taking matter for whether students persist in college?
College persistence: students attending college during 2010-2011 school year and then returned for 2011-2012 school year
Performed set of logistic regressions to determine factors predicting college persistence
GPA + MS Algebra = College Persistence
GPA + MS Algebra + Entry Level Math = College Persistence
GPA + MS Algebra + Entry Level Math + Exit Level Math = College Persistence

Summary of Findings• College direct students took more rigorous math
• College direct students more likely to have taken a math class senior year and more likely to attend 4-year college
• Both courses and grades (GPA) important in predicting college enrollment
• Students taking higher levels of math at entry and exit have better chance of being college direct and of attending a 4-year college
• GPA and exit level math associated with increased likelihood of persisting in college

Full Report
Read more soon when the Final Report is available

Meeting Scholarship Criteria
76%85%
71%
24%15%
29%
Road Map Region:Class of 2012 College Bound Seniors
Have Not Met Criteria
Have Met Criteria
Source: Data reported by high school Building Champions or District Coordinators as of May 4, 2012.
1,508 Eligible Seniors

Realize the Dream Scholarship
Realize the Dream Scholarship is available Washington State high school graduates who:
• Are undocumented residents of the United States and do not qualify to apply for federal or state financial aid programs.
• Must be able to file the House Bill (HB) 1079 affidavit.
• Must receive their high school diploma from a Washington State high school in 2012.
Application deadline - 5 p.m. June 18, 2012Visit: www.collegesuccessfoundation.org/realizethedream or call 1-877-655-4097.

Road Map Region
74%
26%Eligible Students Not Com-plete**
Eligible Students Complete**
4,831 Eligible Students*
*FRLP data reported by School Districts March 2012, sign-ups include 8 th grade students that signed-up in their 7th grade year.
College Bound Scholarship Sign-up Campaign(as of June 5th, 2012)
STUDENTS WILL BE IN SCHOOL FOR 10 MORE DAYS
•1,241 eligible 8th grade students (26%) have yet to apply for the College Bound Scholarship. Deadline: June 30, 2012
•District Coordinator have access to the College Bound HECB secure portal and the FRLP list. By reconciling the lists, schools can have quick access to the names of students who still need to apply.
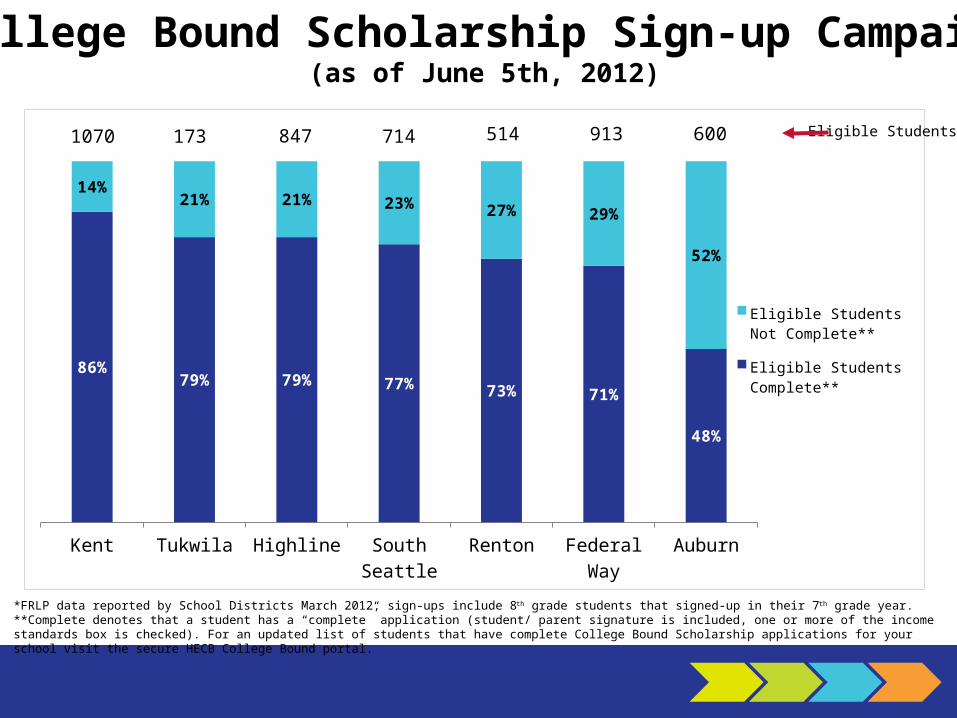
Kent Tukwila Highline South Seattle Renton Federal Way Auburn
86%79% 79% 77% 73% 71%
48%
14%21% 21% 23% 27% 29%
52%
Eligible Students Not Complete**
Eligible Students Complete**
714173 913847 5141070 600 Eligible Students*
*FRLP data reported by School Districts March 2012, sign-ups include 8th grade students that signed-up in their 7th grade year.**Complete denotes that a student has a “complete” application (student/ parent signature is included, one or more of the income standards box is checked). For an updated list of students that have complete College Bound Scholarship applications for your school visit the secure HECB College Bound portal.
College Bound Scholarship Sign-up Campaign(as of June 5th, 2012)

Top Schools To Watch Data as of June 4th, 2012 School District Middle School % Signed up Remaining students to sign upKent Mill Creek Middle School 46% 166Auburn Olympic Middle School 37% 112South Seattle Mercer Middle School 59% 90Auburn Cascade Middle School 40% 90Federal Way Kilo Middle School 32% 84Federal Way Lakota Middle School 36% 81Renton Nelsen Middle School 63% 72Auburn Rainer Middle School 43% 68South Seattle Denny Middle School 61% 66Highline Chinook Middle School 71% 63South Seattle Aki Kurose Middle School 61% 55Highline Sylvester Middle School 75% 48Auburn Mt. Baker Middle School 71% 44Highline Pacific Middle School 80% 40Tukwila Showalter Middle School 79% 37
Total 1116Road Map Region 74% 1241
Top Schools on the College Bound Sign-up RadarMiddle Schools with the highest remaining number
of complete sign ups

CALL TO ACTIONHow you can best support the sign-up efforts
We have specific last push asks on the horizon: Federal Way: planning small group work at Kilo, Lakota, Totem Nelsen MS: phone bank to families McKnight MS: small group work Mill Creek MS: phone bank to families Involved with a school last year? Check-in!
If you are interested in participating– gives us your card
Or contact: Marina Espinoza [email protected]

ROAD MAP BIRTH TO THIRD GRADE ACTION PLAN FRAMEWORK
Parent & family
engagement
Quality expanded learning
opportunities(birth – 3rd grade)
Quality teaching(early learning – 3rd grade)
FOCU
S AR
EAS
IND
ICAT
ORS
• % of children born with low birth weight (less than 5.5 pounds)• % of eligible children enrolled in formal early learning programs• Pre – K indicator TBD• % of students meeting kindergarten readiness standards (TBD)• % of students enrolled in full-day kindergarten • % of students meeting 3rd grade reading standards• % of ELL students who gain one or more levels of English proficiency each year
2014 interim targets (pre-K indicator TBD, kindergarten readiness: TBD, 3rd grade reading: 74%)
2017 interim targets (pre-K indicator TBD, kindergarten readiness: TBD, 3rd grade reading: 80%)
2020 GOAL (pre-K indicator TBD, kindergarten readiness: TBD, 3rd grade reading: 87%)
OU
TCO
MES
Build strong program & system data capability for continuous improvement


Key Partners:
• King County Library System• Seattle Public Libraries• United Way of King County
King County’s 2012 Summer Reading Campaign
Key Activities:
• Targeted summer programming• Key messages targeting parents• Let’s Read! website
• Posters • PSAs • Broad flyer distribution
• 7 School Districts• 8 Cities• Place-Based Projects• Housing Authorities

Up Next!
Convening of Parent Engagement Organizations:June 28th; 1:15pm-3:15pm – PSESDJuly 24th; 12pm-2pm – 2100 Building
Education Results Network Meeting:September 13th; 10am-1pm – Location TBD
Results Report Meeting:December 13th; 10am-1pm – PSESD
Parent Conference:First Quarter 2013
Thank You For Attending!