forecasting space-time events - strata + hadoop world 2015 san jose
TRANSCRIPT

Forecasting Space-time Events Jeremy Heffner Senior Data Scientist [email protected]
340 N 12th St, Suite 402 Philadelphia, PA 19107 215.295.2600 www.azavea.com


37 people using geodata
to do stuff that matters

B Corporation • Civic/Social impact • Donate share of profits
Research-Driven • 10% Research Program • Academic Collaborations • Open Source • Open Data

Land Water People

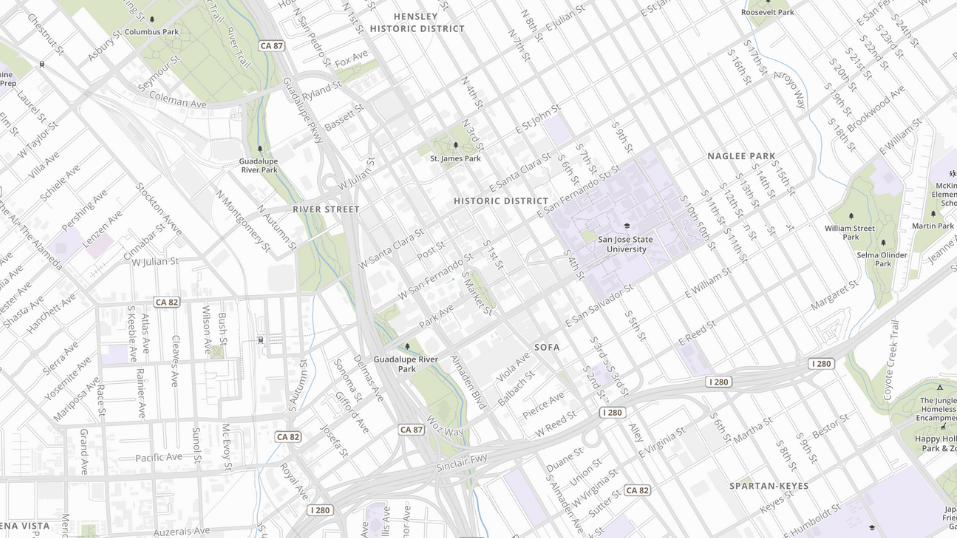
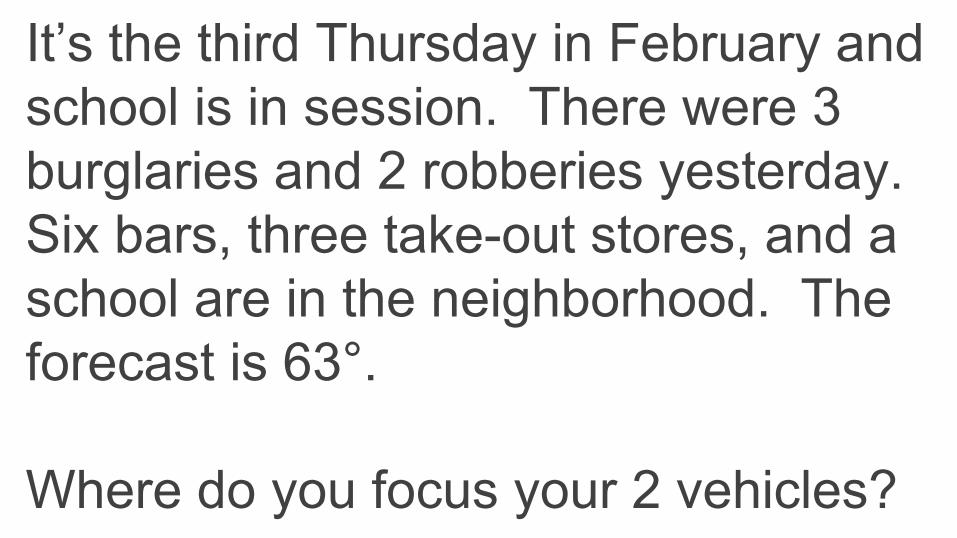
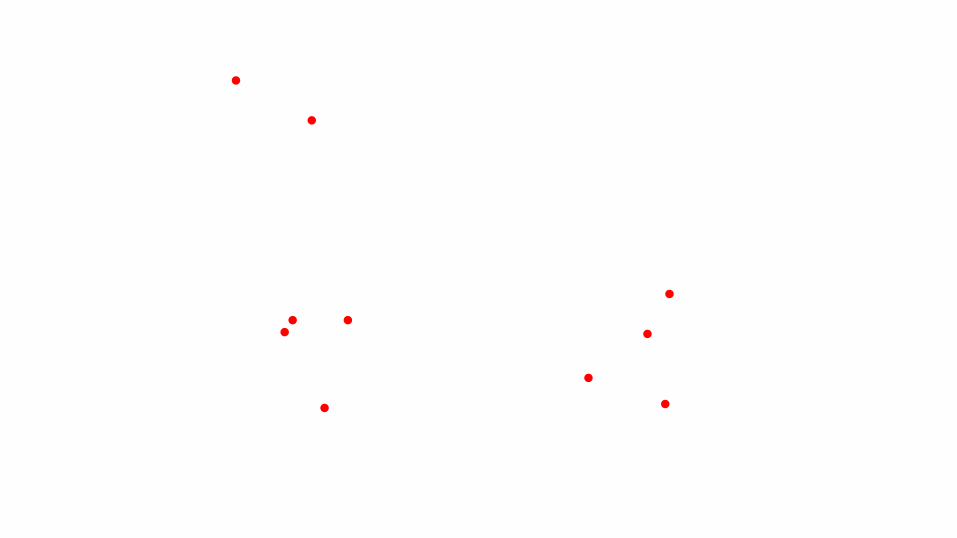
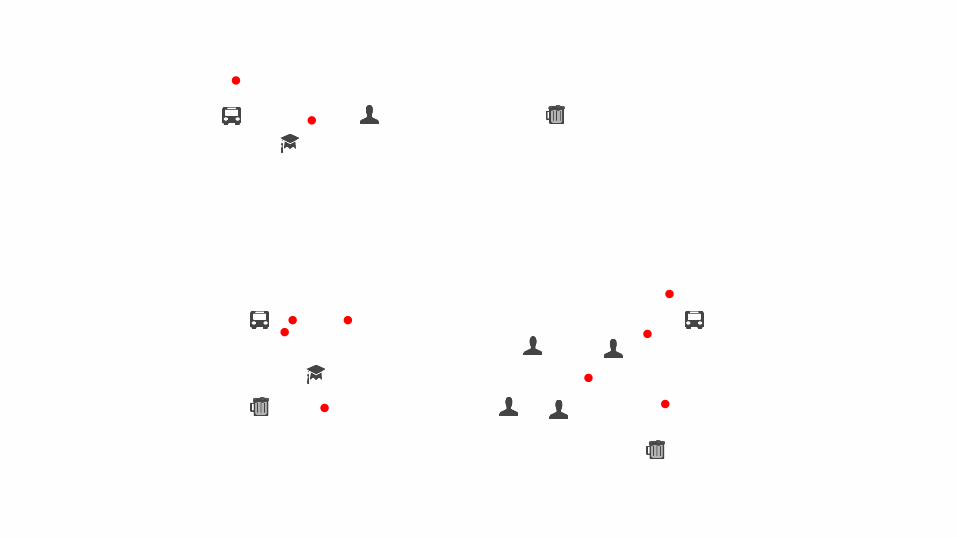
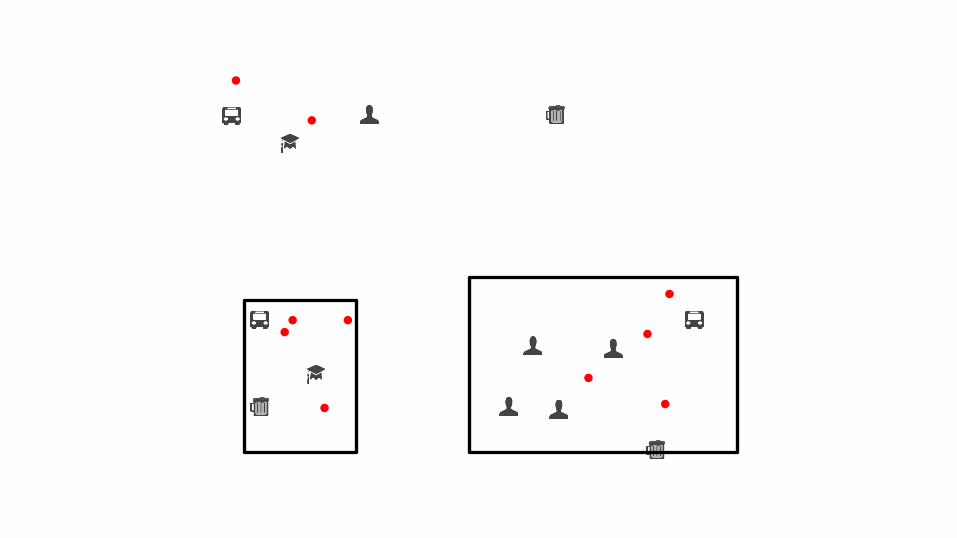
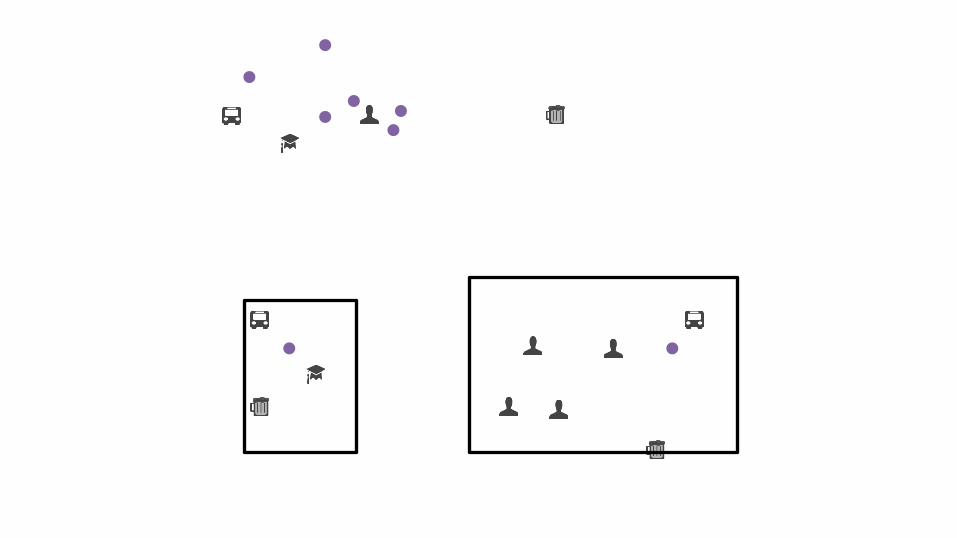
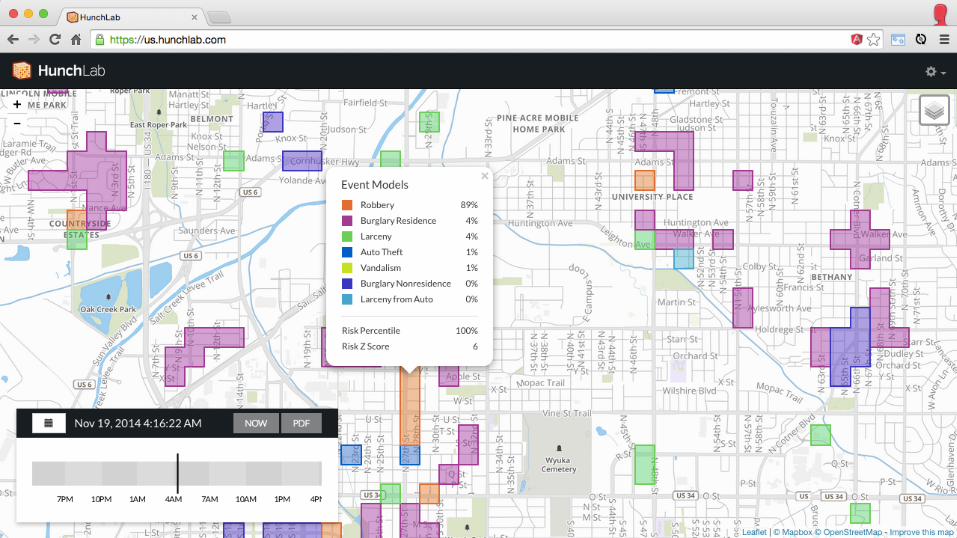
It’s the third Thursday in February and school is in session. There were 3 burglaries and 2 robberies yesterday. Six bars, three take-out stores, and a school are in the neighborhood. The forecast is 63°. Where do you focus your 2 vehicles?

It’s the third Thursday in February and school is in session. There were 3 burglaries and 2 robberies yesterday. Six bars, three take-out stores, and a school are in the neighborhood. The forecast is 63°. Where do you focus your 2 vehicles?

Geographic Data Geoprocessing
Forecasting Results

Geographic Data

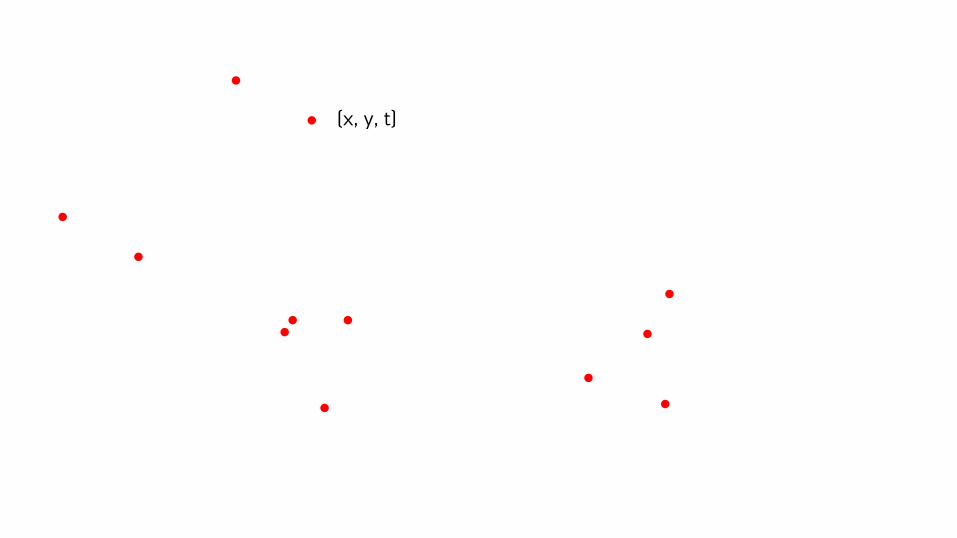
(x, y, t)

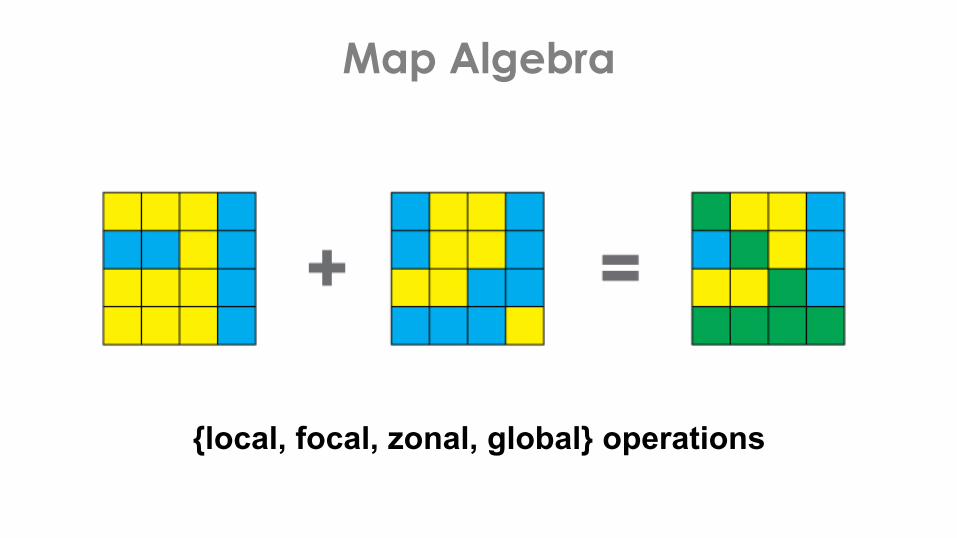
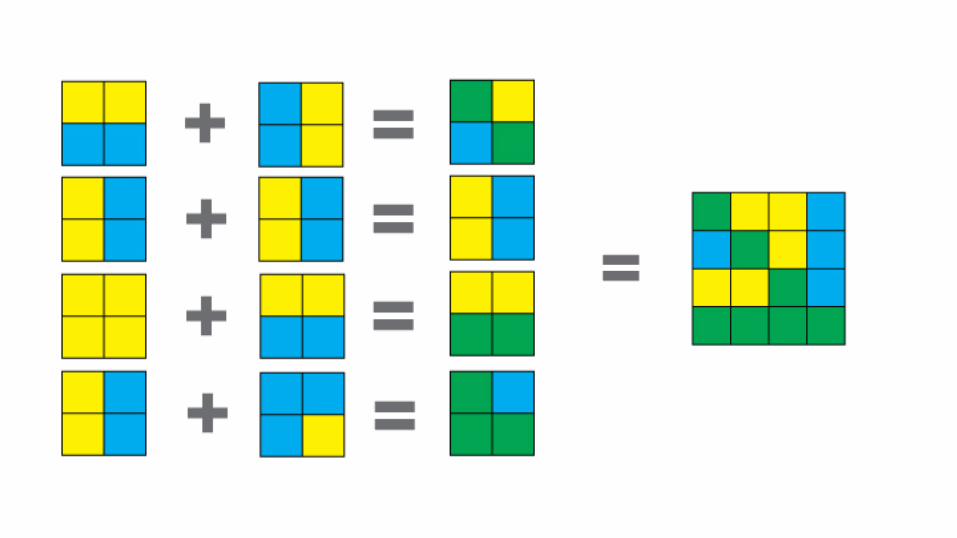
Map Algebra
{local, focal, zonal, global} operations

Geoprocessing
a geographic data processing engine for high performance applications
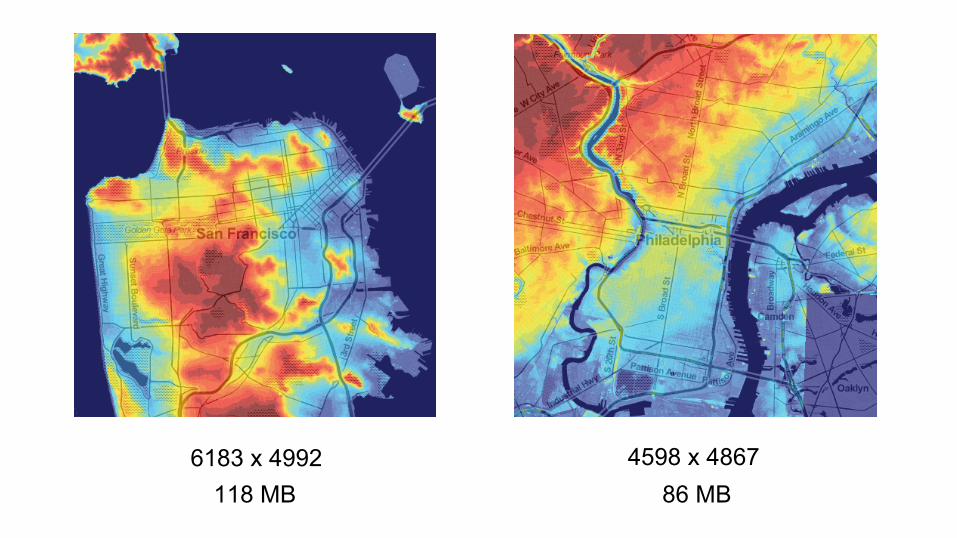
6183 x 4992 4598 x 4867 118 MB 86 MB
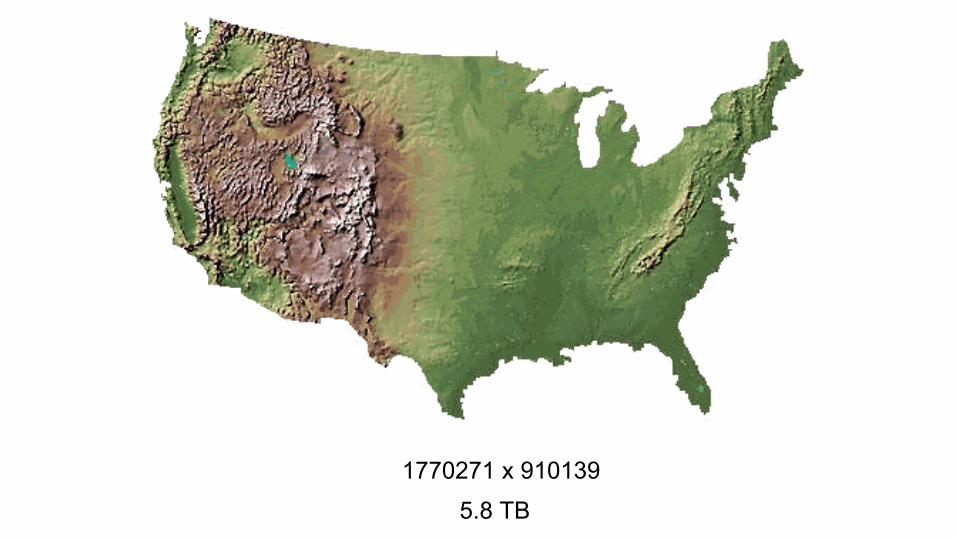
1770271 x 910139
5.8 TB

a geographic data processing engine for high performance applications
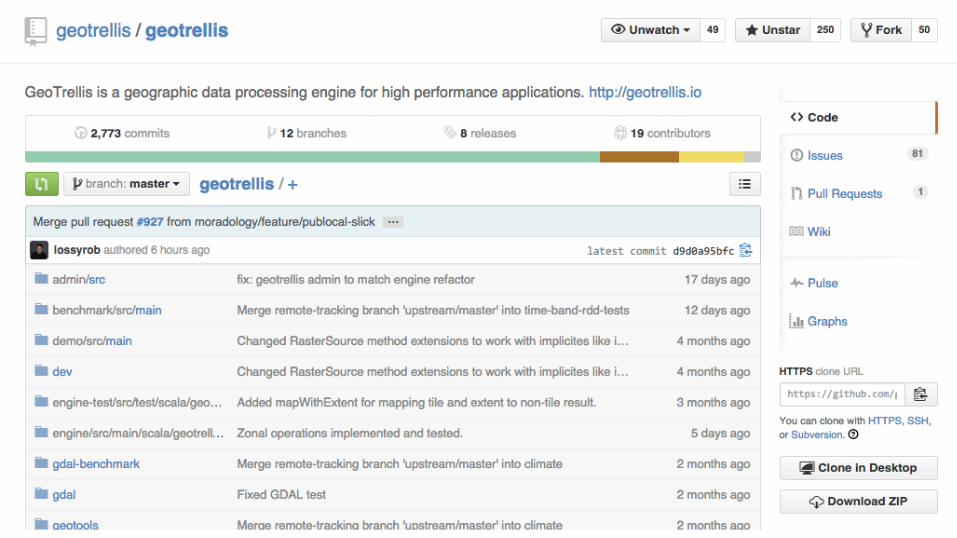
Demos at geotrellis.io
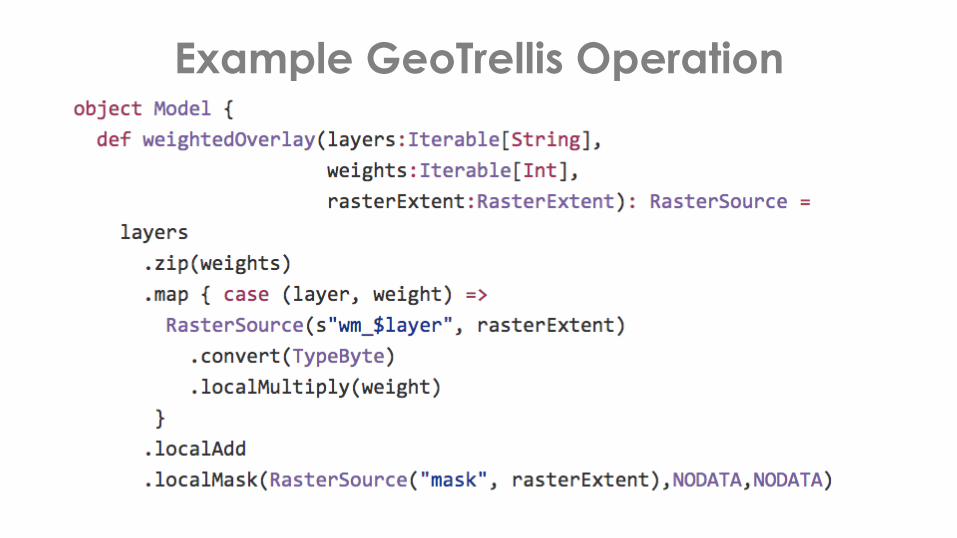
Example GeoTrellis Operation

Forecasting Crime
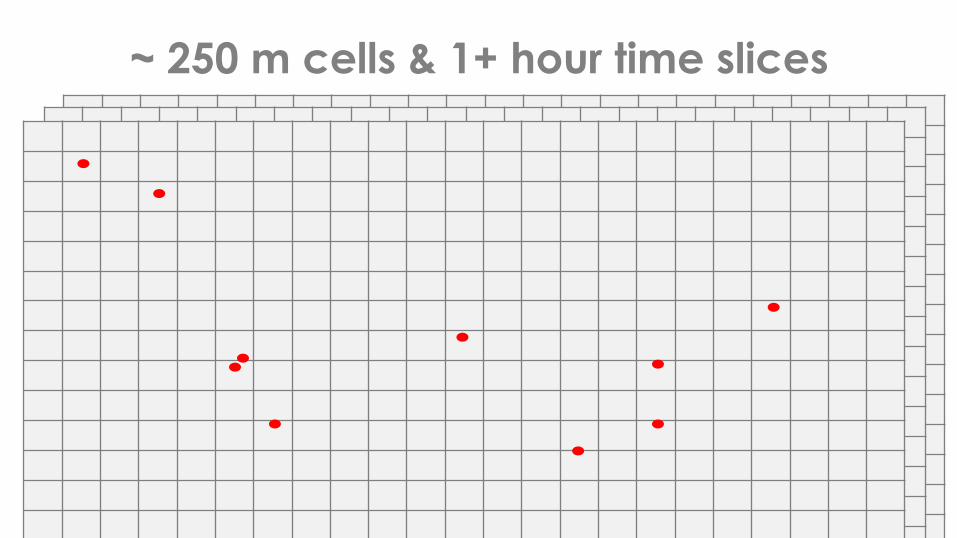
~ 250 m cells & 1+ hour time slices
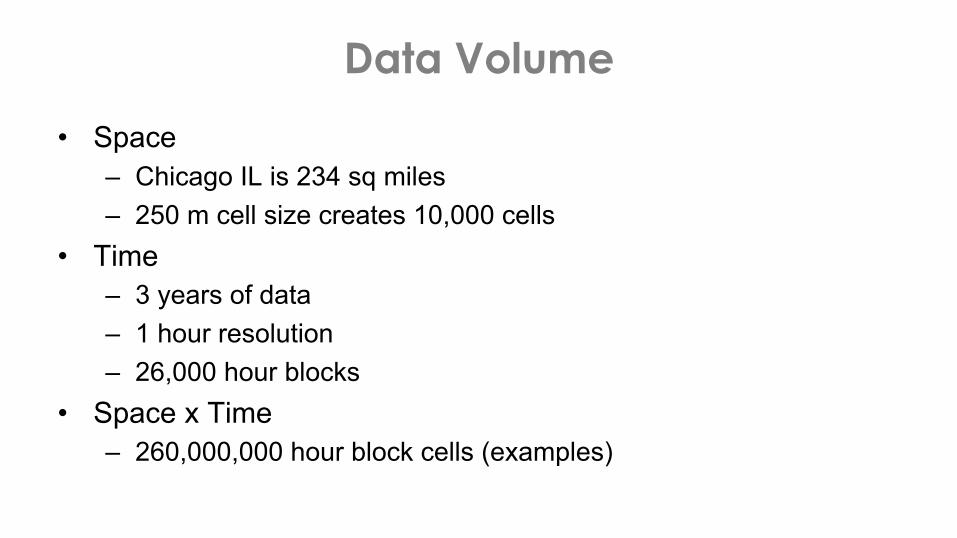
Data Volume
• Space – Chicago IL is 234 sq miles – 250 m cell size creates 10,000 cells
• Time – 3 years of data – 1 hour resolution – 26,000 hour blocks
• Space x Time – 260,000,000 hour block cells (examples)
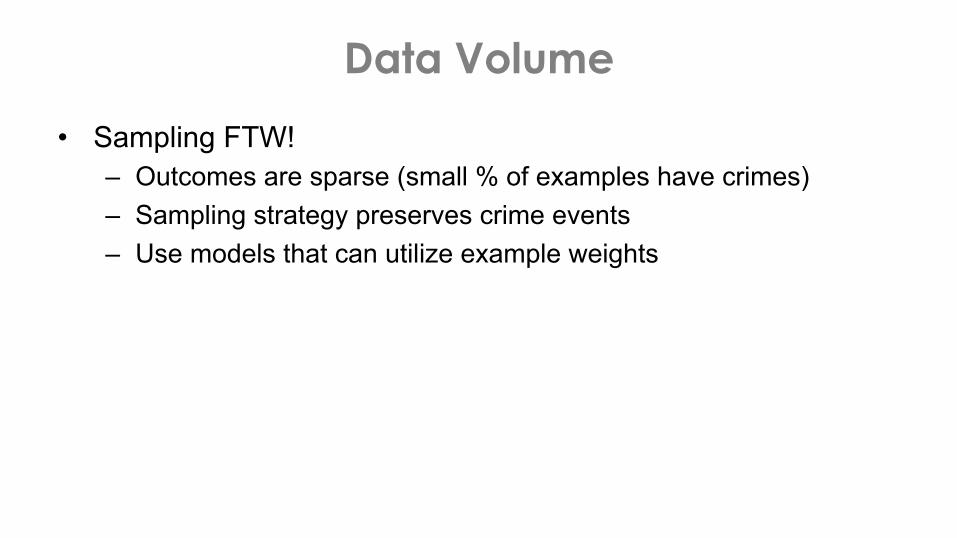
Data Volume
• Sampling FTW! – Outcomes are sparse (small % of examples have crimes) – Sampling strategy preserves crime events – Use models that can utilize example weights
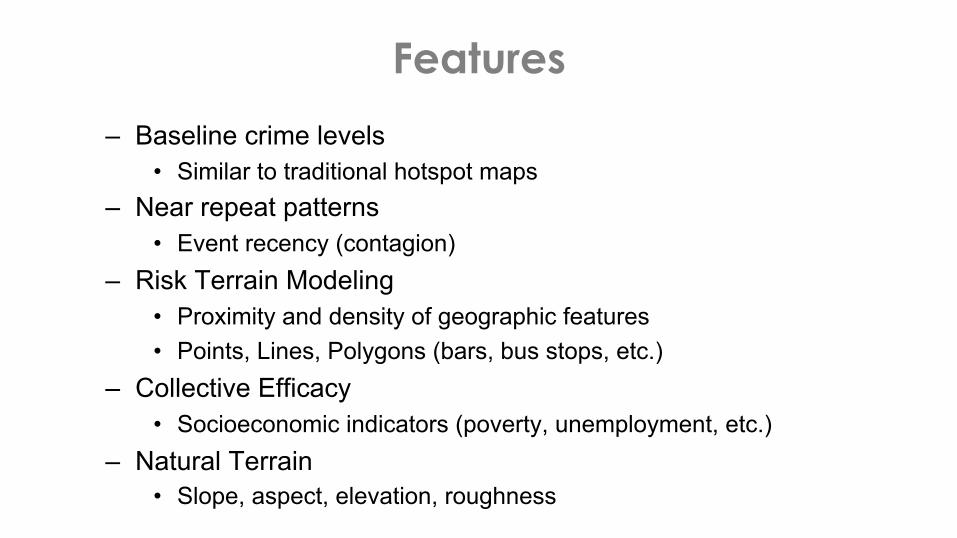
– Baseline crime levels • Similar to traditional hotspot maps
– Near repeat patterns • Event recency (contagion)
– Risk Terrain Modeling • Proximity and density of geographic features • Points, Lines, Polygons (bars, bus stops, etc.)
– Collective Efficacy • Socioeconomic indicators (poverty, unemployment, etc.)
– Natural Terrain • Slope, aspect, elevation, roughness
Features
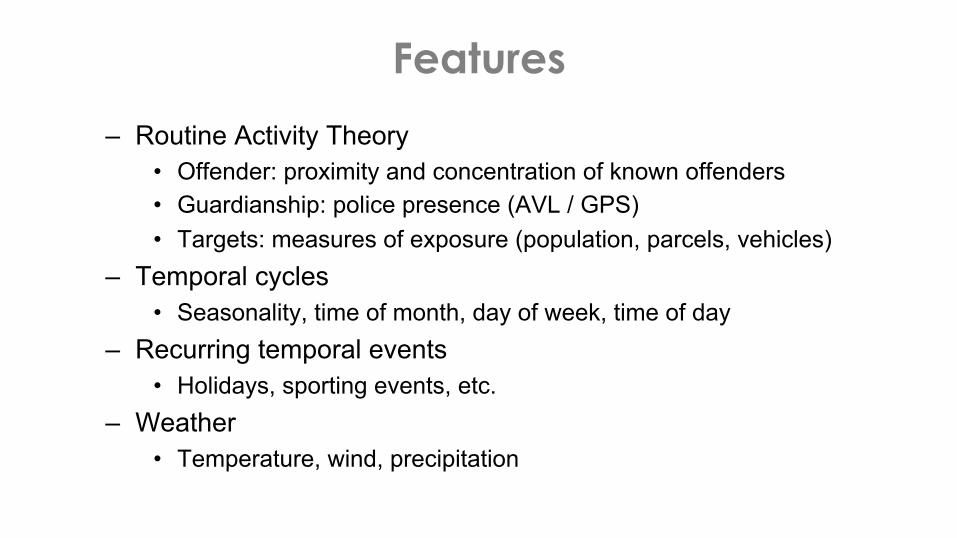
– Routine Activity Theory • Offender: proximity and concentration of known offenders • Guardianship: police presence (AVL / GPS) • Targets: measures of exposure (population, parcels, vehicles)
– Temporal cycles • Seasonality, time of month, day of week, time of day
– Recurring temporal events • Holidays, sporting events, etc.
– Weather • Temperature, wind, precipitation
Features
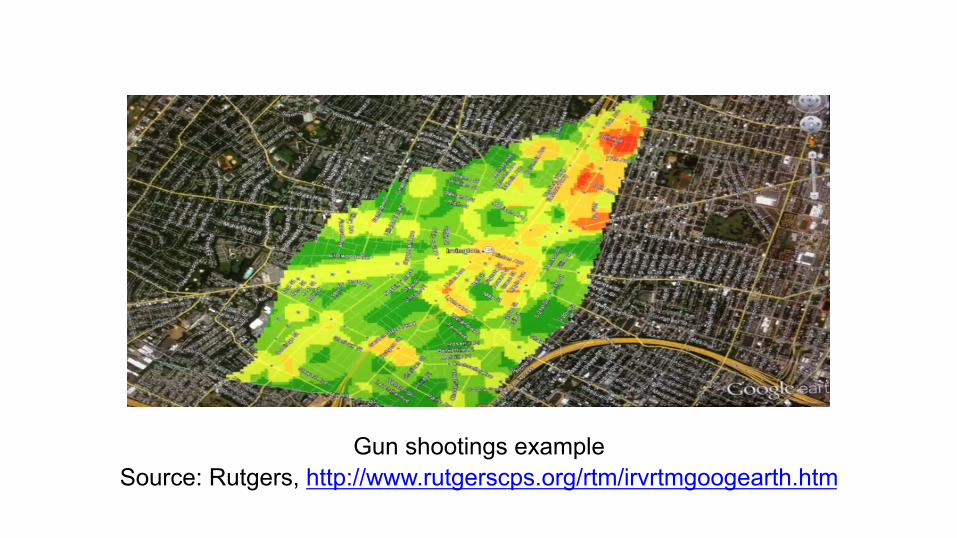
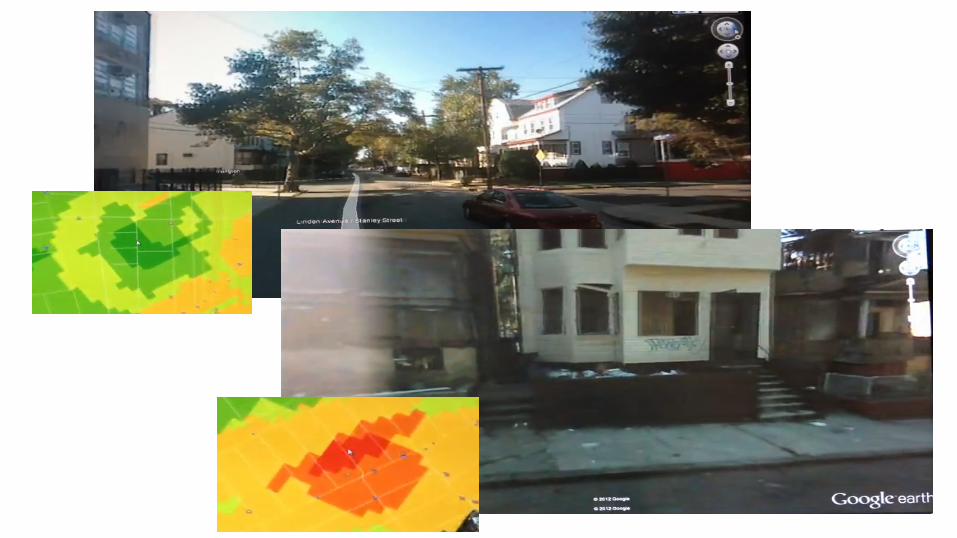
Gun shootings example Source: Rutgers, http://www.rutgerscps.org/rtm/irvrtmgoogearth.htm
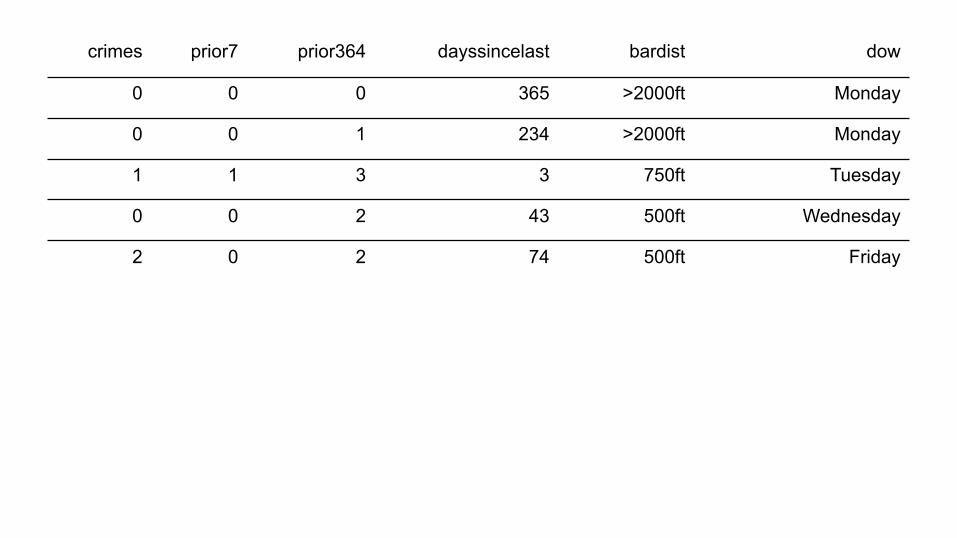
crimes prior7 prior364 dayssincelast bardist dow
0 0 0 365 >2000ft Monday
0 0 1 234 >2000ft Monday
1 1 3 3 750ft Tuesday
0 0 2 43 500ft Wednesday
2 0 2 74 500ft Friday
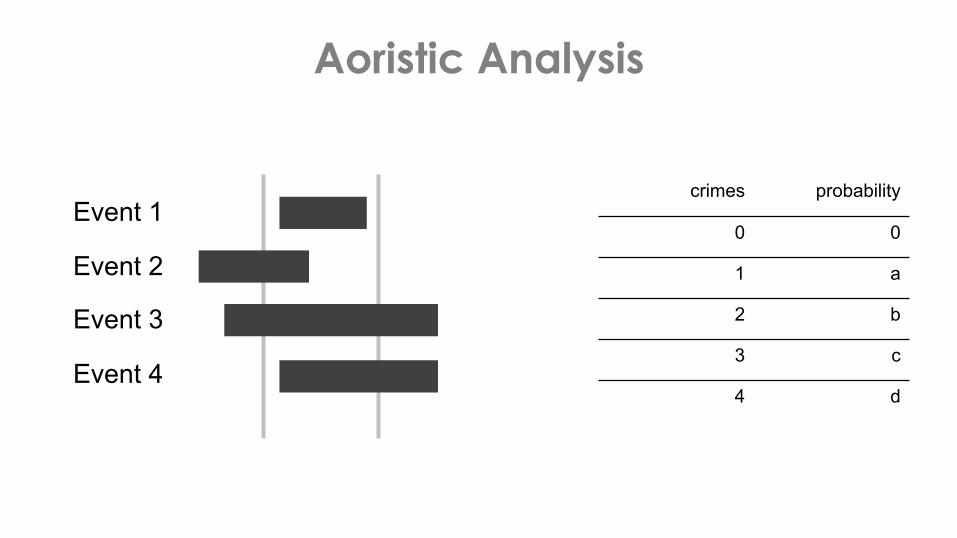
crimes probability
0 0
1 a
2 b
3 c
4 d
Aoristic Analysis
Event 1
Event 2
Event 3
Event 4
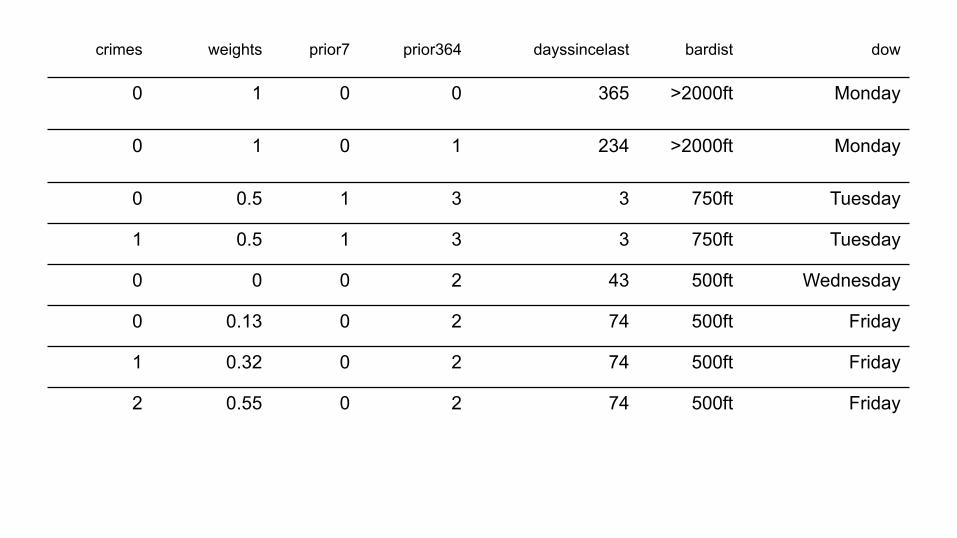
crimes weights prior7 prior364 dayssincelast bardist dow
0 1 0 0 365 >2000ft Monday
0 1 0 1 234 >2000ft Monday
0 0.5 1 3 3 750ft Tuesday
1 0.5 1 3 3 750ft Tuesday
0 0 0 2 43 500ft Wednesday
0 0.13 0 2 74 500ft Friday
1 0.32 0 2 74 500ft Friday
2 0.55 0 2 74 500ft Friday

Models • Baseline models (6)
– {28, 56, 364} day counts – {28, 56, 364} day kernel densities
• HunchLab models – Variations of a stacked ensemble:
• examples è gradient boosting machine (gbm) è y/n probabilities • y/n probabilities è generalized additive model (gam) è counts
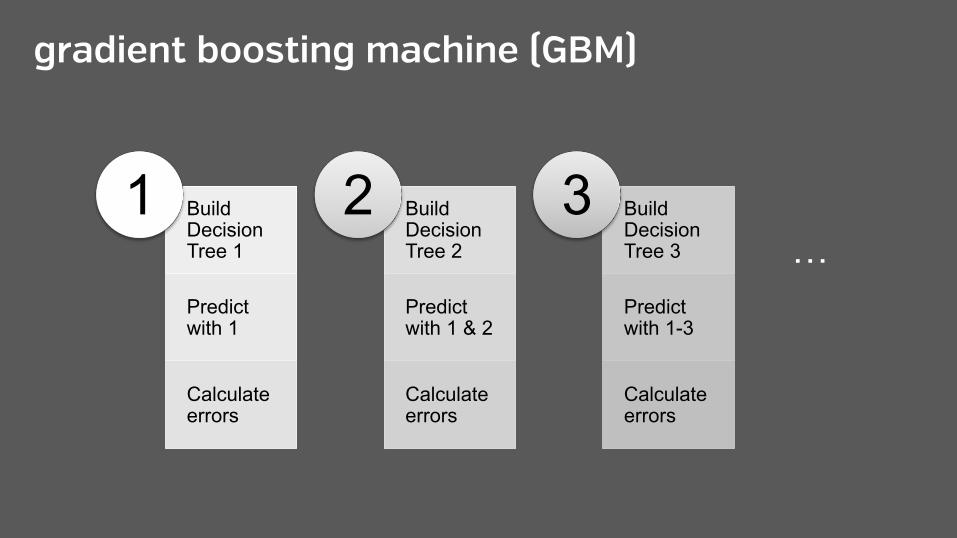
gradient boosting machine (GBM)
Build Decision Tree 1
Predict with 1
Calculate errors
1 Build Decision Tree 2
Predict with 1 & 2
Calculate errors
2 Build Decision Tree 3
Predict with 1-3
Calculate errors
3 …
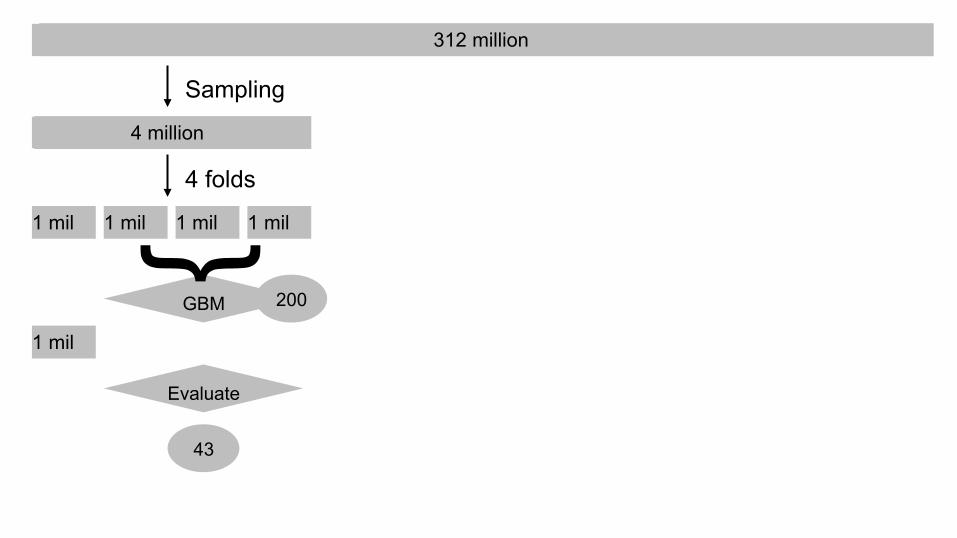
312 million
4 million
1 mil 1 mil 1 mil 1 mil
Sampling
4 folds
GBM
}
1 mil
Evaluate
43
200
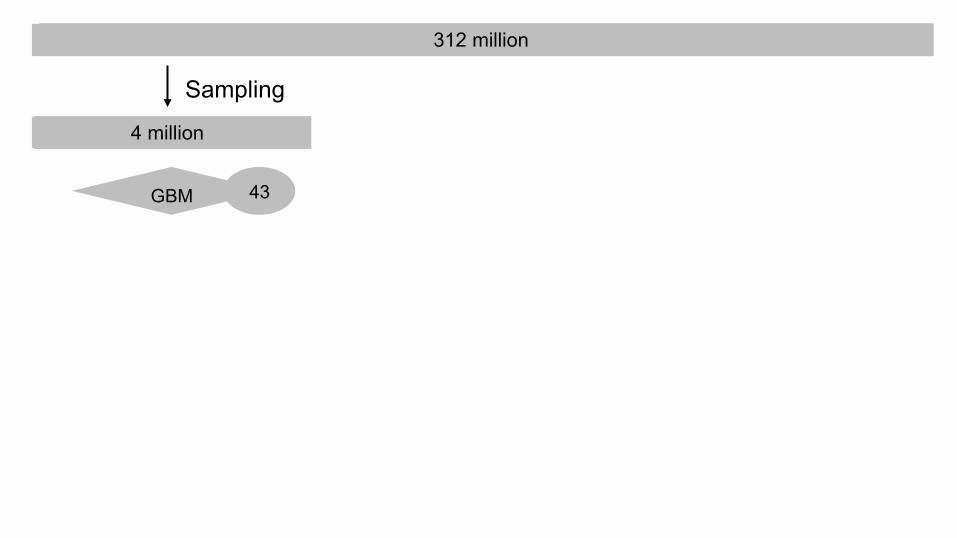
312 million
4 million
Sampling
GBM 43
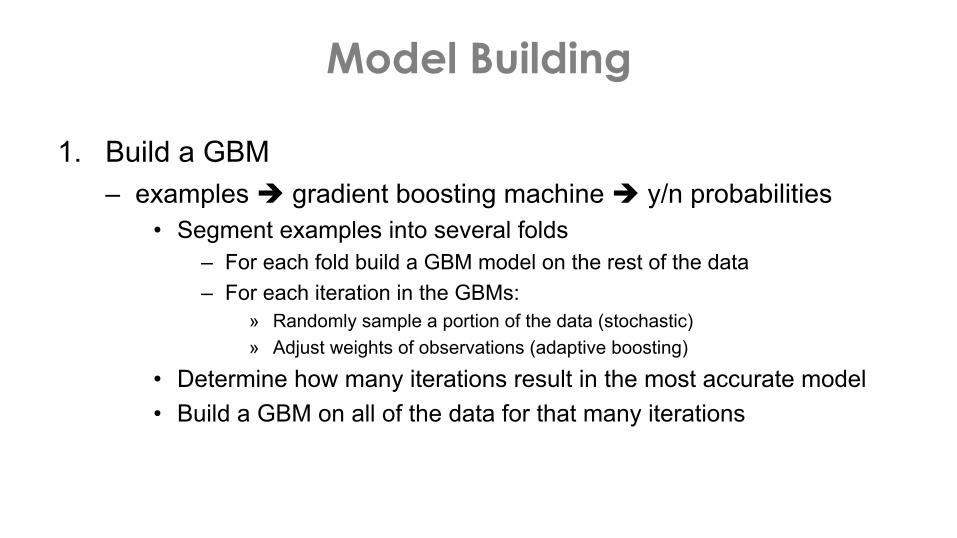
Model Building
1. Build a GBM – examples è gradient boosting machine è y/n probabilities
• Segment examples into several folds – For each fold build a GBM model on the rest of the data – For each iteration in the GBMs:
» Randomly sample a portion of the data (stochastic) » Adjust weights of observations (adaptive boosting)
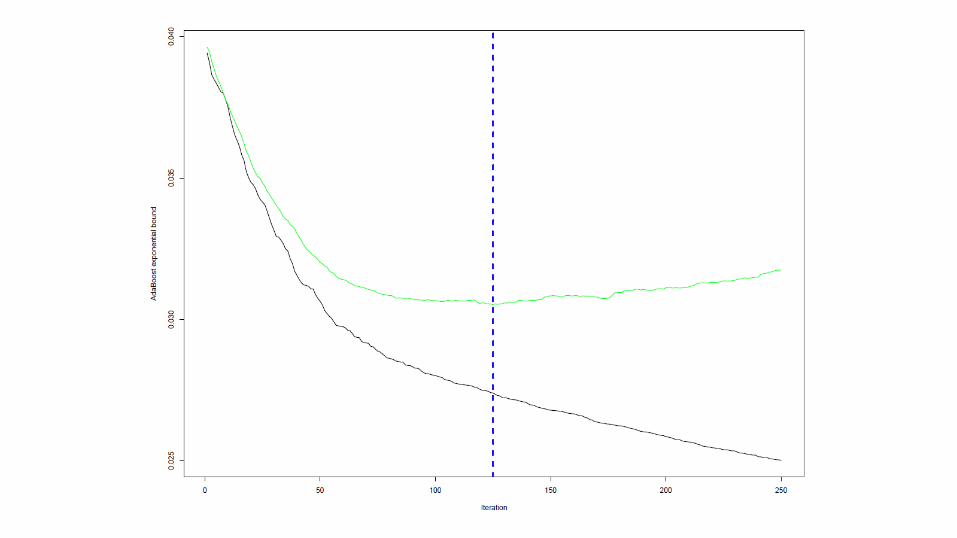
• Determine how many iterations result in the most accurate model • Build a GBM on all of the data for that many iterations
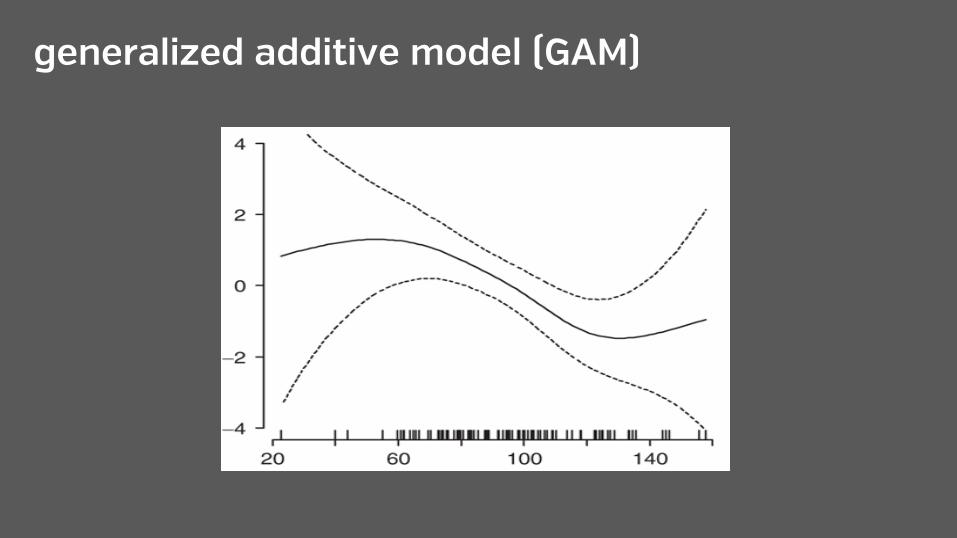
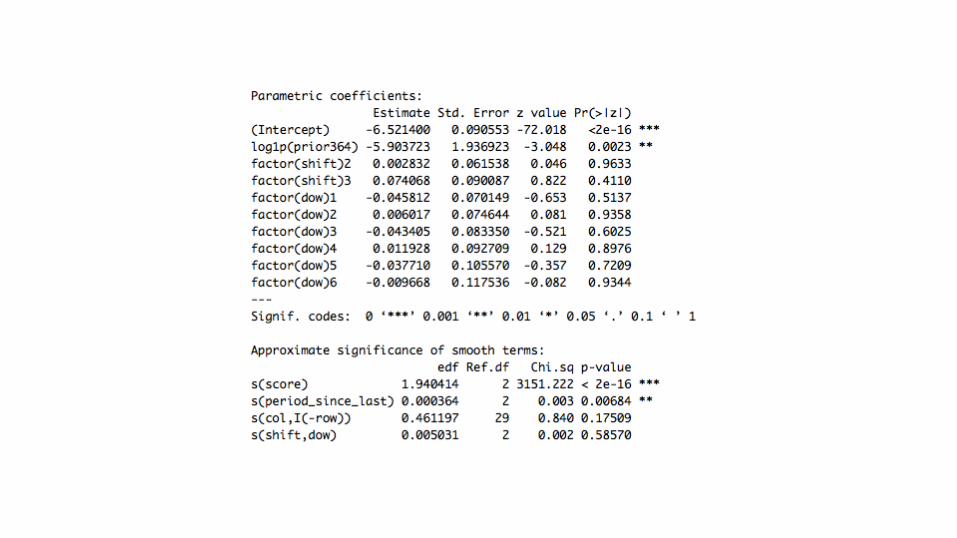
generalized additive model (GAM)
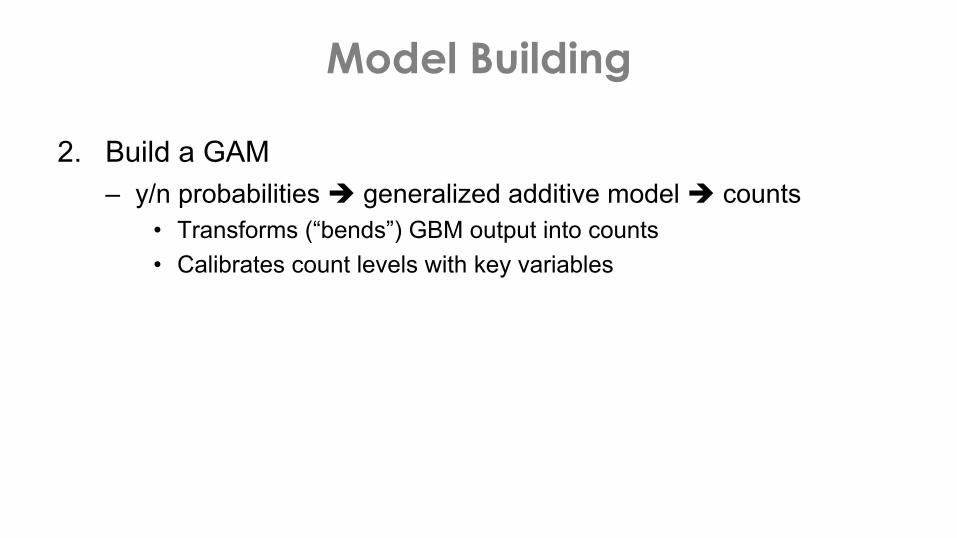
Model Building
2. Build a GAM – y/n probabilities è generalized additive model è counts
• Transforms (“bends”) GBM output into counts • Calibrates count levels with key variables

Using the Forecasts
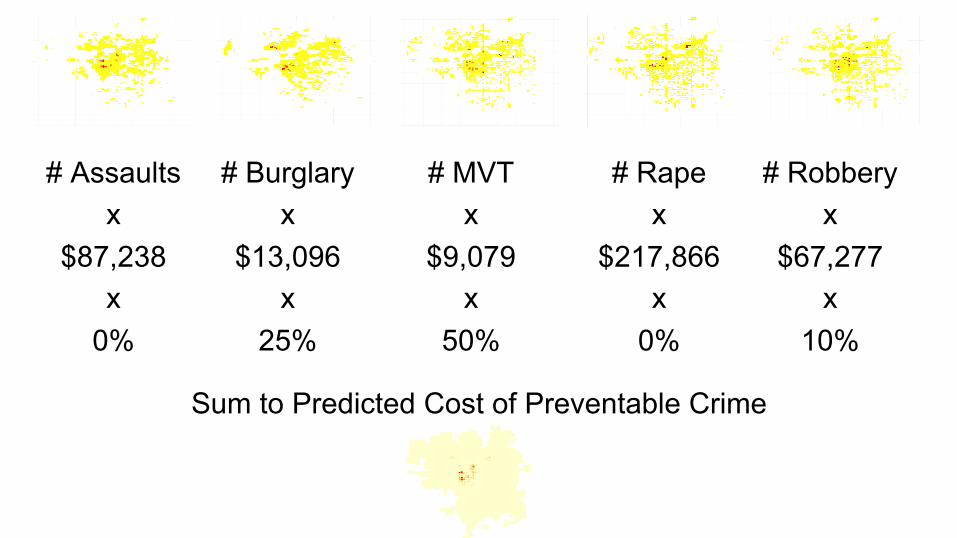
# Assaults x
$87,238 x
0%
# Burglary x
$13,096 x
25%
# MVT x
$9,079 x
50%
# Rape x
$217,866 x
0%
# Robbery x
$67,277 x
10%
Sum to Predicted Cost of Preventable Crime
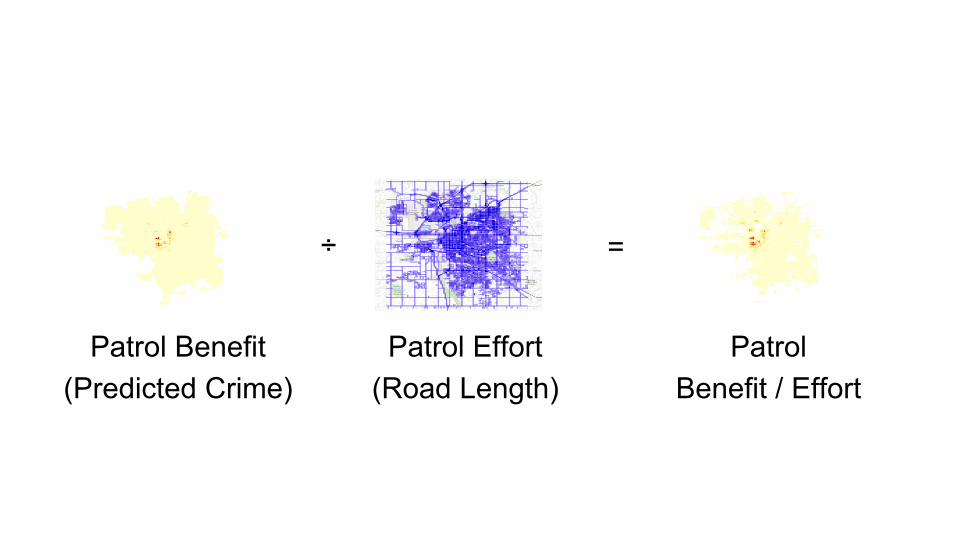
Patrol Benefit (Predicted Crime)
Patrol Effort (Road Length)
÷ =
Patrol Benefit / Effort
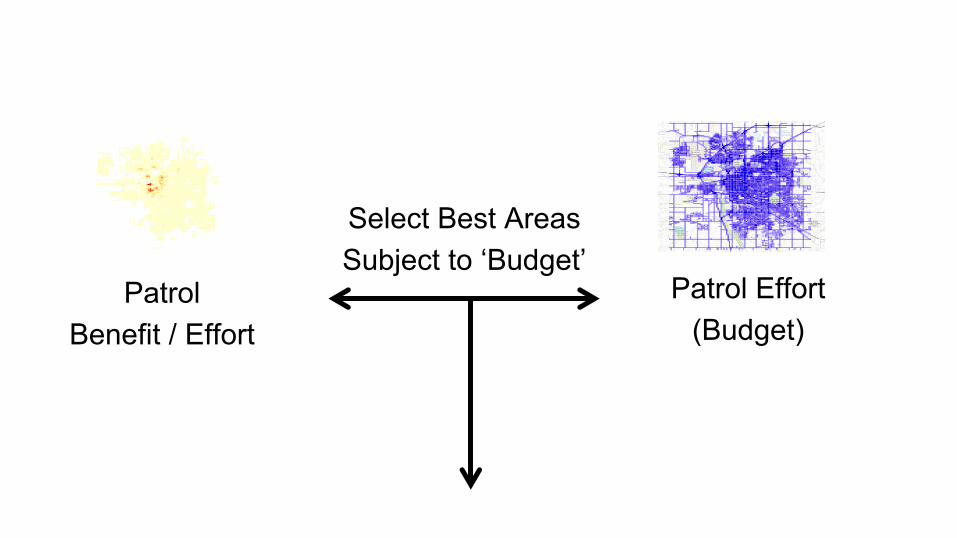
Patrol Benefit / Effort
Patrol Effort (Budget)
Select Best Areas Subject to ‘Budget’
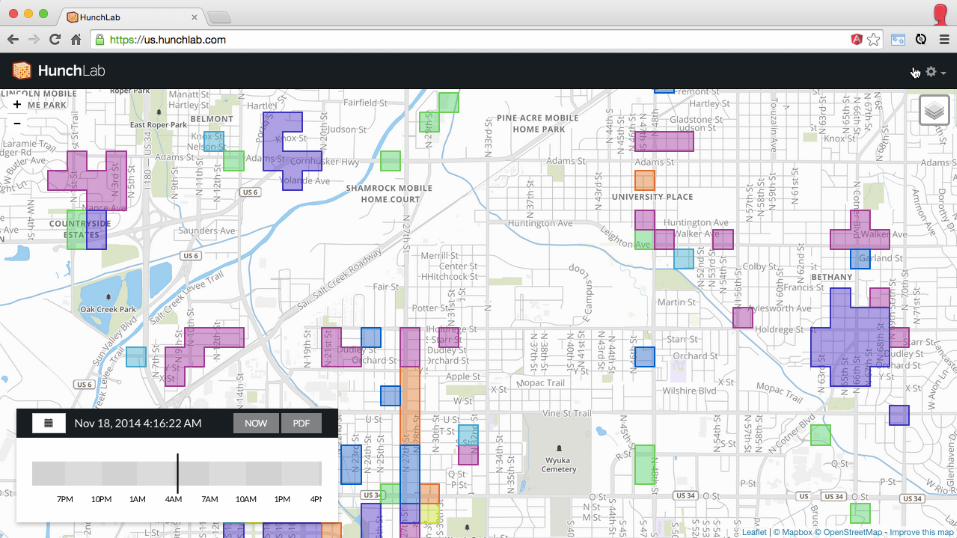
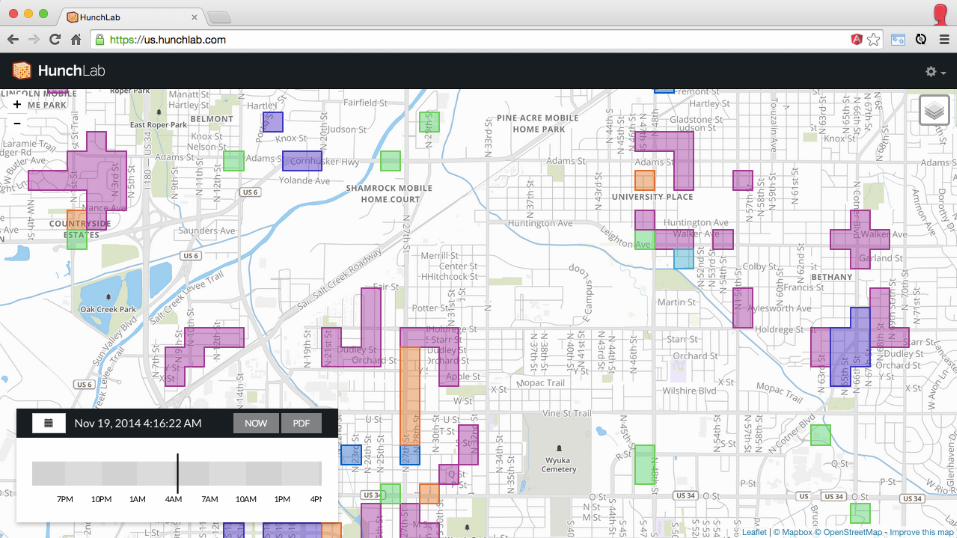

Is always patrolling today’s highest risk locations the best strategy?
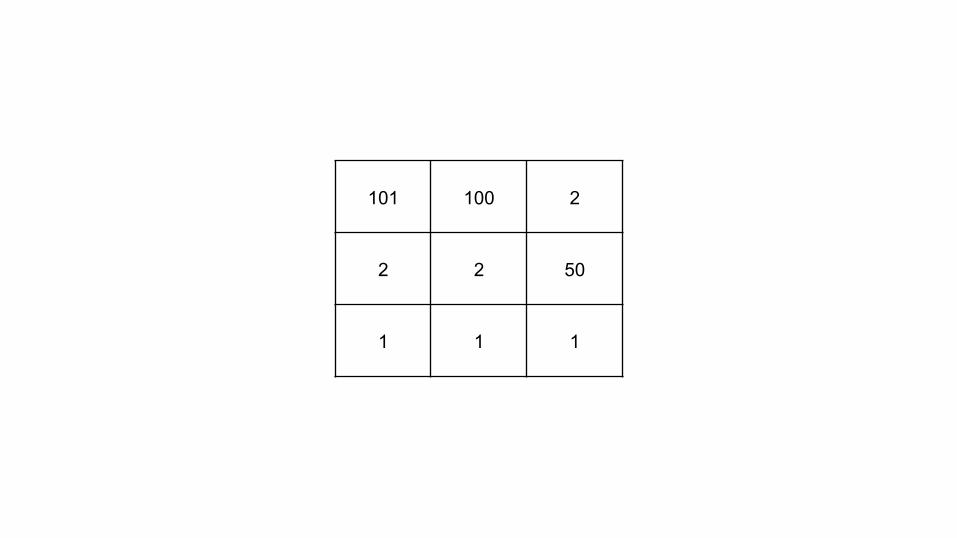
101 100 2
2 2 50
1 1 1
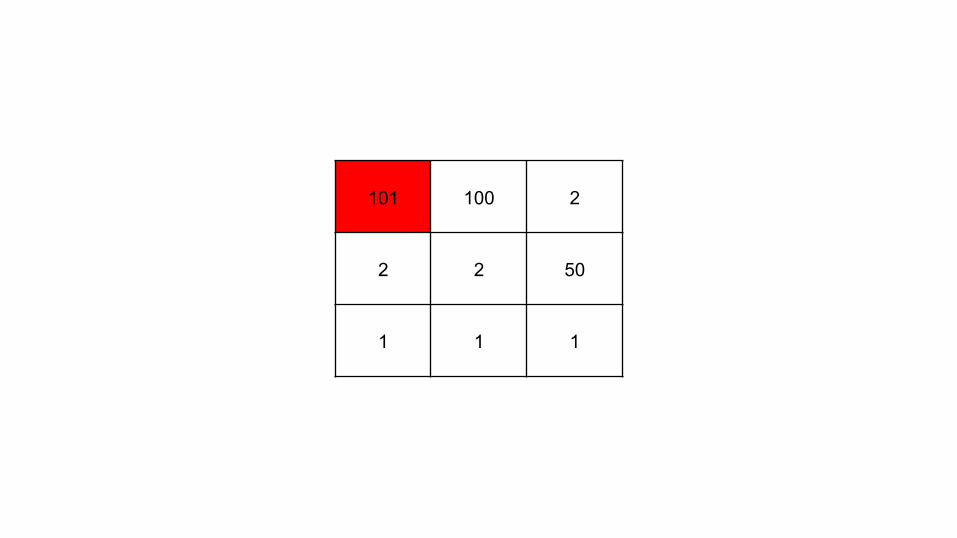
101 100 2
2 2 50
1 1 1
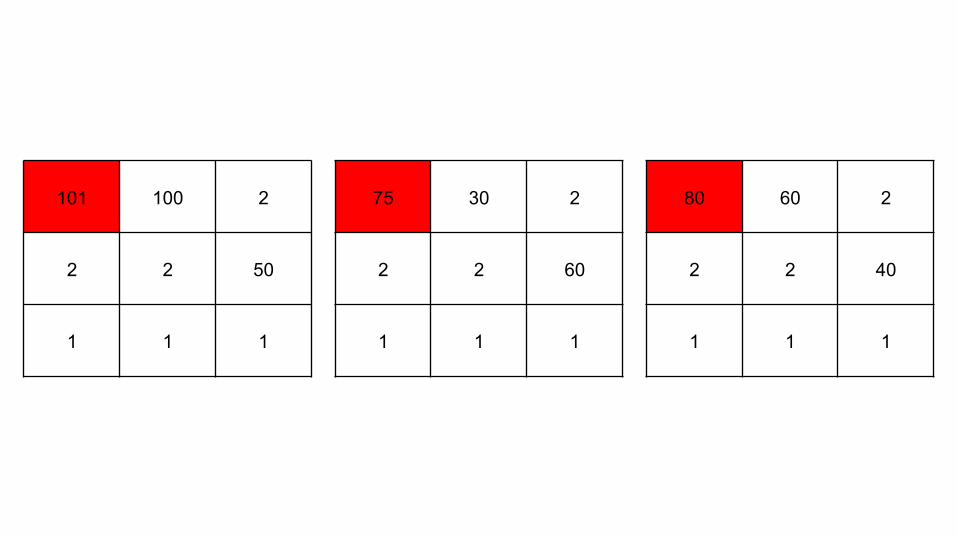
75 30 2
2 2 60
1 1 1
101 100 2
2 2 50
1 1 1
80 60 2
2 2 40
1 1 1
1.65 1.63 -0.61
-0.61 -0.61 0.48
-0.64 -0.64 -0.64
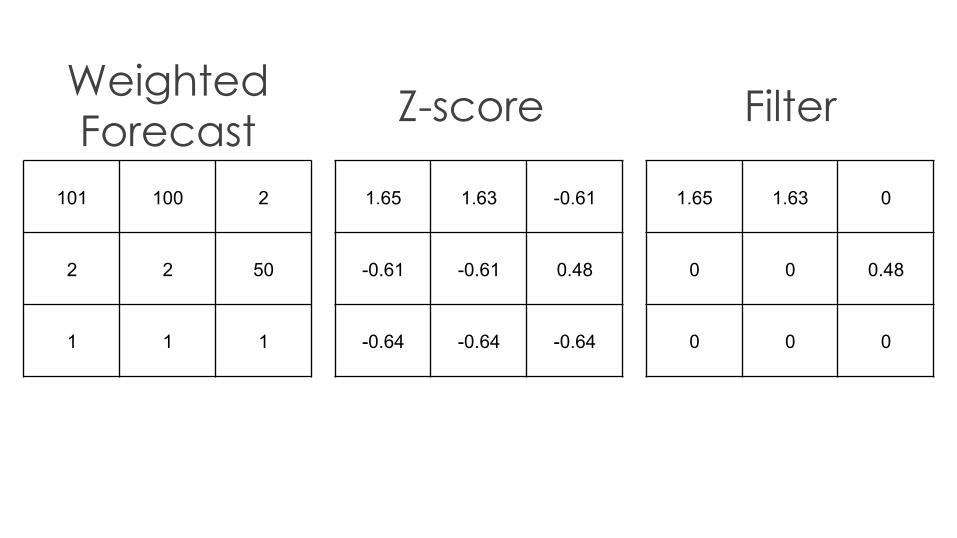
101 100 2
2 2 50
1 1 1
1.65 1.63 0
0 0 0.48
0 0 0
Weighted Forecast Z-score Filter
4.52 4.34 0
0 0 0.11
0 0 0
1.65 1.63 0
0 0 0.48
0 0 0
4.52 4.34 0
0 0 0.11
0 0 0
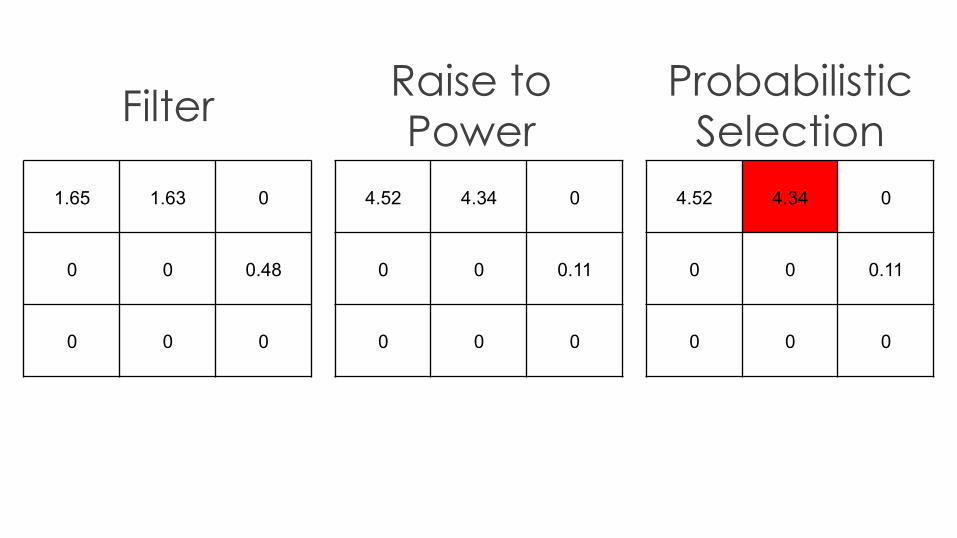
Filter Raise to Power
Probabilistic Selection
4.52 4.34 0
0 0 0.11
0 0 0
1.65 1.63 0
0 0 0.48
0 0 0
4.52 4.34 0
0 0 0.11
0 0 0
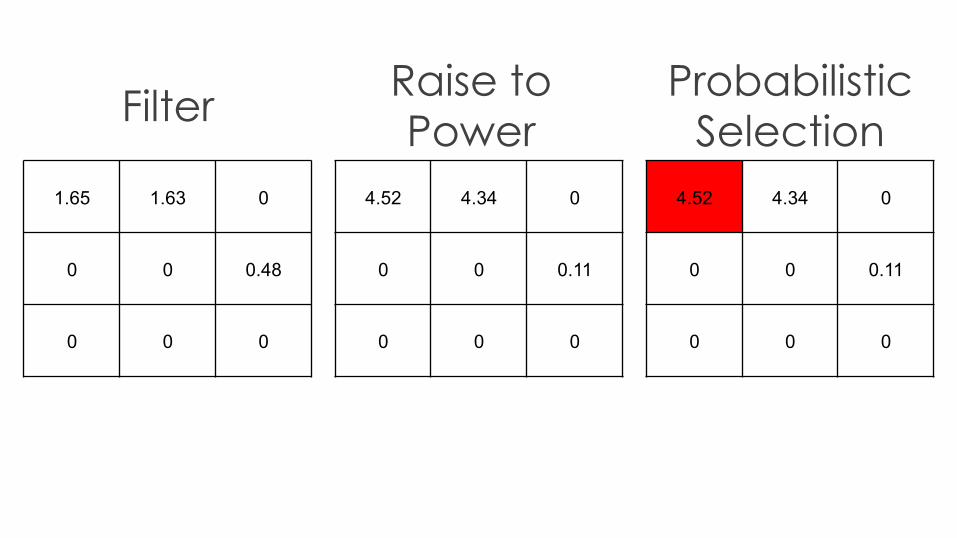
Filter Raise to Power
Probabilistic Selection
4.52 4.34 0
0 0 0.11
0 0 0
1.65 1.63 0
0 0 0.48
0 0 0
4.52 4.34 0
0 0 0.11
0 0 0
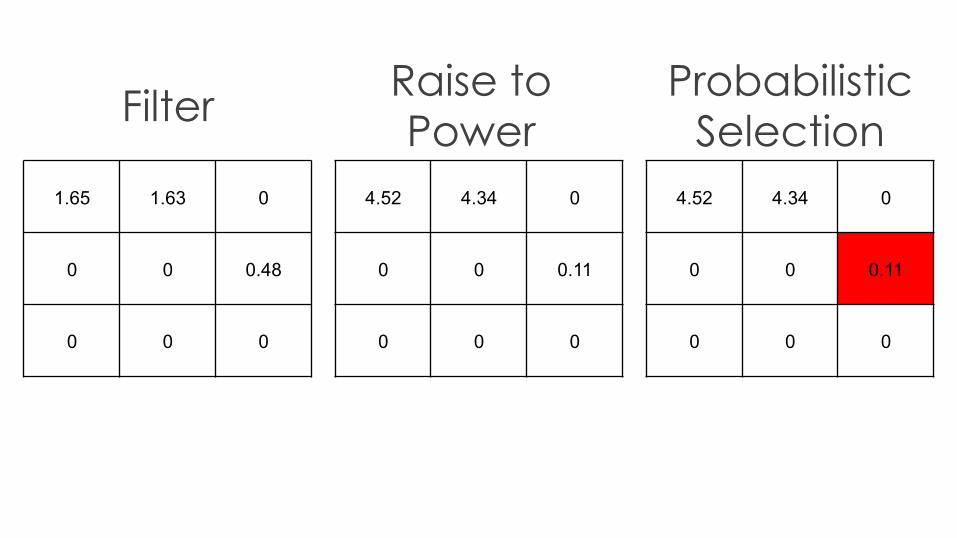
Filter Raise to Power
Probabilistic Selection

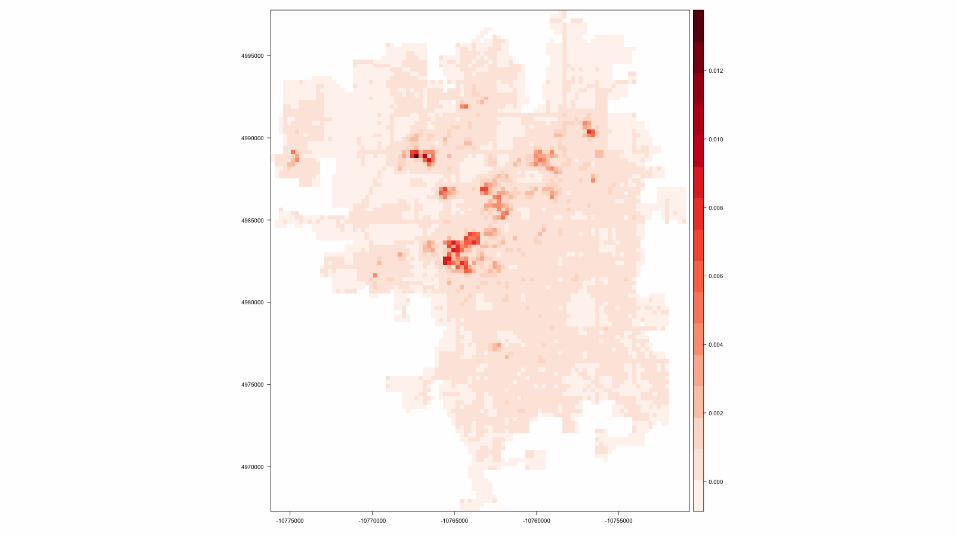
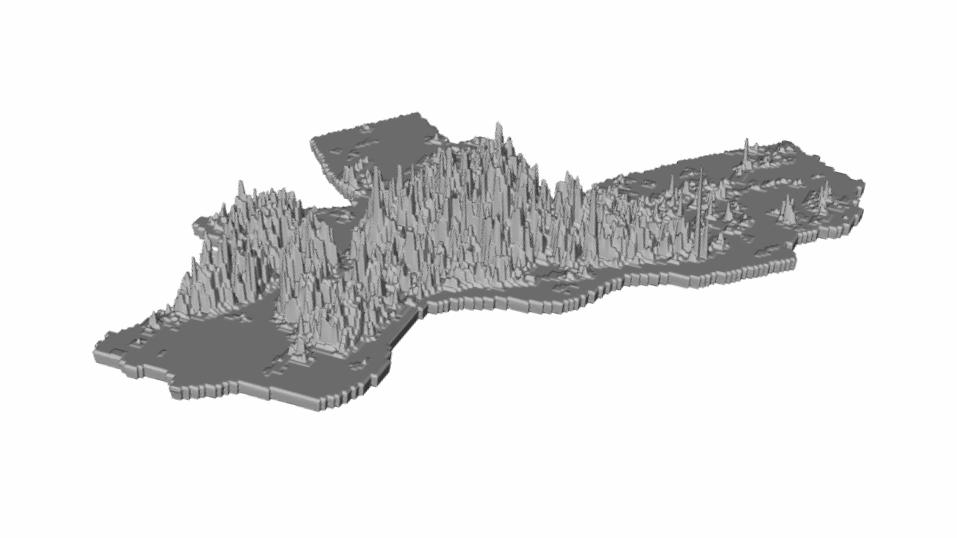
Results

So what forecasts crime?
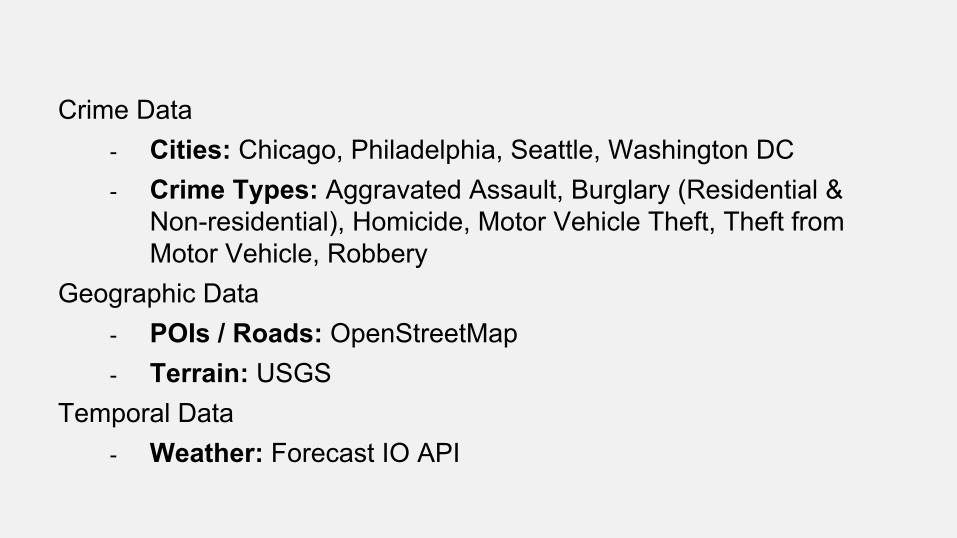
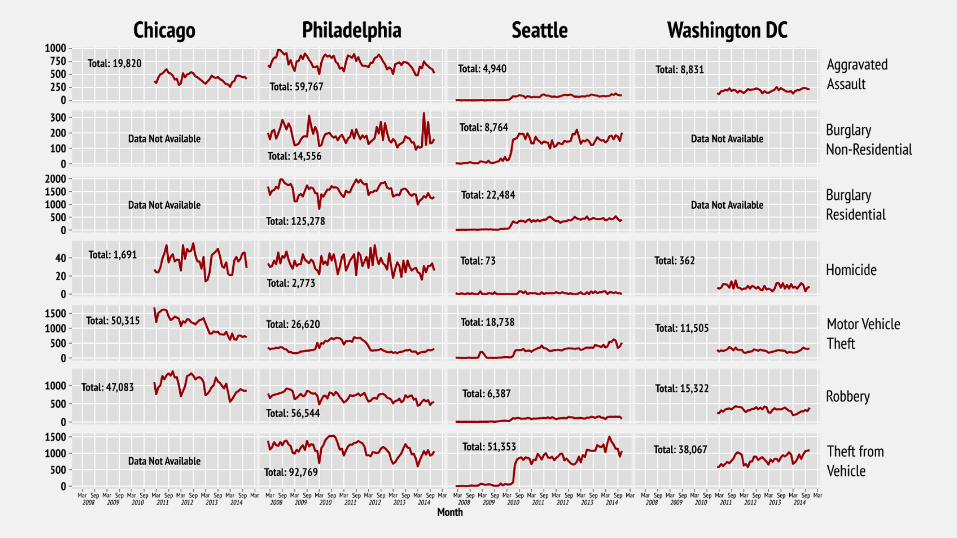
Crime Data - Cities: Chicago, Philadelphia, Seattle, Washington DC - Crime Types: Aggravated Assault, Burglary (Residential &
Non-residential), Homicide, Motor Vehicle Theft, Theft from Motor Vehicle, Robbery
Geographic Data - POIs / Roads: OpenStreetMap - Terrain: USGS
Temporal Data - Weather: Forecast IO API
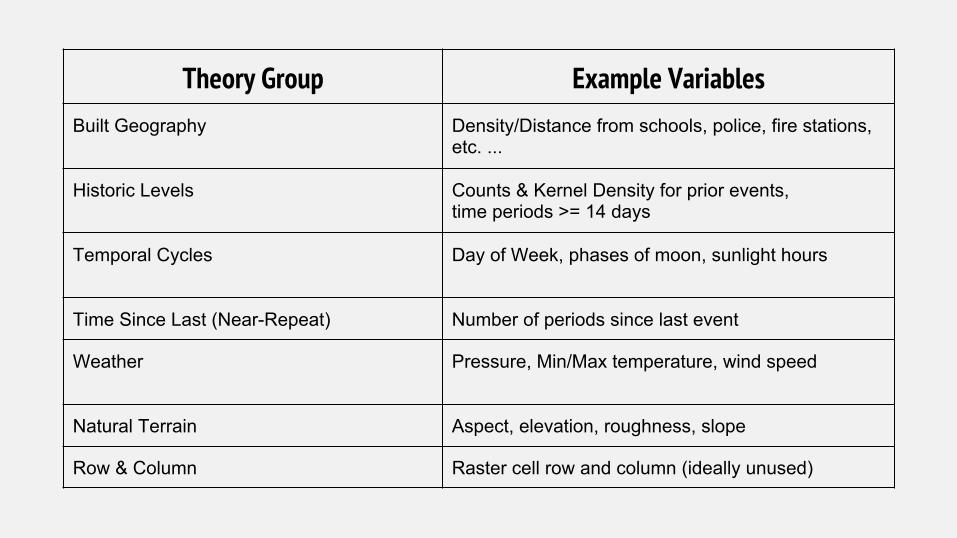
Theory Group Example Variables Built Geography Density/Distance from schools, police, fire stations,
etc. ...
Historic Levels Counts & Kernel Density for prior events, time periods >= 14 days
Temporal Cycles Day of Week, phases of moon, sunlight hours
Time Since Last (Near-Repeat) Number of periods since last event
Weather Pressure, Min/Max temperature, wind speed
Natural Terrain Aspect, elevation, roughness, slope
Row & Column Raster cell row and column (ideally unused)
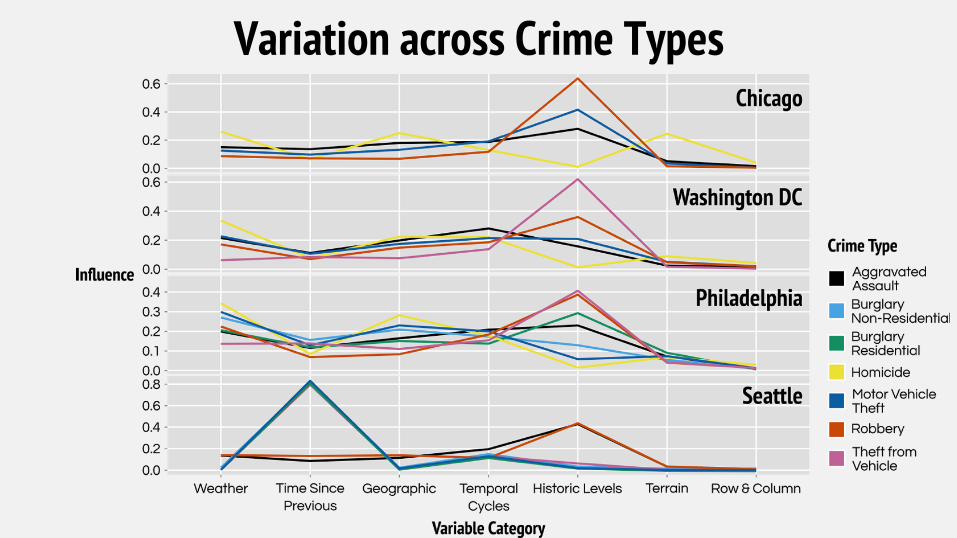
Variation across Crime Types
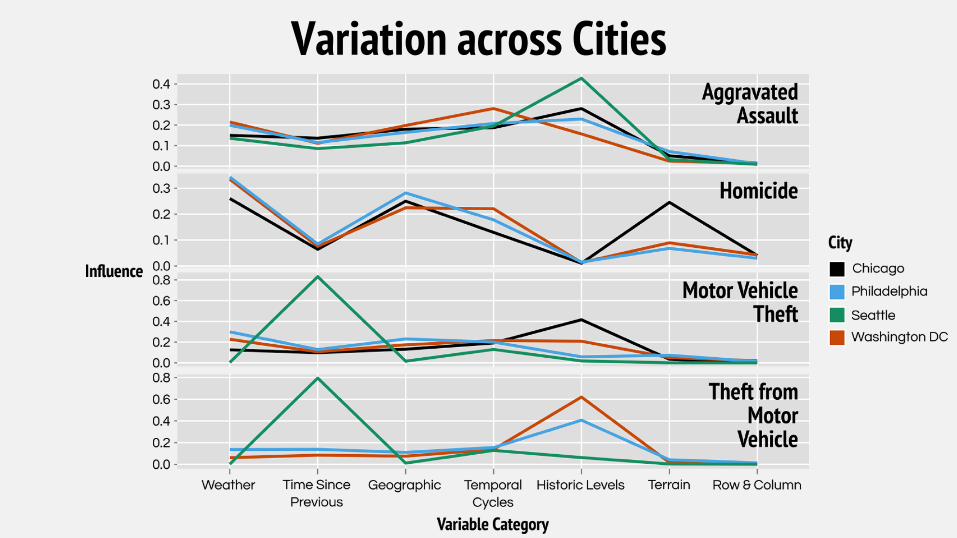
Variation across Cities
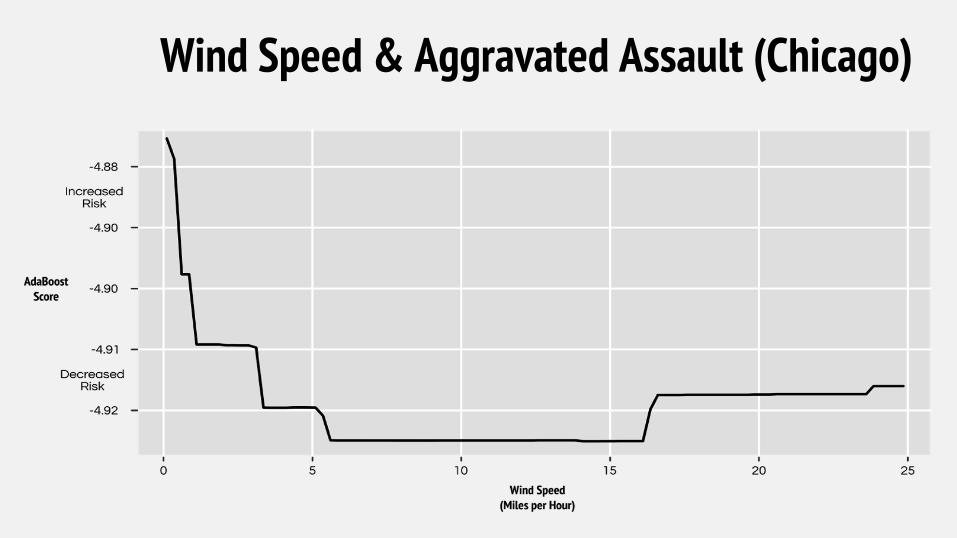
Wind Speed & Aggravated Assault (Chicago)
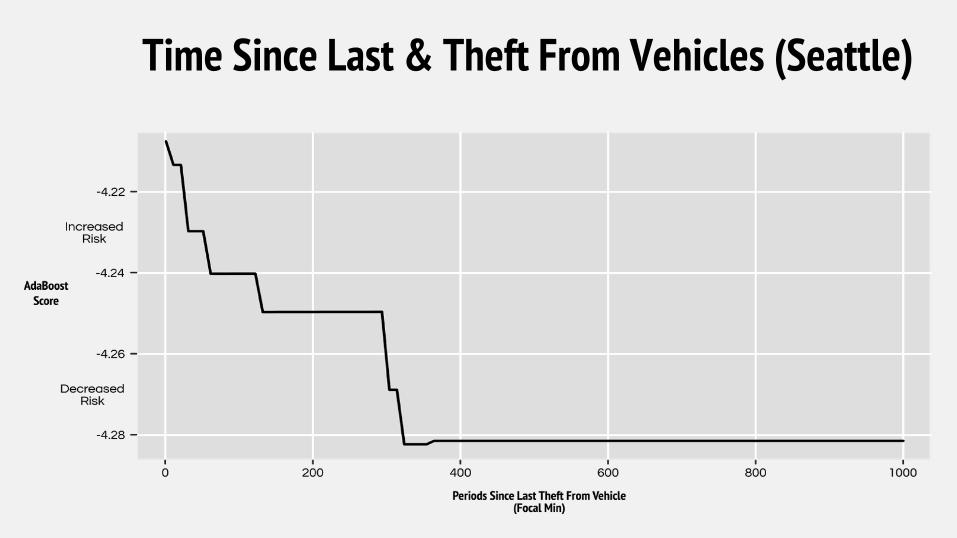
Time Since Last & Theft From Vehicles (Seattle)
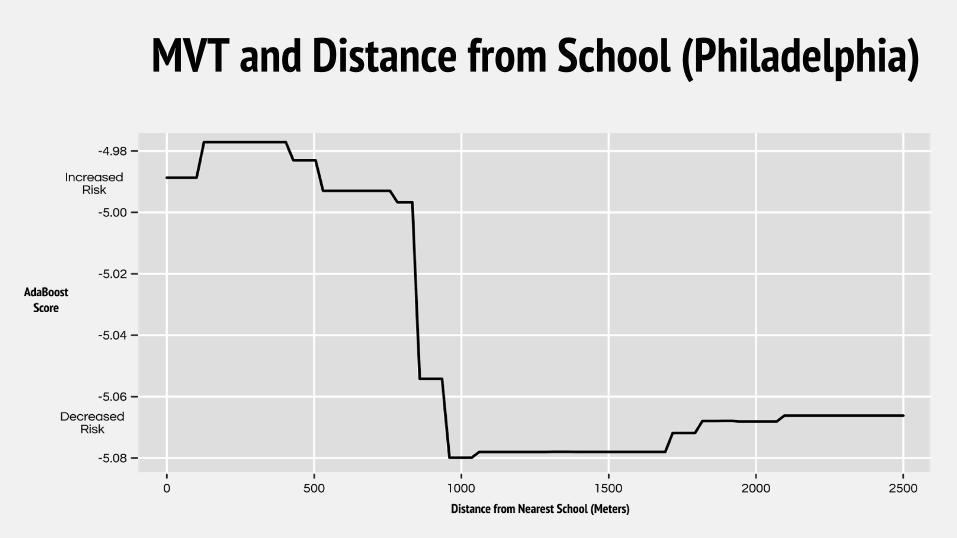
MVT and Distance from School (Philadelphia)
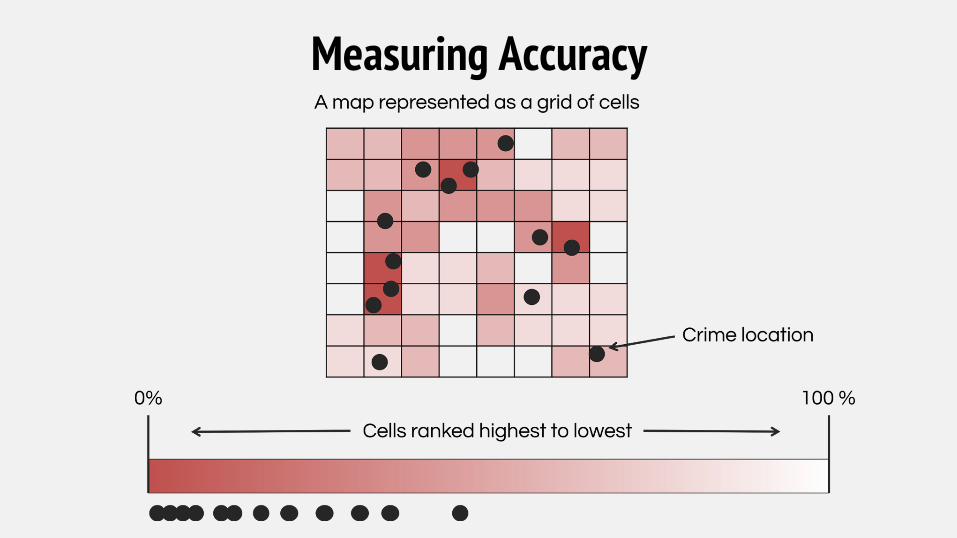
Measuring Accuracy
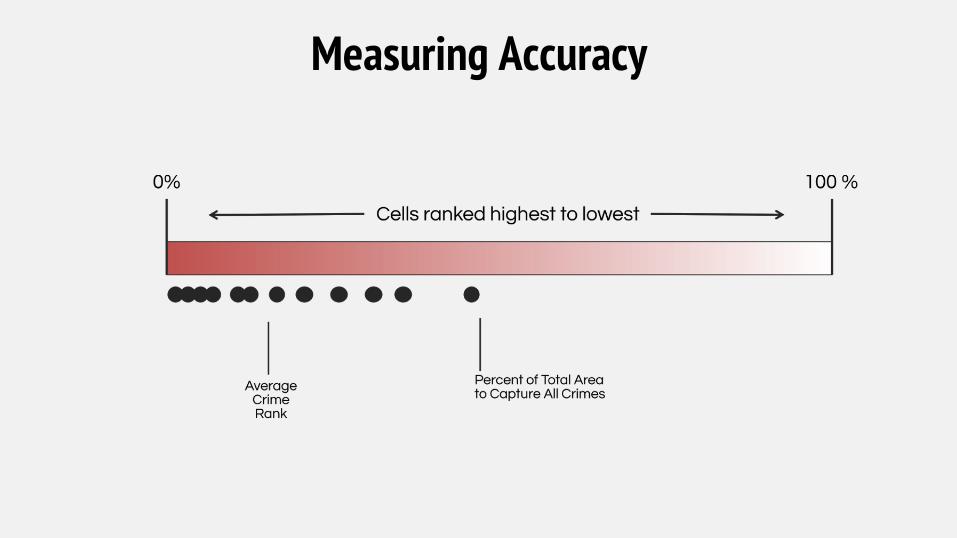
Measuring Accuracy
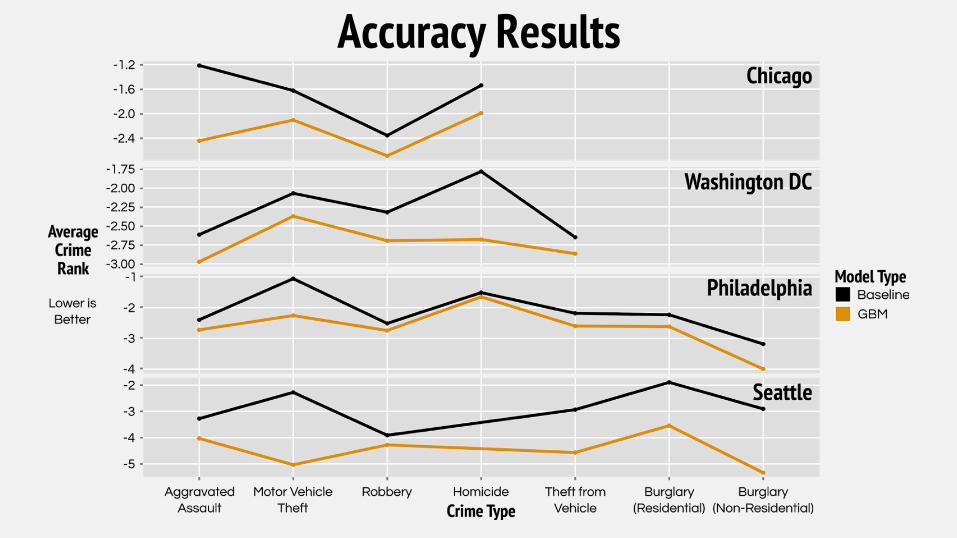
Accuracy Results

Questions? Jeremy Heffner Senior Data Scientist [email protected]
340 N 12th St, Suite 402 Philadelphia, PA 19107 215.295.2600 www.azavea.com