financial support to developing countries for … · overview of multilateral climate change funds...
TRANSCRIPT

www.ieep.eu
FINANCIAL SUPPORT TO DEVELOPING COUNTRIES FOR CLIMATECHANGE MITIGATION AND
ADAPTATION: IS THE EU MEETING ITSCOMMITMENTS?
Marc Pallemaerts & Jonathan ArmstrongInstitute for European Environmental Policy (IEEP)
Financial commitments under UNFCCC
• Industrialised countries to make "new and additional financial resources" available to developing countries "on a grant or concessional basis" for climate action
• Special « financial mechanism » to be established : Global Environment Facility
• Special adaptation assistance to be provided to most vulnerable developing countries
Overview of multilateral Climate Change Funds
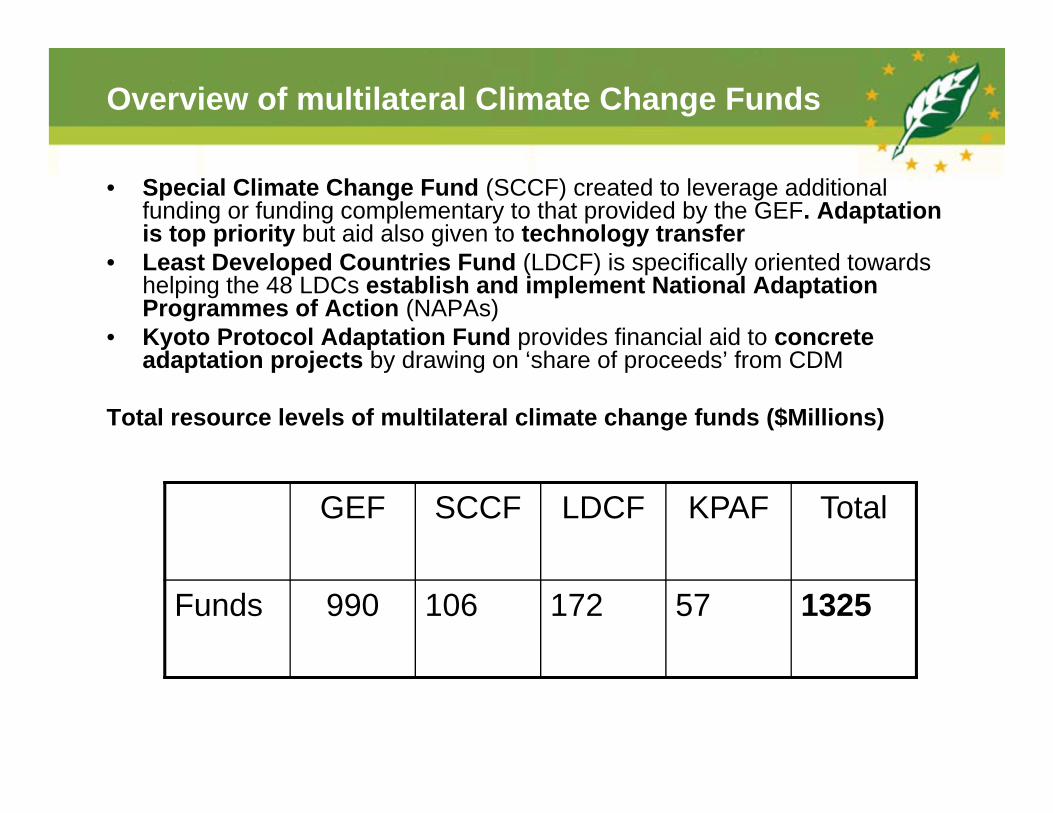
• Special Climate Change Fund (SCCF) created to leverage additional funding or funding complementary to that provided by the GEF. Adaptation is top priority but aid also given to technology transfer
• Least Developed Countries Fund (LDCF) is specifically oriented towards helping the 48 LDCs establish and implement National Adaptation Programmes of Action (NAPAs)
• Kyoto Protocol Adaptation Fund provides financial aid to concrete adaptation projects by drawing on ‘share of proceeds’ from CDM
Total resource levels of multilateral climate change funds ($Millions)
GEF SCCF LDCF KPAF Total
Funds 990 106 172 57 1325

Investors in CDM projects (source of funding for KPAF)
The Bonn Declaration (2001)
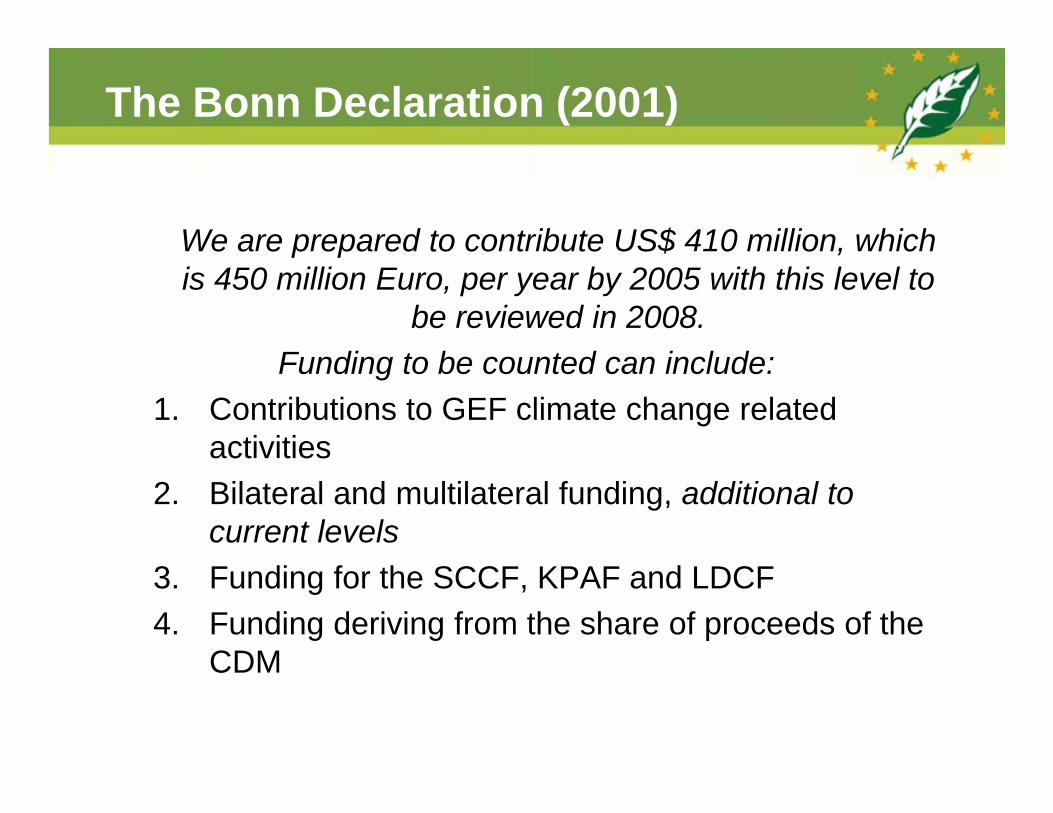
We are prepared to contribute US$ 410 million, which is 450 million Euro, per year by 2005 with this level to
be reviewed in 2008.Funding to be counted can include:
1. Contributions to GEF climate change related activities
2. Bilateral and multilateral funding, additional to current levels
3. Funding for the SCCF, KPAF and LDCF4. Funding deriving from the share of proceeds of the
CDM
Signatories of Bonn Declaration
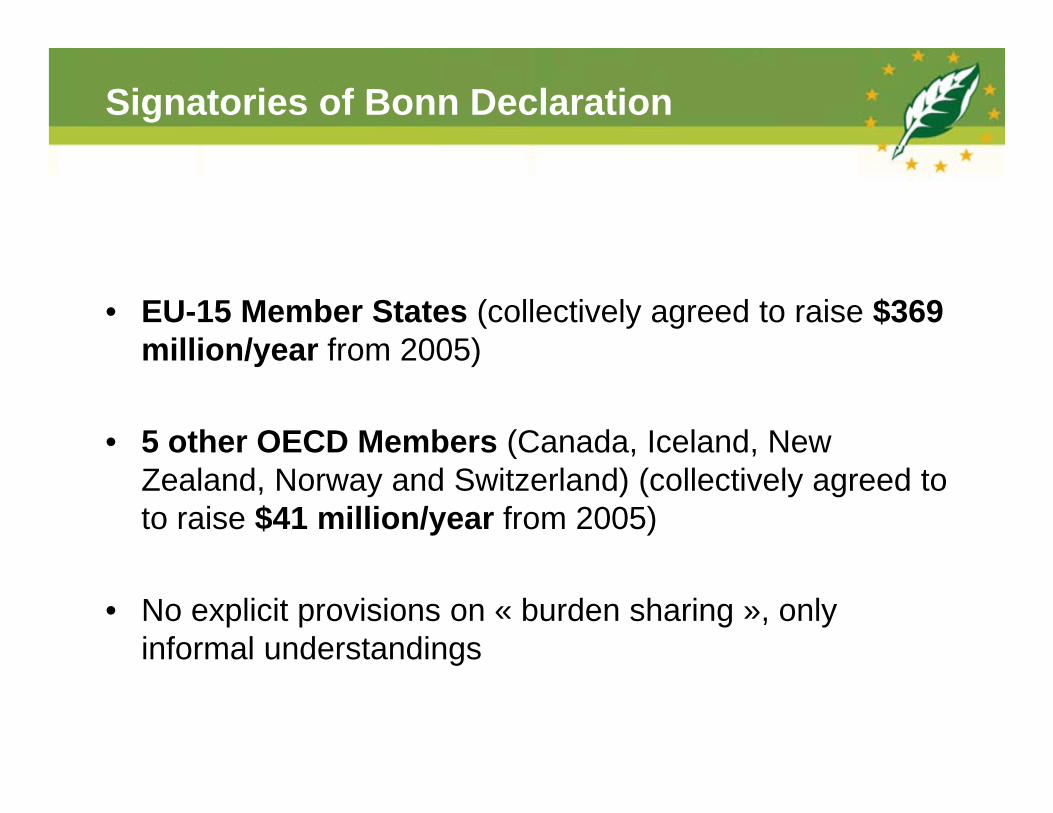
• EU-15 Member States (collectively agreed to raise $369 million/year from 2005)
• 5 other OECD Members (Canada, Iceland, New Zealand, Norway and Switzerland) (collectively agreed to to raise $41 million/year from 2005)
• No explicit provisions on « burden sharing », only informal understandings

Indicative Burden Sharing of EU Commitment
• Break down of commitment based on 1990 CO2 emission levels (“polluter pays principle”):

Annual EU-15 multilateral climate contributions
• Average annual contributions to multilateral climate change funds ($million)

Annual EU-15 bilateral climate funding
• Funding provided to developing countries in climate change related bilateral projects for the year 2004 or the closest available year (EU-15 countries with insufficient data not included)
Question: additional to 2001 level?
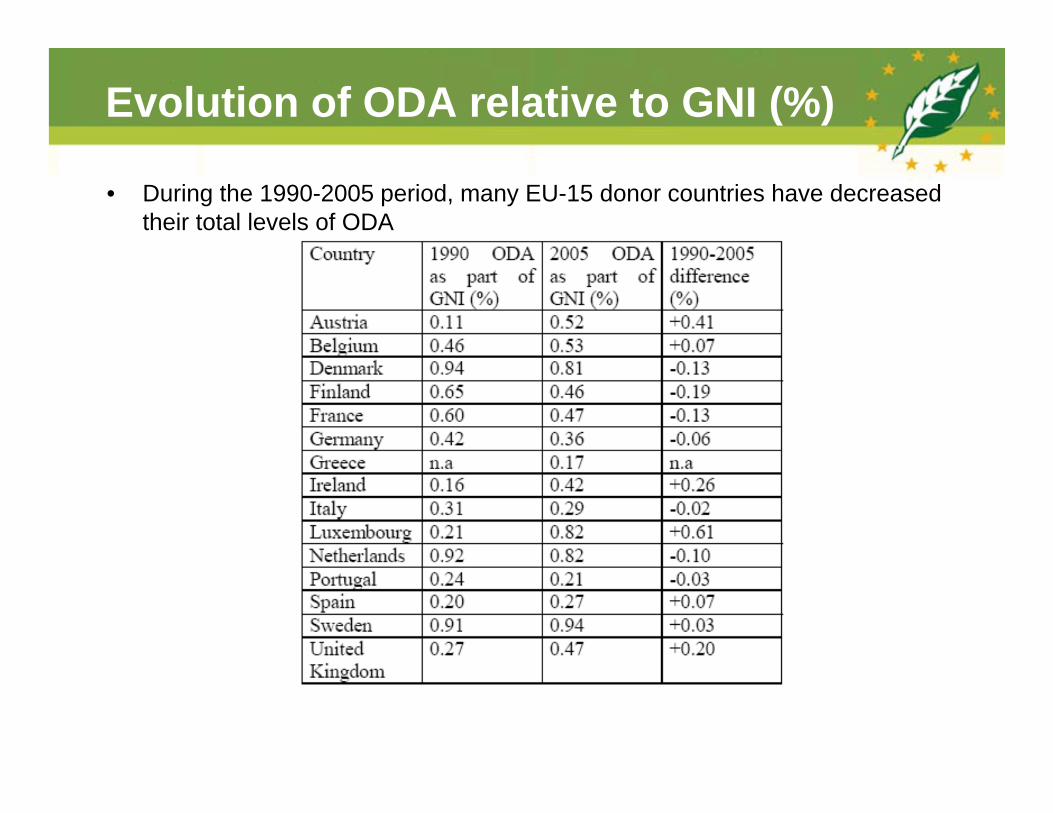
Evolution of ODA relative to GNI (%)
• During the 1990-2005 period, many EU-15 donor countries have decreased their total levels of ODA

Conclusions
• Funding provided through multilateral climate funds insufficient to meet EU-15 commitment
• Bilateral aid may be sufficient to make up for difference, but lack of transparency as to additionality and actual link with climate change mitigation or adaptation
• EU needs to take steps to ensure full transparency and comparability of data
www.ieep.eu
Exploring Belgium’s contribution to international
climate finance after 2012-
Presentation of final report 15 May 2012Prof. Dr. Marc Pallemaerts
Authors: Dr Pernille Schiellerup & Kristof Geraerts
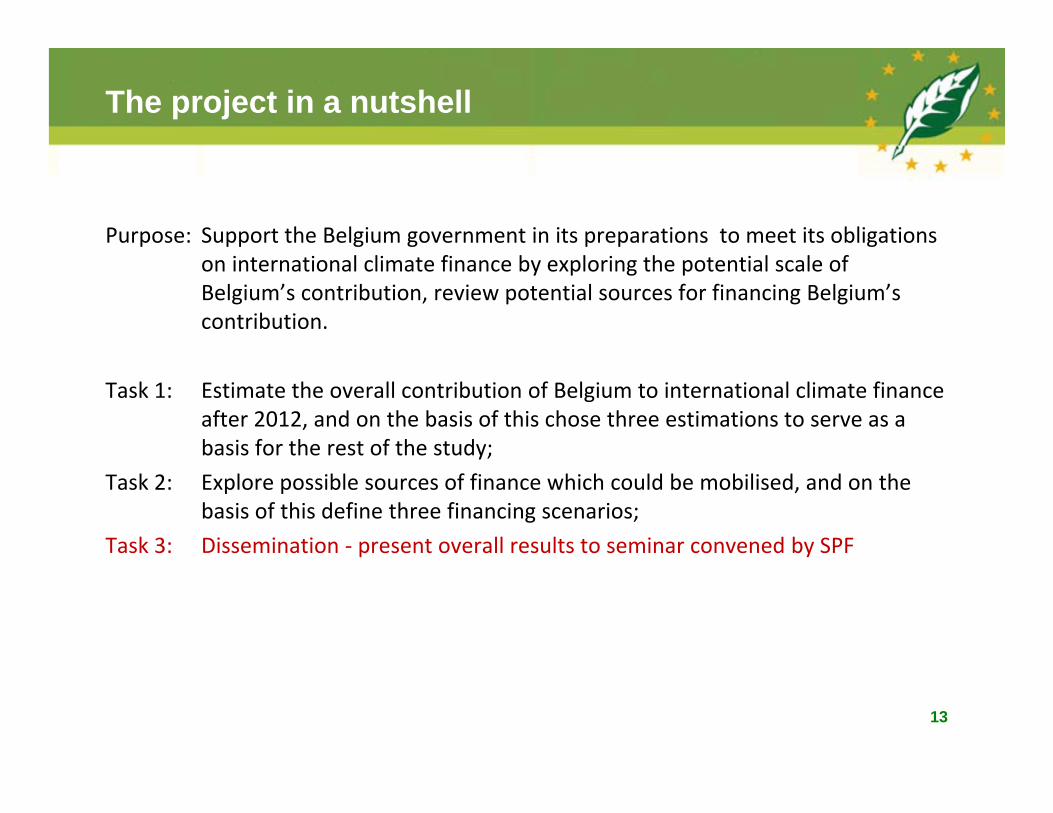
The project in a nutshell
Purpose: Support the Belgium government in its preparations to meet its obligations on international climate finance by exploring the potential scale of Belgium’s contribution, review potential sources for financing Belgium’s contribution.
Task 1: Estimate the overall contribution of Belgium to international climate finance after 2012, and on the basis of this chose three estimations to serve as a basis for the rest of the study;
Task 2: Explore possible sources of finance which could be mobilised, and on the basis of this define three financing scenarios;
Task 3: Dissemination ‐ present overall results to seminar convened by SPF
13
14
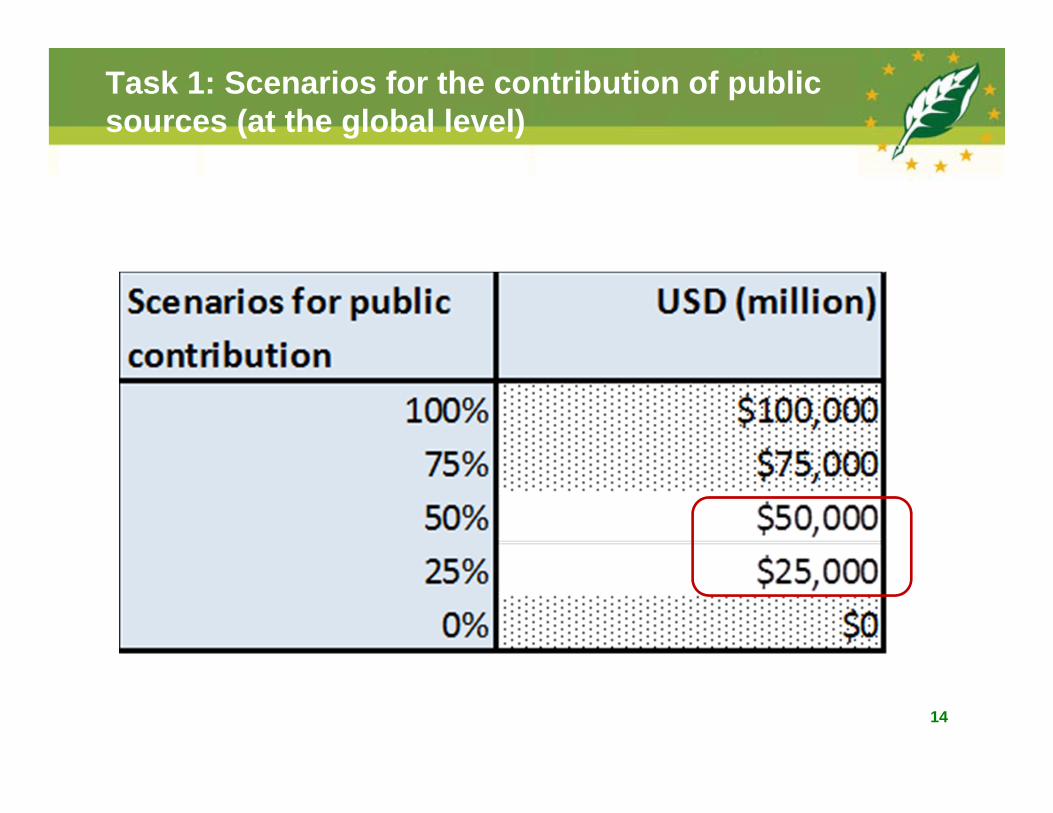
Task 1: Scenarios for the contribution of public sources (at the global level)
15
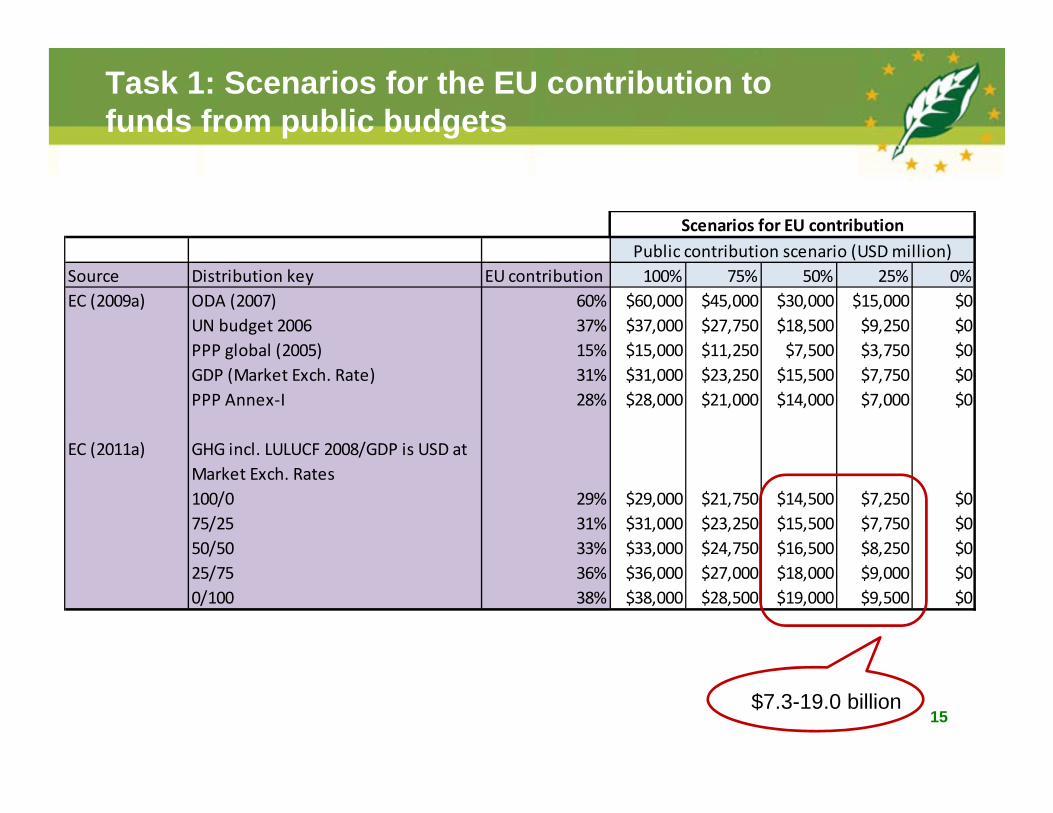
Task 1: Scenarios for the EU contribution to funds from public budgets
Source Distribution key EU contribution 100% 75% 50% 25% 0%EC (2009a) ODA (2007) 60% $60,000 $45,000 $30,000 $15,000 $0
UN budget 2006 37% $37,000 $27,750 $18,500 $9,250 $0PPP global (2005) 15% $15,000 $11,250 $7,500 $3,750 $0GDP (Market Exch. Rate) 31% $31,000 $23,250 $15,500 $7,750 $0PPP Annex‐I 28% $28,000 $21,000 $14,000 $7,000 $0
EC (2011a) GHG incl. LULUCF 2008/GDP is USD at Market Exch. Rates100/0 29% $29,000 $21,750 $14,500 $7,250 $075/25 31% $31,000 $23,250 $15,500 $7,750 $050/50 33% $33,000 $24,750 $16,500 $8,250 $025/75 36% $36,000 $27,000 $18,000 $9,000 $00/100 38% $38,000 $28,500 $19,000 $9,500 $0
Public contribution scenario (USD million)Scenarios for EU contribution
$7.3-19.0 billion

16
Task 1: Scenarios for contributions from the next MFF
Instrument € million Applies to relevant
countries?
Climate change
included in scope?
Resulting initial
baseline estimate
20% Annualised over 2014‐2020
$ million
Pre‐accession instrument (IPA) € 14,110 No n/a € 0
European Neighbourhood Instrument (ENI) € 18,182Yes, but not exclusively Yes € 18,182
Development Cooperation Instrument (DCI) € 23,295 Yes Yes € 23,295Partnership Instrument (PI) € 1,131 Yes Yes € 1,131Instrument for Stability (IfS) € 2,829 Yes Yes € 2,829European Instrument for Democracy & Human Rights (EIDHR) € 1,578 Yes No € 0Instrument for Nuclear Safety Cooperation € 631 Yes No € 0Instrument for Greenland € 219 No n/a € 0Total € 61,975 € 45,437 € 9,087 € 1,298 1,703$
Scenarios for contribution from MFF 2014‐2020 Million USD per annum
High $1,703Medium $1,135Low $568

Task 1: Scenarios for EU Member State contributions minus MFF contribution
17
Source Distribution key EU contribution 100% 75% 50% 25%EC (2009a) ODA (2007) 60% $58,297 $43,297 $28,297 $13,297
UN budget 2006 37% $35,297 $26,047 $16,797 $7,547PPP global (2005) 15% $13,297 $9,547 $5,797 $2,047GDP (Market Exch. Rate) 31% $29,297 $21,547 $13,797 $6,047PPP Annex‐I 28% $26,297 $19,297 $12,297 $5,297
EC (2011a) GHG incl. LULUCF 2008/GDP is USD at Market Exch. Rates100/0 29% $27,297 $20,047 $12,797 $5,54775/25 31% $29,297 $21,547 $13,797 $6,04750/50 33% $31,297 $23,047 $14,797 $6,54725/75 36% $34,297 $25,297 $16,297 $7,2970/100 38% $36,297 $26,797 $17,297 $7,797
Source Distribution key EU contribution 100% 75% 50% 25%EC (2009a) ODA (2007) 60% $58,865 $43,865 $28,865 $13,865
UN budget 2006 37% $35,865 $26,615 $17,365 $8,115PPP global (2005) 15% $13,865 $10,115 $6,365 $2,615GDP (Market Exch. Rate) 31% $29,865 $22,115 $14,365 $6,615PPP Annex‐I 28% $26,865 $19,865 $12,865 $5,865
EC (2011a) GHG incl. LULUCF 2008/GDP is USD at Market Exch. Rates100/0 29% $27,865 $20,615 $13,365 $6,11575/25 31% $29,865 $22,115 $14,365 $6,61550/50 33% $31,865 $23,615 $15,365 $7,11525/75 36% $34,865 $25,865 $16,865 $7,8650/100 38% $36,865 $27,365 $17,865 $8,365
Source Distribution key EU contribution 100% 75% 50% 25%EC (2009a) ODA (2007) 60% $59,432 $44,432 $29,432 $14,432
UN budget 2006 37% $36,432 $27,182 $17,932 $8,682PPP global (2005) 15% $14,432 $10,682 $6,932 $3,182GDP (Market Exch. Rate) 31% $30,432 $22,682 $14,932 $7,182PPP Annex‐I 28% $27,432 $20,432 $13,432 $6,432
EC (2011a) GHG incl. LULUCF 2008/GDP is USD at Market Exch. Rates100/0 29% $28,432 $21,182 $13,932 $6,68275/25 31% $30,432 $22,682 $14,932 $7,18250/50 33% $32,432 $24,182 $15,932 $7,68225/75 36% $35,432 $26,432 $17,432 $8,4320/100 38% $37,432 $27,932 $18,432 $8,932
Scenarios for the EU contribution minus the MFF
Low MFF contribution scenarioPublic contribution scenario (USD million)
Public contribution scenario (USD million)High MFF contribution scenario
Public contribution scenario (USD million)Medium MFF contribution scenario
$6.1-17.9 billion
$6.7-18.4 billion

18
Task 1: Summary of distribution keys for deriving the Belgian contribution
Type of comparison No. Type of key %Distribution keys based on international comparison 1 ODA 1.9%
2 UN‐budget 1.1%3 GEF (from NC5:2006‐2009) 2.8%
Distribution keys based on EU comparisons 1 GNI key for financing the 2012 EU budget (Belgium) 2.9%3 GHG weight/GDP weight = 100/0 2.7%4 GHG weight/GDP weight = 75/25 2.2%5 GHG weight/GDP weight = 50/50 1.7%6 GHG weight/GDP weight = 25/75 1.2%7 GHG weight/GDP weight = 0/100 0.7%8 Belgian share of 2010‐2012 fast start finance 2.1%

Task 1: Defining min and max scenarios for the Belgian contribution - unadjustedA minimum figure of $15 million per annum by 2020 was based on a scenario characterised by the following conditions:
• ‘Low scenario’ public contribution: 25%• EU contribution based on PPP global (2005): 15%• ‘High scenario’ MFF contribution: $1,703 million per annum in 2020• Belgian share of Member State based contribution based on EU GHG weight/GDP
weight= 0/100: 0.7%
A maximum figure of $2,810 million per annum by 2020 was based on a scenario characterised by the following conditions:
• ‘High scenario’ public contribution: 100%• Belgian share based on international comparison• Belgian share of total public contribution is based on share of GEF contributions
(NC5: 2006‐2009): 2.8%
19

Task 1: Min and max scenarios for the Belgian contribution - unadjusted
20
$15 million
$2.8 billion

Task 1: Defining min and max scenarios for the Belgian contribution - adjustedA minimum figure of $127 million per annum by 2020 was based on a scenario characterised by the following conditions:
• ‘Low scenario’ public contribution: 25%• EU contribution based on 100/0 GHG/GDP weighting: 29%• ‘Medium scenario’ MFF contribution: $1,135 million per annum in 2020• Belgian share of direct Member State contributions based on share of “fast‐start”
finance: 2.1%
A maximum figure of $542 million per annum by 2020 was based on a scenario characterised by the following conditions:
• ‘Medium scenario’ public contribution: 50%• EU contribution based on 0/100 GHG/GDP weighting: 38%• ‘Low scenario’ MFF contribution: $568 million per annum in 2020• Belgian share of direct Member State contributions based on GNI distribution key
for 2012 EU budget: 2.94%• elgian contribution
21
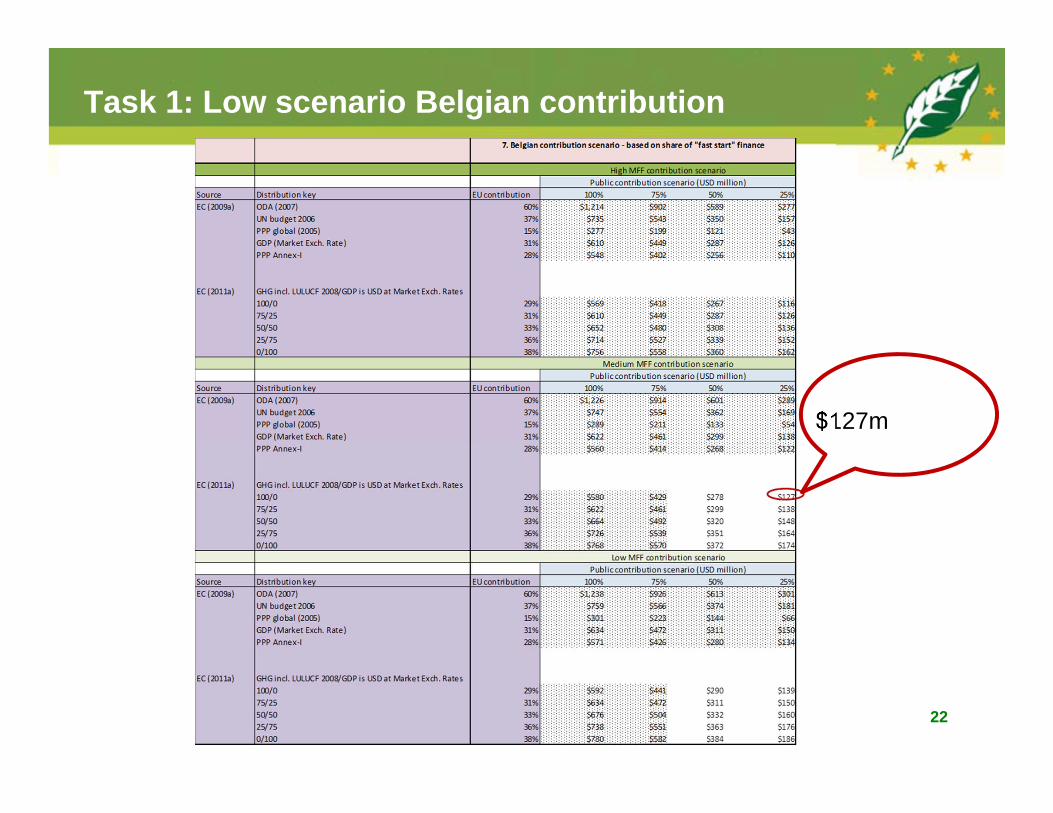
Task 1: Low scenario Belgian contribution
22
$127m

23
Task 1: High scenario Belgian contribution
$542m

Task 1: Three scenarios for Belgium’s contribution
24
In USD million In Euro millionLow 127$ 97€ Medium 335$ 255€ High 542$ 413€

Task 2: Financing the Belgian contribution –review of eight potential sources of financing
1.A carbon tax;2.A tax/levy on airplane tickets of international flights3.A currency transaction tax;4.A broad financial transaction tax;5.A financial activities tax;6.Removing fossil energy subsidies;7.Fossil fuel extraction royalties;8.A wires charge+ income from the auctioning of ETS allowances
25
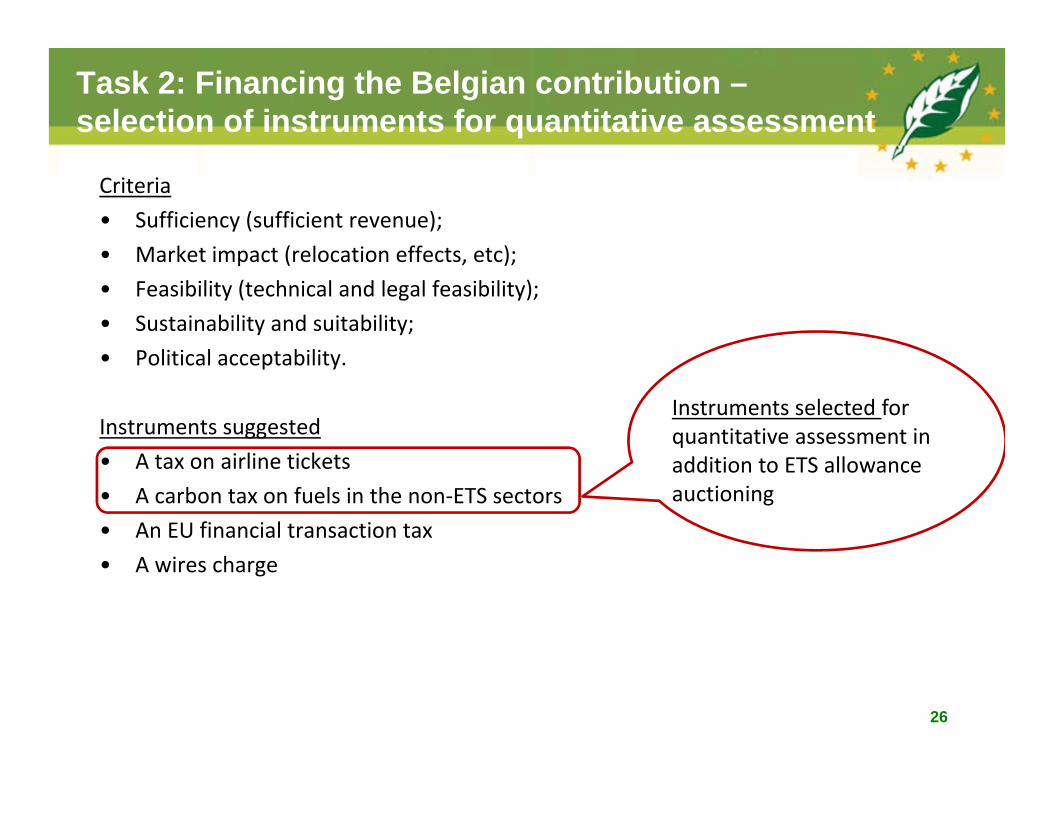
Task 2: Financing the Belgian contribution –selection of instruments for quantitative assessment
Criteria• Sufficiency (sufficient revenue);• Market impact (relocation effects, etc);• Feasibility (technical and legal feasibility);• Sustainability and suitability;• Political acceptability.
Instruments suggested• A tax on airline tickets• A carbon tax on fuels in the non‐ETS sectors• An EU financial transaction tax• A wires charge
26
Instruments selected for quantitative assessment in addition to ETS allowance auctioning

Task 2: Financing the Belgian contribution –quantitative assessment based on existing literature Carbon tax on non‐ETS sectors• €3.16 billion per annum by 2020 (Bossier et al., 2008);• Based on carbon prices of €25 per tonne• Revised 2010 showing impact of stepping up to 30 % emission reduction target;• Revision of carbon price to €5.3 per tonne ‐ €41.5 per tonne (21‐166% of original
value);• But 20 % emission reduction target scenario not updated (Bossier et al., 2010);• Ceteris paribus 21‐166% of €3.16 billion per annum estimated in Bossier et al.;
2008) equals a range of €670 million to €5.25 billion per annum by 2020.
Tax on airline tickets• Belgocontrol March 2012: €25 million per annum (now) based on €1 per
passenger ticket;• Association of Wezembeek‐Oppem against Aircraft Contravention to Silence and
Security (AWACSS) October 2008: €493 million per annum (now) based on €15 per passenger ticket;
• I.e. a range of €25 to €493 million per annum.27

Task 2: Financing the Belgian contribution –quantitative assessment based on existing literature Auctioning of ETS allowances• Bossier et al. (2008; 2010)• Maes (2011; 2012)
Estimation of Belgium’s part of auctioning rights of stationary sources
Estimation of revenue from the auctioning of allowances from stationary sources in Belgium (€m)
28
Year 2012 2013 2014 2015 2016 2017 2018 2019 2020Total
2012‐2020Average
2013‐2020Belgium's part of auctioning rights (in million allowances) 3 25 25 26 26 25 25 25 24 204 25

Task 2: Financing the Belgian contribution –unadjusted quantitative assessment
29

Task 2: From additional public receipts to likely sources of finance
• Substantial additional public receipts could potentially be generated through the auctioning of ETS allowances, through the introduction of a CO2 tax, and through the introduction of a tax on airline tickets.
• This does not give a very accurate picture of what proportion of these receipts is likely to be available at least in principle.
• We have therefore assumed (for illustrative purposes and as a basis for discussion) that:– Max. 10 % of the additional receipts generated by a carbon tax on the non‐ETS sectors
would in principle be available (mainly due to recycling);– Max. 50 % of the ETS revenue (with reference to the Directive and other demands on
this source);– Revenue generated by a modest tax on airline tickets would be 100 % available
(because it is relatively simple).
30

Task 2: Financing the Belgian contribution – adjustedquantitative assessment
31
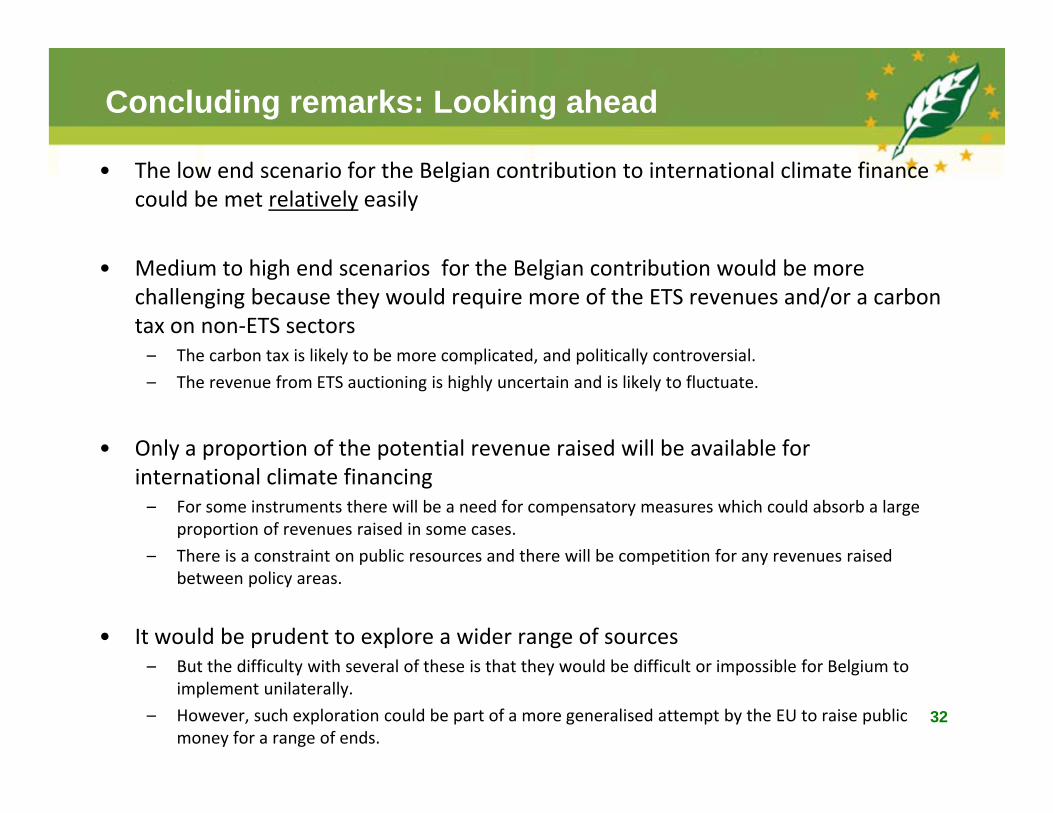
Concluding remarks: Looking ahead
• The low end scenario for the Belgian contribution to international climate finance could be met relatively easily
• Medium to high end scenarios for the Belgian contribution would be more challenging because they would require more of the ETS revenues and/or a carbon tax on non‐ETS sectors– The carbon tax is likely to be more complicated, and politically controversial.– The revenue from ETS auctioning is highly uncertain and is likely to fluctuate.
• Only a proportion of the potential revenue raised will be available for international climate financing– For some instruments there will be a need for compensatory measures which could absorb a large
proportion of revenues raised in some cases.– There is a constraint on public resources and there will be competition for any revenues raised
between policy areas.
• It would be prudent to explore a wider range of sources– But the difficulty with several of these is that they would be difficult or impossible for Belgium to
implement unilaterally. – However, such exploration could be part of a more generalised attempt by the EU to raise public
money for a range of ends.32

33
Thank you
www.ieep.eu
IEEP is an independent not for profit institute dedicated to advancing an environmentally sustainable Europe through
policy analysis, development and dissemination.