final project (0211)
DESCRIPTION
final projects of chevrolet motor suratTRANSCRIPT

CHAPTER 1
INTRODUCTION
1
3.1 INTRODUCTION
What is Customer satisfaction?
Customer:
A customer (also known as a client, buyer, or purchaser) is usually used to refer to a
current or potential buyer or user of the products of an individual or organization,
called the supplier, seller, or vendor. A customer may also be a viewer of the product
or service that is being sold despite deciding not to buy them. The general distinction
between a customer and a client is that a customer purchases products, whereas a
client purchases services.
The word derives from "custom," meaning "habit"; a customer was someone who
frequented a particular shop, who made it a habit to purchase goods of the sort the
shop sold their rather than elsewhere, and with whom the shopkeeper had to maintain
a relationship to keep his or her "custom," meaning expected purchases in the future.
Satisfaction:
“Customer level of approval when comparing a product's perceived performance with
his or her expectations.”
While satisfaction is sometimes equated with performance, it implies compensation or
substitution whereas performance denotes doing what was actually promised.
Customer satisfaction:
Customer satisfaction is a measure of how products and services supplied by a
company meet or surpass customer expectation. Customer satisfaction is defined as
"the number of customers, or percentage of total customers, whose reported
experience with a firm, its products, or its services (ratings) exceeds specified
satisfaction goals.
2

3.2 PURPOSE
Customer satisfaction surveys
Customer satisfaction surveys are usually purpose designed to suit our clients
requirements. Typically surveys will include measurement of the importance versus
performance of aspects of service delivery and establish the level of commitment of
customers. Analysis can reveal factors affecting switching and thresholds when this
occurs. A major output is to identify priority areas for reducing customer
dissatisfaction.
Lost customer surveys
Dedicated lost customer surveys concentrate on a segment of customers that some
companies forget to research - those that have already 'walked'. Sometimes the most
revealing answers about service quality or perceptions of service quality come from
research with these ex-customers. A number of techniques can be used here, both
qualitative and quantitative.
A business ideally is continually seeking feedback to improve customer satisfaction.
Customer satisfaction provides a leading indicator of consumer purchase intentions
and loyalty.
3.3 Measuring customer satisfaction:
Customer satisfaction is measured at the individual level, but it is almost always
reported at an aggregate level. It can be, and often is, measured along various
dimensions. A hotel, for example, might ask customers to rate their experience with
its front desk and check-in service, with the room, with the amenities in the room,
with the restaurants, and so on. Additionally, in a holistic sense, the hotel might ask
about overall satisfaction “with your stay.”
The usual measures of customer satisfaction involve a survey with a set of statements
using a Liker Technique or scale. The customer is asked to evaluate each statement
and in term of their perception and expectation of performance of the organization
being measured.
3
Their satisfaction is generally measured on a five-point scale.
Regardless of the scale used, the objective is to measure customers’ perceived
satisfaction with their experience of a firm’s offerings.
Good quality measures need to have high satisfaction loadings, good reliability, and
low error variances. It seems that dependent on a trade-off between length of the
questionnaire and quality of satisfaction measure, these scales seem to be good
options for measuring customer satisfaction in academic and applied studies research
alike. All other measures tested consistently performed worse than the top three
measures, and/or their performance varied significantly across the two service
contexts in their study. These results suggest that more careful pretesting would be
prudent should these measures be used. Finally, all measures captured both affective
and cognitive aspects of satisfaction, independent of their scale anchors. On the other
hand, cognitive element is defined as an appraisal or conclusion on how the product’s
performance compared against expectations.
3.4 Why customer is important?
Customers are the most important people for any organization. They are the resource
upon which the success of the business depends. When thinking about the importance
of customers it is useful to remember the following points:
1. Repeat business is the backbone of selling. It helps to provide revenue and certainty
for the business
2. Organizations’ are dependent upon their customers. If they do not develop
customer loyalty and satisfaction, they could lose their customers.
3. Without customers the organization would not exist.
4. The purpose of the organization is to fulfill the needs of the customers.
5. The customer makes it possible to achieve business aims.
4

3.5 What is his imp in today’s economy?
1. Some years ago I read about a gentleman who was flying alongside a member of
the Wrigley family. "I like your gum," he said, "But why do you do so much
advertising? Everybody already buys it."
2. I think it's important for businesses who want to expand and increase their audience
reach.
3. It is used to set your product apart from the rest and define its application to
customers.
5
CHAPTER-2
CONCEPTUAL FRAMEWORK
6
1.1 INTRODUCTION OF AUTOMOBILE INDUSTRY
In Automobile industry there are many companies in India. The Automotive industry
in India is one of the largest in the world and one of the fastest growing globally.
India manufactures over 17.5 million vehicles (including 2 wheeled and 4 wheeled)
and exports about 2.33 million every year. It is the world's second largest
manufacturer of motorcycles, with annual sales exceeding 8.5 million in 2009.India's
passenger car and commercial vehicle manufacturing industry is the seventh largest in
the world, with an annual production of more than 3.7 million units in 2010.
According to recent report, India is set to overtake Brazil to become the sixth
largest passenger vehicle producer in the world, growing 16-18 percent to sell around
three million units in the course of 2011-12. In 2009, India emerged as Asia's fourth
largest exporter of passenger cars, behind Japan, South Korea, and Thailand.
Many more companies in India and that are likes; Chevrolet, Skoda, Maruti Suzuki,
Tata Motors, Ford, Audi, BMW, Toyota, Hyundai, Mahindra & Mahindra co. , Fiat
and so many. Interestingly, the level of trade exports in this sector in India has been
medium and imports have been low. However, this is rapidly changing and both
exports and imports are increasing. The demand determinants of the industry are
factors like affordability, product innovation, infrastructure and price of fuel. Also,
the basis of competition in the sector is high and increasing, and its life cycle stage is
growth. With a rapidly growing middle class, all the advantages of this sector in India
are yet to be leveraged. The level of technology change in the Motor vehicle Industry
has been high but, the rate of change in technology has been medium. Investment in
the technology by the producers has been high. System-suppliers of integrated
components and sub-systems have become the order of the day. However, further
investment in new technologies will help the industry be more competitive. Over the
past few years, the industry has been volatile. Currently, India’s increasing per capita
disposable income which is expected to rise by 106% by 2015 and growth in exports
is playing a major role in the rise and competitiveness of the industry. Consumers are
very important of the survival of the Motor Vehicle manufacturing industry. In 2008-
09, customer sentiment dropped, which burned on the augmentation in demand of
cars. Steel is the major input used by manufacturers and the rise in price of steel is
putting a cost pressure on manufacturers and cost is getting transferred to the end
7

consumer. The price of oil and petrol affect the driving habits of consumers and the
type of car they buy. The key to success in the industry is to improve labour
productivity, labour flexibility, and capital efficiency. Having quality manpower,
infrastructure improvements, and raw material availability also play a major role.
Access to latest and most efficient technology and techniques will bring competitive
advantage to the major players. Utilizing manufacturing plants to optimum level and
understanding implications from the government policies are the essentials in the
Automotive Industry of India.
Both, Industry and Indian Government are obligated to intervene the Indian
Automotive industry. The Indian government should facilitate infrastructure creation,
create favorable and predictable business environment, attract investment and
promote research and development. The role of Industry will primarily be in
designing and manufacturing products of world-class quality establishing cost
competitiveness and improving productivity in labour and in capital. With a combined
effort, the Indian Automotive industry will emerge as the destination of choice in the
world for design and manufacturing of automobiles.
1.2 HISTORY OF AUTOMOBILE INDUSTRY
The first car ran on India's roads in 1897. Until the 1930s, cars were imported
directly, but in very small numbers. Embryonic automotive industry emerged in India
in the 1940s. Mahindra & Mahindra was established by two brothers as a trading
company in 1945, and began assembly of Jeep CJ-3A utility vehicles under license
from Willys. The company soon branched out into the manufacture of light
commercial vehicles (LCVs) and agricultural tractors. Following the independence, in
1947, the Government of India and the private sector launched efforts to create an
automotive component manufacturing. Industry to supply to the automobile industry.
However, the growth was relatively slow in the 1950s and 1960s due to
nationalization and the license raj which hampered the Indian private sector. After
1970, the automotive industry started to grow, but the growth was mainly driven by
tractors, commercial vehicles and scooters. Cars were still a major luxury. Japanese
manufacturers entered the Indian market ultimately leading to the establishment of
Maruti Udyog. A number of foreign firms initiated joint ventures with Indian
companies. In the 1980s, a number of Japanese manufacturers launched joint-ventures
8

for building motorcycles and light commercial-vehicles. It was at this time that the
Indian government chose Suzuki for its joint-venture to manufacture small cars.
Following the economic liberalization in 1991 and the gradual weakening of the
license raj, a number of Indian and multi-national car companies launched operations.
Since then, automotive component and automobile manufacturing growth has
accelerated to meet domestic and export demands. Economic liberalization in India in
1991, the Indian automotive industry has demonstrated sustained growth as a result of
increased competitiveness and relaxed restrictions. Several Indian automobile
manufacturers such as Tata Motors, Maruti Suzuki and Mahindra and Mahindra,
expanded their domestic and international operations. India's robust economic growth
led to the further expansion of its domestic automobile market which has attracted
significant India-specific investment by multinational automobile manufacturers. In
February 2009, monthly sales of passenger cars in India exceeded 100,000 units and
have since grown rapidly to a record monthly high of 182,992 units in October 2009.
From 2003 to 2010, car sales in India have progressed at a CAGR of 13.7%, and with
only 10% of Indian households owning a car in 2009 whereas this figure reaches 80%
in.
1.3 EVENTS AND MILESTONES
A behind- the- scenes look into the making of one of India's most vibrant industries.
The landmarks along the way...
1928- The first imported car was seen on Indian roads
1942- Hindustan Motors incorporated
1944- Premier automobiles started
1948- First car manufactured in India
1953- The Government of India decreed that only those firms which have a
manufacturing program should be allowed to operate
1955- Only seven firms, namely, HM, API, ALL, SMPIL, PAL, M& M and TELCO
received approval.
9
1960 - 1970 - The two, three wheeler industry established a foothold in the Indian
scenario.
1970 - 1980 - Not much change was witnessed during this period. The major factors
affecting the industry were the implementation of the MRTP Act (Monopolies and
Trade Restrictive Practices Act), FERA (Foreign Exchange Regulation Act) and the
Oil Shock of 1973 and 1979.
1980 - 1990 - The first phase of liberalization was announced by the Govt. -With the
liberalization of the Government's protectionist policies, the advantages hitherto
enjoyed by the Indian car manufacturers like monopoly, oligopoly, slowly began to
disappear. This period is also marked by the entry of a large number of firms in the
market. 4 Japanese manufacturers entered the Commercial Vehicle and Two- Wheeler
market. The Government agreed to the demand for allowing foreign collaboration in
the automobile sector. The industry witnessed resurgence due to major policy changes
like relaxation in MRTP and FERA, delicensing of some ancillary products, broad
banding of the products and modification in the licensing policy.
1991 - Under the Govt.'s new National Industrial Policy, the license raj was dispensed
with, and the automobile industries were allowed to expand freely.
1997 - The National Highway Policy was announced which will hopefully have a
positive impact on the automobile industry. The Government also laid down the
emission standards to be met by car manufacturers in India in the coming millennium.
There were two successively stringent emission levels to be met by April 2000 and
April 2005, respectively. These norms were benchmarked on the basis of those
already adopted in Europe, hence the names Euro I (equivalent to India 2000) and the
Indian equivalent of Euro II.
1999 - The Humble Supreme Court passed an order directing all car manufacturers to
comply with Euro I emission norms (India 2000 norms) by the 1st of May, 1999 in
National Capital Region(NCR) of Delhi. The deadline was later extended to 1st June,
1999.
10

11
Auto mobiles logos

COMPANY PROFILE
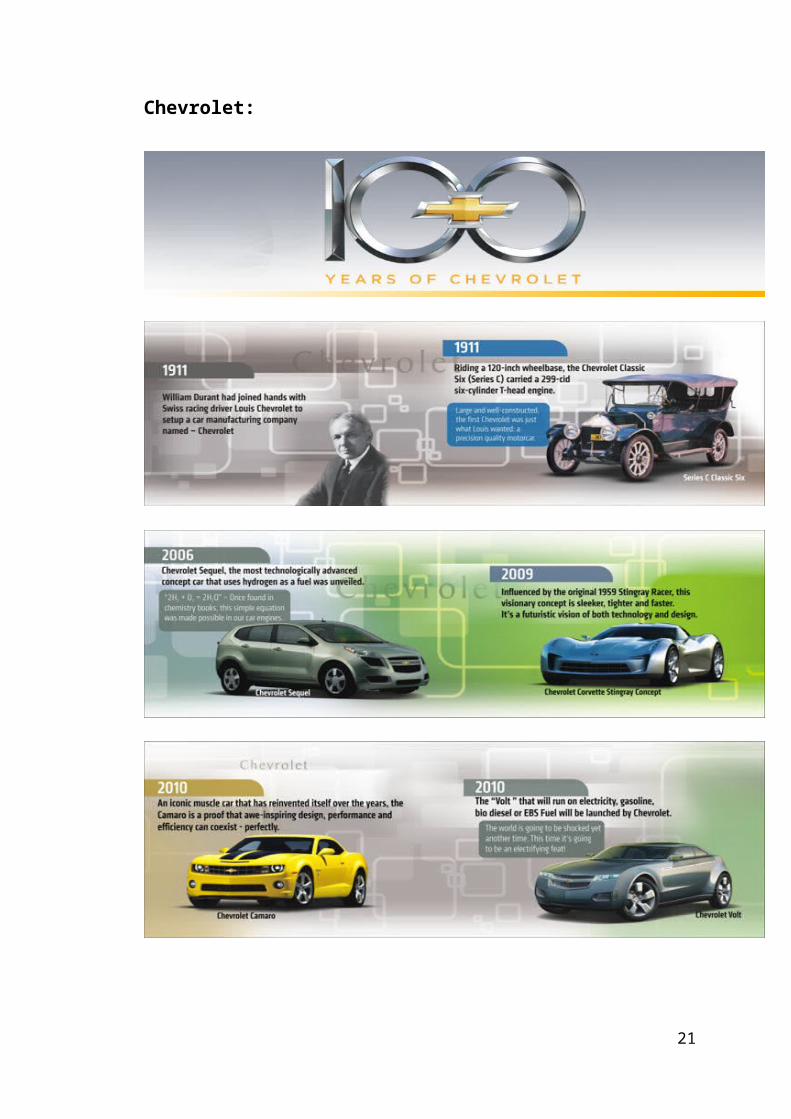
2.1 HISTORY OF CHEVROLET
In 1911, Chevrolet Motor Company of Michigan is incorporated in November of
1911 by Louis Chevrolet, William Little and Edwin Cambell, William Durant’s son-
in-law. On September 13, 1915, Durant incorporation Chevrolet Motor Co. of
Delaware. The new corporation the original Chevrolet Motor Company and becomes
a holding company for auto companies Durant had put together after losing control of
GM. In 1918, general Motors buys the operating assets of Chevrolet Motor Company
in May. In 1924, William S. Knudsen becomes president of Chevrolet and joins the
GM Board of Directors. In 1929, Chevrolet introduces its new six-cylinder engine for
use in commercial vehicles. This engine is nick named ‘the iron wonder’ for its
remarkable durability. In 1953, Chevrolet Corvette is introduced. It is first
transmission, becoming the first competitor in the low-price field to offer fully
automatic shifting. In 1958, Chevrolet introduces the EI Camino, designed to combine
big car comfort with utility of pickup truck, as a1959 model.
In 1959, Chevrolet introduces the Corvair. As part of the 1962 model year, Chevrolet
introduces a new line of smaller cars, the Chevy II. In 1962, The U.S. Department of
Justice, Antitrust Division, charges GM and three Chevrolet dealer trade associations
in criminal and civil suits for violation of the Sherman Act by restricting sales of
Chevrolets in the Los Angeles area through discount houses. In 1966, the U.S. District
Court for Southern California enters the final judgment enjoining GM from
conspiring with any group or association of Chevrolet dealers to limit sales by such
dealers or through discount houses or referral services.
In 1963, Chevrolet introduces its midsize Malibu as a 1964 model. In 1966, Chevrolet
introduces the F-body Camaro as a 1967 model. The following January, Pontiac
introduces the Firebird, its third line of cars, as a 1967 model. In 1968, Six passenger
car and truck assembly plants previously operated by Fisher Body and Chevrolet
12

Motor Division are transferred to the management of GM Assembly Division. In
1975, Chevrolet introduces the Chevette in October. This U.S.-built T-car was first
designed by Opel and is also manufactured by GM subsidiaries in Argentina, Brazil
and England and sold under the names Kadett, Chevette, Gemini and K-180. In 1976,
GM introduces its downsized Chevrolet, Pontiac, Oldsmobile, Buick and Cadillac
full-size and luxury cars in September. In 1979, GM introduces newly designed front-
wheel-drive compact cars, the Buick Skylark, Chevrolet Citation, Oldsmobile Omega
and Pontiac Phoenix X-body models.
In 1983, GM and Toyota Motor Corporation agree to form a joint venture, New
United Motor Manufacturing, Inc. (NUMMI), to produce a small Chevrolet
automobile in the Fremont, Calif., assembly plant previously operated by GM. The
1984 Chevrolet introduces its Geo line of small vehicle with Geo Metro, Spectrum
and Tracker.
In 2001, the Chevrolet Cruze is launched in Japan. Developed by GM and its alliance
partner Suzuki, the cruze is the first GM vehicle to be built in Japan since the
1930s,.General Motors announces that itd Ste. Therese, Quebec plant, which builds
the Chevrolet Camaro and Ponatic Firebird, will close in September 2002 in
conjunction with discontinuation of the camaro and Firebird models. In 2002, the
Chevrolet Corvette celebrates its fiftieth anniversary. The Chevrolet Corvette
celebrates its fiftieth anniversary with a caravan of 5,000 Corvette driven by owners
from each of the 50 states converging at the National Corvette Museum Bowling
Green,Ky. In 2004, for a record sixth time, Chevrolet Corvette is picked as the official
pace car the classic Indianapolis 500 race.100 years of Chevrolet style and innovation.
2.2 MARKETING MIX
The Marketing mix includes factors such as Price , Place , Product and Promotions.
The combination of these 4 factors creates a successful product marketing strategy
which can maximize a company 's investments in the product . Each of these factors
works with respect to the other and if there are deficiencies in any one of the factors
then the product is highly unlikely to attain its true potential. It has 4 types which are
as follows.
1. Product
13

2. Place
3. Price
4. Promotion
Chevrolet:
14

15
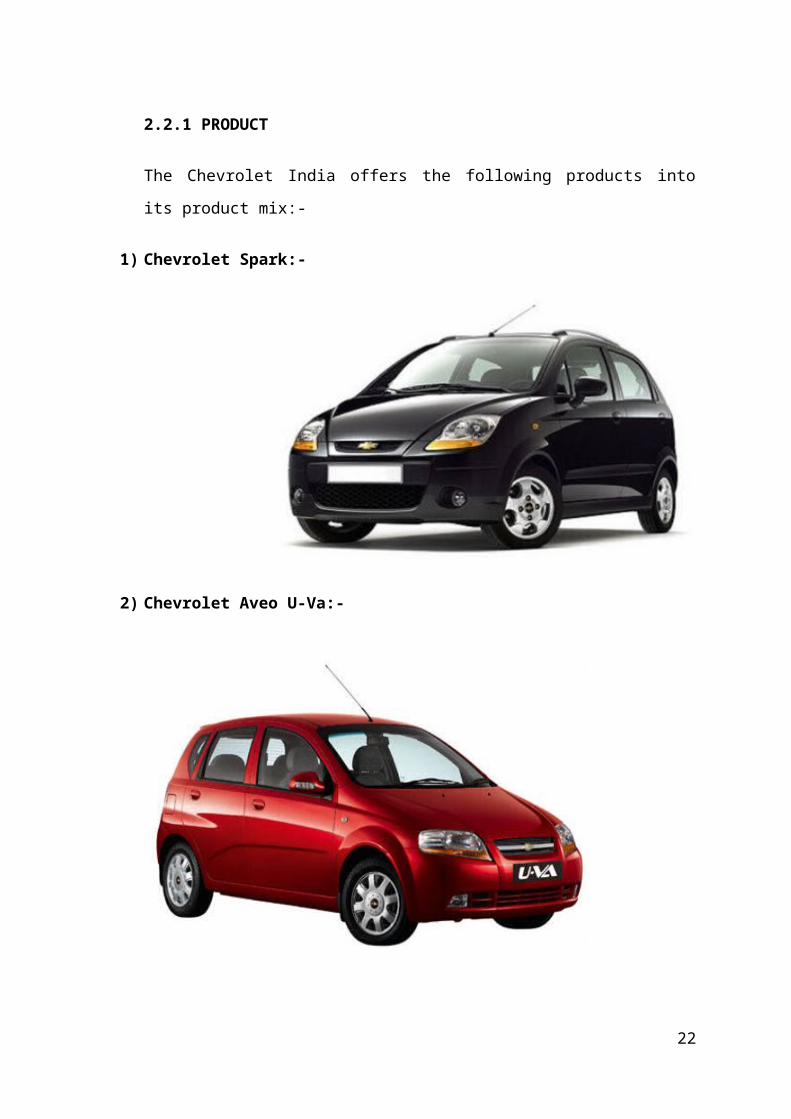
2.2.1 PRODUCT
The Chevrolet India offers the following products into its product mix:-
1) Chevrolet Spark:-
2) Chevrolet Aveo U-Va:-
16
3) Chevrolet Beat:-
4) Chevrolet Aveo:-
17

5) Chevrolet Optra Magnum:-
6) Chevrolet Tavera:-
18
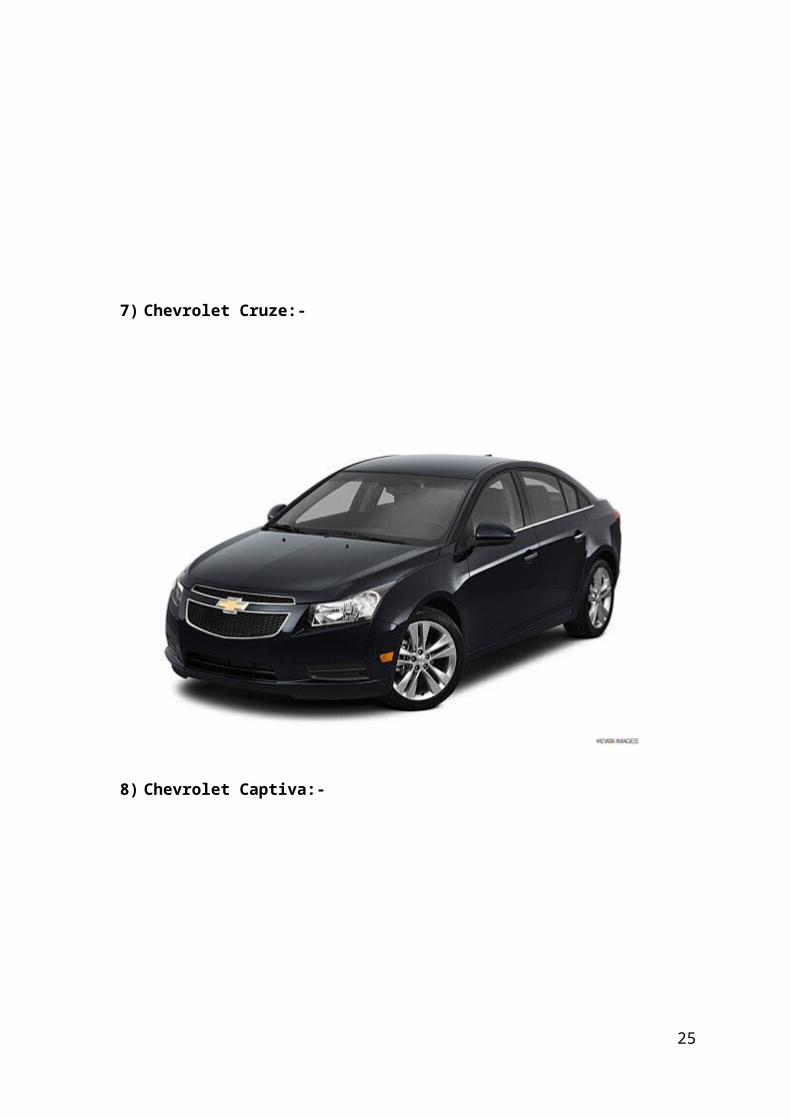
7) Chevrolet Cruze:-
8) Chevrolet Captiva:-
19

2.2.2 PLACE
Chevrolet also known as Chevy, is a brand of vehicle produced by General Motors
Company (GM). Founded by Louis Chevrolet and ousted GM founder William C.
Durant on November 3, 1911. Its headquarters in Detroit, Michigan in US. Chevrolet
came to India in 1928. An office was set up in Bombay with an assembly plant
constructed in Sewers. General Motors (GM), Chevrolet’s parent company, was the
first automobile company to open an assembly plant in India. Chevrolet its
information like a media, its reviews, awards, which are the promises and its tube
about it. also including media gallery. Chevrolet also providing Shopping tools like
wise, Test drive, Price, Dealer locater, Service centre locater, Accessories,
Merchandise also will be including.
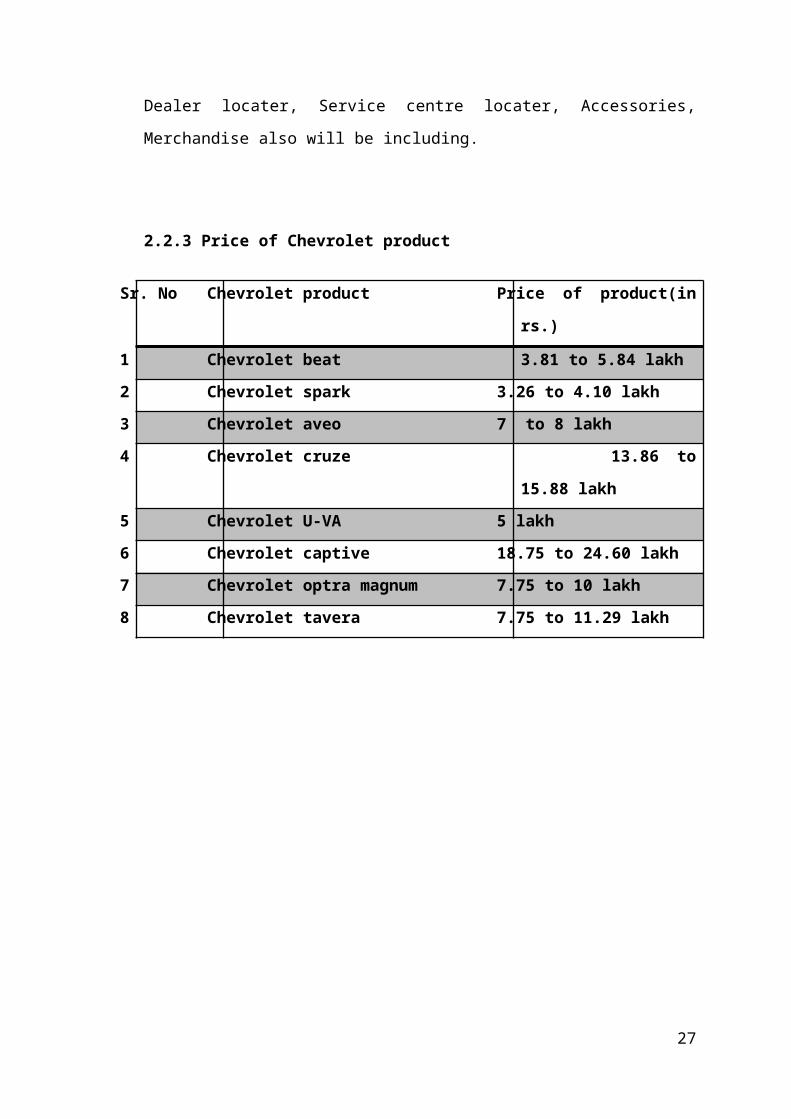
2.2.3 Price of Chevrolet product
Sr. No Chevrolet product Price of product(in rs.)
1 Chevrolet beat 3.81 to 5.84 lakh
2 Chevrolet spark 3.26 to 4.10 lakh
3 Chevrolet aveo 7 to 8 lakh
4 Chevrolet cruze 13.86 to 15.88 lakh
5 Chevrolet U-VA 5 lakh
6 Chevrolet captive 18.75 to 24.60 lakh
7 Chevrolet optra magnum 7.75 to 10 lakh
8 Chevrolet tavera 7.75 to 11.29 lakh
20
2.2.4 PROMOTION
Chevrolet bowtie logo
The Chevrolet bowtie logo was introduced by company co-founder William C. Durant
in late 1913. According to an official company publication titled The Chevrolet Story
of 1961, the logo originated in Durant's imagination when, as a world traveler in
1908, he saw the pattern marching off into infinity as a design on wallpaper in a
French hotel. He tore off a piece of the wallpaper and kept it to show friends, with the
thought that it would make a good nameplate for a car. However, in an interview with
Durant's widow, Catherine published in a 1986 issue of Chevrolet Pro Management
Magazine, Catherine recalled how she and her husband were on holiday in Hot
Springs, Va., in 1912. While reading a newspaper in their hotel room, Durant spotted
a design and exclaimed, "I think this would be a very good emblem for the
Chevrolet." Unfortunately, at the time, Mrs. Durant didn't clarify what the motif was
or how it was used. Ken Kaufmann, historian and editor of The Chevrolet Review,
discovered in a Nov. 12, 1911 edition of The Constitution newspaper, published in
Atlanta, an advertisement appeared from by the Southern Compressed Coal Company
for "Coalettes," a refined fuel product for fires. The Coalettes logo, as published in the
ad, had a slanted bowtie form, very similar to the shape that would soon become the
Chevrolet icon. The date of the paper was just nine days after the incorporation of the
Chevrolet Motor Co. One other explanation attributes the design to a stylized version
of the cross of the Swiss flag. Louis Chevrolet was born in Switzerland at La Chaux-
de-Fonds, Canton of Neuchatel, to French parents, on Christmas Day 1878. An
October 2, 1913 edition of The Washington Post seems, so far, to be the earliest
known example of the symbol being used to advertise the brand. The first bowtie logo
without embedded text first appeared in 1985, as part of the Heartbeat of America ad
campaign. In 2004, Chevrolet began to phase-in the gold bowtie that serves as the
brand identity for all of its cars and trucks marketed globally.
21
100th anniversary
As part of Chevrolet's 100th anniversary in 2011, a dedicated channel was created by
the American internet based Pandora Radio station, playing the Top 100 songs
mentioning the brand. Beginning on November 3, 2011, Chevrolet celebrated the
countdown to its 100th birthday by encouraging its customers and fans to tell their
Chevy stories, vote for their favourite Chevrolet cars and trucks, and take the birthday
party to their communities with the help of Chevrolet and its dealers. A feature-length
documentary titled 'Chevy100, An American Story', produced by Roger Sherman, was
premiered on November 3 at Detroit Institute of Arts in downtown Detroit, features
drivers, collectors, restorers, racers and journalists who live and breathe cars and
trucks. In honor of the 100th birthday of Chevrolet, Indianapolis Motor Speedway,
Chevrolet and Indianapolis businessman David Ring have arranged to properly mark
the grave of Arthur Chevrolet, brother of Chevrolet co-founder Louis Chevrolet.
Chevrolet-only naming attempt
In 2010, a memo signed by Chevrolet sales and service vice president Alan Batey and
General Motors marketing division vice president Jim Campbell was sent to
Chevrolet employees at its Detroit headquarters, instructing employees to only use
Chevrolet when addressing the brand, in order to present a consistent brand message.
A postscript to the memo says a sort of cuss jar - a plastic "Chevy" can - has been
placed in the hallway. "Every time someone uses 'Chevy' rather than Chevrolet," the
note said, the employee is expected to put a quarter in the can. The proceeds were to
be spent on "a team building activity." Paul Worthington, head of strategy for Wolff
Olins, noted that the branding effort ran counter to a trend in which corporate names
had become more casual. Ian Beavis of Nielsen Automotive Group noted that
marketers can't control what consumers call their products, but nickname doesn't work
in new markets where Chevrolet is trying to get a start. Following the release of the
memo, General Motors published a statement claiming the note was in no way
discouraging customers or fans from using the Chevy name. Following the 2010
memo incident, Chevy Runs Deep campaign remains to use the 'Chevy' name, while
Driving Our World Forward campaign uses the 'Chevrolet' name.
22

Watches
In 2007, General Motors allowed AJS-Production SA to register the Louis Chevrolet
trademark for a line of premium quality Swiss watches watch marketed under the
Louis Chevrolet brand name. Although the watches bear the name of Louis Chevrolet,
they are not marketed or produced in association with General Motors. The watch
brand pays tribute to Louis Chevrolet, co-founder of the Chevrolet automobile
company, whose father was a watchmaker and in his childhood helped his father at
the workbench. The collection was called Frontenac, the name inherited from the race
car company founded by Louis Chevrolet. The Chevrolet watch collection comprises
automatic, manually wound and quartz models, equipped with ETA and Ronda
movements. The Louis Chevrolet Frontenac watches, manufactured in Porrentruy, the
Swiss Jura region, feature the styling cues suggested by the Chevrolet cars. The
collection was developed while applying the same materials as used in the car
industry. Pearled appliques on the Chevrolet watches' dials remind the metal forms of
the old dashboards. The number "8", Chevrolet's racing number, is sported on the case
back.
Top 10 Chevrolet sales market in 2013
Rank Location Vehicle sales Market share(%)
1 United States 1,775,812 36.9%
2 Brazil 632,201 13.3%
3 China 595,068 12.5%
4 Russia 173,485 3.6%
5 Mexico 162,461 3.4%
6 Canada 150,540 3.2%
7 Argentina 133,491 2.8%
8 Uzbekistan 121,584 2.6%
9 India 111,056 2.3%
10 Colombia 105,783 2.2%
23

24
2.5 COMPANY PROFILE OF NANAVATI MOTORS
Name of firm Nanavati motors
Situated at Puna-patiya near Zest hotel surat
Year & date of Establishment 16/3/2008
Authorized Dealer of Nanavati Chevrolet Motors
No of Employee At sales department:32
At service deprtment:40
Other Nanavati Firm Nanavati Toyota
Nanavati Hyundai
Nanavati Ashok Leyland
Product Profile Sales & service
25

VISION:-
To be integrated player “Automobiles” with leadership.
Position in Dealer of General motors and quality of services.
Competitors of Nanavati Chevrolet Motors:
Empire Motors:
Authorized Dealer:- Chevrolet Motors
Location:- Piplod, Surat.
Desai Auto:-
Authorized Dealer:- Chevrolet
Location:- Vapi.
26
2.6 Competitors:
Chevrolet Hyundai Skoda Toyota Maruti Suzuki
Spark i10 Fabia Innova Alto
Beat i20 Yeti Corolla A-star
Aveo Accent Laura Fortuner Wagon-R
Optra magnum Santa fe Superb Camry Zen Estilo
Captiva Sonata Land cruiser Kizashi
Cruze Verna Etios Ritz
Tavera Santro Swift
SX4
Gypsy
Eeco
27
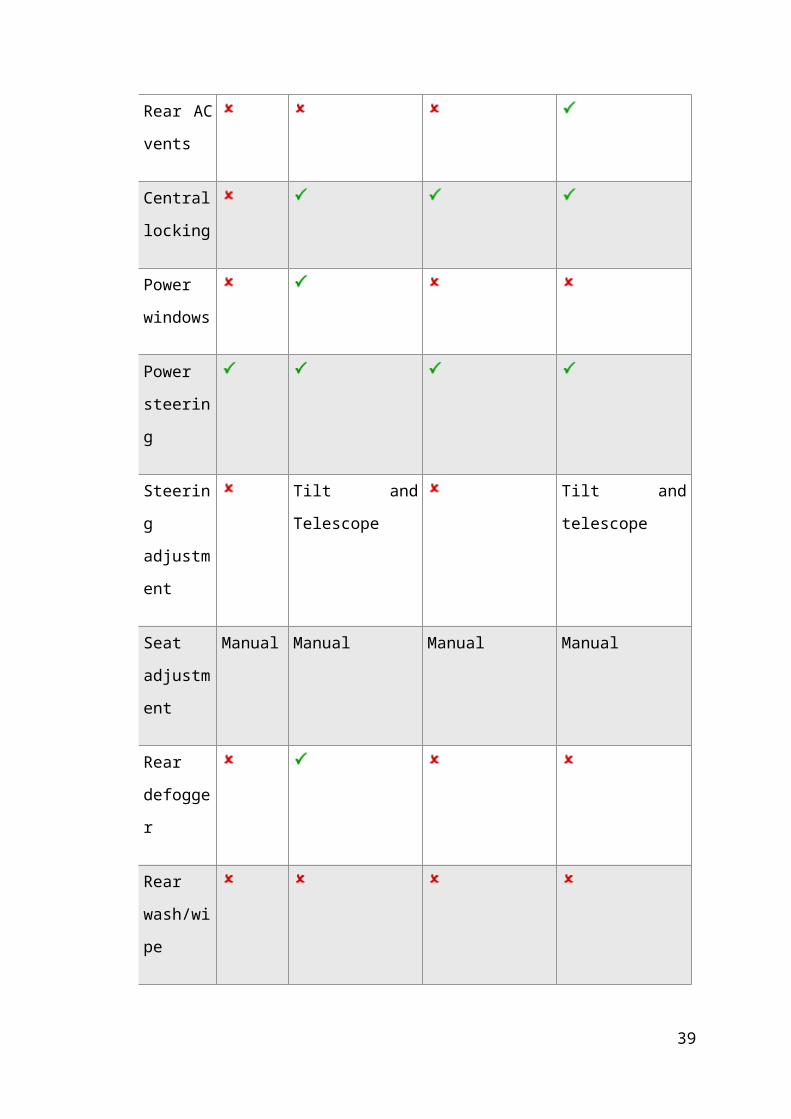
Competitors:
For Features purpose:
1st Car
Chevrolet Spark PS
1.0
2nd Car
Hyundai i20 1.2
Magna
3rd Car
Maruti Suzuki Alto
K10 LXi
4th Car
Skoda Fabia Classic
1.2 MPI
Ex-
Showroo
m Price
Rs.3,40,4
94
Rs.4,94,599 Rs.3,20,357 Rs.4,35,459
Functional
Tachomet
er
Fog lamps Rear
Headlamp
washer
Parking
sensors
Entertainment
28
Audio
system
type
CD
USB
compatibil
ity
No. of
speakers
6
Comfort
AC
Climate
control
Rear AC
vents
Central
locking
Power
windows
Power
steering
Steering Tilt and Telescope Tilt and telescope
29

adjustmen
t
Seat
adjustmen
t
Manual Manual Manual Manual
Rear
defogger
Rear
wash/wipe
Remote
boot
release
Remote
fuel lid
Safety
ABS
Airbags 1
30

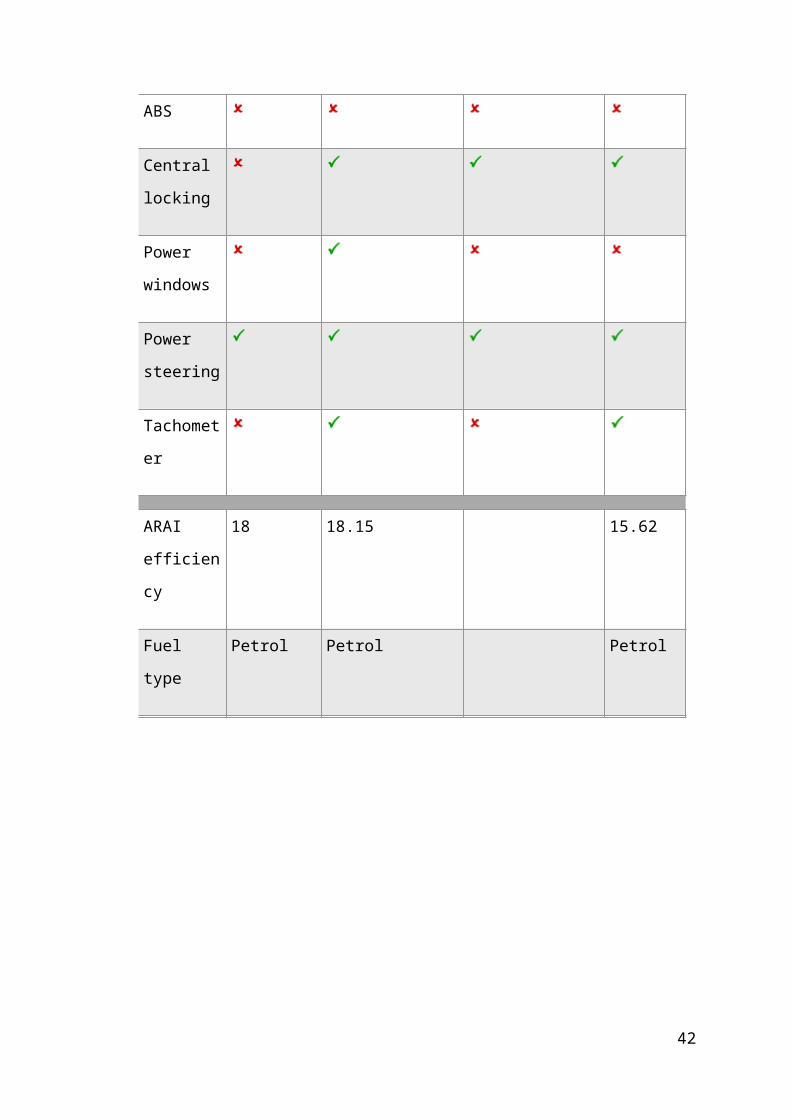
For overview purpose:
1st Car
Chevrolet Spark PS 1.0
2nd Car
Hyundai i20 1.2
Magna
3rd Car
Maruti Suzuki Alto
K10 LXi
4th Car
Skoda Fabia
Classic 1.2
MPI
Ex-
Showroom
Price
Rs.3,40,494 Rs.4,94,599 Rs.3,20,357 Rs.4,35,45
9
Features
AC
Sunroof
Audio
system type
CD
Airbags 1
ABS
Central
locking
31

Power
windows
Power
steering
Tachometer
ARAI
efficiency
18 18.15 15.62
Fuel type Petrol Petrol Petrol
32

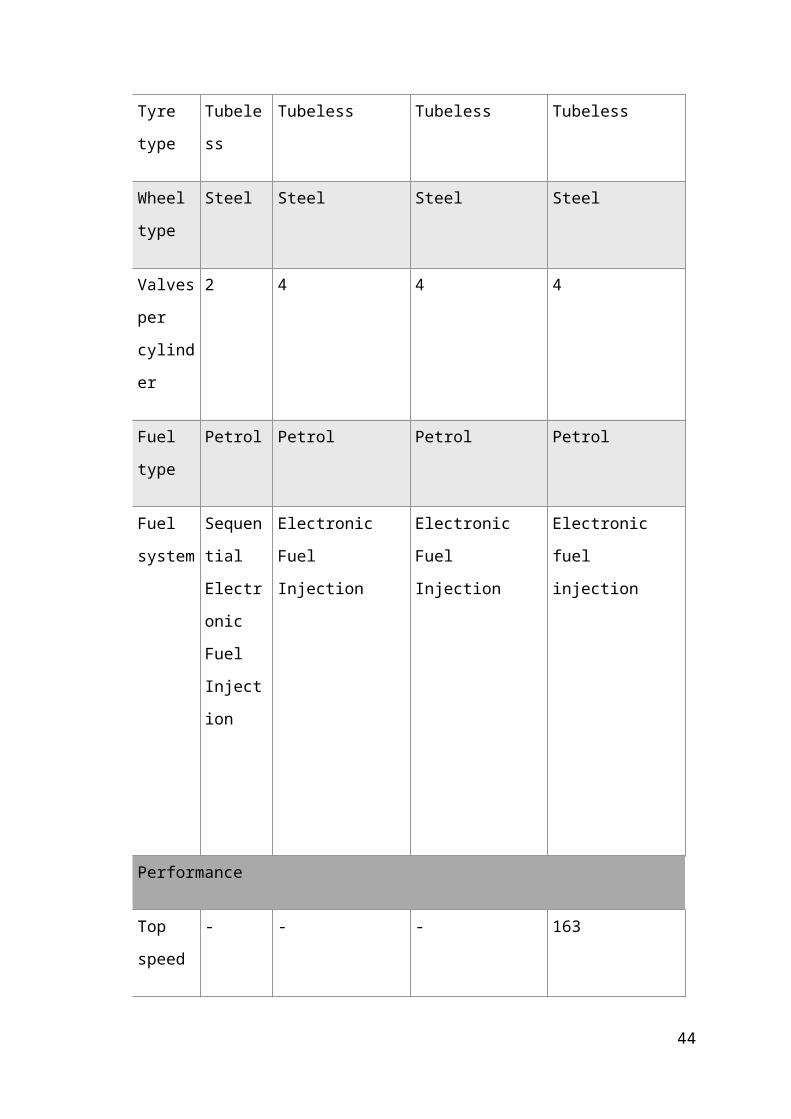
For Tech specs purpose:
1st Car
Chevrolet Spark PS
1.0
Change Vehicle
2nd Car
Hyundai i20 1.2
Magna
3rd Car
Maruti Suzuki Alto
K10 LXi
4th Car
Skoda Fabia Classic
1.2 MPI
Ex-
Showroo
m Price
Rs.3,40,4
94
Rs.4,94,599 Rs.3,20,357 Rs.4,35,459
Wheels
Tyre
size -
front
155/70
R13
175/70 R14 155/65 R13 175/70 R14
Tyre
size -
rear
155/70
R13
175/70 R14 155/65 R13 175/70 R14
Tyre
type
Tubeless Tubeless Tubeless Tubeless
Wheel
type
Steel Steel Steel Steel
Valves 2 4 4 4
33

per
cylinder
Fuel
type
Petrol Petrol Petrol Petrol
Fuel
system
Sequentia
l
Electroni
c Fuel
Injection
Electronic Fuel
Injection
Electronic Fuel
Injection
Electronic fuel
injection
Performance
Top
speed
- - - 163
0-
100kmp
h
- - - -
Capacity
Seating
capacity
5 5 5 5
Fuel
tank
38 45 35 45
Boot 170 295 160 315
34
space
Fuel economy
Highwa
y
- - - -
City - - - -
Overall - - - -
ARAI
efficienc
y
18 18.15 20.2 15.62
Transmission
Type Manual Manual Manual Manual
No. of
gears
5 5 5 5
Final
reductio
n gear
ratio
- - - -
Clutch
type
- - - -
Steering
Type Rack and
Pinion
Rack and Pinion Rack and Pinion,
Power assisted
Rack and pinion,
electric assist
Turning 4.6 4.7 4.6 9.8
35

radius
Brakes
Front Disc
brakes
Disc brakes Disc brakes Ventilated disc
Rear Self
Adjusting
Drum
Drum Drum Drum
Suspension
Front McPhers
on Strut
with Anti
rolls bars
McPherson Strut
with Gas shock
absorber
McPherson Strut
with Torsion Type
Roll Control
Device
McPherson
suspension with
lower triangular
links and torsion
stabilizer
Rear Torsion
Beam
axle
Coupled Torsion
Beam Axle with
Gas shock absorber
Coil Spring Gas-
Filled Shock
Absorbers with
Three- Link Rigid
Axle and Isolated
Trailing Arms
Compound-link
crank axle
36

Chapter: 3
Research Methodology
37

4.1 MEANING OF RESEARCH:
Research in common parlance refers to a search for knowledge. One can also define
research as a scientific and systematic search for pertinent information on a specific
topic. In fact, research is an art of scientific investigation. The advanced learner’s
dictionary of Current English lays down thy meaning of the research as:
“A careful investigation or inquiry especially through search for new facts in any
branch of knowledge”
Redman and Mory define the research as “A systematized effort to gain new
knowledge”
“Research comprises defining and redefining problems, formulating hypothesis or
suggested solutions; collecting, organizing, evaluating date; making deductions and
researching conclusions.”
4.2 MARKETING RESEARCH:
“Marketing research means the systematic gathering, recording, analyzing of data
about problems relating to the marketing of goods and services”
Marketing research has proved an essential tool to make all the need of marketing
management. Marketing research therefore is the scientific process of gathering and
analyzing of marketing information to meet the needs of marketing management.
But gathering of observation is must be systematic. The systematic conduct of
research requires:
Orderliness, in which the measurements should be accurate. Impartiality in analysis
and interpretation.
4.3 OBJECTIVE OF THE STUDY
To study to know the perception of customers and thereby increase the sales and
market share of nanavati motors sales and service.
To know the satisfaction level of present customer.
To study the impact of media on the customer.
To know the various sources through which customer largely avail finance for the
purchase of vehicle.
To know the satisfaction of the present customers regarding the after sales service.
38
4.4 BENEFITS OF STUDY
From this research firm will come to know the perception of customers.
Through which source of finance customers purchase the vehicle.
Through which source of media customers get more aware about product.
The firm will know customer are satisfied or not regarding sales service
THE RESEARCH PROCESS
39
IDENTIFY & FORMULATE THE PROBLEM
CHOOSE THE RESEARCH DESIGN
DETERMINE SOURCES OF DATA & METHOD OF COLLECTION
ORGANISING AND CONDUCTING A FIELD SURVEY
DESIGN THE DATA COLLECTION INSTRUMENTS
DETERMINE THE SAMPLE SIZE & SAMPLE DESIGN
EDITING, TABULATION, CLASSIFICATION & CODING OF DATA
PROCESSING & ANALYSIS OF DATA
PREPARATION OF RESEARCH REPORT
CONCLUSION AND SUGGESTION & ACTION

4.5.1 PROBLEM STATEMENT:
The first step in research is formulating a research problem. It is most important stage
in applied research as poorly defined problems will not yield useful results. It is
rightly said that “a problem is the half-solved”.
“A research problem, in general, refers to some difficulty which a researcher
experiences in the context of either a theoretical or practical situation and wants to
obtain a solution for the same.”
We can, state the components of the research problem as under:
[1] There must be an individual or a group which has some difficulty or the problem.
[2] There must be some objectives to be attained at. If one wants nothing, one cannot
have a problem.
[3] There must be alternative means (or the courses of action) for obtaining the
objective one wish to attain. This means that there must be at least two means
available to a researcher for if he has no choice of means, he cannot have a problem.
PROBLEM IDENTIFIED:
To know about the satisfaction level of a Chevrolet motors owner who has purchased
from nanavati motors sales and services.
Which promotional tools should be used, to get maximum response from customers
for Chevrolet motors?
4.5.2 RESEARCH DESIGN:
It is an overall framework of project that indicates what information to be collected
from which sources and by which procedures. It is also the plan, structure, and
strategy of investigation conceived so as to obtain answers to research questions and
to control variance.
The research design can be classified in to true broad categories:
(A) Exploratory.
(B) Descriptive
(C) Causal.
40

Exploratory research is focus on the discovery of ideas. Exploratory research is
carried out to define problems and developed hypotheses to test letter. An exploratory
study is generally based on secondary data that are reading available. It does not have
to change his focus of direction, depending on the availability of new ideas and
relationship among variables.
Descriptive studies are undertaken is many circumstances. Descriptive studies can be
complex, determining high degree of scientific skill on the part of the researcher.
Causal research helps in determined cause and effect relationship between two or
more variables.
Descriptive studies:
In this project, Descriptive design will be used because it describes the phenomena
under study and recommendations / findings are specific under this study. Descriptive
studies are undertaken in many circumstances. When the researcher is interested in
knowing the characteristics of certain group such as age, sex, educational level,
occupation or income, a descriptive study may be necessary.
Other cases when a descriptive study could be taken up are when he is interested in
knowing the proportion of people in a given population who have behave in a
particular manner, making projections of a certain thing: or determining the
relationship between two of more variables. The objective of such studies is to answer
the, who, what, when, where, and way of the subject under investigation.
Descriptive studies can be complex, demanding a high degree of scientific skill on the
part of the researcher. Descriptive studies can be divided into two broad categories
cross-sectional and longitudinal. Researcher frequently uses them.
4.5.3 DATA COLLECTION:
1. Secondary Data:
Secondary data will be collected from many sources like company’s website and
magazines.
2. Primary Data:
Utilizing the information from the Secondary data, questionnaire will be prepared to
study the investors’ behavior. Primary data will be collected directly from the
respondents to solve the current problem.
41
Research Approach:
Survey method will be adopted to gather the primary data. This survey include face-
to-face filling up of the questionnaires and interviews of the respondents.
Research Instrument:
The most effective research instrument for data collection is questionnaire, for this
study the structured questionnaire will be used. This questionnaire will be
administered through face-to-face interviews.
4.5.4 SAMPLING METHOD:
There are two type of Sampling Process.
A) Probability Sampling Method.
B) Non- Probability Sampling Method.
(A) Probability sampling method.
(1) Simple random sampling.
(2) Systematic random sampling.
(3) Stratified random sampling.
(4) Clustered random sampling.
(5) Area random sampling.
(6) Multi phase random sampling.
(7) Replicated random sampling.
(B) Non- Probability sampling method.
(1) Convenience sampling.
(2) Purposive/judgment sampling
(3) Quota Sampling.
(4) Snow ball sampling.
42

The researcher use NON - PROBABILITY METHOD for the purpose of the study
CONVENIENCE SAMPLING was used.
4.5.5 RESEARCH TOOL:
The most effective research tool for data collection is questionnaire, for this study the
structured questionnaire will be used. This questionnaire will be administered through
face-to-face interviews.
4.5.6 SAMPLING DESIGN:-
Defining the target population
Element: Present customers of Chevrolet motors Sales & Service
Sampling unit: Present customers
Extent: Puna patiya, surat
4.5.7 SAMPLE SIZE:-
Considering the time constraints, I would like to go for survey of 120 respondents.
43
CHAPTER 3
DATA ANALYSIS AND
PRESENTATION
44

1. Which CHEVROLET Motors do you own?
Purpose: This question will ensure the average amount of vehicles a customer of
Chevrolet motors owns.
TABLE 5.1: Frequency distribution of purchase of Chevrolet motors
Models Frequency
Spark 42
Aveo uva 9
Optra magnum 12
Captiva 5
Beat 22
Aveo 10
Tavera 20
Total 120
FIGURE 5.1: Percentage distribution of purchase of Chevrolet motors
35%
8%
10%4%
18%
8%
17%
sparkaveo-U-VAOptra magnumCaptivaBeatAveoTravera neo-2
Interpretation:
Out of 120 respondents, 42 of them own Spark motors. A minimum of 5 respondents
own Captiva motors customers they own.
45

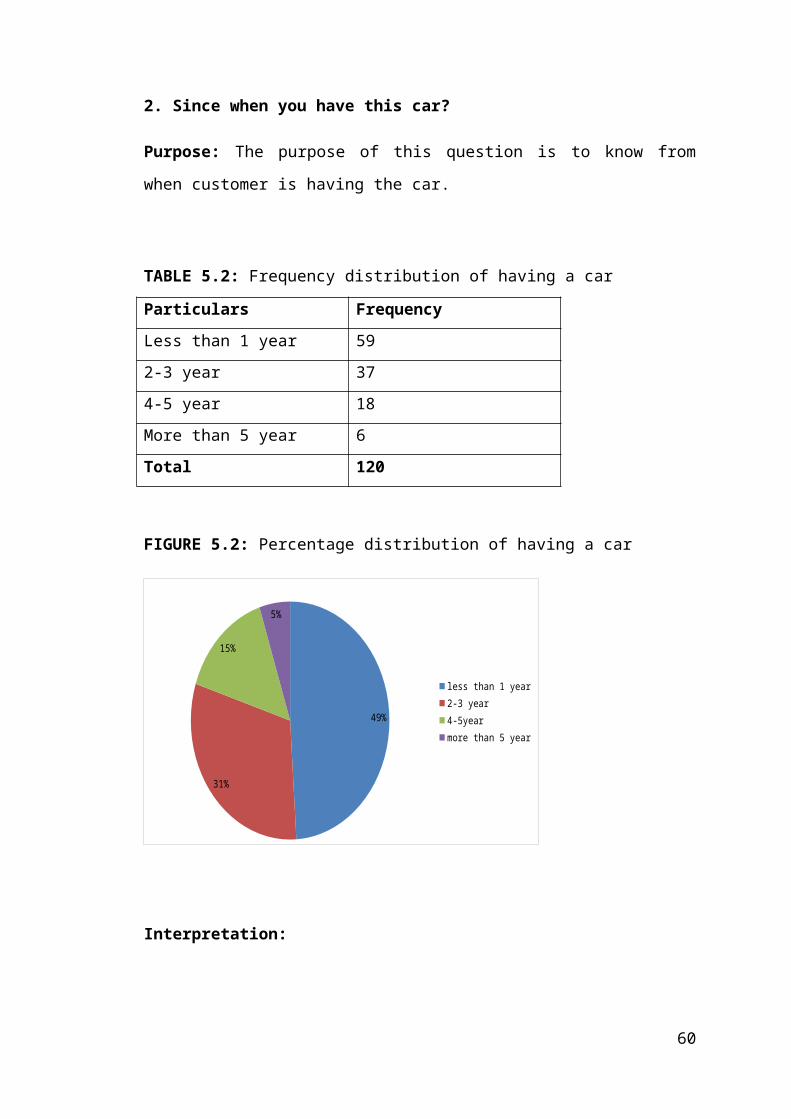
2. Since when you have this car?
Purpose: The purpose of this question is to know from when customer is having the
car.
TABLE 5.2: Frequency distribution of having a car
Particulars Frequency
Less than 1 year 59
2-3 year 37
4-5 year 18
More than 5 year 6
Total 120
FIGURE 5.2: Percentage distribution of having a car
Interpretation:
Out of 120 respondents, 49% customers have purchase a car in last 1 year.
46
49%
31%
15%
5%
less than 1 year2-3 year4-5yearmore than 5 year

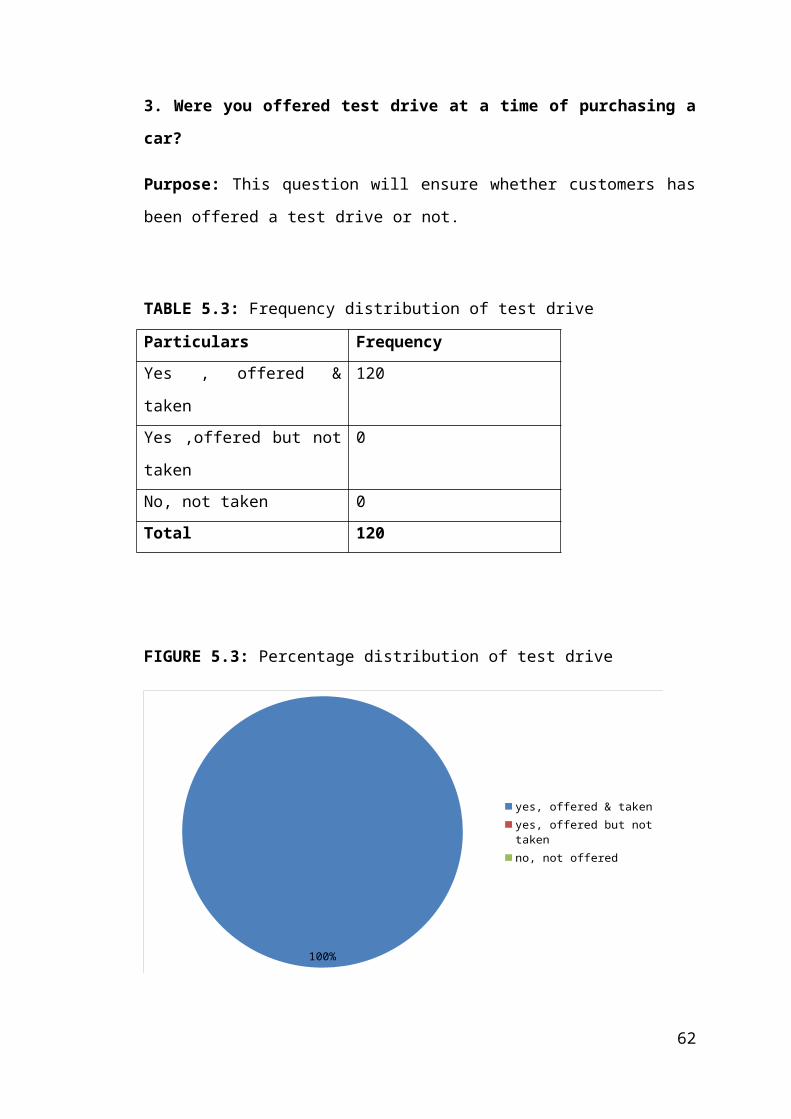
3. Were you offered test drive at a time of purchasing a car?
Purpose: This question will ensure whether customers has been offered a test drive or
not.
TABLE 5.3: Frequency distribution of test drive
Particulars Frequency
Yes , offered & taken 120
Yes ,offered but not taken 0
No, not taken 0
Total 120
FIGURE 5.3: Percentage distribution of test drive
100%
yes, offered & takenyes, offered but not takenno, not offered
Interpretation:
Out of 120 respondents, all customers offered a test drive and taken it by
NANAVATI Chevrolet showroom.
47

4. Overall, how would you rate the thoroughness of your test drive?
Purpose: This question will ensure the customer about test drive of Chevrolet motors.
TABLE 5.4: Frequency distribution of rating of test drive
Particulars Frequency
Very good 26
Good 59
Average 35
Bad 0
Very Bad 0
Total 120
FIGURE 5.4: Percentage distribution of rating of test drive
22%
49%
29%
v. goodgoodavg.badv. bad
Interpretation:
Out of 120 respondents, maximum 59 customers would like good rate the
thoroughness of test drive.
48
5. From which media did you come to know about the vehicle?
Purpose: This question determines through which media the customer came to know
about the vehicle.
TABLE 5.5: Frequency distribution of media use
Particulars Frequency
Auto fair 6
Magazines 7
Pamphlets 10
Demo 15
Souvenirs 8
Telephone enquiry 6
Newspapers 16
Friends & relatives 37
Others 15
Total 120
FIGURE 5.5: Percentage distribution of media use
5%6%
8%
13%
7%
5%
13%
31%
12%
auto fairmagazinespamphletsdemosouvenirstelephone inquirynewspapersfriends & relativesothers
Interpretation:
The total respondents of 120 customers max. Customer comes to know from their
friends and relatives about the vehicle.
49

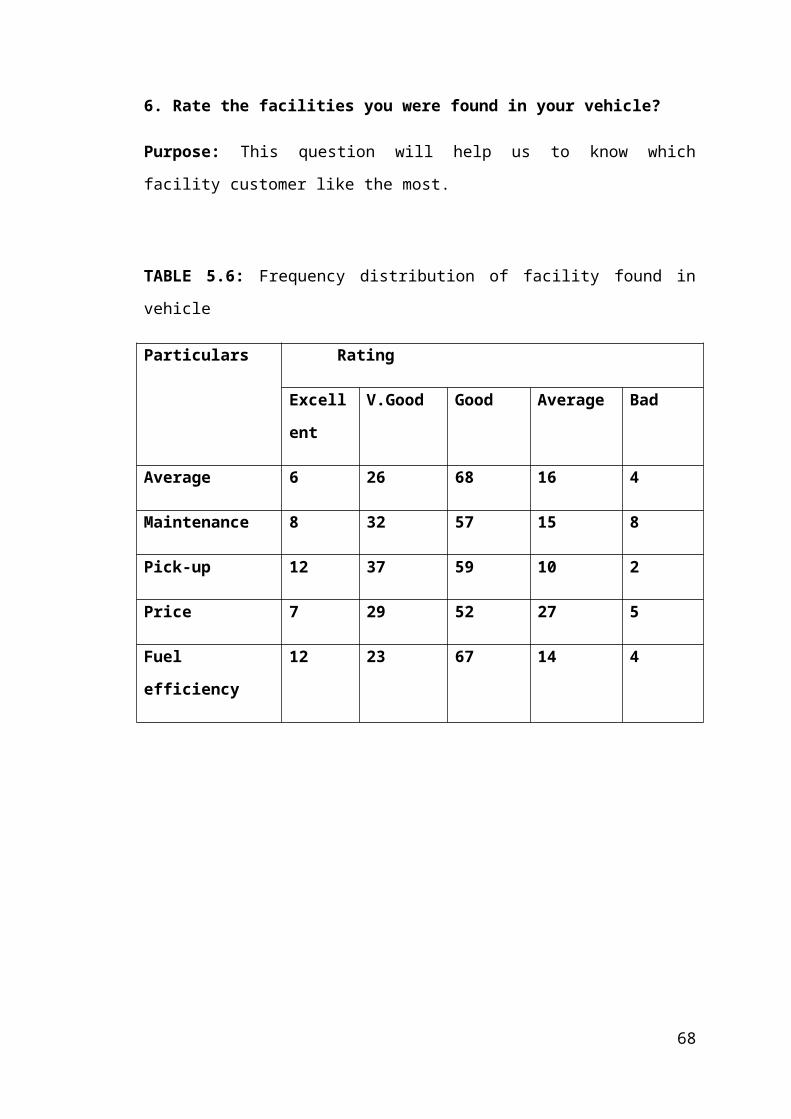
6. Rate the facilities you were found in your vehicle?
Purpose: This question will help us to know which facility customer like the most.
TABLE 5.6: Frequency distribution of facility found in vehicle
Particulars Rating
Excellen
t
V.Good Good Average Bad
Average 6 26 68 16 4
Maintenance 8 32 57 15 8
Pick-up 12 37 59 10 2
Price 7 29 52 27 5
Fuel efficiency 12 23 67 14 4
50

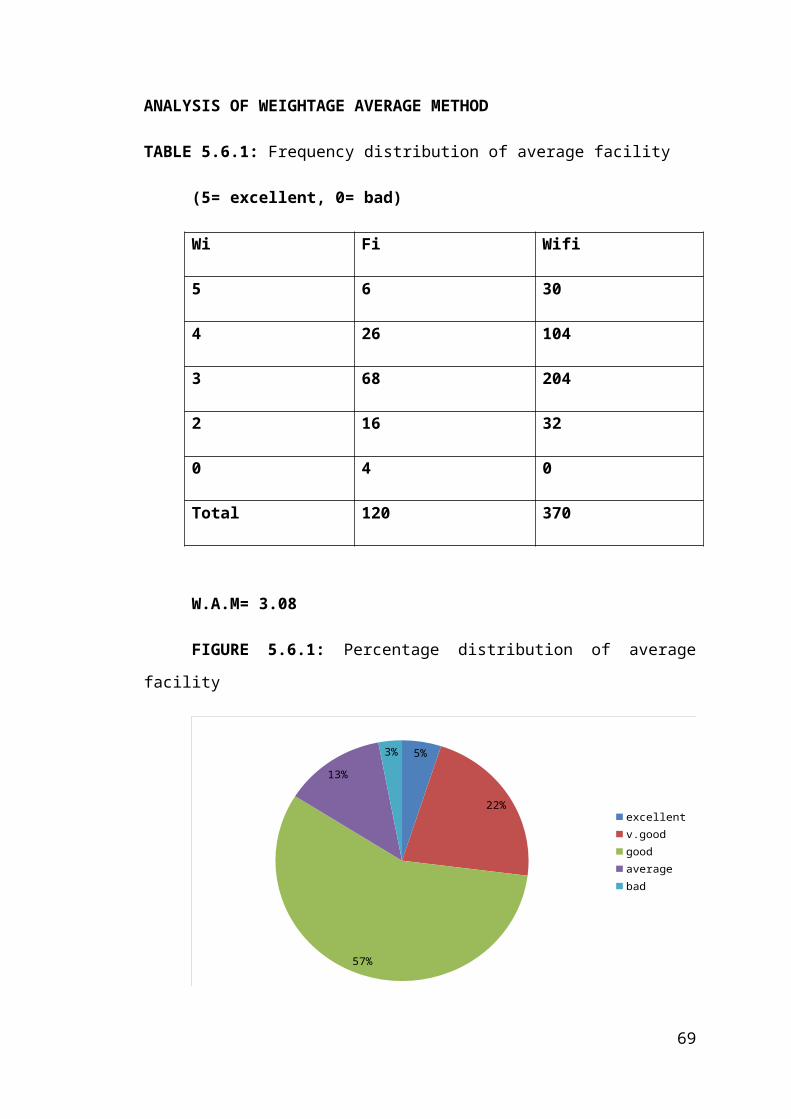
ANALYSIS OF WEIGHTAGE AVERAGE METHOD
TABLE 5.6.1: Frequency distribution of average facility
(5= excellent, 0= bad)
Wi Fi Wifi
5 6 30
4 26 104
3 68 204
2 16 32
0 4 0
Total 120 370
W.A.M= 3.08
FIGURE 5.6.1: Percentage distribution of average facility
5%
22%
57%
13%
3%
excellentv.goodgoodaveragebad
INTERPRETATION:
57% of customers are saying that they have good average facility in their vehicle.
51
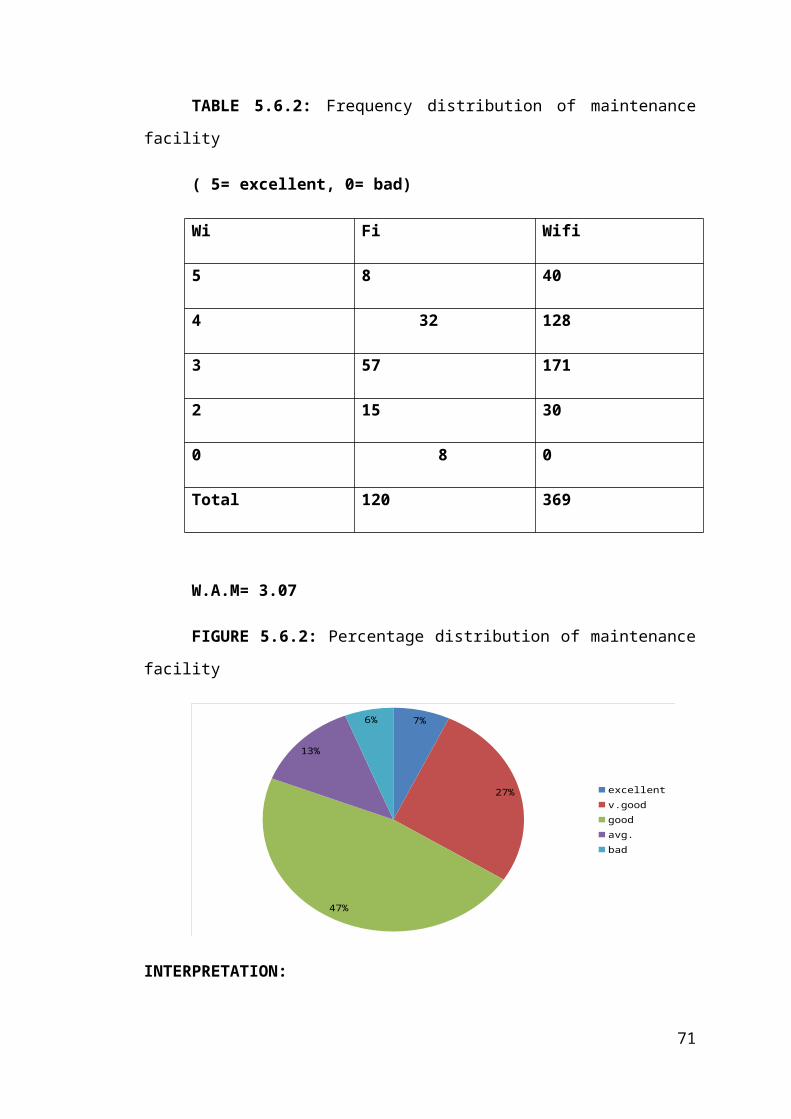
TABLE 5.6.2: Frequency distribution of maintenance facility
( 5= excellent, 0= bad)
Wi Fi Wifi
5 8 40
4 32 128
3 57 171
2 15 30
0 8 0
Total 120 369
W.A.M= 3.07
FIGURE 5.6.2: Percentage distribution of maintenance facility
7%
27%
47%
13%
6%
excellentv.goodgoodavg.bad
INTERPRETATION:
47% of customers are saying that they have good maintenance facility in their vehicle.
52

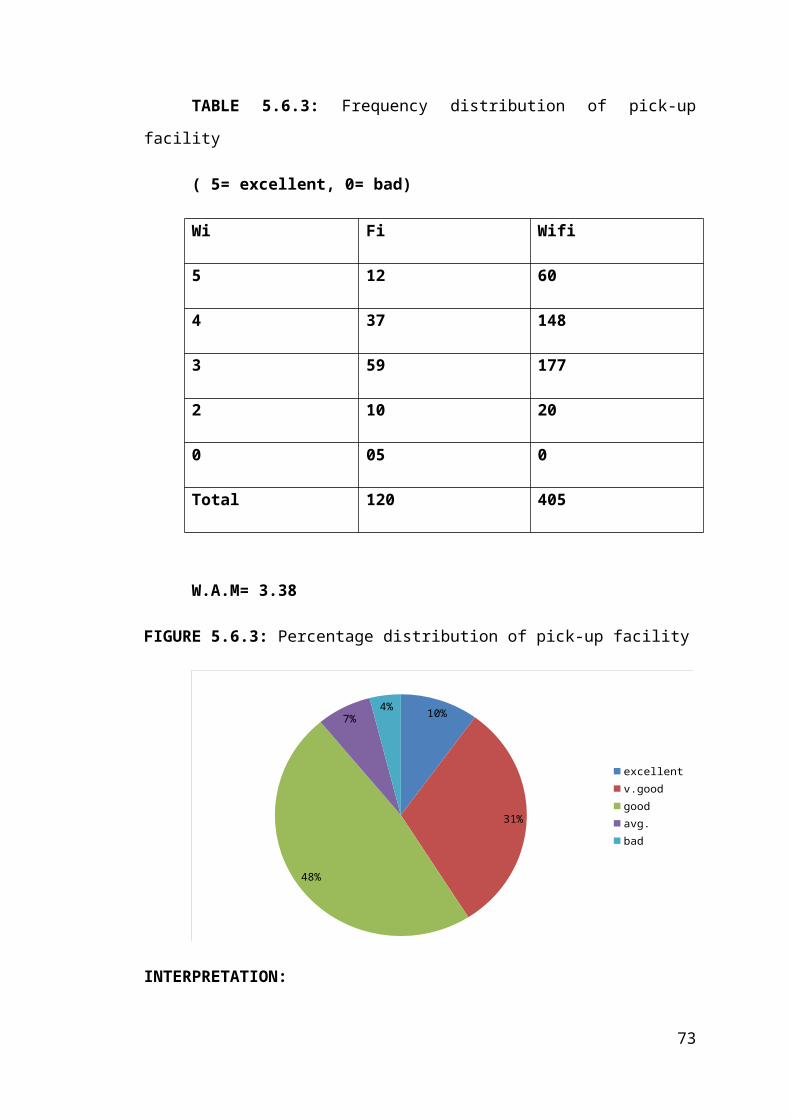
TABLE 5.6.3: Frequency distribution of pick-up facility
( 5= excellent, 0= bad)
Wi Fi Wifi
5 12 60
4 37 148
3 59 177
2 10 20
0 05 0
Total 120 405
W.A.M= 3.38
FIGURE 5.6.3: Percentage distribution of pick-up facility
10%
31%
48%
7%4%
excellentv.goodgoodavg.bad
INTERPRETATION:
48% of customers are saying that they having good pick-up facility in their vehicle.
53

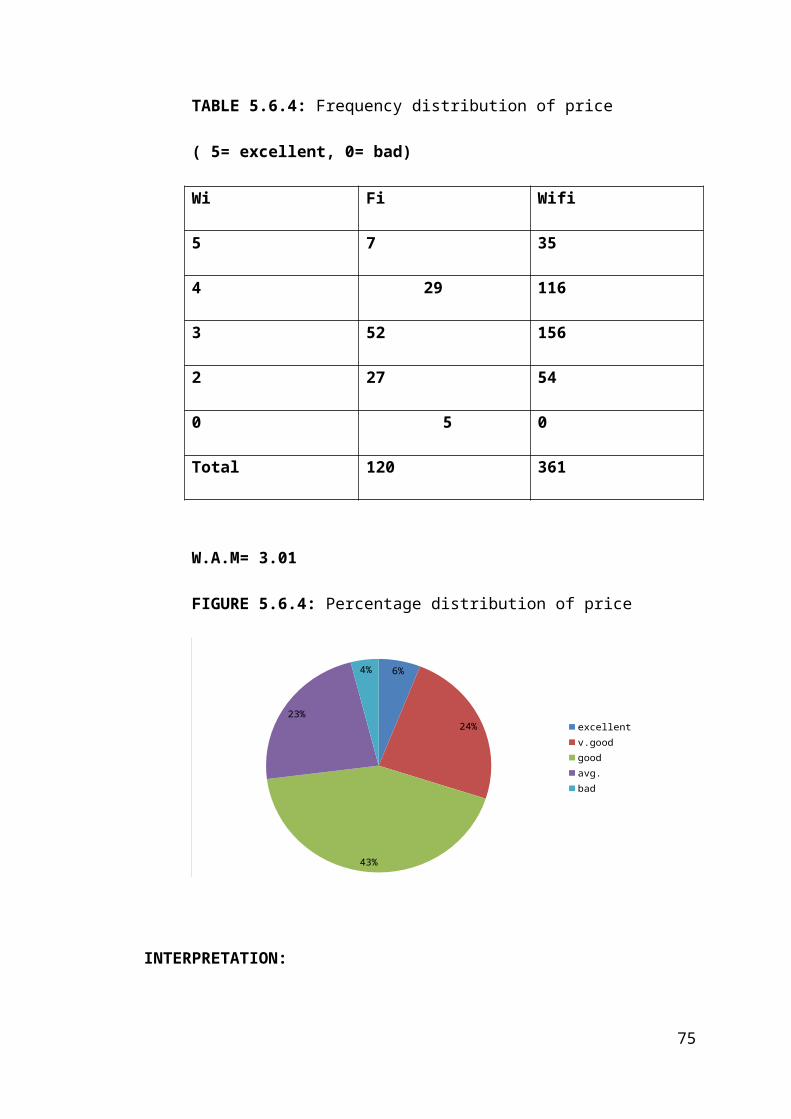
TABLE 5.6.4: Frequency distribution of price
( 5= excellent, 0= bad)
Wi Fi Wifi
5 7 35
4 29 116
3 52 156
2 27 54
0 5 0
Total 120 361
W.A.M= 3.01
FIGURE 5.6.4: Percentage distribution of price
6%
24%
43%
23%
4%
excellentv.goodgoodavg.bad
INTERPRETATION:
43% of customers are saying that price of their vehicle is not very good but not bad
also.
54
TABLE 5.6.5: Frequency distribution of fuel efficiency facility
( 5= excellent, 0= bad)
Wi Fi Wifi
5 12 60
4 23 92
3 67 201
2 14 28
0 4 0
Total 120 381
W.A.M= 3.18
FIGURE 5.6.5: Percentage distribution of fuel efficiency
10%
19%
56%
12%
3%
excellentv.goodgoodavg.bad
INTERPRETATION:
56% of customers are saying that they having good fuel efficiency facility in their
vehicle.
55

COMPARATIVE WAM
TABLE: 5.6.6
Particulars WAM
Average 3.08
Maintenance 3.07
Pick-up 3.38
Price 3.01
Fuel efficiency 3.18
INTERPRETATION:
According to response of customer, average, maintenance, pick-up, price & fuel
efficiency all the facility is good but not very good or excellent.
56
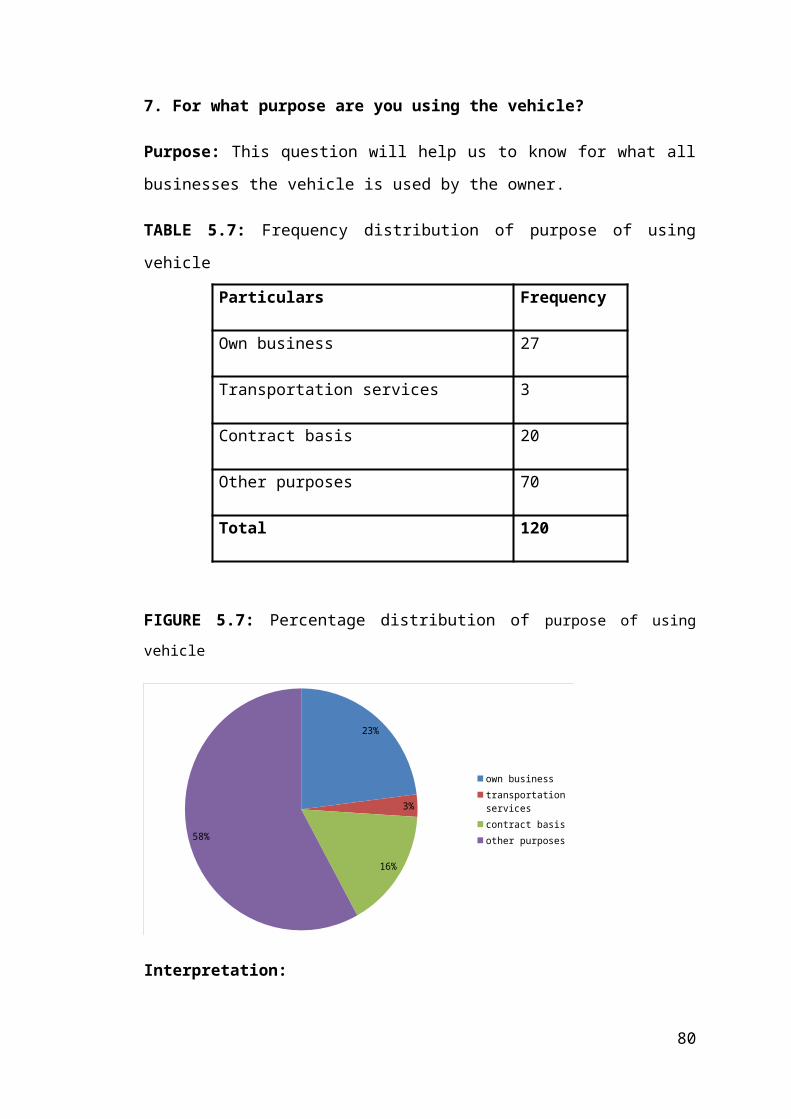
7. For what purpose are you using the vehicle?
Purpose: This question will help us to know for what all businesses the vehicle is
used by the owner.
TABLE 5.7: Frequency distribution of purpose of using vehicle
Particulars Frequency
Own business 27
Transportation services 3
Contract basis 20
Other purposes 70
Total 120
FIGURE 5.7: Percentage distribution of purpose of using vehicle
23%
3%
16%
58%
own businesstransportation servicescontract basisother purposes
Interpretation:
The total respondents of 120 customers, 23% use the vehicle for their own
business,3% for transportation sevice,16% for contract basis & 58% for other
purposes.
57

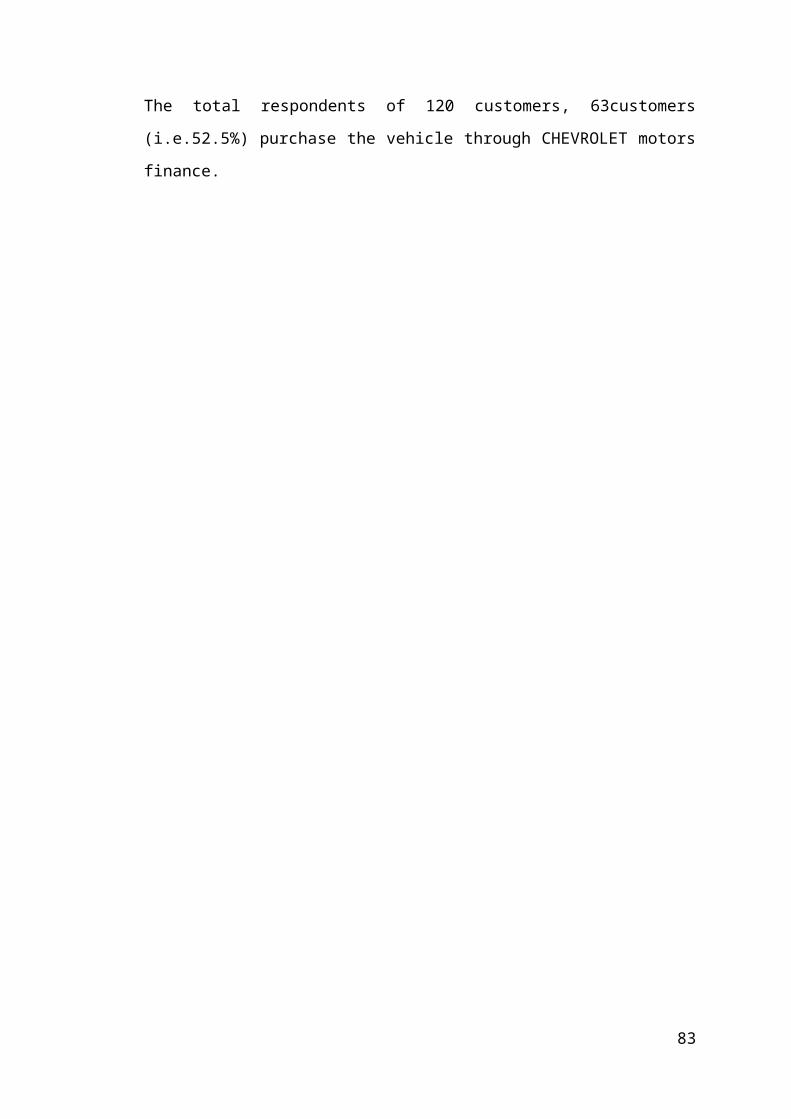
8. How did you finance the vehicle purchase?
Purpose: This question will reveal the major sources of finance through which the
prospective customer avails finance to buy the vehicle from.
TABLE 5.8: Frequency distribution of source of finance
Particulars Frequency
Full payment 5
Bank finance 42
CHEVROLET Motor finance 63
Private finance 5
Others 5
Total 120
FIGURE 5.8: Percentage distribution of source of finance
4%
35%
53%
4%4%
full paymentbank financechevrolet motor finincepvt. Financeothers
Interpretation:
The total respondents of 120 customers, 63customers (i.e.52.5%) purchase the vehicle
through CHEVROLET motors finance.
58
9. Are you using the after sales service facility provided by the dealer?
Purpose: This question has been asked to know whether the customers are using the
after sales facility provided by the dealer or not.
TABLE 5.9: Frequency distribution of using off after sales service
Particulars Frequency
Yes 120
No 0
Total 120
FIGURE 5.9: Percentage distribution of using off after sales service
100%
yesno
Interpretation:
The total customers at Surat, a staggering 100% of the customers are using the after
sales service.
59
10. Are you satisfied by the after sales service?
Purpose: This question will show the rating of the after sales service according to the
customers.
TABLE 5.10: Frequency distribution of satisfaction of sales service
Particulars Frequency
Highly satisfied 5
Satisfied 82
Neutral 31
Dissatisfied 2
Highly dissatisfied 0
Total 120
FIGURE 5.10: Percentage distribution of satisfaction of sales service
4%
68%
26%
2%
H. satisfiedSatisfiedNeutralDissatisfiedH. dis satisfied
Interpretation:
The total respondents of 120 customers in Surat 68% (82 customers) are agreeing that
the after sales service is good.
60

11. How was your experience with NANAVATI Chevrolet motors Sales &
Service while purchasing the vehicle?
Purpose: The management wants to know the perception of the customers regarding
the experience they had while purchasing the vehicle.
TABLE 5.11: Frequency distribution of experience of purchasing vehicle
Particulars Frequency
Very Good 2
Good 59
Average 54
Bad 5
Very Bad 0
Total 120
FIGURE 5.11: Percentage distribution of experience of purchasing vehicle
2%
49%45%
4%
V. goodGoodAvg.BadV.bad
Interpretation:
When it comes to Surat 49% of the customers (i.e. 59 respondents) are agreeing to the
fact that the experience while purchasing that vehicle was good.
61
12. Rate the following aspects of after sales services on according to your level of
importance?
Purpose: This question will help us to know in after sales service which factor
customer think is more important.
TABLE 5.12: Frequency distribution of importance of after sales service
Particulars Rating
H. imp Importance Neutral Less imp. H. Less imp.
Reminder of
service
48 56 12 3 1
Spare part
availability
59 43 18 2 0
Charges 28 42 33 15 2
Discounts/Coupons 24 31 47 14 4
Time taken for
service
52 55 12 1 0
62
ANALYSIS OF WEIGHTAGE AVERAGE METHOD
TABLE 5.12.1: Frequency distribution of reminder of service
( 5= H. important, 0= H. less important)
Wi Fi Wifi
5 48 240
4 56 224
3 12 36
2 3 6
0 1 0
Total 120 506
W.A.M= 4.22
FIGURE 5.12.1: Percentage distribution of reminder of service
40%
47%
10%
3%
1%
H. importantimportantneutralless importantH. Less important
INTERPRETATION:
Maximum customers are saying that service reminder is important and should be
given in after sales service.
63
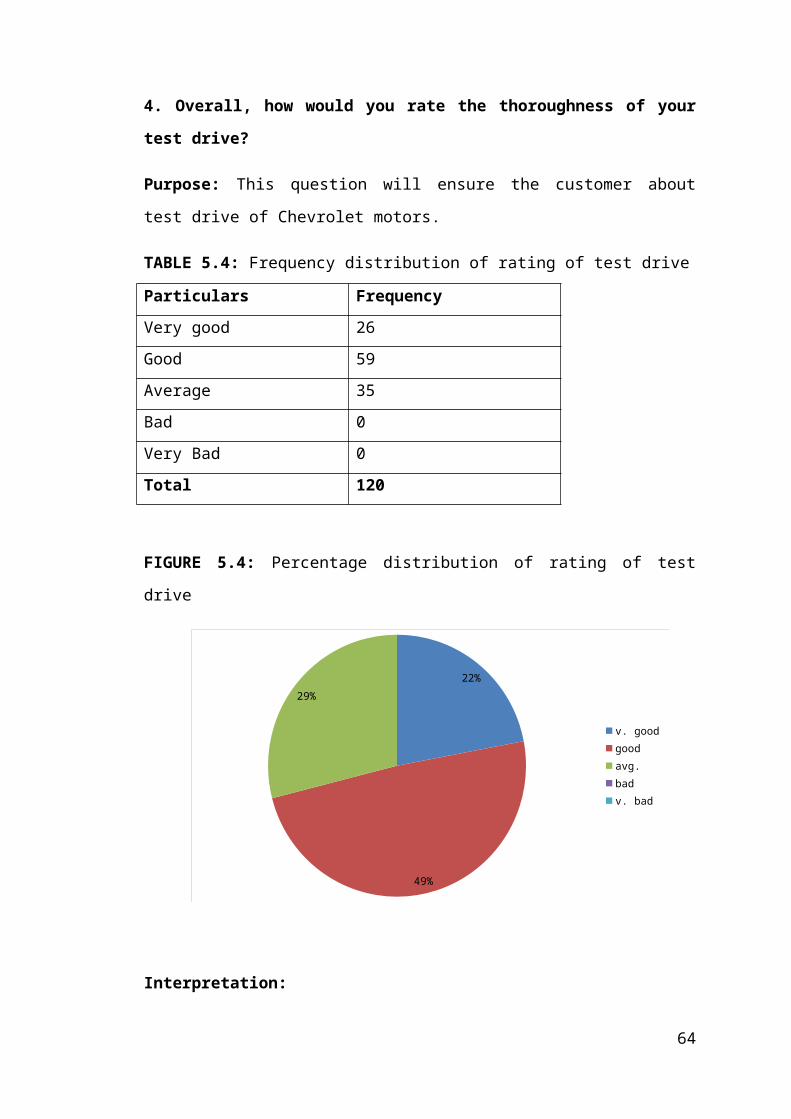
TABLE 5.12.2: Frequency distribution of spare parts availability
( 5= H. important, 0= H. less important)
Wi Fi Wifi
5 59 295
4 43 172
3 18 54
2 2 4
0 0 0
Total 120 525
W.A.M= 4.38
FIGURE 5.12.2: Percentage distribution of spare parts availability
48%
35%
15%
2%
h. importantimportantneutralless importanth. less important
INTERPRETATION:
Maximum customers are saying that spare parts availability is highly important .
64

TABLE 5.12.3: Frequency distribution of charges
( 5= H. important, 0= H. less important)
Wi Fi Wifi
5 28 140
4 42 168
3 33 99
2 15 30
0 2 0
Total 120 437
W.A.M= 3.64
FIGURE 5.12.3: Percentage distribution of charges
23%
35%
29%
13%
2%
h. importantimportantneutralless importanth. less important
INTERPRETATION:
Maximum customers are saying that charges of after sales service is important but not
highly important.
65

TABLE 5.12.4: Frequency distribution of discounts/coupons
( 5= H. important, 0= H. less important)
Wi Fi Wifi
5 24 120
4 31 124
3 47 141
2 14 28
0 4 0
Total 120 413
W.A.M= 3.44
FIGURE 5.12.4: Percentage distribution of discounts/coupons
20%
26%39%
12%
h. importantimportantneutralless importanth. less important
INTERPRETATION:
39% of customers are saying that discount/coupons is not much important for them.
66
TABLE 5.12.5: Frequency distribution of time taken for service
( 5= H. important, 0= H. less important)
Wi Fi Wifi
5 52 260
4 55 220
3 12 36
2 1 2
0 0 0
Total 120 518
W.A.M= 4.32
FIGURE 5.12.5: Percentage distribution of time taken for service
43%
46%
10%
1%
h. impimportantneutralless imp.h. less imp
INTERPRETATION:
Time taken for service is important for the customer, they should return back at
promise time.
67
COMPARATIVE WAM
TABLE: 5.12.6
Particulars WAM
Reminder of service 4.32
Spare parts availability 4.38
Charges 3.64
Discounts/Coupons 3.44
Time taken for services 4.32
INTERPRETATION:
According to response of customer, Reminder of service, spare parts availability &
time taken for services is highly important in after sales service.
68
13. How do you rate the staff of NANAVATI Chevrolet motors Sales & Service?
Purpose: From this question the management wants to know the perception of the
customers regarding the
TABLE 5.13: Frequency distribution of rating the staff
Particulars Frequency
Very Good 3
Good 65
Average 50
Bad 2
Very Bad 0
Total 120
FIGURE 5.13: Percentage distribution of rating the staff
3%
54%
42%
1%
V.goodGoodAvg.BadV.bad
Interpretation:
In Surat 65 respondents (i.e. 54%) think that the staff of NANAVATI Chevrolet
motors Sales & Service is good.
69

14. What do you like the most about NANAVATI motors Sales & Service?
Purpose: This question will help the management to know which facilities attract the
customers the most and which does not.
TABLE 5.14: Frequency distribution of liking the attribute of nanavati
Particulars Frequency
quick & prompt delivery 56
after sales service 11
Assurance 17
easy financing 17
Other 19
Total 120
FIGURE 5.14: Percentage distribution of liking the attribute of nanavati
47%
9%
14%
14%
quick & prompt deliveryafter sales serviceassuranceeasy financingothers
Interpretation:
The total respondents of 120, in which 56 (i.e.46.7%) respondents most like about
quick & prompt delivery, 11(i.e. 9.2) like after sales service, 17(i.e.14.2) both like
assurance & easy financing and 19(i.e.15.8) people like other option.
70
15. If you would like to tell us something about your purchase or ownership
experience that has not been covered in this survey, please comments?
Purpose: The purpose of this question is that to know more about Nanavati Chevrolet
motors which is not covered in this survey.
ANSWER:
Maximum respondents have said that Nanavati Chevrolet should open more service
centre in Surat.
71

CHAPTER 4
FINDINGS & CONCLUSION
72
6.1 Finding:-
Despite of the consumer regarding the facilities the dealer is providing in case of after
sales service, they still stick to purchasing Chevrolet motors. 120 % of the present
customers promise to purchase CHEVROLET motors again.
The staff can improve their performance by having more interaction with the
customers. 54% of the respondents in Surat believe that the staff rates good.
All the customers that I surveyed are using the after sales service that the dealer is
providing. They are satisfied with the after sales service provided by the dealer. But
the customers of Surat suggest that there should be one more service centre inside
Surat.
Majority of the customers are getting aware about the vehicle through friends &
relatives 30.8% of the customers in Surat.
Most of the customers are relying on bank and CHEVROLET motors finance. In
Surat city 35.0% of the customers used bank finance option while 52.5% of the
customers availed CHEVROLET motors finance.
In Surat, 58.3% of the customers are using their vehicle for other business while
22.5% of the customers used the vehicle for own business.
Quick & prompt delivery is the most important factor that attracts majority of the
customers towards the dealer. 56 out of 120 customers in Surat city .
The experience of the customer while purchasing the vehicle has been good. 49.0% of
the customers in Surat and only 2.0% customers their experience with the dealer while
purchasing the vehicle were very good.
73

6.2 CONCLUSION:-
After I have studied the level of customer’s satisfaction of Nananvati Chevrolet
Motors sales services, i got satisfied answers against my objectives of the study. From
this study I can concluded in following manner:
Only 5% of customer owns Captiva model of Chevrolet.
Staff interaction should be improved.
Only 3% of customers own vehicle for transportation services.
The satisfaction level of the customers who have used the sales services after
purchasing the motor is high so it is strong advantage of Nanavati Chevrolet motors .
Reminder and time taken for service is a most important factor for customers.
Overall most part of performance of sales service given by dealership, the customer’s
satisfaction level is day to day going to very highly.
74
CHAPTER 5
SUGGESTION AND
RECOMMENDATION
75

6.3 Suggestion:-
1. Majority of the respondents in Surat suggested that the company should open a
service centre inside Surat. Moreover, they also suggested that the company should
increase their current servicing capacity.
2. The company must focus more on their own finance company and try to provide
better finance options with reduced interest rates and lower down payments which
will lure the customers towards them.
3. The company should focus more on print advertising. Newspaper advertising
should be the main weapon for the company.
4. The company needs to reduce the time of servicing of the vehicle. Quick servicing
and prompt delivery needs to be done.
5. In terms of Brand users CHEVROLET MOTORS got 63.3 %, still CHEVROLET
has to put more efforts in term of advertisement and sales promotions to increase
users in Surat.
6. As most of the people consider the following criteria as important, Chevrolet
motors should focus on these criteria given below in order
Average
Price
Design
Maintenance
Fuel efficiency
76

Chapter 6
BIBLIOGRAPHY
77
Books:
Marketing Management – Philip Kotler, Kevin Lane Keller.
Websites:
1. http://en.wikipedia-org/wiki/Automobile-industry
2. http://www.google.co.in/images
3. http://www.chevrolet.co.in.com
78

CHAPTER 7
ANNEXURE
79
As the student of The Surat People’s College of Business Administration, Surat,
conducting a survey on “CUSTOMER SATISFACTION OF CHEVROLET AT
NANAVATI MOTORS OF SALES & SERVICES”. I request you to fill up this
questionnaire and co-operate with me, as this our academic research. I assure you that
the questionnaire which you will fill will be used only for academic purpose and
information will be kept strictly confidential.
1. Which CHEVROLET Motors do you own?
Spark Aveo-U-VA Optra Magnum Captiva.
Beat Aveo Tavera Neo-2
2. Since when you have this car?
Less than 1 year 2-3 years
4-5 years More than 5 years
3. Were you offered a test drive?
Yes, offered and taken yes, offered but not taken
No, not offered
4. Overall, how would you rate the thoroughness of your test drive?
Very good Good Average
Bad Very Bad
5. From which media did you come to know about the vehicle?
Auto Fair Magazines Pamphlets
Demo Souvenirs Telephone enquiry
Newspapers Friends & relatives others
6. For what purpose are you using the vehicle?
Own Business Transportation Services
Contract basis other purposes
7. Are you using the after sales service facility provided by the dealer?
Yes No
80
8. Rate the facilities you were found in your vehicle?
Particular Excellent Very
Good
Good Average Bad
Average
Maintenance
Pick-up
Price
Fuel
efficiency
9. Rate the following aspects of after sales services on according to your level of
importance.
Factors Highly
importance
Importance Neutral Less
importance
Highly less
importance
Reminder of
service
Spare parts
availability
Charges
Discounts /
coupons
Time taken
for service
10. How did you finance the vehicle purchase?
Full Payment Bank Finance
Chevrolet motor Finance Private Finance
Other
81

11. Are you satisfied by the after sales service?
Very satisfied Satisfied Neutral
Dissatisfied Very dissatisfied
12. How your experience with NANAVATI Chevrolet was was motors Sales & Service
while purchasing the vehicle?
Very good Good Average
Bad Very Bad
13. How do you rate the staff of NANAVATI Chevrolet motors Sales & Service?
Very good Good Average
Bad Very Bad
14. What do you like the most about NANAVATI Chevrolet motors Sales & Service?
Quick and Prompt delivery after sales service
Assurance Easy financing
Others
15. If you would like to tell us something about your purchase or ownership experience
that has not been covered in this survey, please type your comments:
PERSONAL INFORMATION:-
Name: - _________________________________________________________
Gender: - Male [ ] Female [ ]
Age:-_______ Years
Occupation: - Student [ ] Business [ ] Service [ ] Housewife [ ]
Other [ ]
Income: - ______________
Contact No: - __________________________
82
83