figure 15: pedestrian movement network - sa cities€¦ · 34 part 3: status quo 2008 urban grain...
TRANSCRIPT

32
PART 3: STATUS QUO 2008
Figure 15: Pedestrian Movement Network

33
PART 3: STATUS QUO 2008
2.3 Accessibility
Space Syntax was commissioned to provide accessibility information for the Rosebank Urban Development Framework. This information as well as those of other professionals is to contribute to the formulation of policies to guide the City of Johannesburg as to the future development potential of the area.
The aim of this study is to firstly understand the levels of accessibility of the Rosebank Precinct, then based on the findings suggest new linkages that will contribute to the safety and walkability of the area.
The methodology of the study is based on the following:
2.3.1 Urban Grain and Layout Geometry
The methodology for the block size analysis is based on the following:
Block size analysis
The pattern, arrangement, shape and size of street blocks, plots and their buildings can produce very different results in terms of permeability, connectivity and accessibility. These patterns have a direct influence on route choice preference, ease of movement and legibility within urban environments.
Permeability, urban block size, and route choice
An important urban design characteristic of good places is their degree of permeability. Too much or too little permeability can result in poor legibility or
restricted movement, which can have a negative impact on the quality of safe and easy movement.
Permeability is directly related to the size and layout of urban blocks.
The network of continuous public open space that exists between the blocks can be called the “permeability network”. Thinking of space in this way highlights how block size and arrangement give form to the permeability network. It in turn defines the path of streets, open spaces, and lanes. Different sized blocks create different types of permeability networks, often referred to as the urban grain. A pattern of many small sized blocks can be said to have a fine urban grain, while patterns of fewer, larger blocks can be said to have a coarse urban grain. The quality of an area’s urban grain directly affects the
choice of routes. Finely meshed permeability grids offer many different ways to get from place to place minimising trip length and backtracking.

34
PART 3: STATUS QUO 2008
Urban grain and land uses Distribution
Certain kinds of block sizes and arrangements lend themselves better to certain kinds of land uses. Research has found that the grain of streets is usually finer around busy shopping streets and coarser in more residential areas. This is because smaller blocks maximize the available surface for display and interaction, while minimising journey length. This pattern helps support successful retail, catering, and leisure activities. Such “grid intensification” is an important property of urban centres and sub-centres.
The converse is true for residential areas. These areas tend to have lower movement levels by nature, and increased permeability can often dilute already low movement. The result may be decreased perceptions of safety and increased criminal opportunism. For Rosebank, a constant width, line based representation of the public space network available to pedestrians was used to delineate the pattern of blocks and their sizes. The resulting blocks were then coloured according to their area: varying between dark blue for very large blocks, to red for very small ones. This technique created an easily
readable map which represent different urban grains, and enables comparison between different types of areas.
The north east and western edges are surrounded by large blocks. Some of these large blocks are an amalgamation of medium sized blocks which were formed as a result of roads closing their access points to Oxford and Jan Smuts Road. The smaller block structure of Rosebank is to the south western corner of the study area and a smaller cluster to the north east. This means that the predominant walkable blocks are not along Oxford Road but on Bolton and Jan Smuts. Refer to Figure 16 & 17 below for the Block Size Analysis for Rosebank. Figure 18 below indicates the walking time and distances within Rosebank. Furthermore, it also shows the desired pedestrian movement lines within the CBD indicated in Red, Yellow, and Green.

35
PART 3: STATUS QUO 2008
Figure 16: Block Size Analysis Rosebank

36
PART 3: STATUS QUO 2008
Figure 17: Block Size Analysis Rosebank

37
PART 3: STATUS QUO 2008
Figure 18 illustrates the walking distance and time from the proposed entrances to the Rosebank Station between Tyrwhitt and Baker.
Figure 18: Walking Time & Distance Analysis Rosebank

38
PART 3: STATUS QUO 2008
2.3.2 Urban Grain & Layout Geometry: Point Depth from Rosebank Station Entrances
This analysis shows that the areas within 10 minutes walking distance to the station entrance fall inside of the study area for Rosebank(Defined by the following streets: Jan Smuts, Hurlingham, Arran, Venus, Sixth, Fourteenth, Ninth, Bristol, Bath, Ashford, Blanford, Wells, and Chester.). The Rosebank node walkable area extends to the north eastern side. The analysis also highlights the lack of choice with regards to alternate metrically short routes between
the stations with Oxford road being the only route linking the station with the least walking time and distance.
The circles indicate where some route choices can be made locally in Illovo.
2.3.3 Baseline Spatial Analysis: Ease of movement and spatial accessibility analysis
Block size, grain, character, connectivity, and directness all contribute to the accessibility of a place. Accessibility is defined as the ability and degree of ease that people have when moving around in their environment. This includes physical accessibility (locomotion effort), as for elderly and disabled people, those with young children, or those encumbered with luggage and shopping. It also includes spatial accessibility, such as planning a route
choice (mental effort) or the availability of routes to and from different parts of a city – which plays a fundamental role in structuring and facilitating urban movement and exchange.
Although it is often easy to determine accessibility from a single given location to any other (we often do this in our head when giving directions), it becomes extremely difficult to determine accessibility from tens of thousands of different origins and destinations, as is the case in real urban
environments.
Research has found that despite the wide range of origins and destinations within a city, there is a relatively stable movement pattern. This suggests that
the pattern of journeys used by most people, most of the time, is relatively tractable and predictable.
When viewed from this perspective, it becomes clear that what is most important is not the specific origins and destinations pairs, but the character and patterns of the journeys themselves. This is exactly how spatial accessibility analysis measures the movement infrastructure of people whether on foot or in vehicles.
Space Syntax performs “journey simulation” and route choice analysis which takes into account the route choice strategy and preference of most pedestrians and cyclists. These analytical techniques have been demonstrated to be a robust way of assessing the spatial accessibility of the urban structure and grain and, in so doing indexing the ease of movement for most people in an area most of the time. This index is often referred to as “spatial accessibility”.
An understanding of spatial accessibility can then be used to establish a robust hierarchy of routes, within the public domain movement network. The balance between spatial accessibility and other factors is critical to the success of well functioning urban spaces. Where the coupling between urban form, accessibility, land use, and transport is out of balance, the fit between accessibility and movement levels is out of balance. This often results in the potential for socio-economic disorder. When this is the case, space syntax analysis incorporates multiple variables such as frontage quality, land use, ownership status, exposure, and social data such as crime rates and aesthetic preference.

39
PART 3: STATUS QUO 2008
Spatial accessibility analysis was performed using the public open space line map (axial map) as its base map. Spatial accessibility values are calculated by first selecting a line, then calculating how many other lines must be used wholly or in part to reach every other line in the whole spatial accessibility map. When this calculation is made for each line in the map it turns out that some lines require fewer changes of direction than others in order to cover
the rest of the spatial accessibility map.
The map is then coloured up to represent the most likely use hierarchy, with routes comprising the highest levels of most direct journeys coloured in red, orange, and yellow. Routes which are likely to carry fewer journeys were coloured greenish-blue and blue. This map is produced to reflect pedestrian accessibility and at a local and global scale. Pedestrian only routes are also included in the map.
There are many gate closures in the study area and their impact on pedestrian movement could only be assessed based on aerial photographs. Where uncertainties arose the access points were assumed open to pedestrians.
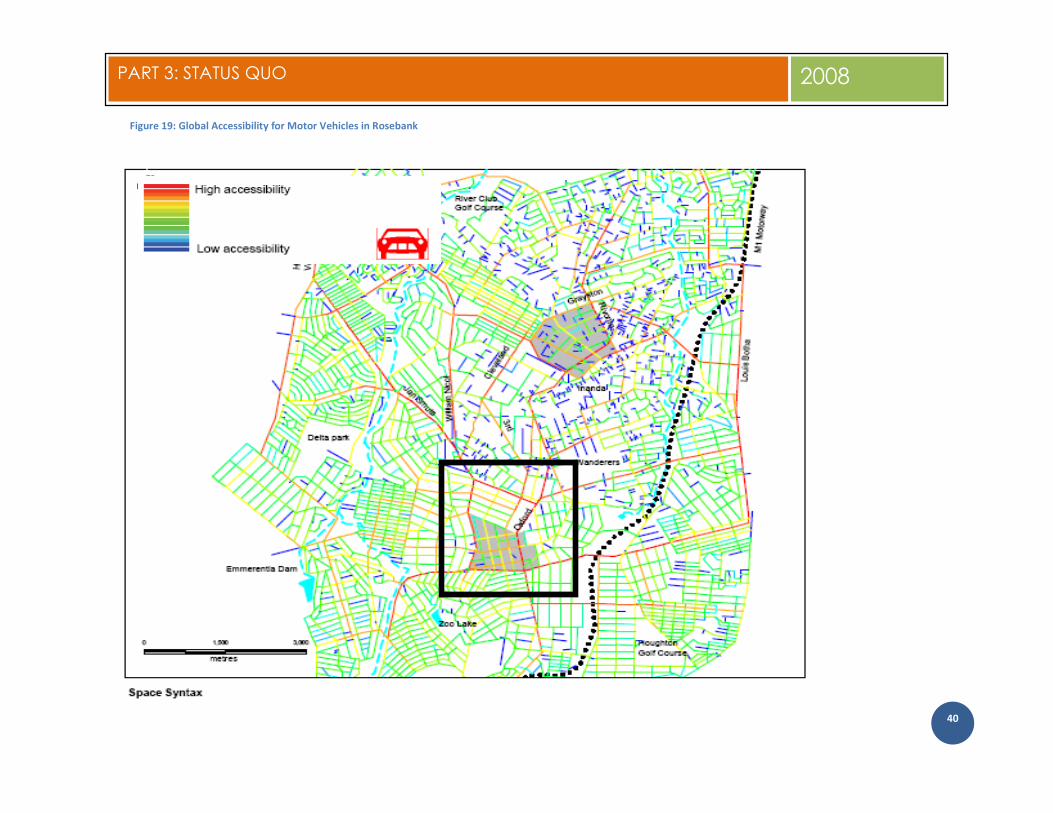
Figure 19 shows the global accessibility for motor vehicles within and around the Rosebank study area. The highly accessible routes, shown in red, through
to inaccessible routes shown in blue, correspond with larger scale trips through the area.
The analysis highlights Jan Smuts and Oxford as accessible north south lines of high potential movement for large scale journeys across the area. However, only the Oxford route extends the full north south length.
Rosebank is surrounded on three sides by highly accessible routes namely the north south –Jan Smuts and Oxford Road and the east west route of Bolton/ Glenhove Road. The highly accessible 7th Avenue/ Tyrwhitt pass through the middle of Rosebank and reduce in accessibility as it moves further east
beyond Rosebank.
40
PART 3: STATUS QUO 2008
Figure 19: Global Accessibility for Motor Vehicles in Rosebank

41
PART 3: STATUS QUO 2008
Figure 20: Global Accessibility for Pedestrians in Rosebank
Figure 20 above shows the Global accessibility within the study area for pedestrians. The highly accessible routes, shown in red, through to inaccessible
routes shown in blue, directly correspond with pedestrian movement at a local scale. Journeys of approximately 800m in length are mapped.