lend lease corporation
TRANSCRIPT

www.lendlease.com
2005 Annual R
epo
rt to S
harehold
ersLend
Lease Co
rpo
ration
2005 Annual Reportto Shareholders
Paper Specifications The cover and pages 1 to 36 of this report are printedon Monza Satin, an environmentally responsible papermanufactured with 50% recycled fibre (15% post-consumer waste and 35% pre-consumer waste [notincluding mill-broke]) using Elemental Chlorine Free(ECF) pulp sourced from sustainable, well managedforests. Water is mostly recyclable through manufacturingand waste is treated to strict local standards. MonzaSatin is produced by Burgo, a company certified underISO14001 environmental management systems andIntegrated Pollution Prevention & Control (IPPC).
The remainder of this report is printed on Nordset, an environmentally responsible paper manufacturedusing Elemental Chlorine Free (ECF) pulp sourced from sustainable, well managed forests. Nordset isproduced by Nordland Papier, a company certifiedunder ISO14001 environmental management systemsand registered under the EU Eco-management and Audit Scheme EMAS (Nordland Papier, Reg. No. D-162-00007).
Lend Lease CorporationABN 32 000 226 228

1
Contents Chairman’s Report 2
Chief Executive Officer’s Report 4
Financial Snapshot 6
Global Executive Management Team 8
Retail and Communities Summary 10
Retail Case Study 12
Retail and Communities Summary 14
Communities Case Study 16
Investment Management Summary 18
Investment Management Case Study 20
Project Management,Construction and PFI Summary 22
Project Management,Construction and PFI Case Study 24
Corporate Governance 26
Concise Financial Report 39
Lend Lease Foundation2005 Annual Report 92
Shareholder Information 93
Directory 96
Lend Lease is a leading retail and residential property groupintegrated with strong investment management andconstruction management businesses.
The organisation has global reach and world-class localcapability, delivered by employees dedicated to collaboratingwith stakeholders and working with integrity.
The Group operates in sectors and geographies where it canuse its expertise to add value and, in so doing, create economicreturns for shareholders.
Above all, Lend Lease is committed to being Incident & InjuryFree wherever it has a presence. This philosophy reaches everypart of its operations and extends to clients, suppliers, subcontractors and other stakeholders.
Left: The Bond, Sydney, New South Wales, Australia

2
Chairman’s Report
Summary of the past yearThe past year has been one of challengeand change for Lend Lease.
In last year’s Annual Report I spoke of the benefits to Lend Lease of mergingwith General Property Trust (GPT). Ourproposal did not receive the required level of support from the GPT unitholdersand the Board decided it was not inshareholders’ interests to keep pursuing GPT.
Throughout this period, the Group stayed focused on driving our existingbusinesses and securing profit growth.Our vision is clear – to be a leadinginternational retail and residential propertygroup, integrated with strong investmentmanagement and constructionmanagement businesses. The strategy for growth has been well illustrated by the recent acquisitions of The CrosbyGroup in the UK; the remaining minorityinterest in our US military housingbusiness, Actus; and the addition of three more shopping centres to our UK retail pipeline.
It is this strategy that underpinned the Group’s increase in operating profitafter tax, excluding one-off items and discontinuing operations, to A$281.6 million for the year to 30 June 2005, an increase of 13.5% overthe 2004 result. The final dividend for theyear was 29 cents per share, fully franked,and within the Board’s policy for a payoutratio between 60 to 80% of after taxoperating earnings, excluding one-offitems. The Directors’ objective within thatrange is to provide shareholders with a stable and growing dividend flow.
Following the acquisition of Crosby inJune, the Group cancelled the on-marketshare buyback which was announced inNovember 2004.
Board and management initiatives
Reorganisation and renewalIn July, Lend Lease announced somesignificant management changes, as the Group reorganised along ‘lines ofbusiness’ rather than a regional basis.The lines of business are:– Retail and Communities headed by
Ross Taylor, who has a 20-year careerwith Lend Lease;
– Investment Management headed bySteve McCann, who will join LendLease in September after many yearsas an investment banker, consultinginter alia to the Group; and
– Project Management, Construction and PFI headed by Bob Johnston, a long term and accomplished LendLease employee.
Roger Burrows, who has been a financeexecutive with Lend Lease for 18 years,joined the senior executive team havingbeen appointed Chief Financial Officer in December 2004.
As part of this management change, the former head of European operations,Adrian Chamberlain, decided to leave the Company and resigned as a Directoreffective 30 September 2005.
Joining the Board as a Non ExecutiveDirector is David Ryan. David is anexperienced executive who has heldmanaging director positions in investmentbanking and industry, as well as being a chairman or non executive director of a number of listed public companies.
Richard Longes will step down at theforthcoming Annual General Meeting.Richard became a Director in 1986 and was appointed Deputy Chairman in January 2000. The Board wishes himwell and thanks him for his outstandingcontribution to the Company over many years.
Corporate governance and financial reportingDuring the year, the Board established apolicy regarding the conduct of non-auditwork by our auditing firm, KPMG. Thispolicy can be found in the CorporateGovernance report.
Lend Lease briefed the market on theimpact of the new Australian Equivalentto International Accounting Standards(AIFRS). The Group has had a projectteam working on these standards sincelate 2003. While we are still workingthrough the implementation of thestandards, the Board does not anticipateany material impact on the Group’sunderlying operating earnings. Details on the expected impact of AIFRS can be found in the Financial Statements.
OutlookThe Directors are pleased with theprogress the Group has made over thepast 12 months. Lend Lease is in goodshape strategically and financially, andhas a clear path for growth over thecoming years. The Board andmanagement are budgeting for anincrease in operating profit in 2006 and the Group is well positioned forcontinuing growth in later years.
David CrawfordChairman

3

4
Chief Executive Officer’s Report
5
The Group’s solid result this year wasunderpinned by strong performancesfrom each of the core businesses, whichdelivered healthy growth over their 2004 results.
Total Group profit after tax of A$210.7million was lower than the 2004 result because this year the Group carried anumber of one-off expenses, principallyassociated with the proposed GeneralProperty Trust (GPT) merger and grouprestructuring; whereas the previous yearincluded an after tax profit from one-offitems, principally related to the sale ofIBMGSA. However, in line with ourguidance to the market, we achieveddouble digit growth in operating earningsafter tax of 13.5% over 2004.
Operationally, Lend Lease is in very goodshape. Barring unexpected economic ormarket downturns, we expect to continueachieving growth in 2006 and beyond.
While there was much focus on theattempted merger with GPT and itssubsequent internalisation and separationfrom Lend Lease during the year, I ampleased to report the management teamand our 9,000 employees were notdiverted from executing our broaderstrategy for growth.
As outlined in the Chairman’s Report, we reorganised the Group along its threecore business lines during the year andthis Report is presented along thosesame lines.
Retail and Communities The Retail and Communities business –previously known as IntegratedDevelopment Businesses – maintained itsgrowth, delivering a 14.5% increase over2004 with an after tax operating profit ofA$102.5 million.
In Asia Pacific, Delfin Lend Lease reported a 22% increase in profit, despite a subduedand slowing residential market. The LendLease Development operating result alsoheld up well when compared with 2004,which included a one-off A$13.4 millionafter tax profit on the sale of our remaininginterest in Fox Studios, Sydney.
In the US, our military housing operation,Actus Lend Lease, demonstrated itsearnings capacity with a strong increase in after tax earnings to A$22.5 million.
In Europe, the communities operationsgenerated a small initial profit on the
Greenwich Peninsula project, while theChapelfield retail centre in Norwich, whichwill be completed in September, isexpected to generate a significant return of cash and development profit during2006.
Lend Lease has expanded its retailproperty operations in the UK and hassecured a substantial operational footprintin that market. Four prime retail propertyagreements were secured over the past18 months. These give Lend Leaseaccess to various earnings streams and a solid redevelopment pipeline.
The key driver of future earnings visibilityin the global communities operations issales lot backlog. During the year, theGroup recorded a 28% increase inbacklog to over 120,000 lots, or 33% to 125,000 lots when the July acquisitionof The Crosby Group in the UK is included.
Investment ManagementThe Group’s Investment Managementbusiness also performed well due, in part,to strong rental income growth from itsretail assets, increasing operating profitsby 8.1% to A$108.4 million after tax.
In Australia, profit after tax increased 22% with earnings from our investment in GPT units which were acquired as aresult of the proposed merger with GPT.We also increased our investment inAPPF to A$350.9 million.
In Europe and North America, ourBluewater and King of Prussia retailcentres delivered greater rental income again this year and furthervaluation increases.
Globally, Lend Lease had nearly A$12 billion in real estate assets undermanagement at June 2005. InSeptember, former ABN Amro bankerSteve McCann will join Lend Lease to head our global InvestmentManagement business.
Project Management,Construction and PFI The Group’s Project Management,Construction and PFI business continuedto retrace its growth path with anincrease in operating profit after tax toA$139.2 million, driven largely by a returnto profitability in Asia Pacific operations.Backlog Gross Profit Margin (GPM) , a key indicator of future profitability , increased by 31% during the year. We expect 52% of that record level of
Backlog GPM to be realised in 2006, with the remaining 48% realised in 2007and beyond. The outlook for the USbusiness is strong and there have beenseveral major project wins, such as therenewed BP Alliance and new residentialprojects in New York, which were bigcontributors to the Company’s enhancedBacklog GPM. European operationscontinued to do well, recording a 29%increase in profit after tax, including PFI.
SafetyBut we would not be performing in these sectors and making money for our shareholders, without the skill andcommitment of our employees. Withoutour workers we do not amount to much.We owe any success we have to themand in return, we know that the wellbeingof our employees is paramount.
As such, during the year we continued to focus on the health and safety of ouremployees and associates by continuingour journey to becoming Incident & InjuryFree (IIF). IIF helps the Group to sustain a mindset intolerant of injury or incident, at work and beyond. While the Group’sstrategy is commendable, our recordduring the past 12 months is not. Sevenworkers died on Lend Lease projects thisyear and this is unacceptable. We must all remain committed to maintaining thehighest possible safety standardswherever we have a presence so we can eliminate fatalities and serious injuriesin our workplaces.
OutlookThe outlook for Lend Lease continues to be positive. We are focused on ourcore businesses in geographies andmarket niches where we have ademonstrated capability and advantage.Our strategy is in place, our businessesare well positioned and our expectationsfor continuing growth have not changed.
Greg ClarkeChief Executive Officerand Managing Director

66
Financial Snapshot
Profit after tax (A$m)1 Earnings per share (cents)1 Return on equity1, 2
31.3%
1 In 2005, profit after tax including one-off items and discontinuing operations is A$210.7 million. The one-off items are overhead reduction implementation costs,GPT merger and separation costs, the write-down of management agreements and a net profit from exiting REI businesses. In 2004, profit after tax includingone-off items and discontinuing operations is A$334 million. The one-off items relate to the sale of IBMGSA and a net loss in exiting REI businesses, Grouprestructure and merger costs and capital loss tax benefits. The 2003 result including one-off items and discontinuing operations was a loss of A$715 million. The one-off items relate to the write-down of the REI businesses.
2 Equity represents the average balance of equity for the year. In 2005, return on equity after amortisation including one-off items is 8%. In 2004, return on equity after amortisation including one-off items is 12%.
3 Total shareholder returns (%) = [(closing share price – opening share price) + dividends per share] ÷ opening share price.
$230
$226
$151
$256 $310
01 02 03 04
02 03
01 02 03 04
Profit after tax excluding one-off items
Earnings per share excluding one-off items
Return on equity after amortisationexcluding one-off items
(39.0%)
(14.7%)
(19.0%)
01 02 03 04
Total shareholder return3
Payout ratio (%) Annual total shareholder return (%)Fully frankedUnfranked
Dividend payout ratio
34%
78c
Dividends per share (cents)
60%
56%
69% 27.7%
04 0553c
05
20c
10c
44c
13c
18c
8c
28c
29c
05
73%
01 02 03 04 0501 02 03 04 0501
05
62c
34c
52c
11%
6%
9%
4%
6%
7
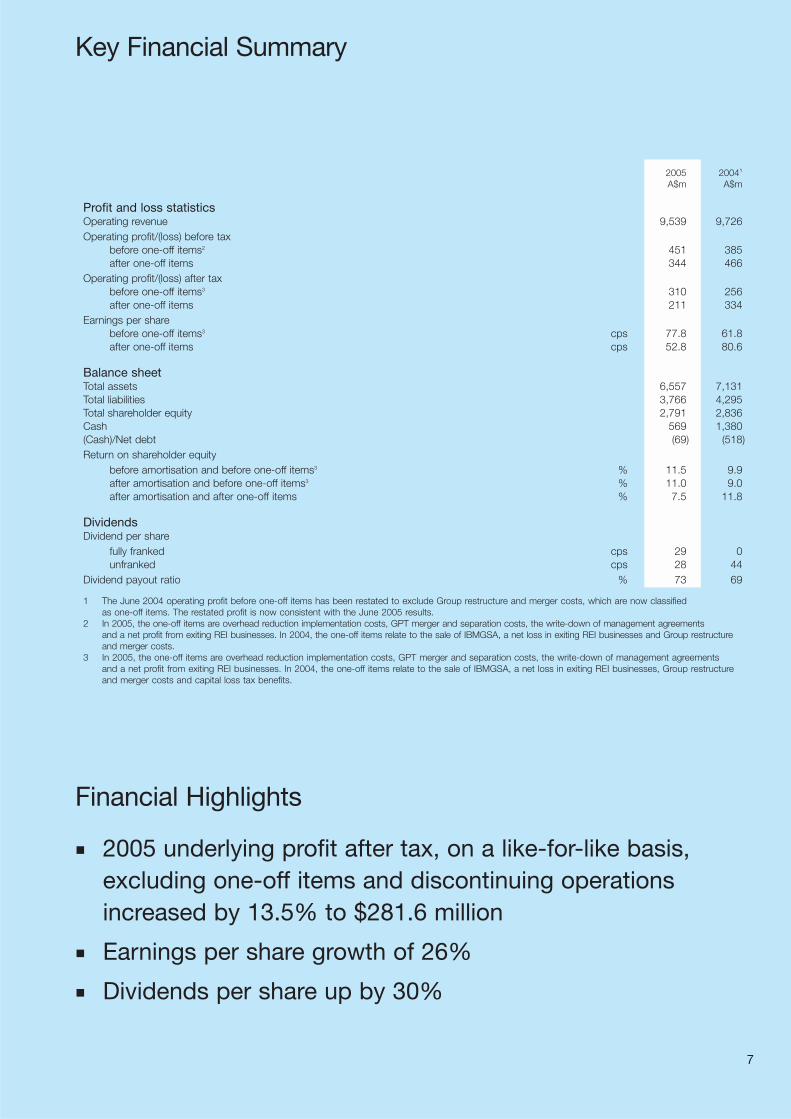
2005 20041
A$m A$m
Profit and loss statisticsOperating revenue 9,539 9,726Operating profit/(loss) before tax
before one-off items2 451 385after one-off items 344 466
Operating profit/(loss) after taxbefore one-off items3 310 256after one-off items 211 334
Earnings per sharebefore one-off items3 cps 77.8 61.8after one-off items cps 52.8 80.6
Balance sheetTotal assets 6,557 7,131Total liabilities 3,766 4,295Total shareholder equity 2,791 2,836Cash 569 1,380(Cash)/Net debt (69) (518)Return on shareholder equity
before amortisation and before one-off items3 % 11.5 9.9after amortisation and before one-off items3 % 11.0 9.0after amortisation and after one-off items % 7.5 11.8
DividendsDividend per share
fully franked cps 29 0unfranked cps 28 44
Dividend payout ratio % 73 69
1 The June 2004 operating profit before one-off items has been restated to exclude Group restructure and merger costs, which are now classified as one-off items. The restated profit is now consistent with the June 2005 results.
2 In 2005, the one-off items are overhead reduction implementation costs, GPT merger and separation costs, the write-down of management agreements and a net profit from exiting REI businesses. In 2004, the one-off items relate to the sale of IBMGSA, a net loss in exiting REI businesses and Group restructureand merger costs.
3 In 2005, the one-off items are overhead reduction implementation costs, GPT merger and separation costs, the write-down of management agreements and a net profit from exiting REI businesses. In 2004, the one-off items relate to the sale of IBMGSA, a net loss in exiting REI businesses, Group restructure and merger costs and capital loss tax benefits.
Financial Highlights
2005 underlying profit after tax, on a like-for-like basis,excluding one-off items and discontinuing operationsincreased by 13.5% to $281.6 million
Earnings per share growth of 26%
Dividends per share up by 30%
Key Financial Summary

8
Global Executive Management Team
Greg ClarkeChief Executive Officer
Roger BurrowsChief Financial Officer
Rob LoureyHead of Human Resources
Julian DanielHead of Environment, Health and Safety

9
The Lend Lease Group strategy is to provide end-to-end integrated property skills;focus on the right sectors, niches and geographies; and deliver this proposition via a disciplined management structure.
Over the past 18 months, the Group has secured growth opportunities in its Retail and Communities; Project Management, Construction and PFI; and InvestmentManagement businesses in each of its key geographic markets.
The Lend Lease executive management structure reflects this clear operational focus,supports the businesses and is aligned to the Group’s long term growth strategy.
Bob JohnstonChief Executive Officer,Project Management, Construction and PFI
Ross TaylorChief Executive Officer,Retail and Communities
Steve McCannChief Executive Officer,Investment Management

10
Retail andCommunitiesSummary
Quick Facts from financial year ending 30 June 2005
Total number of centres managed by Lend Lease group at financial year end
181
Total area under Lend Lease fund/asset management at financial year end
734,753sqmTotal value of assets under Lend Lease management
A$8.6B1
Total net lettable area of assetsunder development in the UK
162,250sqmNumber of shopping bags saved in Lend Lease managed centres in Australia following the Group’sparticipation in a nationwiderecycling scheme
32MValue of new commercialisationdeal for centres currentlymanaged by Lend Lease in the UK
£22.5M
Retail and Communities Profit After Tax (PAT)
A$102.5M Percentage contribution to PAT from core operating businesses
Percentage increase in PATcompared with financial yearending 30 June 2004
14.5%
Retail property is a sector in which Lend Lease sees thepotential for significant ongoing growth. In the UK, theGroup has a substantial retail portfolio which it is activelygrowing. In Asia Pacific, Lend Lease will continue tomanage and redevelop the assets in the APPF RetailFund and capitalise on new opportunities, includingthose generated by its master planned communitiesspecialist, Delfin Lend Lease.
29%
Sector Financial Highlights for financial year ending 30 June 2005
1 Management includes fund and/or asset and/or property management.
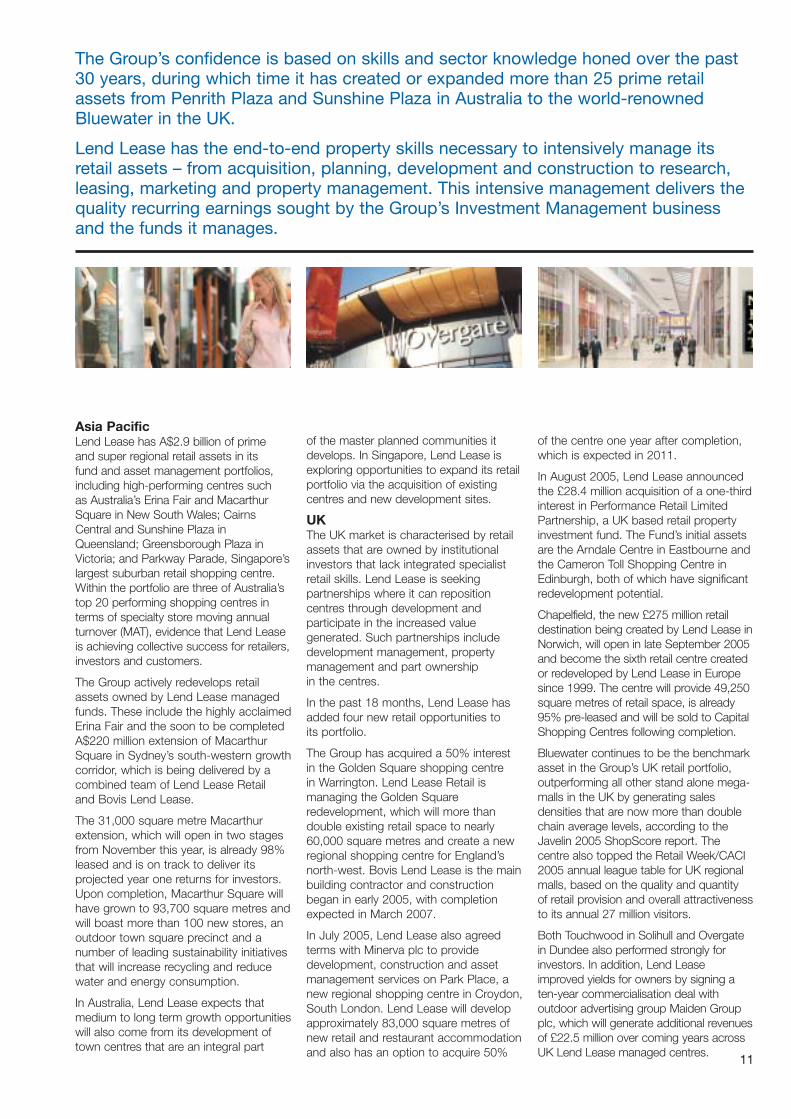
The Group’s confidence is based on skills and sector knowledge honed over the past30 years, during which time it has created or expanded more than 25 prime retailassets from Penrith Plaza and Sunshine Plaza in Australia to the world-renownedBluewater in the UK.
Lend Lease has the end-to-end property skills necessary to intensively manage itsretail assets – from acquisition, planning, development and construction to research,leasing, marketing and property management. This intensive management delivers thequality recurring earnings sought by the Group’s Investment Management businessand the funds it manages.
Asia PacificLend Lease has A$2.9 billion of prime and super regional retail assets in its fund and asset management portfolios,including high-performing centres such as Australia’s Erina Fair and MacarthurSquare in New South Wales; CairnsCentral and Sunshine Plaza inQueensland; Greensborough Plaza inVictoria; and Parkway Parade, Singapore’slargest suburban retail shopping centre.Within the portfolio are three of Australia’stop 20 performing shopping centres interms of specialty store moving annualturnover (MAT), evidence that Lend Leaseis achieving collective success for retailers,investors and customers.
The Group actively redevelops retailassets owned by Lend Lease managedfunds. These include the highly acclaimedErina Fair and the soon to be completedA$220 million extension of MacarthurSquare in Sydney’s south-western growthcorridor, which is being delivered by acombined team of Lend Lease Retail and Bovis Lend Lease.
The 31,000 square metre Macarthurextension, which will open in two stagesfrom November this year, is already 98%leased and is on track to deliver itsprojected year one returns for investors.Upon completion, Macarthur Square willhave grown to 93,700 square metres andwill boast more than 100 new stores, anoutdoor town square precinct and anumber of leading sustainability initiativesthat will increase recycling and reducewater and energy consumption.
In Australia, Lend Lease expects thatmedium to long term growth opportunitieswill also come from its development oftown centres that are an integral part
of the master planned communities itdevelops. In Singapore, Lend Lease isexploring opportunities to expand its retailportfolio via the acquisition of existingcentres and new development sites.
UKThe UK market is characterised by retailassets that are owned by institutionalinvestors that lack integrated specialistretail skills. Lend Lease is seekingpartnerships where it can repositioncentres through development andparticipate in the increased valuegenerated. Such partnerships includedevelopment management, propertymanagement and part ownership in the centres.
In the past 18 months, Lend Lease hasadded four new retail opportunities to its portfolio.
The Group has acquired a 50% interestin the Golden Square shopping centre in Warrington. Lend Lease Retail ismanaging the Golden Squareredevelopment, which will more thandouble existing retail space to nearly60,000 square metres and create a newregional shopping centre for England’snorth-west. Bovis Lend Lease is the mainbuilding contractor and constructionbegan in early 2005, with completionexpected in March 2007.
In July 2005, Lend Lease also agreedterms with Minerva plc to providedevelopment, construction and assetmanagement services on Park Place, anew regional shopping centre in Croydon,South London. Lend Lease will developapproximately 83,000 square metres ofnew retail and restaurant accommodationand also has an option to acquire 50%
of the centre one year after completion,which is expected in 2011.
In August 2005, Lend Lease announcedthe £28.4 million acquisition of a one-thirdinterest in Performance Retail LimitedPartnership, a UK based retail propertyinvestment fund. The Fund’s initial assetsare the Arndale Centre in Eastbourne andthe Cameron Toll Shopping Centre inEdinburgh, both of which have significantredevelopment potential.
Chapelfield, the new £275 million retaildestination being created by Lend Lease inNorwich, will open in late September 2005and become the sixth retail centre createdor redeveloped by Lend Lease in Europesince 1999. The centre will provide 49,250square metres of retail space, is already95% pre-leased and will be sold to CapitalShopping Centres following completion.
Bluewater continues to be the benchmarkasset in the Group’s UK retail portfolio,outperforming all other stand alone mega-malls in the UK by generating salesdensities that are now more than doublechain average levels, according to theJavelin 2005 ShopScore report. Thecentre also topped the Retail Week/CACI2005 annual league table for UK regionalmalls, based on the quality and quantity of retail provision and overall attractivenessto its annual 27 million visitors.
Both Touchwood in Solihull and Overgatein Dundee also performed strongly forinvestors. In addition, Lend Leaseimproved yields for owners by signing aten-year commercialisation deal withoutdoor advertising group Maiden Groupplc, which will generate additional revenuesof £22.5 million over coming years acrossUK Lend Lease managed centres.
11

12
“Chapelfield is one of the most exciting developments inthe country. It will transformNorwich, bringing life andvitality into the city centre.”
Rt Hon Charles Clarke, Member ofParliament for Norwich South and British Home Secretary
Lend Lease had the vision and expertiseto convert a quarry in the English countyof Kent into one of Europe’s largest retaildestinations. This capability wascombined with a commitment tounderstanding stakeholders’expectations. The result is Bluewater, ahighly valuable, award winning retail assetthat is stimulating the local economy andproviding thousands of jobs for localpeople. Chapelfield, a retail led mixed-use development, due to open inSeptember 2005, is set to follow inBluewater’s footsteps and have a positiveeffect on Norwich’s local economy andcommunity.
Norwich is a vibrant city that embracesits mediaeval history and takes pride inbeing one of Britain’s top 10 shoppingdestinations. Over the past decade, morethan £1 billion has been invested in thecity’s regeneration to respond to changesin the local economy while preserving thevalues of the city’s past. The Group’sability to demonstrate an integrated
approach to civic design, communitydevelopment, economic regeneration and sustainability secured the £275million Chapelfield development.
Lend Lease identified the opportunity todevelop the brownfield site of a formerNestlé factory and acquired the land in1999. Enabling works commenced in2002 and local archaeological expertswere consulted to ensure thepreservation of any historical artefactsdiscovered during excavations. As aresult, significant amounts of Romanpottery were uncovered and have sincebeen preserved and exhibited by thelocal council. In addition, more than 94% of the 95,000 tonnes of waste materialproduced when the old factory wasdemolished was reclaimed or recycled.
The site has now been transformed intopart of a new area combining 49,250square metres of retail space with 17cafés and restaurants. Reflecting nationalplanning policy aims and regional mixed-use aspirations, the development alsoincludes 118 new residential apartments.Months before completion, Chapelfieldhas attracted a number of top UK andinternational retailers and is already 95%committed in leasing terms, boosting thecity’s ambition of becoming one of theUK’s top five shopping destinations by 2008.
Chapelfield will also help reduceunemployment in Norwich, which hasbeen aggravated by the demise of thelocal manufacturing sector, by generatingnew employment opportunities in theretail, tourism and service industries.When complete, Chapelfield will providefull and part-time employment for up to2,000 people. Similarly, the developmentcreated more than 800 jobs duringconstruction. As at Bluewater, LendLease initiated a Jobshop at theChapelfield construction site, whichsecured employment for nearly 1,500people in the surrounding communityduring the last three years of construction.
Chapelfield has already scooped anumber of awards, confirming thesuccess of Lend Lease’s approach. In the past 12 months, accolades include the Retail Week Award for Urban Design Integration at the MAPIC2004 international property expo; twiceachieving an unprecedented maximumscore in the UK’s ConsiderateContractors scheme following annual site audits; and a Silver Green AppleAward for Environmental Best Practice.

13
Retail Case Study: Chapelfield, Norwich, Norfolk, UK

Retail andCommunitiesSummary
39,800
59,600
03 04 05
Lend Lease Communities in Australia, the UK and the USprovides a stable platform for long term growth. TheGroup’s integrated planning, development, constructionand investment management capabilities give LendLease a significant advantage in this sector.
14
Quick Facts from financial year ending 30 June 2005
Communities trading in Australia
37Invested in acquisition of UKurban regeneration specialists The Crosby Group
£261MIncrease in profit recorded by Actus Lend Lease
325%
Development pipeline in Australia
224sqkmCommercial space to be developed in UK
418,000sqmValue of US projects already secured for next 50 years
US$14B
Total backlog of lots globallyexcluding The Crosby Group’s backlog of lots
120,633 Backlog of residential lots in Australia
Estimated number of operationalresidential units managed byActus Lend Lease
Sector Financial Highlights for financial year ending 30 June 2005
77,933
7,60011,900
03 04 05
24,300
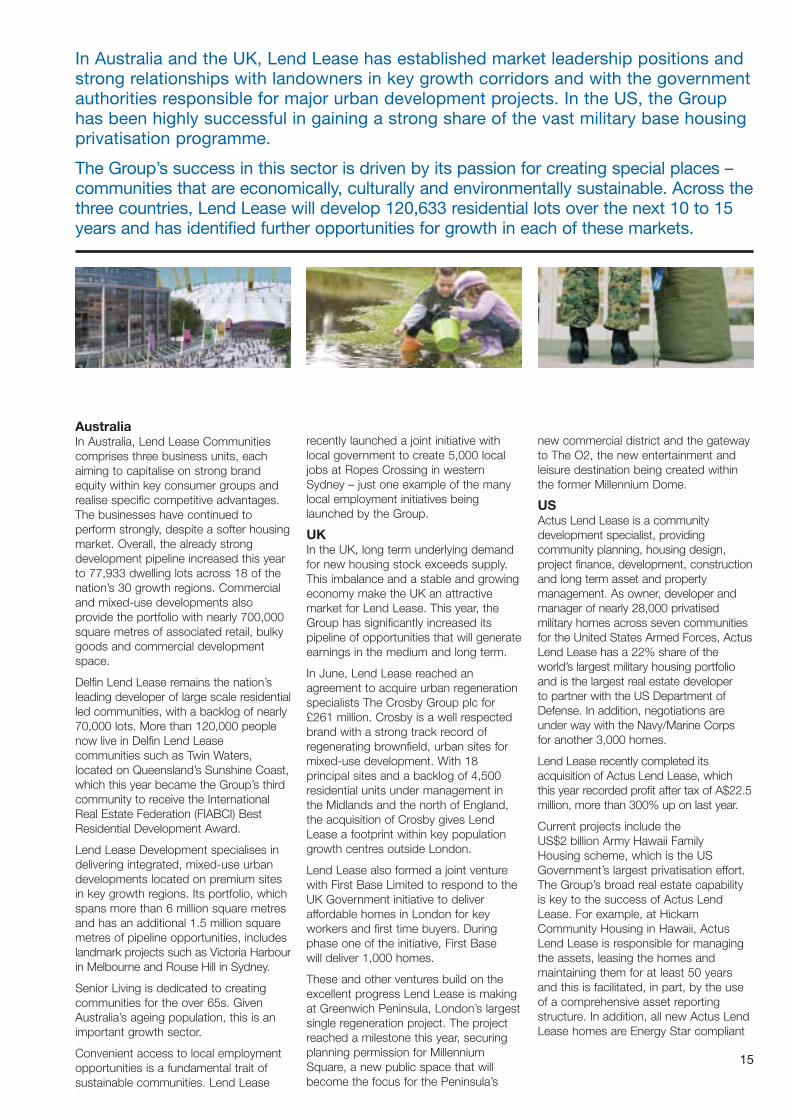
In Australia and the UK, Lend Lease has established market leadership positions andstrong relationships with landowners in key growth corridors and with the governmentauthorities responsible for major urban development projects. In the US, the Grouphas been highly successful in gaining a strong share of the vast military base housingprivatisation programme.
The Group’s success in this sector is driven by its passion for creating special places –communities that are economically, culturally and environmentally sustainable. Across thethree countries, Lend Lease will develop 120,633 residential lots over the next 10 to 15years and has identified further opportunities for growth in each of these markets.
AustraliaIn Australia, Lend Lease Communitiescomprises three business units, eachaiming to capitalise on strong brandequity within key consumer groups andrealise specific competitive advantages.The businesses have continued toperform strongly, despite a softer housingmarket. Overall, the already strongdevelopment pipeline increased this yearto 77,933 dwelling lots across 18 of thenation’s 30 growth regions. Commercialand mixed-use developments alsoprovide the portfolio with nearly 700,000square metres of associated retail, bulkygoods and commercial developmentspace.
Delfin Lend Lease remains the nation’sleading developer of large scale residentialled communities, with a backlog of nearly70,000 lots. More than 120,000 peoplenow live in Delfin Lend Leasecommunities such as Twin Waters,located on Queensland’s Sunshine Coast,which this year became the Group’s thirdcommunity to receive the InternationalReal Estate Federation (FIABCI) BestResidential Development Award.
Lend Lease Development specialises indelivering integrated, mixed-use urbandevelopments located on premium sitesin key growth regions. Its portfolio, whichspans more than 6 million square metresand has an additional 1.5 million squaremetres of pipeline opportunities, includeslandmark projects such as Victoria Harbourin Melbourne and Rouse Hill in Sydney.
Senior Living is dedicated to creatingcommunities for the over 65s. GivenAustralia’s ageing population, this is animportant growth sector.
Convenient access to local employmentopportunities is a fundamental trait ofsustainable communities. Lend Lease
recently launched a joint initiative withlocal government to create 5,000 localjobs at Ropes Crossing in westernSydney – just one example of the manylocal employment initiatives beinglaunched by the Group.
UKIn the UK, long term underlying demandfor new housing stock exceeds supply.This imbalance and a stable and growingeconomy make the UK an attractivemarket for Lend Lease. This year, theGroup has significantly increased itspipeline of opportunities that will generateearnings in the medium and long term.
In June, Lend Lease reached anagreement to acquire urban regenerationspecialists The Crosby Group plc for£261 million. Crosby is a well respectedbrand with a strong track record ofregenerating brownfield, urban sites formixed-use development. With 18principal sites and a backlog of 4,500residential units under management inthe Midlands and the north of England,the acquisition of Crosby gives LendLease a footprint within key populationgrowth centres outside London.
Lend Lease also formed a joint venturewith First Base Limited to respond to theUK Government initiative to deliveraffordable homes in London for keyworkers and first time buyers. Duringphase one of the initiative, First Base will deliver 1,000 homes.
These and other ventures build on theexcellent progress Lend Lease is makingat Greenwich Peninsula, London’s largestsingle regeneration project. The projectreached a milestone this year, securingplanning permission for MillenniumSquare, a new public space that will become the focus for the Peninsula’s
new commercial district and the gatewayto The O2, the new entertainment andleisure destination being created withinthe former Millennium Dome.
USActus Lend Lease is a communitydevelopment specialist, providingcommunity planning, housing design,project finance, development, constructionand long term asset and propertymanagement. As owner, developer andmanager of nearly 28,000 privatisedmilitary homes across seven communitiesfor the United States Armed Forces, ActusLend Lease has a 22% share of theworld’s largest military housing portfolioand is the largest real estate developer to partner with the US Department ofDefense. In addition, negotiations areunder way with the Navy/Marine Corps for another 3,000 homes.
Lend Lease recently completed itsacquisition of Actus Lend Lease, which this year recorded profit after tax of A$22.5million, more than 300% up on last year.
Current projects include the US$2 billion Army Hawaii Family Housing scheme, which is the USGovernment’s largest privatisation effort.The Group’s broad real estate capability is key to the success of Actus LendLease. For example, at HickamCommunity Housing in Hawaii, ActusLend Lease is responsible for managingthe assets, leasing the homes andmaintaining them for at least 50 yearsand this is facilitated, in part, by the useof a comprehensive asset reportingstructure. In addition, all new Actus LendLease homes are Energy Star compliant
15

Communities Case Study: Tri-Command Military Housing,Beaufort/Parris Island, South Carolina, US
16
17
“I’ve been in the Navy for 25years and this is the first timewe’ve ever wanted to live inbase housing.”A resident of Wake Village, an Actus Lend Lease community on Parris Island
Passionate about creating sustainable,safe, social environments, Actus LendLease provides US military families withhomes in communities that reflect theideals their residents serve to protect.
When Actus Lend Lease won theUS$977 million Tri-Command MilitaryHousing (TCMH) project in South Carolinain 2002, it was the Navy’s largest publicprivate venture. It encompasses theconstruction of nearly 500 units,renovation of over 1,000 units, demolitionof 330 units and development of newcommunity facilities at Marine CorpsRecruit Depot, Parris Island, the NavalHospital, Beaufort and the Marine CorpsAir Station, Beaufort.
The project is about halfway through theinitial development programme. Residentsare enjoying new energy efficient homesand recreational facilities, including acommunity centre, swimming pool andfitness centre with attached playroom.Each has been architecturally styled toreflect the area’s culture and traditions.
Low income families have also been givenan opportunity to become homeowners.Nearly 100 homes on the periphery of thedevelopment area were relocated fromthe TCMH project and refurbished, withappliances and fixtures recycled wherepossible. This additional project alsoprevented the disposal of 4,000 tonnes of building waste in local landfills.
Over the past year, TCMH has earnedmany accolades, including the NationalApartment Association Paragon Awardfor occupancy rate/retention, propertymaintenance, excellence in interior andexterior layout, environmental awarenessand community development. TCMH alsowon the National Multi-family CustomerService Award for Excellence afterachieving the highest resident satisfactionscores (85%) in the country.
Initial development at Beaufort and ParrisIsland will be completed in 2007, withownership and management by ActusLend Lease extending to 2053.
18
Investment ManagementSummary
Lend Lease launched Australia’s first unlisted propertytrust in 1959 and the nation’s leading unlisted propertyfund, Australian Prime Property Fund (APPF) in 1989. In 1971, the Group formed the iconic Australian listedproperty trust General Property Trust (GPT) and managedit until June 2005, when unitholders voted to internaliseits management.
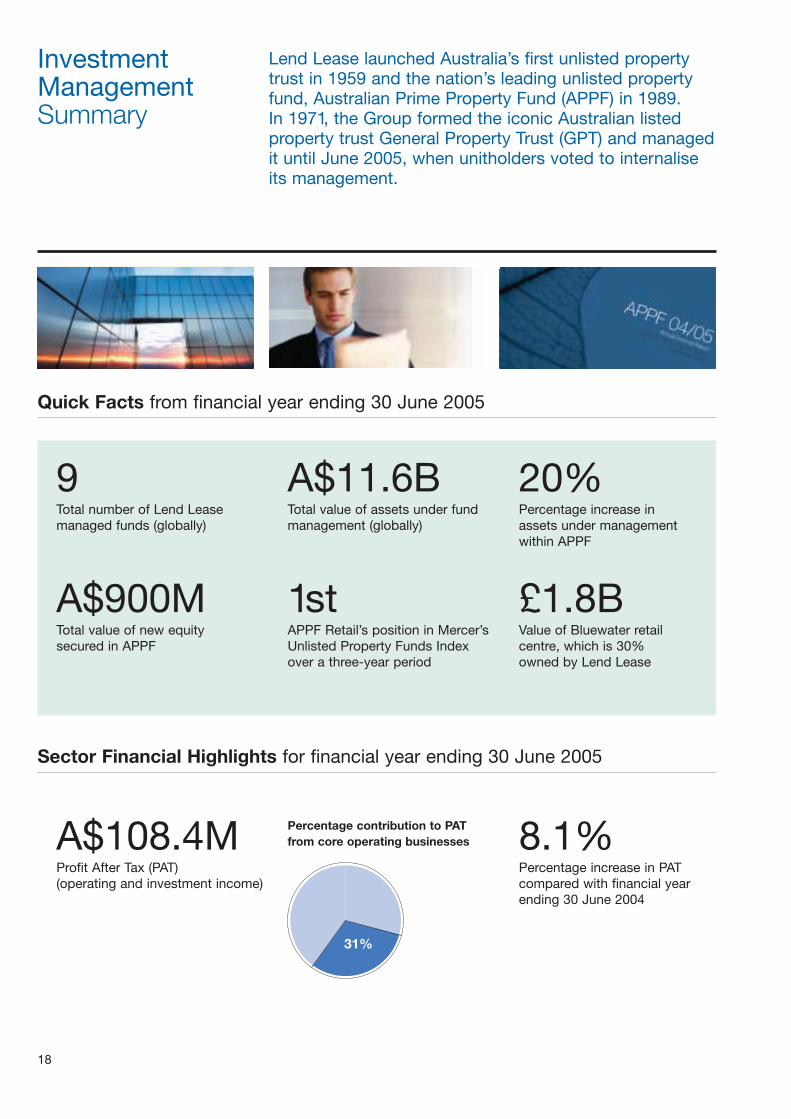
Quick Facts from financial year ending 30 June 2005
Total number of Lend Leasemanaged funds (globally)
9Total value of assets under fundmanagement (globally)
A$11.6BPercentage increase in assets under management within APPF
20%
Total value of new equity secured in APPF
A$900MAPPF Retail’s position in Mercer’sUnlisted Property Funds Index over a three-year period
1stValue of Bluewater retail centre, which is 30% owned by Lend Lease
£1.8B
Profit After Tax (PAT) (operating and investment income)
A$108.4M Percentage contribution to PAT from core operating businesses
Percentage increase in PATcompared with financial yearending 30 June 2004
8.1%
Sector Financial Highlights for financial year ending 30 June 2005
31%

19
Lend Lease now manages A$11.6 billion in property assets on behalf of clients and shareholders.
The Group is focused on becoming a market innovator by leveraging its extensive real estate skills, including construction, development and management. Lend Leasesees growth potential for its investment management business in Asia Pacific and the UK from opportunities identified within its retail and communities businesses.
Asia PacificLend Lease manages seven unlistedfunds and a number of separate accountmandates in Asia Pacific, with a value ofmore than A$5.3 billion, on behalf ofmore than 60 investors. Two funds, APPF Retail and APPF Commercial, have joint ownership agreements withGPT on five assets and the decision by GPT unitholders to internalise themanagement of the trust will have noimpact on these funds.
This year, Lend Lease increased itsinvestment in APPF to A$350.9 million.An additional A$900 million in equity wasalso secured from external investors inAPPF. This record equity in-flow adds tomore than A$1 billion equity raised overthe previous three years and is testimonyto institutional confidence in the APPFfunds, which now have A$3 billion in assets under management.
APPF Retail increased funds undermanagement in its portfolio of eightshopping centres to A$2.4 billion andagain exceeded its targeted andbenchmark returns. It generated one andthree-year pre-fee returns of 17.4% and16.8% respectively, well above the 13.4%and 12.1% generated by the MercerUnlisted Property Funds Index, making it the leading fund in the index over thethree-year period. In addition, nearlyA$600 million of value-enhancingexpansion potential has been identified in APPF Retail’s portfolio over the nextfive years.
APPF Commercial raised A$336 million in additional equity during the past 18 months and delivered one and three-year pre-fee returns of 13.9%
and 10.5% respectively to June 2005,outperforming its benchmark, theProperty Council Australian CBD OfficeIndex, which returned 8.9% and 7.6%during the same period.
APPF Industrial completed two acquisitionsduring the financial year, taking the totalvalue of its assets to A$211 million anddelivered strong one and three-year pre-feereturns of 11.9% and 12.1%.
Just over a year into its four-yearinvestment period, Lend Lease RealEstate Partners 2 is 22.6% invested. Twocommercial buildings have been acquiredfor strata sub-division and sale togenerate enhanced returns for investors.
The first Asia Pacific Investment Companyfund (APIC) executed its divestmentstrategy in 2004 and sold its commercialassets in Hong Kong for HK$579 million,representing an 18% premium tovaluation. APIC expects to divest itsremaining assets during the next financialyear and subsequently wind down itsactivities as mandated by its shareholders.
APIC 2 continued to perform strongly,achieving a total return of 22.2% over the 12 months to April 2005. ParkwayParade, the largest suburban retailshopping mall in Singapore, remains the prime asset in its portfolio.
The Group’s joint venture with marketleader Resolution Capital, which managesa listed property securities portfolio worthmore than A$2.9 billion for externalinvestors, has outperformed benchmarkreturns by an average of 1.6% over thepast three years. Resolution Capital is now assessing a range of opportunities to grow
through new products and markets for thebenefits of its clients.
UKThe Group’s Investment Managementactivities in the UK are focused on retailcentres. The company manages twounlisted funds for 38 investors; the LendLease Retail Partnership (LLRP) and theLend Lease Overgate Partnership (LLOP).
The total value of assets undermanagement within LLRP, which owns25% of Bluewater in Kent and 100% ofTouchwood in Solihull, is now £708million. Bluewater, valued at £1.8 billion,has performed exceptionally well over thelast financial year, contributing to theFund delivering one and three-yearreturns of 18.2% and 17.0% to June2005. In addition, Lend Lease has a 30%direct interest in Bluewater.
LLOP also performed well, with assetsunder management valued at £158million. Overgate attracted more than 13 million visitors, which helped generatetotal one and three–year returns of 19.2%and 14.3% to June 2005.
USIn the US, Lend Lease holds a 50%share of the partnership that owns theKing of Prussia mall in Pennsylvania, thelargest enclosed shopping area on theUS eastern seaboard. The centre earnedLend Lease US$17.5 million in profitbefore taxes this financial year and wasrevalued on a free and clear basis atUS$869 million, an increase of 17% on the previous year. This increases the Group’s interest in the partnership to US$276 million.
20
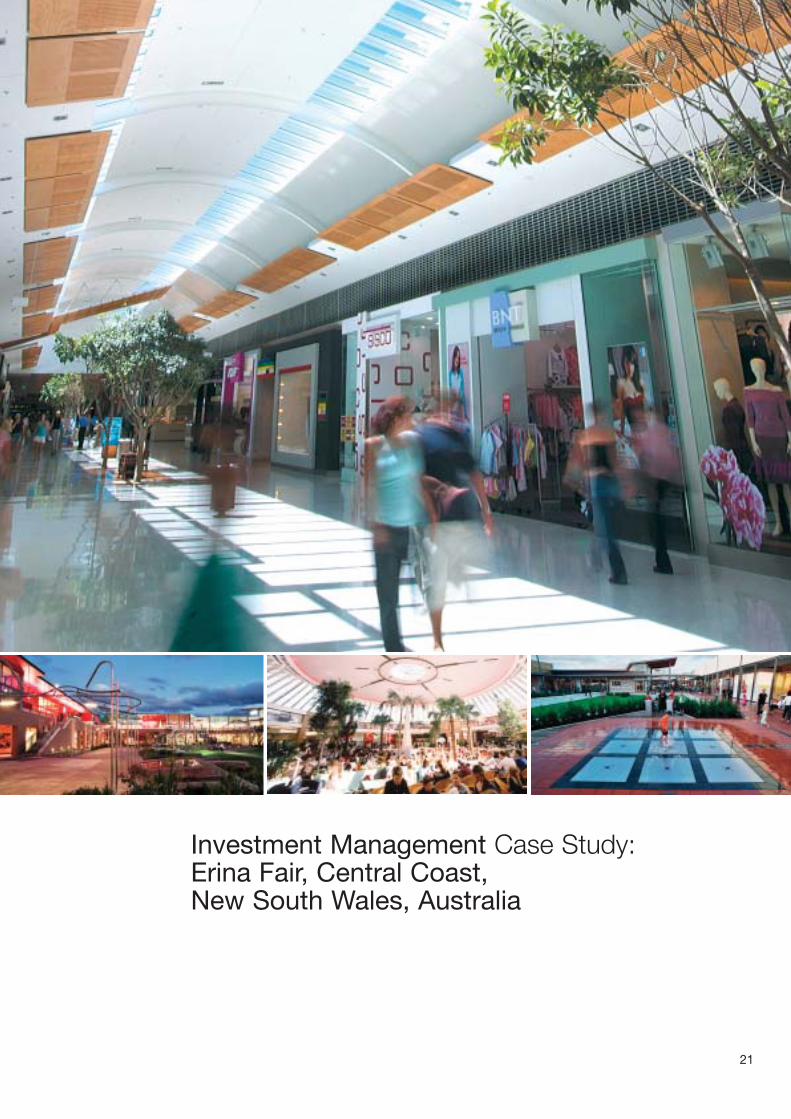
“I want to see more shoppingcentres follow their lead byimproving the quality ofarchitecture and theconnections with thesurrounding public domain.”Bob Carr, former Premier of New SouthWales 1995–2005
APPF Retail invests in super regional andregional shopping centres that are locatedin growth corridors, dominate their tradeareas and have expansion capacity. APPFRetail is focused on enhancing fundreturns by maximising the performance ofits eight high quality assets. The Fund’smaster plan expansion process is key todelivering ongoing enhancements acrossthe portfolio and takes a long term, top-down strategic approach to improving a centre’s performance.
In 1992, the Fund acquired 50% of Erina Fair, located near Gosford, 80 kmnorth of Sydney on the fast growingCentral Coast. Since acquisition, thecentre has undergone three majorrefurbishment and expansionprogrammes. The recent A$212 millionexpansion was managed by Lend LeaseProperty Management and constructedby Bovis Lend Lease. Completed inNovember 2003, it has made Erina Fairthe largest asset by size and value inAPPF Retail.
Lend Lease recognises that large retailcentres act as a focal point for thecommunity and undertook extensivecommunity-led qualitative, quantitativeand economic research before the latestredevelopment. Results indicated that the Central Coast’s increasingly affluentpopulation wanted more than just a retailcentre. They wanted a social hub thatprovided a unique combination of retail,leisure and community functions, andreflected the positive ethos of thecommunity. Accordingly, the latestexpansion aimed to satisfy thecommunity’s needs, providing a socially,commercially and environmentallysustainable outcome that increasedunitholder value in the short and long term.
Erina Fair now includes over 300specialty, mini major and major shopsand bulky goods retail and restaurantprecincts. Lifestyle precincts including a health club, ice-skating rink and amultiplex cinema, together withcommunity facilities (library, communityhall and youth centre) comprise morethan 10% of Gross Lettable Area. A passive ventilation system installed in the food court saves enough energy to run five homes each year. Theredevelopment has created more than1,100 retail jobs and sales have reachedA$566 million per year, ranking the centreeleventh in the country by total retail
sales (Big Guns 2005 Shopping CentreNews survey, published December 2004).
The expansion has already delivered ayear one yield on development cost of8%. Capital spend, development profitsand strengthening yields in the retailsector have seen the centre increase in value from A$380 million in 2002 toA$705 million in 2004. This significantcontribution to the Fund’s performancehelped it retain its position as the leaderin the Mercer Unlisted Property FundsIndex over a three-year period, with atotal return of 16.8% against thebenchmark of 12.1%.
This success reflects the fully integratedapproach offered by the Lend LeaseGroup from research through to retailmanagement, design, development andconstruction. Lend Lease continues tofocus on the intensive management ofErina Fair and in line with the Fund’s long term master planning strategy, is considering the next phase ofimprovements for the centre.
21
Investment Management Case Study: Erina Fair, Central Coast, New South Wales, Australia
ProjectManagement,Construction and PFISummary
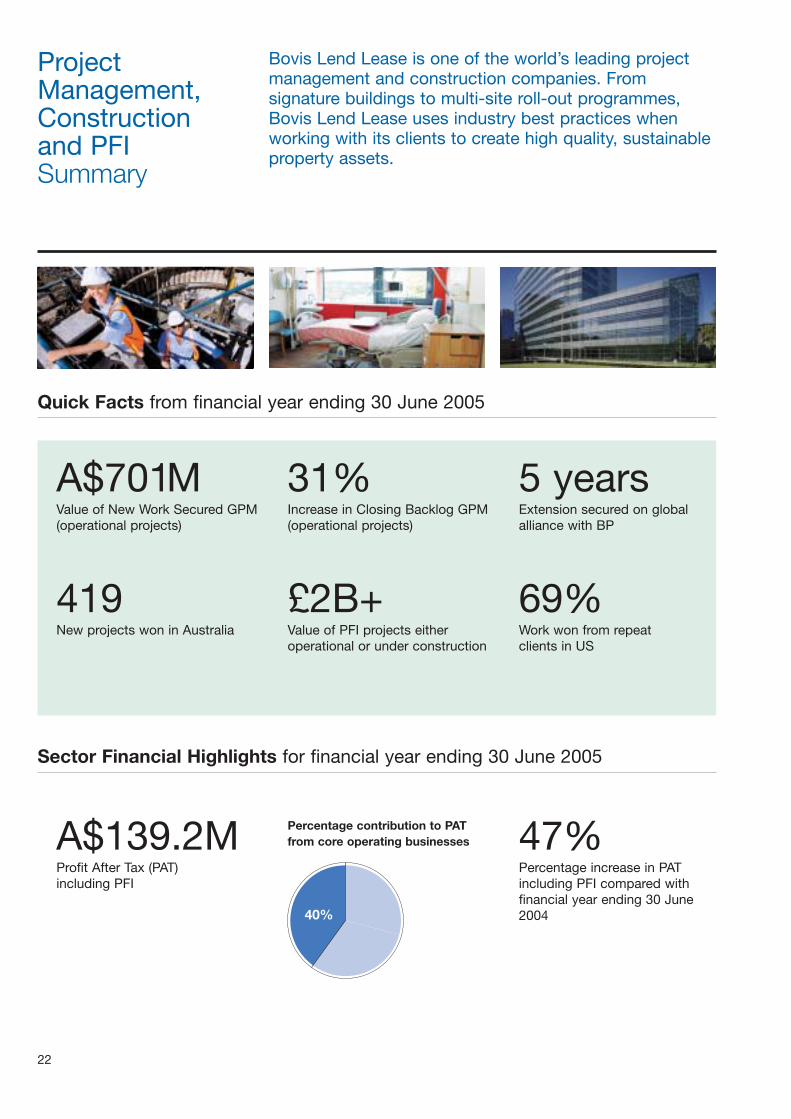
Bovis Lend Lease is one of the world’s leading projectmanagement and construction companies. Fromsignature buildings to multi-site roll-out programmes,Bovis Lend Lease uses industry best practices whenworking with its clients to create high quality, sustainableproperty assets.
22
Quick Facts from financial year ending 30 June 2005
Value of New Work Secured GPM(operational projects)
A$701MIncrease in Closing Backlog GPM(operational projects)
31%Extension secured on global alliance with BP
5 years
New projects won in Australia
419 Value of PFI projects eitheroperational or under construction
£2B+Work won from repeat clients in US
69%
Profit After Tax (PAT) including PFI
A$139.2M Percentage contribution to PAT from core operating businesses
Percentage increase in PATincluding PFI compared withfinancial year ending 30 June2004
47%
Sector Financial Highlights for financial year ending 30 June 2005
40%

The Group has a presence in over 40 countries and operates in many sectors including commercial, retail, residential, communications, industrial, healthcare and defence. Bovis Lend Lease has also established a presence in the growingEuropean Private Finance Initiative (PFI) and Public Private Partnerships (PPP) markets, particularly in the UK.
Lend Lease is committed to operating Incident & Injury Free wherever it has apresence. Bovis Lend Lease champions this philosophy across all locations andactively encourages this attitude among its clients, suppliers, subcontractors and partners.
Asia PacificBovis Lend Lease Australia is once againpositioned for reliable profitability and thebusiness remains focused on commercial,retail and residential markets with agrowing presence in the transport andinfrastructure sectors. The total value ofnew contracts secured this year is overA$1 billion.
Several alliances have been formed withpublic sector partners, such as theGroup’s appointment as leader of theNetworks Alliance, a A$250 million four-year programme to upgrade Sydney’swater supply network. Bovis Lend Leasealso secured the design and construct role for the Queensland Government’sMillennium Arts Project and theconstruction and fit-out of One NationalCircuit, the new headquarters for theDepartment of the Prime Minister andCabinet in Canberra.
Bovis Lend Lease continues to receivepraise for constructing architecturallyoutstanding commercial real estate. The Bond – the Lend Lease Groupheadquarters in Sydney – was designed,developed, project managed andconstructed by the Group and hasbecome the first commercial building to win the Australian ConstructionAchievement Award for establishing newbenchmarks in environmentalsustainability, social benefit, technologyapplication and design excellence.
In Asia, Bovis Lend Lease is focused onwinning repeat business from multinationalclients such as Vodafone, with whom thelong standing relationship to roll-out 3Gbase stations in Japan has just beenextended. Other significant new projectsinclude a US$25 million pharmaceuticalproject for General Electric Healthcare in
Shanghai, the fifth project in three yearsfor this client. In the retail and leisuresectors, new projects include theCentrepoint Shopping Centre extension inSingapore and new phases for the awardwinning Trisara Resorts in Thailand.
Europe, Middle East and AfricaFor the fourth year in succession, BovisLend Lease is one of the UK leaders fornew work awarded, with projects worthalmost £2 billion.
Repeat business continues to constitutea large part of the order book, with newprojects secured for key existing clientssuch as Stanhope, BPB and Grosvenor.Bovis Lend Lease also secured a five-year extension to its eight-year-oldglobal alliance with BP, confirming thestrong relationship with this key client.
In the Middle East, Bovis Lend Lease is currently managing 10 constructionprojects valued in excess of €3.5 billion,including project management of the€450 million Durrat Al Khaleei mixed-useresort development in Bahrain.
Continental Europe recorded a 75%increase in profit, with new projectsincluding project management of twonew commercial developments inPrague, together valued at €142 million.
The Group also became part of theconsortium that won Madrid’s firsthealthcare PFI contract for a new €150million hospital in Majadahonda. This builton a strong year for the UK PFI business,which reached financial close on twomajor healthcare facilities in Manchesterand Leeds worth £557 million.
Vita Lend Lease, the Group’s facilitiesand estates management business, now
has over 210,000 square metres ofspace under management at variousLend Lease PFI and retail properties,including a National Health Service Trusthospital in Worcester and the Bluewaterretail and leisure destination in Kent.
AmericasThis year, Bovis Lend Lease beganconstruction on 181 projects with anapproximate construction value ofUS$5.5 billion.
The majority of these projects are for keyclients with whom Bovis Lend Lease hasbuilt long term relationships, such as theTrump Organization. Work is currentlyunder way on the Trump InternationalHotel and Tower in Chicago, the seventhhigh-rise project for the client.
Estimated revenues from Bovis LendLease’s commercial/office sector exceedUS$760 million including the 71 SouthWacker-Hyatt Center, named 2005Development of the Year (CommercialReal Estate).
Sustainability remains an area of focus for Bovis Lend Lease. The Group isworking on a number of properties thathave attained or are aiming for LEED(Leadership in Energy and EnvironmentalDesign) certification. Bovis Lend Leasedelivered HSBC’s Corporate Building inMexico, one of the first buildings in LatinAmerica to achieve LEED certification.
Bovis Lend Lease was also credited for“setting new standards in safety inBoston” (Boston Building Trades), aftermaintaining an excellent safety record overthe 2 million hours required to constructstate-of-the-art research and developmentlaboratories for Merck Research.
23

24
Project Management, Construction and PFI Case Study: Deutsche Bank Place, Sydney, New South Wales, Australia
25
“Bovis Lend Lease haseffectively project managedthe design and construction of this sophisticated project to deliver maximum value fora realistic cost. The result is a high quality asset which is sustainable in respect ofoperational costs and capitalappreciation.”Peter Malpass, Project director, theInvesta Property Group – developerand owner of Deutsche Bank Place
Bovis Lend Lease has a long history ofdelivering award winning, architecturallyinnovative real estate across the globe.This is clearly evident in Sydney, wherethe Group has worked on landmarkssuch as the MLC Centre, past andpresent Lend Lease headquarters atAustralia Square and The Bond, and the Renzo Piano-designed Aurora Place.
By effectively collaborating withinternationally renowned architects suchas Harry Seidler, Renzo Piano BuildingWorkshop and Lord Norman Foster,Bovis Lend Lease is able to turnarchitectural vision into commerciallyviable reality. This capability andexperience has been fundamental in delivering Deutsche Bank Place – a new landmark in Sydney’s central business district (CBD).
The development had been on thedrawing board for nearly five years when Bovis Lend Lease was engagedas design, project and constructionmanager. Lord Norman Fosterenvisioned a radical departure fromtraditional office design, so Bovis LendLease worked with the designer andsubcontractors to convert this conceptinto a workable solution. Full-scaleprototypes were used to verify designdetail and manufacturing capability. The team undertook performancetesting which mitigated the safety risksassociated with the more complicatedconstruction tasks. The result is abuilding that sets a new benchmarkin design excellence and innovativeadvanced construction techniques.
The ‘super premium’ tower features a 37-storey full-height atrium – the largestin Australia. The atrium draws daylightinto the floor plates and acts as anexhaust riser for relief air as well as anefficient solar buffer resulting in reducedenergy consumption. Design innovationsby Bovis Lend Lease have resulted inDeutsche Bank Place being the firstremote core tower in Australia, allowingthe 1,440 square metre floor plates tobe column-free. As a result, each floorplate is the length of an Olympicswimming pool. Placing lifts within thedetached core of the building exterior is an evolution in conventional high-risetower design and the open steel-framed
lift shafts provide passengers withexpansive panoramic views of the cityand its harbour.
Deutsche Bank Place has 43,000 squaremetres of lettable space and theincreased efficiency of floor space withinthe building provides significant economicbenefits. Bovis Lend Lease wasinstrumental in securing a pre-leasingagreement with anchor tenant DeutscheBank for 40% of the lettable space andnaming rights for the property. Occupancywas 92% on completion, setting newbenchmarks for the Sydney CBD rentalmarket. The building’s large floor platesalso generate increased rental returns,giving the asset a highly profitable leasingprofile that has significantly exceeded theclient’s expectations in terms of return oninvestment.
Committed tenants for Deutsche BankPlace have also awarded all of the designand construction contracts for office fit-outs to Bovis Lend Lease, furtherendorsing the Group’s ability to createleading edge workplace environments.

26
Index Page
1 Corporate governance at Lend Lease 26
2 Board of Directors 27
2.1 Membership 27
2.2 Role of the Board of Directors 27
2.3 Board composition 28
2.4 Directors’ independence 28
2.5 Chairman 28
2.6 Retirement and re-election of Directors 28
2.7 Succession planning 28
2.8 Induction of new Directors 29
2.9 Resources available to Directors 29
2.10 Briefings and continuing education 29
2.11 Board performance 29
2.12 Shareholdings 29
2.13 Remuneration of Directors 29
2.14 Retirement Plan for Non Executive Directors 29
2.15 Attendance at meetings by Directors 29
2.16 Company Secretaries 29
3 Key Executives 29
3.1 Executive Management Team 29
3.2 Senior Executive performance review 29
3.3 Senior Executive remuneration 29
4 Governance structure 30
5 Board Committees 30
5.1 Membership of Board Committees 30
5.2 Personnel and Organisation Committee 30
5.3 Risk Management and Audit Committee 30
6 Group risk management 31
6.1 Enterprise Risk Management 31
6.2 Integrity in financial reporting, risk management and internal control 32
6.3 External auditors 32
7 Corporate responsibility 32
7.1 Core values and Code of Conduct 32
7.2 Conflicts of interest 33
7.3 Trading in Lend Lease shares 33
7.4 Health and Safety – Incident & Injury Free 33
7.5 Environment 34
7.6 Communication with shareholders 35
7.7 Community support 35
7.8 Political donations 36
8 Compliance with ASX CGC best practice recommendations 37
1 Corporate governance at Lend Lease
The main focus of the Board of Directors is the long term health and prosperity of the Lend Lease Group (Group) for the benefit ofshareholders, customers and employees. In maintaining this focus, the Board recognisesthe importance of pursuing the higheststandards of corporate governance. The Boardcontinually reviews its governance practices to ensure they promote shareholder value,assess the Group’s material risks, and addressthe Group’s obligations as a responsiblecorporate citizen.
This corporate governance report (Report) setsout the key corporate governance principlesand practices adopted by the Board as at 31 August 2005 and, unless otherwise stated,represents the governance practices in placesince the last Annual Report. Lend LeaseCorporation Limited (Lend Lease) is listed onthe stock exchanges of Australia (primarylisting) and New Zealand, and is also registeredwith the Securities and Exchange Commissionin the US in relation to the trading of LendLease shares in the form of sponsoredAmerican Depository Receipts on the over thecounter market. In formulating the governancepractices of Lend Lease, the Board has takeninto account the regulatory requirements andbest practice processes applicable to Australianlisted companies. These governance practicesare supported by regional and local practicesapplicable to the various jurisdictions in whichthe Group operates.
The Australian Stock Exchange CorporateGovernance Council (ASX CGC) Principles ofGood Corporate Governance and Best PracticeRecommendations provide a framework forgood governance and include ten coreprinciples and a number of best practicerecommendations, as well as commentary andguidance. Lend Lease is required to report onthe extent to which it has followed the ASXCGC best practice recommendations on an ‘if not, why not’ basis. If Lend Lease has notfollowed a recommendation, an explanation has been provided in this Report. A summary of our compliance with the ASX CGC bestpractice recommendations is set out at the end of this Report.
In addition, the Group website(www.lendlease.com) has a corporategovernance section containing information on the Group’s governance practices and copies of relevant Group policies.
Corporate Governance

27
2 Board of Directors
2.1 MembershipLend Lease is currently governed by a Board of eight Directors, five Non Executive and three Executive. Details of the membershipof the Board as at the date of this Report are set out in the table below.
Retiring andseeking re-election
Director Independent Appointed Last elected in 2005
Executive Directors^G A ClarkeManaging Director and CEO No 2002 n/a1 n/a1
R H Taylor No 2004 n/a2 YesA Chamberlain No 2004 n/a3 n/a3
Non Executive DirectorsD A CrawfordChairman Yes 2001 2004 NoG G Edington Yes 1999 2004 NoP C Goldmark Yes 1999 2003 NoR A LongesDeputy Chairman No 1986 2003 n/a4
D J Ryan Yes 2004 n/a2 Yes
^ Since the date of the last Annual Report, Joanne Curin resigned as Finance Director in accordance with the announcement made on 17 August 2004. Ms Curinstepped down from the Board on 21 January 2005 following the appointment of her successor, Roger Burrows, as Chief Financial Officer on 3 December 2004.
1 The Directors have appointed Greg Clarke as the Managing Director for a term not exceeding five years in accordance with the Constitution of Lend Lease.2 Ross Taylor and David Ryan joined the Board on 10 December 2004 and will retire and seek election at the 2005 Annual General Meeting.3 Adrian Chamberlain joined the Board on 10 December 2004. Mr Chamberlain will step down from the Board on 30 September 2005 in accordance
with the announcement of his resignation on 8 July 2005.4 Richard Longes will retire at the 2005 Annual General Meeting, but will not seek re-election.
2.2 Role of the Board of DirectorsThe Board has formalised the responsibilities it has reserved to itself. The key Board responsibilities are:
Stakeholders Responsibility
Shareholders – approval of business strategy and vision in line with efforts to drive shareholder value creation– approval of and monitoring of business plans to execute the strategy– approval of major investments or divestments and strategic commitments– approval of and monitoring of financial reporting– oversight of risk management and compliance– promotion of corporate communication – external/market
Customers – benchmarking the delivery of value to shareholders, customers, clients and partnersEmployees – reinforcement of culture, core values and employer of choice
– review of CEO and senior executive team performance and results– review and approval of senior executive team compensation and benefits– oversight of succession planning for senior management, including key appointments
Community – oversight of the management of safety and environmental concerns– reinforcement of reputation, brand and community relations
Directors – Managing Director and Executive Director selection and oversight of succession planning– review of the size and composition of the Board– Non Executive Director nomination and selection, succession planning, determination of contribution and compensation– review of Board performance

28
The Board has delegated specificresponsibilities to its Committees. Detailsof these Board Committees and theirresponsibilities are set out in Section 5 of this Report.
All matters not specifically reserved to theBoard and which are necessary for the day-to-day management of the Groupare delegated to management. ExecutiveDirectors report to the Board and mustcomply with all lawful and reasonabledirections of the Board. The Board has approved delegated authority limits for Executive Directors and senior management.
2.3 Board compositionThe composition of the Board embracesdiversity – by skills, experience, locationand age. Details of the age, qualifications,experience and expertise of the Directorsare set out in the Directors’ Report.
2.4 Directors’ independenceThe Board has assessed the associationsof each of the eight Directors in office atthe date of this Report and considersfour of them to be independent. TheBoard has applied the criteria set out in the ASX CGC best practicerecommendations to assess eachDirector’s independence. Where theBoard considers a Director to beindependent notwithstanding that one ormore of the applicable criteria have notbeen met, reasons for its assessment of independence are provided below.
The three Executive Directors, Greg Clarke,Ross Taylor and Adrian Chamberlain, arenot considered independent.
Of the five Non Executive Directors, theBoard considers that David Crawford,Gordon Edington, Peter Goldmark andDavid Ryan are independent. In makingthis assessment, the Board does notconsider David Crawford’s independenceto be compromised owing to his previousassociation with KPMG for the followingreasons:– he resigned as a Partner and Australian
National Chair of KPMG on 28 June2001, prior to his appointment to theBoard;
– he has no financial arrangements withKPMG including pension arrangements,
retainers, advisory fees or any direct orindirect business arrangements; and
– he has never been part of KPMG’saudit practice, nor in any way involvedin, or able to influence, the audit activityassociated with the Group.
The Board also notes that it considersDavid Ryan independent notwithstandingthat, prior to his appointment to the Board,Mr Ryan was a principal of a professionaladvisor to Lend Lease (Ryvan Pty Limited)in respect of the then proposed mergerwith General Property Trust. The Boarddoes not consider Mr Ryan’s advisory roleto have compromised his independence ashis role related to a specific transaction andwas for a limited period in the year leadingup to his appointment.
Richard Longes is the only Non ExecutiveDirector who is not consideredindependent due to the length of hisservice on the Board.
Fees and other amounts payable toDirectors are disclosed in the Directors’Report in the year in which they are paid.No Non Executive Director has anycontractual relationship with the Groupother than as a Director. In the event thatthe Board considers that an independentDirector has ceased to be independent,this will be disclosed to the market.
Lend Lease currently has an equalnumber of independent and nonindependent Directors and consequentlydoes not comply with the ASX CGC bestpractice recommendation that a boardshould have a majority of independentdirectors. The Board is cognisant of thisand recognises the value of having aBoard constituted of a majority ofindependent Directors. As noted inSection 2.1 of this Report, AdrianChamberlain and Richard Longes willretire from the Board on 30 September2005 and 17 November 2005respectively, following which Lend Leasewill achieve this desired majority ofindependent Directors.
2.5 ChairmanThe Chairman, David Crawford, isconsidered by the Board to beindependent. Mr Crawford has beenChairman since May 2003. As well asbeing the principal spokesman for the
Board, the Chairman is the primary linkbetween management and the Board. It is his responsibility to ensure that theBoard works effectively and dischargesits responsibilities.
2.6 Retirement and re-election of Directors
Under the Constitution of Lend Lease, ateach Annual General Meeting one-third ofthe Directors and any other Director whowill have been in office for three or moreAnnual General Meetings since he or shewas last elected (excluding the ManagingDirector) must retire from office and maysubmit themselves for re-election. Newlyappointed Directors must seek election atthe first meeting of shareholders followingtheir appointment. The Board has adopteda policy that, subject to ongoingperformance evaluation, Non ExecutiveDirectors appointed from 2002 will belimited to a maximum of three terms ofthree years, which may only be extendedby the Board in exceptional circumstances.
2.7 Succession planningLend Lease notes the ASX CGC bestpractice recommendation that the board of a listed company establish a nominationcommittee. However, due to the small sizeof the Board, a separate nominationcommittee has not been established andthe full Board undertakes planning for itsown succession. The Board acknowledgesits responsibility for ensuring that there areappropriate processes in place forreviewing the structure of the Boardperiodically and recommending changeswhen necessary. The Board’s charter forsuccession planning includes the followingresponsibilities:– considering the mix of desired
competencies necessary to allow theBoard to discharge its responsibilities;
– assessing the size and composition of the Board and the skills currentlyrepresented;
– identifying any skills not adequatelyrepresented and agreeing the processnecessary to ensure a candidate isselected who brings those skills; and
– engaging in a robust analysis of howBoard performance might beenhanced, both at an individual leveland for the Board as a whole.
Corporate Governance continued

29
An international recruitment firm isprovided with a brief setting out theBoard’s requirements and iscommissioned to identify and presentappropriate candidates. Candidates areinterviewed by all members of the Board.In making its selection the Boardconsiders the other commitments ofcandidates in order to assess their abilityto devote the time necessary to carry outtheir responsibilities as a Director of Lend Lease.
2.8 Induction of new DirectorsNew Directors receive an informationpack and comprehensive briefings frommanagement to enable them to gain anunderstanding of the Group’s businessesand key issues. Each Director is providedwith a letter of appointment which setsout their rights, duties and responsibilities.
2.9 Resources available to DirectorsAll Directors have access to Groupinformation and consult management asrequired to enable them to carry out theirduties. Lend Lease has well establishedprocedures to allow Non ExecutiveDirectors to call on external, independent,professional advice at the expense ofLend Lease. It is expected that a Directorwill seek the advice of the Chairman,Managing Director or Company Secretarybefore obtaining external advice.
2.10 Briefings and continuingeducation
Directors are kept regularly informed ofkey business issues, emerging trends,matters relevant to their role as Directors,and changes to legislation and bestpractice. This may involve briefings by internal and external specialists.
2.11 Board performanceDuring the 2003/2004 financial year, an external consultant was engaged to review the Board’s performance,including the performance of itsChairman and its Committees. Thisreview process enhanced performanceby providing a mechanism to raise andresolve issues and producedrecommendations that assisted theBoard in developing innovativeapproaches to improve governance.
It included interviews with the Directorsas well as Senior Executives.
During the financial year, a review ofissues raised in the previous year’sexternal review of the Board’sperformance was conducted internally.
The Board has determined that it willconduct an external review of itsperformance on a biennial basis. Thenext review is scheduled to take placeduring the 2005/2006 financial year.
2.12 ShareholdingsUnder the Constitution of Lend Lease,Directors are required to hold a minimumof 1,000 Lend Lease shares. To alignmore closely the interests of shareholdersand Directors, the Board has a currentpolicy whereby the minimum holding forNon Executive Directors is 2,000 shares.However, it is intended that NonExecutive Directors move, over areasonable period, to hold the equivalentof one year’s Directors’ fees in shares.Details of all holdings by Directors inLend Lease are disclosed in theDirectors’ Report.
At the 2003 Annual General Meeting,shareholders renewed the Non ExecutiveDirectors Share Ownership Plan, whichenables Directors to acquire additionalLend Lease shares by forgoing Directors’fees to an amount equal to the value ofthe shares acquired. Subscriptions aremade at the same price, at the sametime and otherwise on the same terms as the Share Purchase Plan (SPP) offeredto all Australian and New Zealandresident shareholders and only while the SPP is operative. The SPP has notbeen operative since September 2003. A Director is restricted from dealing withshares acquired in this manner until theirretirement (except to meet an earlier taxliability in respect of the shares) and isexposed to share price risk until this time.
The Group’s policies on dealing in LendLease shares are detailed in Section 7.3of this Report.
2.13 Remuneration of DirectorsInformation on the Group’sCompensation and Benefits Policy andremuneration details for Directors arecontained in the Directors’ Report.
2.14 Retirement Planfor Non Executive Directors
Information concerning the retirementplan for Non Executive Directors iscontained in the Directors’ Report.
2.15 Attendance at meetings by Directors
The number of Board and Committeemeetings during the financial year andDirectors’ attendance at those meetingsare disclosed in the Directors’ Report.
2.16 Company SecretariesAppointed by the Board, the CompanySecretaries, Phil Crewes and SueSharpe, work with the Chairman to:– monitor and enhance corporate
governance processes; and– ensure that rules, procedures and
legislation relating to the Board are followed.
3 Key Executives
3.1 Executive Management TeamThe Executive Management Team (EMT)is chaired by Greg Clarke and comprisesbusiness unit CEOs and functionalheads. The EMT has been established toaddress key Group issues and financialprogress, and to give senior managementopportunities to discuss strategy.Members meet face-to-face every six toeight weeks and stay in regular contactbetween meetings.
3.2 Senior Executive performancereview
Bonus payments to all Senior Executivesare based upon their achievementsmeasured against financial, corporateand individual performance targets. A detailed review of the performance ofSenior Executives is conducted annuallyagainst these targets.
3.3 Senior Executive remunerationInformation on the remuneration of keySenior Executives is provided in theDirectors’ Report.

5 Board Committees
5.1 Membershipof Board Committees
The Board has established twopermanent Board Committees: thePersonnel and Organisation Committeeand the Risk Management and AuditCommittee. Each Committee has acharter setting out its objectives,responsibilities, structure and operation.The Board may establish otherCommittees in the future to assist it in discharging its responsibilities.
The membership of the BoardCommittees as at the date of this Report is set out in the table below.
5.2 Personnel and Organisation Committee
The Personnel and OrganisationCommittee assists the Board by ensuringthat appropriate policies are in place forthe compensation and management ofour people in all of our businesses. This
Committee focuses on the importance of human capital to the Group’s strategicand business planning. The Committee is comprised of two Non ExecutiveDirectors, Peter Goldmark as Chairmanand Gordon Edington, and one ExecutiveDirector, Greg Clarke. During the period 1 July 2004 to 30 June 2005, fourmeetings of the Committee were held, all of which were attended by allCommittee members.
The responsibilities of the Committeeinclude:To review and, where appropriate,recommend to the Board for approval:– compensation programmes and
performance targets for ExecutiveDirectors and members of theExecutive Management Team, andassessment of performance againstthose targets;
– succession planning for the ManagingDirector, Executive Directors and keyexecutives; and
– employee share ownership,superannuation and pension plans.
To review and, where appropriate,approve:– strategy and principles for people
management;– career development, skills development
and continuing education programmes;– global policies for employee
compensation and fringe benefits;– international assignee policies; and– operation of long and short term
executive incentive programmes.
5.3 Risk Management and Audit Committee
The Risk Management and AuditCommittee is currently comprised of fourNon Executive Directors, David Ryan asChairman and David Crawford, GordonEdington and Richard Longes. The Boardvalues the ability of the Risk Managementand Audit Committee to exerciseindependent judgment in executing itsresponsibilities and notes that, followingthe scheduled departure of RichardLonges at the 2005 Annual GeneralMeeting, all members of the Committee will be independent Directors.
The Risk Management and AuditCommittee comprises members whohave the requisite degree of financialexpertise and understanding of theindustry in which Lend Lease operates.Information about the qualifications andexperience of these Directors can befound in the Directors’ Report. During theperiod 1 July 2004 to 30 June 2005, fourmeetings of the Committee were held, allof which were attended by all membersof the Committee at the relevant time.
Committee membershipPersonnel and Risk Management
Director Independent Organisation and Audit
Executive DirectorsG A ClarkeManaging Director and CEO No MemberR H Taylor NoA Chamberlain NoNon Executive DirectorsD A CrawfordChairman Yes MemberG G Edington Yes Member MemberP C Goldmark Yes ChairmanR A LongesDeputy Chairman No MemberD J Ryan Yes Chairman
30
Executive Management Team
Personnel and Organisation Committee
Risk Management and Audit Committee
4 Governance structure
Corporate Governance continued
Lend Lease Board of Directors
Greg Clarke CEO
31
The Risk Management and AuditCommittee assists the Board by reviewingthe effectiveness of risk management andcompliance systems in all of ourbusinesses worldwide and by beingassured that assets are protected againstfinancial loss, legal and regulatoryobligations are met, and proper accountingand auditing practices are maintained.
The duties of the Committee are to:
Audit– make recommendations to the Board
as to the appointment, re-appointmentor replacement of external auditors;
– review with external auditors the scopeand terms of the audit and audit fee, andmake a recommendation to the Board;
– review and approve the scope andterms of the internal audit and whereappropriate the audit fee;
– oversee and appraise the quality of theaudits conducted by the auditors;
– discuss and resolve any issues arisingfrom audit reports, including anymatters the auditors may wish todiscuss in the absence of management;
– require the external auditor to provide a formal written statement annuallyconfirming that it is independent of the Group;
– discuss with external auditors anyrelationship that may impact on theirobjectivity or independence, andrecommend to the Board anyappropriate action to satisfy itself of an auditor’s independence;
– ensure that external auditors are awarethat they are responsible to the Board asrepresentatives of the shareholders; and
– approve non-audit assignments enteredinto with external auditors and ensurecompliance with the Board’s policygoverning the conduct of non-auditwork by the auditors.
Risk management– evaluate the adequacy and effectiveness
of administrative, operating andaccounting controls used by the Group;
– review, in particular, the effectiveness of the Enterprise Risk Managementsystem within the Group and beassured that material risks are identifiedand appropriate risk managementprocesses are in place, including theformulation and subsequent updatingof appropriate company policies;
– review the effectiveness of the Group’senvironment, health and safety riskmanagement systems;
– review the business contingencyplanning process within the Group to ascertain that material risks areidentified and appropriate contingencyplans are in place;
– review actual and potential material risk exposures;
– review insurance and other risk transferarrangements, and consider whetherappropriate coverage is in place;
– monitor the implementation of businessunit and corporate risk managementplans; and
– review the performance of the GroupHead of Risk and the risk managementand internal audit functions.
Financial reporting– review financial information presented
by management, together with reportsand opinions from external auditors;
– assess the appropriateness ofaccounting policies and methodschosen by management, particularlythose relating to significant estimatesand judgements;
– review the reliability andappropriateness of disclosure in thefinancial statements and financialreporting to stakeholders, particularlywith regard to estimates andjudgements; and
– make appropriate recommendations to the Board as to whether financialstatements should be approved.
Compliance– monitor the effectiveness of Group
policies and practices that relate tocompliance with laws, regulations and accounting standards; and
– consider the impact of changes inaccounting standards, listing rules and the Corporations Act.
Related party transactions– review and monitor related
party transactions.
Other matters– conduct or authorise investigations
into any matters within the Committee’s Charter;
– consider and make appropriaterecommendations to the Boardregarding major changes to Group accounting policies andprocedures; and
– perform other functions referred to the Committee by the Board.
The Risk Management and AuditCommittee focuses on issues that are
material to the Group with regard to their actual or potential consequences.Monitoring risks with less significantconsequences remains an importantresponsibility of business unit CEOs andboards. The Committee receives reportsfrom the Group Head of Risk, businessunit CEOs, external and internal auditors,external specialists, insurance brokers,and legal and tax advisors. It meets withthe external auditors, without members ofmanagement present, on a regular basis.The Group Head of Risk has a directreporting line to the Chairman of the RiskManagement and Audit Committee andmeets with the Chairman in the absenceof the CEO.
6 Group risk management
6.1 Enterprise Risk ManagementThe Group uses an Enterprise RiskManagement approach to identify,evaluate, treat, monitor, quantify andreport significant risks to the RiskManagement and Audit Committee andrelevant subsidiary boards. The objectivesof this approach are to provide effectiveidentification, assessment andmanagement of risks that may impactshareholder value or the quality of ourservices to clients.
The Group’s Corporate Risk Managementteam is led by the Group Head of Risk.Corporate Risk Management liaises withthe business unit CEOs, regional Headsof Risk and risk specialists on businessspecific and enterprise-wide risks. A newGroup Head of Risk was appointed inAugust 2004.
Corporate Risk Management’s objectiveis to assist the businesses in the Groupto further develop their risk managementprocesses. Its role includes:– assisting management to embed
Enterprise Risk Management;– consolidating information for
presentation to the Risk Managementand Audit Committee;
– assisting the businesses to identify risksand implement controls;
– advising on and implementing risktreatment strategies at Group level; and
– maintaining effective early warningreporting systems.
Operational businesses are responsible forimplementing self-assurance programmesto assess the effectiveness of riskmanagement procedures. Formal internaland external audit procedures are utilised

32
to provide supplementary assurance. Eachregion commenced the financial year byconducting a control risk self-assessment.An updated assurance plan, building onexisting strategies and practices, wasapproved by the Risk Management andAudit Committee in August 2005.
The Group’s approach to riskmanagement follows the Australian/NewZealand Standard on Risk Management,AS/NZ4360:1999. A copy of the GroupRisk Management Policy is available onthe Group website (www.lendlease.com).
6.2 Integrity in financial reporting, riskmanagement and internal control
The Chief Executive Officer and the ChiefFinancial Officer have stated in writing tothe Board that: – the Group’s financial records have been
properly maintained in accordance withsection 286 of the Corporations Act;
– the Group’s financial reports for the yearended 30 June 2005 present a true andfair view, in all material respects, of itsfinancial condition and operationalresults and are in accordance withrelevant accounting standards;
– the statement above concerning theintegrity of the financial reports for theyear ended 30 June 2005 is founded ona sound system of risk management andinternal compliance and control systemswhich, in all material respects, implementthe policies adopted by the Board;
– the risk management and internalcompliance and control systems inplace for the year ended 30 June 2005,to the extent they relate to financialreporting, are operating effectively andefficiently in all material respects; and
– nothing has come to their attention since30 June 2005 that would indicate anymaterial change to the statements above.
6.3 External auditorsThe external auditor of Lend Lease andits controlled entities is KPMG. This firm,or its predecessors, was appointed at thefirst Annual General Meeting in 1958. The Risk Management and AuditCommittee regularly reviews theperformance of the auditor and, subjectto the auditor’s performance, annuallyreaffirms its appointment.
The audit engagement partner is rotatedevery five years, subject to the transitionprovisions contained within the CorporateLaw Economic Reform Program (AuditReform and Corporate Disclosure) Act2004 (CLERP 9). The currentengagement partner is Mr Geoff Wilson,who was appointed in 2001.
The Board and the Risk Managementand Audit Committee continue to monitordevelopments in current best practice,and in August 2005 the Board renewedthe policy governing the conduct of non-audit work by the external auditor.Under the policy the external auditor ispermitted to provide non-audit servicesthat are not in conflict with theindependence of its role. The externalauditor should not, subject to transitionarrangements, provide services that have the potential to impair itsindependence and these kinds ofservices generally include:– work that would normally be
undertaken by management includingbookkeeping, preparation of, and otherservices in relation to, accountingrecords and financial statements;
– design and implementation of financialinformation systems or financial controls;
– valuation services, appraisals or fairnessopinions, where the results are materialto the financial statements or where theexternal auditors would be required toaudit those statements or opinions;
– outsourced internal audit services;– secondments;– recruitment and other human resources
services, including internationalassignee services;
– actuarial services;– management functions;– legal services;– taxation advice of a strategic or tax
planning nature;– broker dealer, investment advisor or
investment banking services;– work that is remunerated through a
‘success fee’ structure;– expert services unrelated to the
audit; and– work that involves the auditor acting in
an advocacy role for the Group.
Prior to undertaking any non-auditservices, the auditors are required to give a statement that undertaking those services will not compromise their independence.
As detailed in the Directors’ Report, theBoard considers that the provision ofnon-audit services by the auditor duringthe year is compatible with, and does not compromise, auditor independencerequirements. A copy of the LeadAuditors’ Independence Declaration as required under section 307C of theCorporations Act has been included inthe Directors’ Report.
Details of the remuneration paid orpayable to the auditors of Lend Lease is set out in the Directors’ Report.
7 Corporate responsibility
7.1 Core values and Code of Conduct
The core values of Lend Lease representthe key beliefs common to ourbusinesses in each country in which we operate. They support how we dobusiness, how we treat our stakeholdersand how we interact in the workplace.The core values of Lend Lease arecommunicated throughout the Group and are as follows:– Respect – Respect for all people
including their ideas, culture, views,health, safety and knowledge.
– Integrity – Integrity is non-negotiable.We don’t do it if it compromises theintegrity of individuals or the Group. In particular, we will not compromise on safety, either within our organisationor in doing business with any of ourclients or suppliers.
– Innovation – We constantly seek to findbetter solutions, to think outside the boxand dare to do things differently. We value innovation and creativity– we don’t just do it because we did it yesterday.
– Collaboration – Redefine the way ourbusiness works by sharing knowledge,building on this and drawing insights.Through teamwork we value theinsights of others and build on them – we must take the time to help.
– Excellence – We strive for excellence inall we do. It is evident not only in the
Corporate Governance continued

33
products and services we deliver, but inhow we deliver them. Our employeesembody excellence – in the decisionsthey make, the products they build, andthe services they deliver. On constructionsites in particular, but everywhere,excellence equals zero incidents.
Our Code of Conduct supports our corevalues and provides guidance foremployees on the standards of conductexpected by the Group. The Code ofConduct has been endorsed by theBoard and applies to all employeesacross the Group. The Code of Conductaddresses, among other things,managing conflicts of interest, proper useof company assets, equal opportunity foremployees, confidentiality and fairdealing, and encourages employees toraise concerns about behaviour that maynot accord with the Code of Conduct.
Our Code of Conduct is supported byvarious global, regional and localbusiness unit policies and procedures.Copies of the Core Values Statement andCode of Conduct are available on theGroup website (www.lendlease.com).
7.2 Conflicts of interestDirectors and Senior Executives arerequired to identify any conflicts of interestthey may have in dealing with the Group’saffairs and refrain, as appropriate, fromparticipating in any discussion or votingon these matters. The Board hasimplemented a range of procedures atGroup and business levels to ensure wecomply with the law and aim for thehighest ethical standards in identifying,resolving or managing conflicts of interest.Directors are encouraged to discuss withthe Company Secretary any issues thatmay give rise to conflicts of interest.
7.3 Trading in Lend Lease sharesDirectors and officers of the Group aresubject to restrictions under theCorporations Act relating to dealing insecurities. The Board has established apolicy that Directors, Senior Executivesand select key personnel may only dealin Lend Lease shares for a period of sixweeks following the expiration of twodays immediately after:
– the announcement of the annual results;
– the announcement of the half-yearresults; and
– the Annual General Meeting.
Even during this six-week period, eachperson covered by this policy must notdeal in Lend Lease shares at any time he or she has unpublished informationwhich, if generally available, might affectthe share price. They are also required tonotify the Company Secretary prior to anydealing to ensure there are no insidertrading issues.
The Group’s Code of Conduct contains a policy applicable to all employees notalready subject to the restrictions outlinedabove. This policy prohibits, as a generalrule, dealing in Lend Lease sharesbetween the close of the financial year, or half-year, and the announcement ofresults. The Code of Conduct alsocontains an explanation and prohibition of insider trading. The Code of Conductis available on the Group website(www.lendlease.com).
7.4 Health and Safety – Incident & Injury Free
At Lend Lease, workplace health andsafety remains of paramount importancein the way the Group conducts itsbusiness. The Group is committed tofostering a culture in which individualemployees seek to achieve a workplacefree of incidents, injury and fatalities. Tothis end, the Group’s health and safetyprogramme is led by an Incident & InjuryFree philosophy, which aims to provideemployees from worksites through to theManaging Director with the skills andempowerment necessary to maintain thehighest health and safety standards. Thisresponsibility begins at Board level anddetermines the geographies the Groupwill work in and the types of projects it is willing to undertake.
The Group’s commitment andperformance is coordinated andmonitored by a Group Executiveresponsible for Health and Safety, who is a member of the ExecutiveManagement Team and independentlyreports to the Managing Director and theBoard. It is important to emphasise that
this role does not remove responsibilityfrom other employees, but rathersupports each employee to ensure theirfocus on health and safety is maintainedat all times.
Incident & Injury Free workshops areregularly conducted throughout thebusinesses and form part of the inductionprocess for new employees. Employeesare measured on their performance andthe programme also strives to reach ourcompetitors, partner organisations,customers and local communities. TheGroup recognises and rewards theachievements of our people throughinternal award programmes. Updates on the programme are constantlycommunicated throughout the Group,and this sharing of information helps toembed a culture of safety at all levels ofthe organisation.
The Group also engages workplacesafety consultants such as JMJAssociates to provide independent adviceon how we can further embed a safetyculture, and Environmental ResourcesManagement (ERM), a globalenvironmental consultancy group thataudits the Group’s performance andprovides recommendations. The Groupcontinues to comply with the relevantlegal and regulatory frameworks in eachof the jurisdictions in which it operates.
Despite this focus and effort, it isregrettable that we still experiencefatalities and serious injuries on ourprojects. During the year there wereseven fatalities on Bovis Lend Leasesites: three in the US, three in Asia andone in Australia. The Group’s philosophyis that no injury or death on its projects is acceptable and it uses lessons learnedfrom each serious incident to implementlasting improvements. The majority of theGroup’s serious incidents relate to falls,which will remain the primary focus forimprovement over the next 12 months.
The Group is establishing consistent andrelevant safety metrics for each of itsbusinesses aimed at improving safetyperformance. Further details of our safetyinitiatives and performance will bepresented in the Group’s inauguralSustainability Report to be released in the first quarter of 2006.

34
7.5 EnvironmentA major component of the Lend Leasephilosophy is our commitment tounderstanding the impact the Group hason the environment and the community in order to develop environmentallyresponsible property solutions that deliversustainable social and economic returns.The Corporate Sustainability Team guidesthe Group’s efforts on sustainability and is led by a Group Executive who reportsto the Executive Management Team.
The Group has continued to work on anumber of initiatives designed to reduceour impact on the environment. A sampleof this year’s achievements were:– as a precursor to our upcoming
inaugural Sustainability Report, theMarch 2005 issue of the Groupmagazine, Interlink, focused onsustainability outcomes and providedcase studies from around the globe.Copies of Interlink are available on theGroup website (www.lendlease.com);
– Lend Lease joined the World BusinessCouncil for Sustainable Development,membership of which is by invitation onlyand restricted to companies committedto sustainable development and thepromotion of eco-efficiency, innovationand corporate social responsibility;
– The Bond, our new corporateheadquarters in Australia, hascontinued to be a world leader in thereduction of energy consumption and is on target to achieve a five starAustralian Building Greenhouse rating.Awards won by The Bond are set out in the table below;
– Lend Lease Property ManagementAustralia signed a SustainabilityCovenant with the EnvironmentProtection Agency Victoria,demonstrating a public commitment bythe two organisations to work togetherto improve the environmentalperformance of shopping centresmanaged by Lend Lease in Victoria;
– Bovis Lend Lease achieved its bestresults to date at the 2004 Green AppleAwards in the UK, an annual eventorganised by The Green Organisation,an independent environmental group.The Scottish Parliament project won a gold award for its focus on energyefficiency and natural lighting, heatingand cooling. Bovis Lend Lease alsowon awards for its work with theDepartment for Work and Pensions onthe rollout of Jobcentre Plus facilities. In addition, Debut Services wasrecognised for meeting the strict
environmental requirements of DefenceEstates on the SLAM project and theChapelfield retail development waspraised for its recycling initiatives;
– at Mawson Lakes in South Australia, a Recycled Water System wasdeveloped by Delfin Lend Lease inconjunction with the State GovernmentLand Management Corporation, SAWater and the City of Salisbury. Thesystem reduces potable water demandby at least 50% and uses a mixture of recycled wastewater and recycledstormwater for flushing toilets, washingcars and outdoor domestic andmunicipal irrigation;
– in South Carolina, Bovis Lend Leasehas continued to focus on recyclingduring deconstruction works at theCharlestown Naval Base, and hasrecycled more than 79% of materials(including 2,460 pounds of aluminium,1,015 pounds of copper, 153,760pounds of steel and 5,056,000 poundsof concrete), saving approximatelyUS$115,000 in landfill and new material costs; and
– Actus Lend Lease won the HawaiianElectric Company’s 2004 EnergyEfficiency Award for its militaryconstruction project at the Ford Island
National Association of Women in Construction Awards 2004– New South Wales (NSW)– Innovation– Construction– Design
Royal Australian Institute of Architects Awards 2005 – NSW– Sustainability, 30 The Bond– Interior Architecture, Lend Lease Offices– Commercial, 30 The Bond
AIRAH Excellence Awards 2003 – Australia– Industry Leadership
Architectural Bulletin – NSW– Building of the Decade – 2000’s
Engineering Excellence Awards 2004 – Australia– Environment & Heritage
Engineering Excellence Awards 2004 – NSW– Energy Efficiency & Heritage
Master Builders Association Awards 2004 – NSW– Innovation– Commercial Building – $25 million to $80 million– Energy Efficiency– Restoration/Renovation of an Historic Building
– $5 million to $10 million
Australian Interior Design Awards 2005– Corporate Interior – Lend Lease Offices– ESD Interior – Lend Lease Offices– Commendation ESD Interior – Morgan Stanley Offices– Commendation Institutional Interior – Billabond Children’s Centre
Master Builders Association Awards 2004 – Australia– Environment & Energy Efficiency
Australian Construction Achievement Award 2005– Winner, 30 The Bond
Energy Australia National Trust Heritage Awards 2005– Best Adaptive Reuse of a Heritage Building
by Government or Corporation– Energy Australia Award: Conservation – Energy Management
Australian Property Institute Awards 2004 – NSW– Property Development– Environmental Development– Heritage
The Lighting Society Awards 2004– Lighting Design: Commendation – Ground Floor– Lighting Design: Commendation – Level 4 Reception
Urban Taskforce Awards 2004 – NSW– Overall Development Excellence– Commercial Development
Corporate Governance continued

35
and Radford Terrace project in Oahu,Hawaii. The 170 homes constructed by Actus Lend Lease use energy-efficient lighting and airconditioning systems, are designed to maximise solar energy, and haveinnovative window/ceiling construction.
The Group’s community initiatives aredetailed in Section 7.7 below. Furtherinformation on the Group’s sustainabilityoutcomes will be provided in ourinaugural Sustainability Report, due forrelease in the first quarter of 2006.
7.6 Communication with shareholders
Lend Lease is committed to effectivecommunication with its shareholders andto ensuring the market is fully informed. In addition to complying with thecontinuous disclosure obligations requiredby the Australian Stock Exchange, timelyand accurate information is made availableto stakeholders by ensuring StockExchange announcements are widelydisseminated. All announcements are:– posted to the News Room section of
the Group website, www.lendlease.com.Additionally, interested parties canregister for our alert service to receive an emailed message notifying newannouncements;
– distributed to major international wire services; and
– emailed to major media and investor organisations.
The Company Secretary is responsiblefor communication with the Australianand New Zealand Stock Exchanges in relation to listing rule obligations,including continuous disclosure.
The Group has a Continuous DisclosurePolicy in place, which is posted on theGroup’s intranet for reference by allemployees. This policy outlines theconcepts and principles of continuousdisclosure, how they apply in practice, the obligations on Lend Lease to keep the market informed at all times, theprocedure to be followed in the case of a disclosable event and the penaltiesfor contravening continuous disclosureobligations. It sets out the steps whichshould be taken by Directors andexecutive officers to ensure compliancewith continuous disclosure obligations.
These steps include being satisfied thatreporting systems are adequate to bringpotentially disclosable information to theirattention and ensuring that an appropriateperson is consulted to determine whetherthe information should be disclosed.
The Group website is the key informationdissemination point to the broadermarket. The Group makes informationavailable to the widest possible audienceon this website by:– posting all announcements, following
receipt by the Australian StockExchange, including the Annual Reportand Consolidated Financial Statements,and presentations made at the AnnualGeneral Meeting and to analysts orinstitutional investors; and
– live webcasts of market briefings to analysts and institutional investors, and the subsequent archiving of these webcasts for three months. Any presentation material used during a webcast can be viewedsimultaneously, or accessed from the archive subsequently.
Group executives and the Chairman also meet with investors and theirrepresentatives on a regular basis todiscuss the Group and its performance.
The Annual General Meeting is theprimary opportunity for shareholders to meet with the Board and SeniorExecutives on a face-to-face basis. All shareholders receive the Notice ofMeeting detailing time and venue, andoutlining the resolutions to be put to theMeeting. Accompanying the Notice is aproxy form, instructions on completionand lodgement, and a postage paid,addressed return envelope to encouragemaximum shareholder participation.Shareholders attending the venue aregiven the opportunity to ask questionsduring the course of the Meeting.Directors make themselves available afterthe formal meeting to mix withshareholders. Question cards areavailable for those shareholders who do not wish to raise matters in a publicforum and they subsequently receive a written response to the issues raised.
For shareholders who are unable toattend in person, the proceedings of theAnnual General Meeting are webcast livevia the Group website and later archived
for three months. Access to the archive is via a link from the home page. Thequestions and answers raised at theMeeting are posted to the Group websitefor perusal by interested stakeholders. In addition, representatives of the mediaare invited to attend the Meeting toenable a report of the proceedings toreach as wide an audience as possible.
The external auditor of Lend Leaseattends the Annual General Meeting and is available to answer shareholderquestions about the conduct of the auditand the preparation and content of theauditor’s report.
7.7 Community supportThe Group is an active participant in the communities in which it conductsits activities. The Group’s landmarkcommunity initiative is Community Day,which is held every year. Employeesaround the globe are encouraged tospend one day helping local organisationson projects that benefit the greatercommunity. The Group supports theseemployees by allowing them to take partin these projects during paid workinghours. Since the inception of CommunityDay in 1995, Group employees havespent more than 200,000 hours providingservices to over 800 different charitableand community organisations globally.Last year, more than 4,000 employeesdonated time to over 220 Community Dayinitiatives. Recent examples of CommunityDay efforts are varied and include:– 40 employees from the Atlanta region
took part in a clean up and gardeningproject in an assisted living home, laterspending the afternoon playing bridgewith the senior citizens;
– 40 employees from the Fort Hoodregion volunteered for the Home & HelpShelter revitalisation project, repairingequipment, painting and landscapingexteriors, and repairing and paintingequipment in the picnic area;
– 15 employees provided entertainmenton St Nicholas’ day at a children’sorphanage in Prague;
– 20 employees volunteered at the CasaCardinal Colombo hospital in Milan,gardening, reorganising the library, andarranging a lunch and entertainment forthe children;
36
– 15 employees visited the MoscowCentre for Corrective Pedagogies,which helps children with disabilities.The employees took part in gardening,building maintenance and upgrading the playground;
– 10 employees assisted the HarrowChurches Housing Association byclearing out household goods, pruningtrees and shrubs, rebuilding fences anddismantling an old garage; and
– 40 employees visited a Canberra Child and Family Centre, repainting theinteriors of the house, participating in a general clean up, landscaping and gardening.
The Group also supports the communityin other ways. Lend Lease has dedicatedcommunity engagement anddevelopment resources on a number of its projects globally. These employeeswork to ensure that community needs areconsidered in the Group’s operations.Examples include:– Lend Lease runs an active mentoring,
homework and reading programme with the local community at Millers Pointin Sydney. This programme providessupport and guidance to local youth;and
– in London, Bovis Lend Lease has beenlinking local people to jobs throughJobcentre Plus. This programme ismodelled on the skilling programmefacilitated by Lend Lease at Bluewater,which has resulted in 10,000employment placements to date.
During the year, the Group also donatedA$500,000 to the Australian Red CrossSociety in support of the Tsunami Relief Appeal.
7.8 Political donationsThe Group’s policy is not to make cashdonations to any political parties,politicians or persons standing for publicoffice. Costs are incurred where Grouprepresentatives attend political functions.
Corporate Governance continued

37
8 Compliance with ASX CGC best practice recommendations
ASX Corporate Governance Council Principles of Good Corporate ComplyGovernance and Best Practice Recommendations Reference1 [Yes/No]
Principle 1: Lay solid foundations for management and oversight1.1 Formalise and disclose the functions reserved to the board
and those delegated to management 2.2 YesPrinciple 2: Structure the board to add value2.1 A majority of the board should be independent directors 2.1, 2.4 No2.2 The chairperson should be an independent director 2.1, 2.4, 2.5 Yes2.3 The roles of chairperson and chief executive officer should not be
exercised by the same individual 2.1 Yes2.4 The board should establish a nomination committee 2.7 No2.5 Provide the information indicated in
Guide to reporting on Principle 2 2.1, 2.3, 2.4, 2.7, 2.9 Yesand Directors’ Report
Principle 3: Promote ethical and responsible decision-making3.1 Establish a code of conduct to guide the directors, the chief executive
officer (or equivalent), the chief financial officer (or equivalent) and anyother key executive as to:
3.1.1 the practices necessary to maintain confidence in the company’s integrity3.1.2 the responsibility and accountability of individuals for reporting and
investigating reports of unethical practices 7.1, 7.2 Yes3.2 Disclose the policy concerning trading in company securities by directors,
officers and employees 7.3 Yes3.3 Provide the information indicated in Guide to reporting on Principle 3 7.1, 7.2, 7.3 YesPrinciple 4: Safeguard integrity in financial reporting4.1 Require the chief executive officer (or equivalent) and the chief financial
officer (or equivalent) to state in writing to the board that the company’s financial reports present a true and fair view, in all material respects, of the company’s financial condition and operational results and are in accordance with relevant accounting standards 6.2 Yes
4.2 The board should establish an audit committee 5.1, 5.3 Yes4.3 Structure the audit committee so that it consists of:
– only non-executive directors – a majority of independent directors– an independent chairperson, who is not chairperson of the board – at least three members 5.1, 5.3 Yes
4.4 The audit committee should have a formal charter 5.1, 5.3 Yes4.5 Provide the information indicated in Guide to reporting on Principle 4 5.1, 5.3, 6.3 Yes
and Directors’ ReportPrinciple 5: Make timely and balanced disclosure5.1 Establish written policies and procedures designed to ensure compliance
with ASX Listing Rule disclosure requirements and to ensure accountability at a senior management level for that compliance 7.6 Yes
5.2 Provide the information indicated in Guide to reporting on Principle 5 7.6 Yes
1 This is a reference to the relevant sections of this Report or to the Directors’ Report in this Annual Report.

38
8 Compliance with ASX CGC best practice recommendations continued
ASX Corporate Governance Council Principles of Good Corporate ComplyGovernance and Best Practice Recommendations Reference1 [Yes/No]
Principle 6: Respect the rights of shareholders6.1 Design and disclose a communications strategy to promote effective
communication with shareholders and encourage effective participation at general meetings 7.6 Yes
6.2 Request the external auditor to attend the annual general meeting and be available to answer shareholder questions about the conduct of the audit and the preparation and content of the auditor’s report 7.6 Yes
Principle 7: Recognise and manage risk7.1 The board or appropriate board committee should establish policies
on risk oversight and management 5.3, 6.1 Yes7.2 The chief executive officer (or equivalent) and the chief financial officer
(or equivalent) should state to the board in writing that:7.2.1 the statement given in accordance with best practice recommendation 4.1
(the integrity of financial statements) is founded on a sound system of risk management and internal compliance and control which implements the policies adopted by the board
7.2.2 the company’s risk management and internal compliance and control system is operatingefficiently and effectively in all material respects 6.2 Yes
7.3 Provide the information indicated in Guide to reporting on Principle 7 5.3, 6.1 YesPrinciple 8: Encourage enhanced performance8.1 Disclose the process for performance evaluation of the board, its committees
and individual directors, and key executives 2.11, 3.2 YesPrinciple 9: Remunerate fairly and responsibly9.1 Provide disclosure in relation to the company’s remuneration policies
to enable investors to understand (i) the costs and benefits of those policies and (ii) the link between remuneration paid to directors and key executives and corporate performance 2.12, 2.13, 2.14, 3.3 Yes
and Directors’ Report9.2 The board should establish a remuneration committee 5.1, 5.2 Yes9.3 Clearly distinguish the structure of non-executive directors’
remuneration from that of executives 2.12, 2.13, 2.14 Yesand Directors’ Report
9.4 Ensure that payment of equity-based executive remuneration is made in accordance with thresholds set in plans approved by shareholders 2.13, 3.3
and Directors’ Report Yes9.5 Provide the information indicated in Guide to reporting on Principle 9 2.12, 2.13, 2.14,
3.3, 5.1, 5.2and Directors’ Report Yes
Principle 10: Recognise the legitimate interests of stakeholders10.1 Establish and disclose a code of conduct to guide compliance with legal
and other obligations to legitimate stakeholders 7.1, 7.2 Yes
1 This is a reference to the relevant sections of this Report or to the Directors’ Report in this Annual Report.
Corporate Governance continued

39
Contents
The Concise Financial Statements and specific disclosures
and Concise Management’s Discussion and Analysis of
Financial Condition and Results of Operations (Concise
MD&A) have been derived from the consolidated entity’s full
Financial Report for the financial year. Other information
included in the Concise Financial Report is consistent with
the consolidated entity’s full Financial Report. The Concise
Financial Report does not, and cannot be expected to
provide, as full an understanding of the financial performance,
financial position and financing and investing activities of the
consolidated entity as the full Financial Report.
A copy of Lend Lease Corporation Limited Annual
Consolidated Financial Report 30 June 2005, including
the Independent Audit Report, is available to all
shareholders, and will be sent to shareholders without
charge upon request.
The Annual Consolidated Financial Report 30 June 2005 can
be requested by telephone (612) 9236 6065 and by Internet
at www.lendlease.com.au
Directors’ Report 40
1 Governance 40
2 Operations 44
3 Executives’ and Directors’ 45Remuneration
4 Other 60
Five Year Profile 62
Concise Management’s Discussion and Analysis of Financial Condition and Results of Operations(Concise MD&A) 64
Concise Financial Statements 70
Statement of Financial Performance 70
Statement of Financial Position 71
Statement of Cash Flows 72
Notes to the Concise FinancialStatements 73
1 Basis of Preparation of Concise Financial Report 73
2 Segment Reporting 74
3 Revenue 76
4 Ordinary Profit Items 77
5 Taxation 77
6 Dividends and Earnings Per Share 78
7 Total Equity Reconciliation 79
8 Executives’ and Directors’ Disclosures 80
9 Explanation of Transition to Australian Equivalents to 81International Financial Reporting Standards (AIFRS)
10 Events Subsequent to Balance Date 89
Directors’ Declaration 90
Independent Audit Report 91
Concise Financial Report 30 June 2005

40
The Directors present their Reporttogether with the Annual ConsolidatedFinancial Report of the consolidatedentity, being the Company and itscontrolled entities (Lend Lease) for the year ended 30 June 2005 and the Auditors’ Report thereon.
1. Governance
a. Board/DirectorsThe names, qualifications, experienceand special responsibilities of eachperson holding the position of Director of the Company at the date of thisReport are:
D A Crawford, Chairman (Non Executive)Age 61Mr Crawford joined the Board in July2001 and was appointed Chairman inMay 2003. He is a Member of the RiskManagement and Audit Committee.
Experience and QualificationsPreviously Mr Crawford was NationalChairman of the Australian firm of KPMG.He has extensive accounting and businessexperience having worked with many largecorporations and governments. Hisqualifications are Bachelor of Commerceand Bachelor of Laws from the Universityof Melbourne. He is a Fellow of theInstitute of Chartered Accountants.
Other Listed Company DirectorshipsMr Crawford is a Non Executive Directorof BHP Billiton Limited (appointed May1994), Foster’s Group Limited (appointedAugust 2001) and Westpac BankingCorporation (appointed May 2002). Hewas formerly a Non Executive Director of National Foods Limited (appointedNovember 2001, resigned June 2005).
G A Clarke, Managing Director(Executive)Age 47Mr Clarke was appointed ManagingDirector and Chief Executive Officer in
December 2002 and is a Member of thePersonnel and Organisation Committee.
Experience and QualificationsMr Clarke brings more than 20 yearsexperience in international businessdevelopment and operations throughcareer roles including Vice President,Cellular (Paris) for Nortel Communicationsplc; Chief Executive Mobile, C&W Mobileplc; and Chief Operating Officer, and ChiefExecutive Officer, Cable & WirelessCommunications plc. His qualifications areBA (Hons) Business Studies and MBA.
Other Listed Company DirectorshipsMr Clarke is a Non Executive Director of British United Provident Association(BUPA), the largest private health providerin the UK (appointed April 2001).
A Chamberlain (Executive)Age 48Mr Chamberlain joined the Board as anExecutive Director on 10 December 2004.
Directors’ Report
D A CrawfordChairman
G A ClarkeManaging Director
A ChamberlainExecutive Director
G G EdingtonNon Executive Director

41
Experience and QualificationsMr Chamberlain has extensiveinternational experience, having workedfor nearly 20 years in senior roles in retailand telecommunications. Prior to joiningLend Lease he was a main BoardDirector and CEO for the Global Servicesand Europe/Asia business of Cable &Wireless plc and previously managed theUK’s largest residential cable television,internet and telephony business for Cable& Wireless Communications plc. Hisqualifications are a Master of Arts fromCambridge University and a Master ofScience (Business Studies) from LondonBusiness School.
Other Listed Company DirectorshipsNil.
G G Edington (Non Executive)Age 59Mr Edington joined the Board in 1999and is a Member of the RiskManagement and Audit Committee and a Member of the Personnel andOrganisation Committee.
Experience and QualificationsQualified as a Chartered Surveyor, MrEdington brings to the Board extensiveUK and international experience in theproperty sector. Mr Edington was aDirector of BAA plc and Chairman of BAAInternational. He joined BAA plc in 1988,became a Member of the Board in 1991and has been the Chairman of six BAAcompanies. He is a past President of theBritish Property Federation, was theChairman of UK property companyGreycoat Estates Limited and was aMember of the Bank of England PropertyForum. He has also been involved with a number of charitable organisations.
Other Listed Company Directorships Nil.
P C Goldmark (Non Executive)Age 64Mr Goldmark joined the Board in 1999and is Chairman of the Personnel andOrganisation Committee.
Experience and QualificationsMr Goldmark is Director, Climate and AirProgram at Environmental Defense, a USbased non profit environmental advocacyorganisation. He was the Chairman andCEO of The International Herald Tribune in Paris between 1998 and 2003. Prior tothis, he was for ten years the Presidentand CEO of the Rockefeller Foundation in New York. He has held the positions ofSenior Vice President of the Times-MirrorCorporation, Executive Director of thePort Authority of New York and NewJersey and Director of the Budget for theState of New York. A writer and speakeron world affairs, Mr Goldmark graduatedwith a BA from Harvard College,Government Department, magna cumlaude. He brings to Lend Lease his wideexperience as a CEO and SeniorExecutive in the private and publicsectors, both in the US and internationally.
Other Listed Company DirectorshipsNil.
P C GoldmarkChairman, Personnel andOrganisation Committee
R A LongesDeputy Chairman
D J RyanChairman, Risk Management and Audit Committee
R H TaylorExecutive Director

42
1. Governance continued
a. Board continued
R A Longes, Deputy Chairman (Non Executive)Age 60Mr Longes joined the Board in 1986 and was appointed Deputy Chairman inJanuary 2000. He is a Member of theRisk Management and Audit Committee.
Experience and QualificationsHe was previously an Executive Directorof the Company, an Executive Director of Investec Bank (Australia) Limited, aPrincipal of the Corporate Advisory andPrivate Equity Group of WentworthAssociates and a Partner of the legal firmFreehills. Mr Longes’ qualifications are BA, LLB, MBA.
Other Listed Company DirectorshipsMr Longes is a Non Executive Director of Metcash Trading Limited (appointedJanuary 2000), Boral Limited (appointedSeptember 2004) and Viridis InvestmentManagement Limited (appointed July2005). He was formerly Chairman of GPT Management Limited (appointedNovember 1989, resigned November2004).
D J Ryan AO (Non Executive)Age 53Mr Ryan was appointed a Director on10 December 2004 and is Chairman of theRisk Management and Audit Committee.
Experience and QualificationsMr Ryan has previously held ManagingDirector positions in investment bankingand industry as well as being theChairman or a Non Executive Director of a number of listed public companies.He has a Bachelor of Business from theUniversity of Technology, Sydney and is a Fellow of both CPA Australia and theAustralian Institute of Company Directors.
Other Listed Company DirectorshipsMr Ryan is a Non Executive Director ofTransurban Holdings Limited (appointedApril 2003), ABC Learning CentresLimited (appointed June 2003), Tooth &Co Limited (appointed September 1999).He was formerly a Director of Virgin BlueHoldings Limited (appointed November2003, resigned April 2005) and AdsteamMarine Limited (appointed August 1994,resigned December 2002).
R H Taylor (Executive)Age 43Mr Taylor joined the Board as anExecutive Director on 10 December 2004.
Experience and QualificationsMr Taylor joined Lend Lease in 1985 asan engineer and held several positionsboth in Australia and Asia before beingappointed Managing Director of LendLease’s project management andconstruction business in 1995. Followingthe acquisition of the Bovis Group in1999, he was appointed Global CEO of the combined Bovis Lend Leasebusinesses based in London and in 2001his responsibilities were expanded toinclude Lend Lease’s developmentactivities. In 2003 he relocated back toAustralia to take up the role of CEO AsiaPacific and has recently been appointedCEO Retail and Communities. He has aBachelor of Civil Engineering (Honours)from the University of Queensland.
Other Listed Company DirectorshipsNil.
Former DirectorSince the date of the last report Ms J ECurin retired as Finance Director of theCompany on 20 January 2005, havingjoined the Board on 8 September 2003.
b. Company Secretaries’Qualifications and Experience
P W CrewesMr Crewes was appointed GeneralCounsel and Group Secretary in 1995.Since 1985 he has held a number ofsenior executive positions and subsidiaryboard directorships in the Lend LeaseGroup. He has a Bachelor of Laws fromthe University of Sydney and is anAssociate of the Securities Institute of Australia.
S J SharpeMs Sharpe was appointed DeputyCompany Secretary in 1995 andCompany Secretary in 1997. She hasheld a number of senior executivepositions and subsidiary boarddirectorships in the Lend Lease Group.She has a Bachelor of Business from theUniversity of Technology, Sydney and isan Associate of the Institute of CharteredAccountants and a Member of theAustralian Institute of Company Directors.
c. Officers Who Were PreviouslyPartners of the Audit Firm
Mr Crawford was a Partner andAustralian National Chair of KPMG. He resigned from this position on 28June 2001 prior to his appointment as a Director of the Company on 19 July2001. KPMG or its predecessors wereappointed as the Company’s auditor atits first Annual General Meeting in 1958.
d. Directors’ MeetingsDuring the financial year, 17 Boardmeetings were held. The Boardrecognises the essential role ofcommittees in guiding the Company on specific issues. Committees addressimportant corporate issues, calling onsenior management and external advisersprior to making a final decision or makinga recommendation to the full Board.
There are two permanent committees of the Board:
Personnel and OrganisationCommitteeComprising a majority of Non ExecutiveDirectors, the Personnel and OrganisationCommittee focuses on the importance ofhuman capital to the Group’s strategicand business planning and assists theBoard in ensuring that appropriatepolicies are in place for peoplemanagement and compensation acrossall our businesses worldwide. During theperiod 1 July 2004 to 30 June 2005, four meetings of the Personnel andOrganisation Committee were held.
Risk Management and AuditCommitteeThe Risk Management and AuditCommittee is made up entirely of NonExecutive Directors and assists the Boardby reviewing the risk management andcompliance systems in all our businessesworldwide and by being assured thatassets are protected against financialloss; legal and regulatory obligations aremet; and proper accounting and auditingpractices are maintained. During theperiod 1 July 2004 to 30 June 2005, four meetings of the Risk Managementand Audit Committee were held.
Directors’ Report continued

43
Attendance at Meetings of Directors 1 July 2004 to 30 June 2005
Risk Management Personnel &Board & Audit Organisation Other2
Meetings Committee Meetings Committee Meetings Committee Meetings
Director Held1 Attended Held1 Attended Held1 Attended Held1 Attended
A Chamberlain3 7 7G Clarke 17 17 4 4 30 30D Crawford 17 17 4 4 30 30J Curin4 11 10G Edington 17 17 4 4 4 4P Goldmark 17 16 4 4R Longes 17 17 4 4 30 30D Ryan5 7 7 1 1 22 22R Taylor6 7 7 1 1
1 Reflects the number of meetings held during the time the Director held office during the year.2 Committees constituted to address specific issues.3 Mr Chamberlain was appointed as a Director on 10 December 2004.4 Ms Curin resigned as a Director on 20 January 2005.5 Mr Ryan was appointed as a Director on 10 December 2004.6 Mr Taylor was appointed as a Director on 10 December 2004.
In addition, as required, matters were dealt with by Circular Resolution and ratified at the next meeting of the Board or appropriate committee.
e. Interest in CapitalThe interest of each of the Directors in the issued shares of the Company at 17 August 2005 (18 August 2004) is set out below.
Shares SharesShares Held Shares HeldHeld Beneficially/ Held Beneficially/
Directly Indirectly Total Directly Indirectly TotalDirector 2005 20051 2005 2004 20041 2004
A Chamberlain2 1,000 1,000G Clarke 1,000 1,000 1,000 1,000D Crawford 4,395 13,073 17,468 4,395 6,279 10,674J Curin3 1,000 1,000G Edington 15,000 6,373 21,373 15,000 4,816 19,816P Goldmark 3,000 6,998 9,998 3,000 5,441 8,441R Longes 13,602 43,702 57,304 13,602 41,817 55,419D Ryan4 10,000 96 10,096R Taylor5 7,899 83,946 91,845
1 Includes shares beneficially held by Non Executive Directors in the Retirement Plan.2 Mr Chamberlain was appointed as a Director on 10 December 2004.3 Ms Curin resigned as a Director on 20 January 2005.4 Mr Ryan was appointed as a Director on 10 December 2004.5 Mr Taylor was appointed as a Director on 10 December 2004.

44
2. Operations
a. Principal ActivitiesThe principal activities of Lend Leaseduring the financial year were:
– Real estate project management;design services; constructionmanagement and engineering;
– All aspects of property developmentfrom concept through to design,planning, construction, financing,leasing and eventual sale. This alsoincludes the creation andmanagement of Public PrivatePartnerships (PPPs), including PrivateFinance Initiatives (PFIs) and BuildOperate Transfer (BOT) projects andSenior Living developments; and
– Management of real estateinvestment funds and real estateassociated debt on behalf of theclients. This comprises:
– Co-investment in funds and realestate assets;
– Portfolio management;
– The leasing, management andredevelopment of shoppingcentres; and
– Financial advice and arrangementof project finance and related services.
This includes discontinued operations(refer to Note 35 of the AnnualConsolidated Financial Report).
b. Review and Results of OperationsA full review of operations is included inManagement’s Discussion and Analysisof Financial Condition and Results ofOperations (MD&A) section of the AnnualConsolidated Financial Report.
c. DividendsThe 2004 final dividend of A$103.7 million (26 cents per share,unfranked) referred to in the Directors’Report dated 18 August 2004 was paidon 15 September 2004.
Details of dividends in respect of thecurrent year are as follows:
Directors’ Report continued
d. Significant Changes in State of Affairs
On 2 June 2005, General Property Trust unitholders voted in favour of theinternalisation of management thereforeremoving GPT Management Limited as the responsible entity effective 6 June 2005.
During the prior year, Lend Lease exitedor sold businesses operating in the NorthAmerican real estate investments markets(both equity and debt) and real estatedebt services, certain components of the European real estate investmentsbusiness and the global fundmanagement advisory business. Duringthe year to 30 June 2005 Lend Leasesold Lend Lease Rosen and RosenConsulting in the US and the assetmanagement and debt servicingbusinesses in Korea and Japan.
e. Events Subsequent to Balance Date
No matters or circumstances have arisensince the end of the financial year thathave significantly affected or maysignificantly affect the operations of Lend Lease, the results of thoseoperations or state of affairs of LendLease in subsequent financial years other than the following:
Acquisition of The Crosby Group plcOn 8 July 2005, Lend Lease acquiredThe Crosby Group plc, a UK basedurban regeneration specialist for £261.0 million (A$612.0 million). Theacquisition was 100% debt funded andrepresented 97% of the voting shares,with management co-investing so as to own the remaining 3%. The goodwillon acquisition is being finalised inaccordance with the “BusinessCombinations” standard under AIFRS. As a result, the financial effect of theacquisition cannot be reliably estimatedat the date of this report.
Acquisition of Final Minority Stakein Actus Lend LeaseOn 8 July 2005, Lend Lease acquired thefinal 12.5% minority stake in Actus LendLease, a division of its US communitiesbusiness, which is primarily focused on the provision and management offamily housing for the US military. Thepurchase price was US$71.0 million (A$96.1 million). The goodwill onacquisition is being finalised inaccordance with the “BusinessCombinations” standard under AIFRS. As a result, the financial effect of theacquisition cannot be reliably estimatedat the date of this report.
Acquisition of One-Third Interest in Performance Retail LimitedPartnershipOn 2 August 2005, Lend Lease acquireda one-third interest in Performance RetailPartnership Limited, a UK based retailproperty investment fund. The purchaseprice was £28.4 million (A$66.0 million)and represented one-third of the voting shares.
Sale of US Real Estate InvestmentsInterest in the VEF FundsOn 13 July 2005, Lend Lease sold ValueEnhancement Fund III, IV and V forUS$54.5 million (A$72.3 million) resultingin a profit before tax of US$9.1 million(A$12.1 million). The profit after tax isestimated to be US$5.6 million (A$7.4 million). The buyer was a CSFBfund that invests in secondary marketinterests in real estate funds.
Sale of Gotham 80/20 HousingProject in New YorkOn 9 August 2005, the partnership withGotham sold the Foundry in New York,an 80/20 housing project. Lend Lease’sshare of net proceeds realised by thepartnership was US$10.3 million (A$13.5 million), resulting in a profitbefore tax of US$8.4 million (A$11.0 million). The profit after tax
A$m
Interim dividend of 28 cents per share (unfranked) paid on 8 March 2005 111.6Final dividend of 29 cents per share (franked) declared by Directors to be paid on 14 September 2005 115.6
227.2

45
is estimated to be US$5.2 million(A$6.8 million). The buyer was ArchstoneSmith, a large public apartment RealEstate Investment Trust.
The financial effects of the abovetransactions have not been brought toaccount in the financial statements forthe year ended 30 June 2005.
f. Likely DevelopmentsDetails of likely developments in theoperations of Lend Lease in subsequentfinancial years are contained in the reportsfrom the Chairman and Managing Directorin the Annual Report. In the opinion of theDirectors, disclosure of any furtherinformation would be likely to result inunreasonable prejudice to the Group.
g. Environmental RegulationLend Lease is subject to manyenvironmental regulations, in particularrelating to real estate development,project management and assetmanagement. These regulations typicallyrelate to noise and dust control, solidwaste management and discharge intowater systems.
For a number of years, Lend Lease hasrequired each of its businesses to havean integrated Environment ManagementSystem. The Environment ManagementSystem is the catalyst for thedevelopment of Lend Lease’senvironmental plans and strategies and,as a minimum, the goal is to ensurecompliance with applicable regulationsand legislation.
The Risk Management and AuditCommittee receives reports on a quarterly basis regarding any significantenvironmental risks and non-conformancewith Lend Lease’s Environment Policy.The Directors are not aware of anysignificant non-compliance issues duringthe period covered by this Report.
Further details are contained in theCorporate Governance section of theAnnual Report.
3. Executives’ and Directors’Remuneration
a. Compensation Policy
Directors and Senior ExecutivesLend Lease’s Compensation and BenefitsPolicy is determined by the Board’sPersonnel and Organisation Committee(P&O Committee). Lend Lease’s policy isto reward Senior Executives with marketcompetitive compensation and benefits,taking account of both Company andindividual performance. In assessingthese benchmarks, Lend Lease takesaccount of expert advice and the relevantexternal comparators in the real estateand related sectors.
Lend Lease’s approach to executivecompensation is to provide a balance of fixed and performance based cashelements with an emphasis on increasing‘at risk’ compensation for SeniorExecutives and Executive Directors.Outlined below are the elements and the philosophy behind them.
Compensation paid by Lend Lease isdesigned to be appropriate andcompetitive in each of its businesslocations, having regard to local practiceon such issues as incentives, pensions,superannuation and other benefits. LendLease also recognises the need to takeaccount of differing costs of living,especially in relation to expatriates and this is reflected in compensation for expatriate Senior Executives in the various locations.
Base SalarySalaries are set at competitive levels,targeted around median againstcomparable companies, with annualreviews to reflect market conditions and personal performance. For guidance,the P&O Committee and variousbusiness based executives useinformation available in published jobmatched surveys of similar companies.As appropriate, they also commissionsurveys to supplement the publishedinformation. To ensure proper process is followed for all Senior Executives, allproposed packages for direct reports of Executive Management Teammembers require prior approval from the
Chief Executive Officer (CEO). Thisapplies to internal appointments andexternal hires except for the internal auditrole, for which remuneration is set by theRisk, Management and Audit Committee.In addition, all internal appointments witha base salary in excess of A$150,000 in Australia, US$130,000 in the US and£60,000 in the UK, for whom a basesalary increase of 10% or above isproposed, require prior approval from the Chief Executive Officer.
The salaries of the Chief ExecutiveOfficer, the Executive Directors, regionaland business unit CEOs and corporatefunctional heads are set by the P&OCommittee. These are determined in Julyof each year. In the case of the ExecutiveDirectors and business unit CEOs, theCommittee is assisted in this review bythe Chief Executive Officer and the Headof Human Resources.
Short Term Incentives (STIs)Annual bonus payments are based uponactual achievement measured againstchallenging financial, corporate andindividual performance targets approvedby the P&O Committee for direct reportsof the Chief Executive Officer. Althoughthe performance criteria are different foreach executive, the principles are similarand involve assessment of performanceacross two areas:
– Financial – achievement of profitability,earnings, new work secured, returnon capital employed and otherrelevant financial targets; and
– Non Financial Organisation –achievement of personal objectivesrelated to specific non-financialbusiness targets includingEnvironment Health and Safety,business growth and peopledevelopment.
If the full target bonus is earned, annualcompensation will normally reach the upper quartile of the relevantemployment market.
Annual bonuses may be awarded in cashor awards under Lend Lease EmployeeShare Plans (ESP).
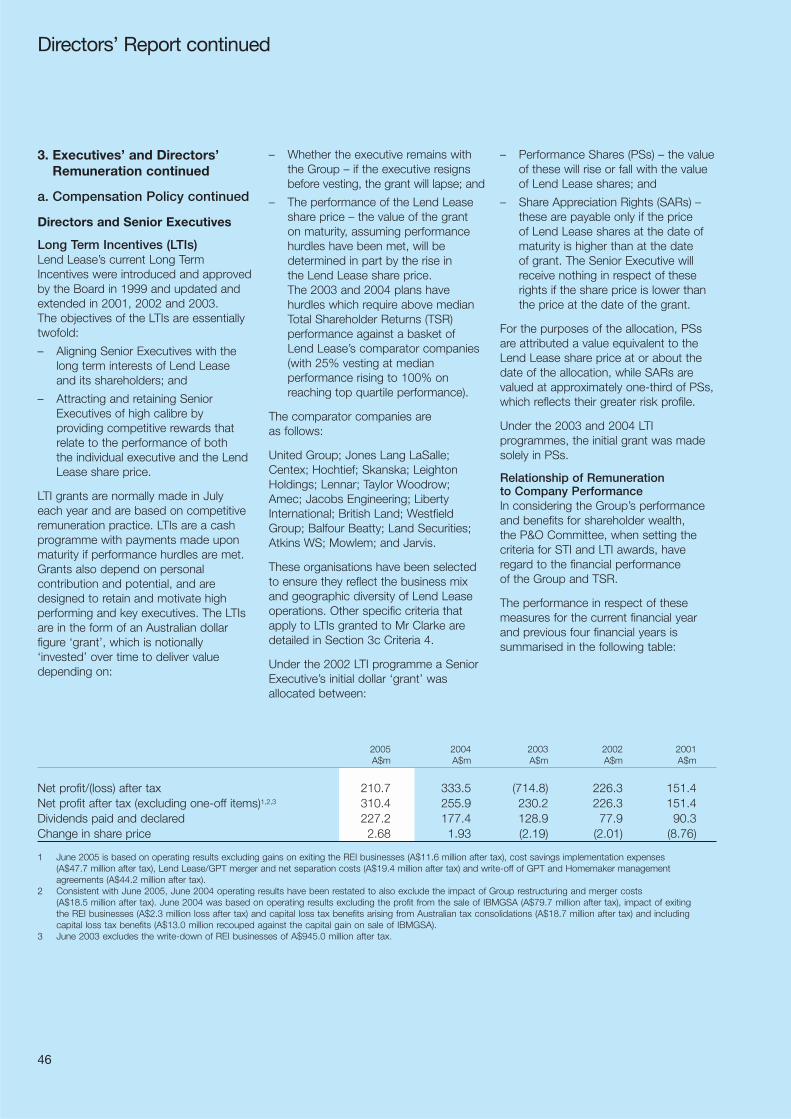
46
3. Executives’ and Directors’Remuneration continued
a. Compensation Policy continued
Directors and Senior Executives
Long Term Incentives (LTIs) Lend Lease’s current Long TermIncentives were introduced and approvedby the Board in 1999 and updated andextended in 2001, 2002 and 2003. The objectives of the LTIs are essentiallytwofold:
– Aligning Senior Executives with thelong term interests of Lend Lease and its shareholders; and
– Attracting and retaining SeniorExecutives of high calibre byproviding competitive rewards thatrelate to the performance of both the individual executive and the LendLease share price.
LTI grants are normally made in July each year and are based on competitiveremuneration practice. LTIs are a cashprogramme with payments made uponmaturity if performance hurdles are met.Grants also depend on personalcontribution and potential, and aredesigned to retain and motivate highperforming and key executives. The LTIsare in the form of an Australian dollarfigure ‘grant’, which is notionally‘invested’ over time to deliver valuedepending on:
– Whether the executive remains withthe Group – if the executive resignsbefore vesting, the grant will lapse; and
– The performance of the Lend Leaseshare price – the value of the grant on maturity, assuming performancehurdles have been met, will bedetermined in part by the rise in the Lend Lease share price. The 2003 and 2004 plans havehurdles which require above medianTotal Shareholder Returns (TSR)performance against a basket of Lend Lease’s comparator companies(with 25% vesting at medianperformance rising to 100% onreaching top quartile performance).
The comparator companies are as follows:
United Group; Jones Lang LaSalle;Centex; Hochtief; Skanska; LeightonHoldings; Lennar; Taylor Woodrow;Amec; Jacobs Engineering; LibertyInternational; British Land; WestfieldGroup; Balfour Beatty; Land Securities;Atkins WS; Mowlem; and Jarvis.
These organisations have been selectedto ensure they reflect the business mixand geographic diversity of Lend Leaseoperations. Other specific criteria thatapply to LTIs granted to Mr Clarke aredetailed in Section 3c Criteria 4.
Under the 2002 LTI programme a SeniorExecutive’s initial dollar ‘grant’ wasallocated between:
– Performance Shares (PSs) – the valueof these will rise or fall with the valueof Lend Lease shares; and
– Share Appreciation Rights (SARs) –these are payable only if the price of Lend Lease shares at the date ofmaturity is higher than at the date of grant. The Senior Executive willreceive nothing in respect of theserights if the share price is lower thanthe price at the date of the grant.
For the purposes of the allocation, PSsare attributed a value equivalent to theLend Lease share price at or about thedate of the allocation, while SARs arevalued at approximately one-third of PSs,which reflects their greater risk profile.
Under the 2003 and 2004 LTIprogrammes, the initial grant was madesolely in PSs.
Relationship of Remuneration to Company PerformanceIn considering the Group’s performanceand benefits for shareholder wealth, the P&O Committee, when setting thecriteria for STI and LTI awards, haveregard to the financial performance of the Group and TSR.
The performance in respect of thesemeasures for the current financial yearand previous four financial years issummarised in the following table:
Directors’ Report continued
2005 2004 2003 2002 2001A$m A$m A$m A$m A$m
Net profit/(loss) after tax 210.7 333.5 (714.8) 226.3 151.4Net profit after tax (excluding one-off items)1,2,3 310.4 255.9 230.2 226.3 151.4Dividends paid and declared 227.2 177.4 128.9 77.9 90.3Change in share price 2.68 1.93 (2.19) (2.01) (8.76)
1 June 2005 is based on operating results excluding gains on exiting the REI businesses (A$11.6 million after tax), cost savings implementation expenses (A$47.7 million after tax), Lend Lease/GPT merger and net separation costs (A$19.4 million after tax) and write-off of GPT and Homemaker managementagreements (A$44.2 million after tax).
2 Consistent with June 2005, June 2004 operating results have been restated to also exclude the impact of Group restructuring and merger costs (A$18.5 million after tax). June 2004 was based on operating results excluding the profit from the sale of IBMGSA (A$79.7 million after tax), impact of exiting the REI businesses (A$2.3 million loss after tax) and capital loss tax benefits arising from Australian tax consolidations (A$18.7 million after tax) and includingcapital loss tax benefits (A$13.0 million recouped against the capital gain on sale of IBMGSA).
3 June 2003 excludes the write-down of REI businesses of A$945.0 million after tax.

47
Profit after tax is considered in setting theSTI targets while dividends, changes inshare price and return of capital areincluded in the TSR calculation which isone of the performance criteria assessedfor the LTI.
The P&O Committee considers that theabove performance-linked remunerationstructure incorporating TSR isappropriate for the following reasons:
– considered to represent shareholders’‘bottom line’ and provide an objective measure of value created for shareholders;
– independent of accounting policiesand favoured by institutionalinvestors; and
– simple to benchmark externally.
Retention AwardsWhen the Board believes that anemployee is an outstanding performerand that Lend Lease Corporation and itsshareholders will gain from incentivisinghim or her to remain with Lend Lease, a retention award may be made. Detailsof the current awards for each specifiedexecutive are included in Long TermIncentive bonuses as part of theremuneration details disclosed in thisreport.
Superannuation/Pension PlansPension plan arrangements are in placein most international locations. In thepast, Senior Executives (and otheremployees) joined either a defined benefitor a defined contribution plan. Entry intoall defined benefit plans has now ceasedacross the Group. All new ExecutiveDirectors and Senior Executives have theopportunity to join defined contributionplans.
Non Executive DirectorsDirectors’ fees have been set atA$105,000 per annum, covering allBoard duties and service on at least oneBoard Committee. Fee levels are in linewith international benchmarks for acompany of Lend Lease’s size. TheChairman’s fees are A$400,000 and
Chairmen of Board Committees receivean additional A$25,000 per annum. If a Director renders or is called upon toperform additional services in connectionwith the affairs of the Company,compensation in addition to any Directors’fees is payable at A$2,800 per day.
In addition, Non Executive Directors arecompensated for time spent travelling to overseas Board and Board Committeemeetings. This additional time iscompensated as follows:
– Travel less than four hoursNil
– Travel between four and 12 hoursA$1,500 each way
– Travel over 12 hoursA$4,000 each way
To allow Directors to receive some oftheir annual compensation in sharesrather than cash, and thus align theirinterests with those of shareholders, a Non Executive Directors’ ShareOwnership Plan was approved at the2000 Annual General Meeting andsubsequently renewed at the 2003Annual General Meeting. This plan allowsDirectors to acquire Lend Lease sharesby forgoing an amount of Directors’ feesequivalent to the value of the sharesacquired. Subscriptions are made at the same price, at the same time andotherwise on the same terms as theShare Purchase Plan available toAustralian and New Zealand registeredshareholders and only while the SharePurchase Plan is operative. (Note: theShare Purchase Plan has not beenoperative since September 2003.) A Director is restricted from dealing withthese shares until retirement. However, a Director may deal with shares at anearlier time to the extent necessary tomeet an earlier tax liability in respect of the shares.
Retirement PlanThe plan is designed to provideretirement benefits for Directors based on fees for Board service. Benefits are
accrued in Lend Lease shares and willfluctuate in line with the value of LendLease shares. Under the plan, theCompany will issue to, or acquire for, orfor the benefit of, each Non ExecutiveDirector a number of Lend Lease sharesequal in value to 0.2 times the Director’sfees (being fees for attending andchairing Board and Board Committeemeetings), but not additional fees.
Allocations are made in arrears on 1 January each year. For this purpose, the value of the shares on acquisition will be the weighted average price ofLend Lease shares traded on theAustralian Stock Exchange during the fivebusiness days prior to 1 January eachyear. The shares will be accessible onlyon retirement. Directors will be exposedto share price risk until this time.However, shares may be sold at anearlier time to the extent necessary tomeet an earlier tax liability in respect ofthe shares.
Retirement Plan ChangeoverArrangementsA defined benefit Retirement Benefit Plan(previous plan) was approved byshareholders at the 1990 Annual GeneralMeeting. Changeover arrangementswhich were approved by shareholders at the 2000 Annual General Meeting havebeen effected to transition from theprevious plan to the current plan forDirectors who were on the Board on 31 December 2000. Under thesearrangements, retiring Non ExecutiveDirectors will receive a multiple applied to the average of their annualemoluments (i.e Directors’ fees andamounts for additional services) over theprevious three years. The multiple is 0.6for each of the first five years of serviceas a Non Executive Director and 0.2 foreach year over five years to 15 years.This multiple for each Director was frozen at the multiples that would haveapplied if the Director had retired on 31 December 2000.

48
3. Executives’ and Directors’Remuneration continued
a. Compensation Policy continued
Non Executive Directors continuedThe following table sets out the accruedretirement benefits under the previousplan as at 30 June 2005 (based on themultiple being frozen on 31 December2000). The Board has resolved to cap the
entitlements under the previous plan at the lower of the accrued retirementbenefit as at 30 June 2003 (with interestpayable at the 60 day bank bill rate) andthe retirement benefit calculated at theactual date of retirement.
Directors’ Report continued
Years of Service Accrued Retirement Accrued Retirementat 31 December 2000 Benefit at 30 June 2005 Benefit at 30 June 2004
Non Executive Directors1 No. A$ A$
G Edington 1 89,899 102,804P Goldmark 1 99,533 93,913
1 Mr Longes does not participate in the previous plan.
Non Executive Directors appointed since 1 January 2001 are not eligible to participate in the previous plan.
b. Remuneration Details – Current YearDetails of the remuneration of the directors of Lend Lease Corporation Limited and Specified Executives of the Lend Lease Group are set out in the following tables:
Primary
Short TermSalary & Fees Salary & Fees Incentive
Base Supplementary Bonus1
June 2005 Location A$000’s A$000’s A$000’s
Specified Directors
Executive Directors
ContinuingG Clarke – Managing Director Aust 1,682 1,877R Taylor – CEO Asia Pacific3 Aust 731 784A Chamberlain – CEO Europe4 UK 1,014 667
3,427 – 3,328
Non ContinuingJ Curin – Finance Director (retired 20 January 2005) UK 589 – 303
Non Executive Directors5
D Crawford – Chairman Aust 432 188G Edington UK 162 15P Goldmark US 191 14R Longes – Deputy Chairman Aust 135 130D Ryan6 Aust 100
1,020 347 –Total Specified Directors 5,036 347 3,631
1 All Short Term Incentive bonuses have been paid in cash and based upon the performance criteria as outlined in Section 3a of this Report.2 Accrued value of LTI benefit for the year as determined by actuarial analysis in addition to payment of vested LTI entitlement (net of prior period accrual amounts).
Refer to Section 3c of this Report.3 Appointed Executive Director on 10 December 2004. From this date, as Executive Director, Mr Taylor’s earnings were A$1,759,481. Equity remuneration
is in respect of Mr Taylor’s participation in the Employee Share Acquisition Plan (ESAP).4 Appointed Executive Director on 10 December 2004. From this date, as Executive Director, Mr Chamberlain’s earnings were A$2,087,797.5 Salary and Fees for Non Executive Directors includes fees for attending, chairing and travelling to Board and Board Committee meetings. Supplementary fees
include fees for additional work undertaken in relation to the GPT merger proposal and in the case of Mr Longes, fees of A$50,000 for his directorship of GPT Management Limited. Equity represents the amount accrued in Lend Lease shares for retirement benefits under Lend Lease’s Non Executive Directors’ retirement plan (refer to Section 3a of this Report).
6 Mr Ryan was appointed a Non Executive Director on 10 December 2004.

49
Employment Equity Other Benefits
Long Term Proportion ofIncentive Non June 2005 RemunerationBonus2 Monetary Superannuation Retirement Benefits ESP/Other Termination Other Total PerformanceA$000’s A$000’s A$000’s A$000’s A$000’s A$000’s A$000’s A$000’s Related %
1,871 630 441 31 6,532 57.4%1,018 6 98 30 1 2,668 44.3%1,232 34 303 16 3,266 39.4%4,121 670 842 – 30 – 48 12,466
1,509 56 175 – – 1,755 40 4,427 40.9%
12 80 71210 24 21112 26 24312 21 2989 13 122
– – 55 – 164 – – 1,5865,630 726 1,072 – 194 1,755 88 18,479

50
Directors’ Report continued
3. Executives’ and Directors’ Remuneration continued
b. Remuneration Details – Current Year continued
Primary
Short TermSalary Incentive& Fees Bonus1
June 2005 Location A$000’s A$000’s
Specified Executives
ContinuingP Marchetto – CEO BLL Americas2 US 640 514P Crewes – General Counsel & Secretary2,3 Aust 394 326J Spanswick – CEO BLL Europe2 UK 517 295P Koziol – CEO LL Communities US2 US 497 414R Johnston – CEO BLL Asia Pacific Aust 330 308R Burrows – Group CFO3 Aust 388 318R Fehring – CEO LL Communities Australia Aust 362 212R Lourey – Group Head Human Resources3
(commenced 2 May 2005) Aust 79 423,207 2,429
Non ContinuingR Oakley – CEO America (cessation 30 November 2004) US 315 219S Bird – Group Head HR (cessation 31 May 2005) UK 517 270R Fisher – CEO Global Markets (cessation 31 December 2004) UK 395 273
1,227 762Total Specified Executives 4,434 3,191
Other Executives
ContinuingB Soller – CFO Asia Pacific/Americas2 Aust 494 317C Cree – Group Head of Risk (commenced 1 August 2004)3 UK 386 237J Daniel – Group Head IIF3 UK 244 67
1,124 621
Non ContinuingD Marks (cessation 15 October 2004)2 Aust 91 123Total Other Executives 1,215 744
1 All Short Term Incentive bonuses have been paid in cash and based upon the performance criteria as outlined in Section 3a of this Report.2 Identified as one of the five most highly remunerated Group Executives under S300A of the Corporations Act 2001.3 Identified as one of the five most highly remunerated Company Executives under S300A of the Corporations Act 2001.
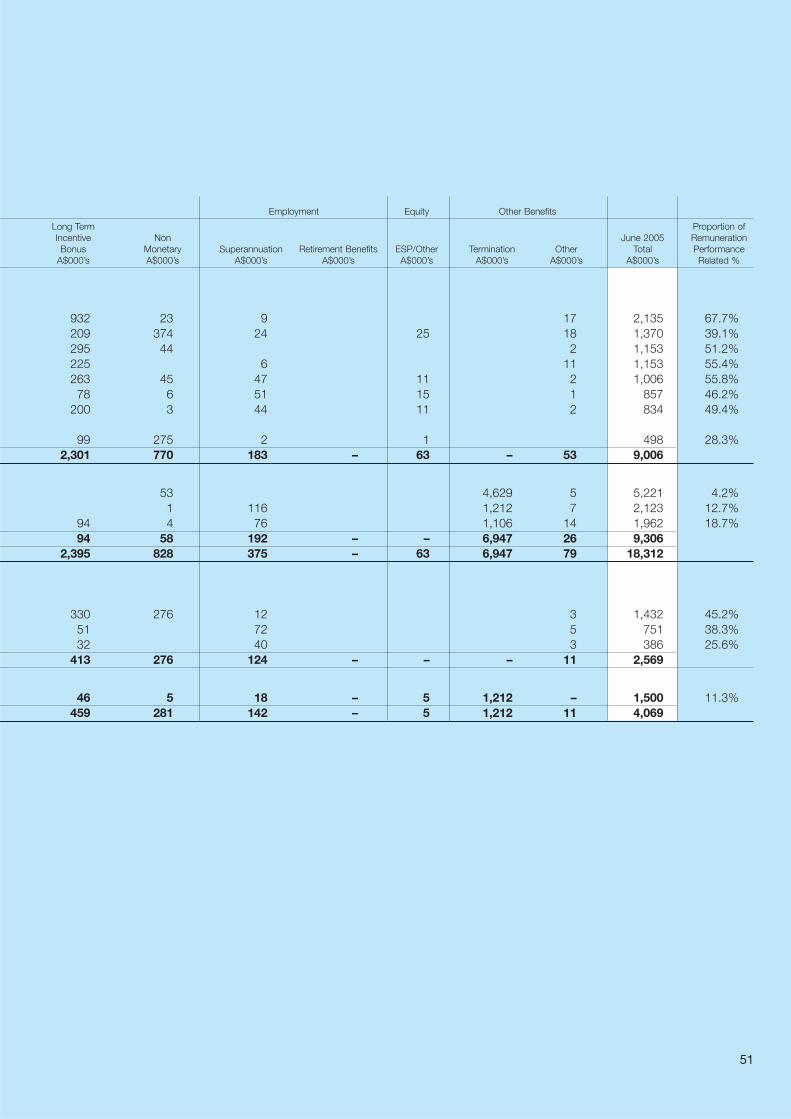
51
Employment Equity Other Benefits
Long Term Proportion ofIncentive Non June 2005 RemunerationBonus Monetary Superannuation Retirement Benefits ESP/Other Termination Other Total Performance
A$000’s A$000’s A$000’s A$000’s A$000’s A$000’s A$000’s A$000’s Related %
932 23 9 17 2,135 67.7%209 374 24 25 18 1,370 39.1%295 44 2 1,153 51.2%225 6 11 1,153 55.4%263 45 47 11 2 1,006 55.8%78 6 51 15 1 857 46.2%
200 3 44 11 2 834 49.4%
99 275 2 1 498 28.3%2,301 770 183 – 63 – 53 9,006
53 4,629 5 5,221 4.2%1 116 1,212 7 2,123 12.7%
94 4 76 1,106 14 1,962 18.7%94 58 192 – – 6,947 26 9,306
2,395 828 375 – 63 6,947 79 18,312
330 276 12 3 1,432 45.2%51 72 5 751 38.3%32 40 3 386 25.6%
413 276 124 – – – 11 2,569
46 5 18 – 5 1,212 – 1,500 11.3%459 281 142 – 5 1,212 11 4,069

52
Directors’ Report continued
3. Executives’ and Directors’ Remuneration continued
c. Long Term Incentives
Service PerformanceCriteria Criteria PS/Other
Specified Executive Directors
G Clarke Criteria 1 Criteria 3 PSCriteria 2 Criteria 4 PSCriteria 3 Criteria 4 PSCriteria 5 Criteria 6 PS
R Taylor Criteria 1 n/a OtherCriteria 5 Criteria 6 PSCriteria 5 Criteria 6 PS
A Chamberlain Criteria 1 n/a OtherCriteria 5 Criteria 6 PSCriteria 5 Criteria 6 PS
Specified Executives
P Marchetto Criteria 5 Criteria 6 PSCriteria 5 Criteria 6 PS
P Crewes Criteria 5 Criteria 6 PSCriteria 5 Criteria 6 PS
J Spanswick Criteria 5 Criteria 6 PSP Koziol Criteria 5 Criteria 6 PS
Criteria 5 Criteria 6 PSR Johnston Criteria 1 n/a Other
Criteria 5 Criteria 6 PSCriteria 5 Criteria 6 PS
R Burrows Criteria 5 Criteria 6 PSCriteria 5 Criteria 6 PS
R Fehring Criteria 5 Criteria 6 PSCriteria 5 Criteria 6 PS
R Lourey Criteria 5 Criteria 6 PS
Criteria 1: The ability to achieve the LTI is dependent upon the Executive remaining with Lend Lease. If the Executive resignsbefore vesting, the grant will lapse.
Criteria 2: The award is dependent upon service to exercise date however an early redemption date due to cessation of servicemay result in a pro-rata payout.
Criteria 3: Progressive percentage monthly vesting of award over the respective award service life.
Criteria 4: The performance criteria relates to Lend Lease’s Total Shareholder Return as against the S&P ASX200 Industrial Index.
Criteria 5: Forfeiture on resignation. Pro-rata on other service cessation.
Criteria 6: Lend Lease’s Total Shareholder Return is greater than the median of 18 comparator Total Shareholder Returns (with 25% vesting at median performance rising to 100% on reaching top quartile performance).
1 Performance shares do not have an exercise price, as they are paid out at the share price at exercise date.2 The % forfeited during the year represents a reduction in the number of performance shares available to vest due to the highest level performance criteria
not being achieved.3 The minimum value of grants yet to vest is A$nil as the performance criteria may not be met and consequently the grant may not vest.4 The maximum value of grants yet to vest is not determinable as it is dependent on the market price of shares of the Company on the Australian Stock Exchange
at the date the grant is exercised.

53
Expiry or Exercise Award Value Value Yet Value Yet Grant Exercise Price1 Granted at Grant Date % Vested in % Forfeited to Vest to VestDate Date A$ Number A$ the Year in the Year2 Minimum3 Maximum4
Dec 2002 Dec 2007 n/a 279,728 2,797,281 20.0% 0.0% nil n/aDec 2002 July 2006 n/a 210,604 2,112,676 0.0% 0.0% nil n/aDec 2002 June 2007 n/a 210,604 2,112,676 0.0% 0.0% nil n/aJuly 2004 June 2007 n/a 212,939 2,199,340 0.0% 0.0% nil n/aSep 2004 Dec 2005 n/a n/a 1,000,000 0.0% 0.0% 1,000,000 1,000,000July 2003 June 2006 n/a 75,492 645,117 0.0% 0.0% nil n/aJuly 2004 June 2007 n/a 63,959 660,601 0.0% 0.0% nil n/aOct 2004 Dec 2005 n/a n/a 1,000,000 0.0% 0.0% 1,000,000 1,000,000July 2003 June 2006 n/a 115,633 988,142 0.0% 0.0% nil n/aJuly 2004 June 2007 n/a 103,243 1,066,345 0.0% 0.0% nil n/a
July 2003 June 2006 n/a 49,686 424,592 0.0% 0.0% nil n/aJuly 2004 June 2007 n/a 46,200 477,177 0.0% 0.0% nil n/aJuly 2003 June 2006 n/a 39,736 339,564 0.0% 0.0% nil n/aJuly 2004 June 2006 n/a 33,668 347,740 0.0% 0.0% nil n/aJuly 2003 June 2006 n/a 46,688 398,972 0.0% 0.0% nil n/aJuly 2003 June 2006 n/a 43,377 370,675 0.0% 0.0% nil n/aJuly 2004 June 2007 n/a 35,662 368,335 0.0% 0.0% nil n/aSep 2004 July 2005 n/a n/a 110,000 0.0% 0.0% 110,000 110,000July 2003 June 2006 n/a 36,226 309,569 0.0% 0.0% nil n/aJuly 2004 June 2007 n/a 16,266 168,003 0.0% 0.0% nil n/aJuly 2003 June 2006 n/a 14,765 126,174 0.0% 0.0% nil n/aJuly 2004 June 2007 n/a 12,766 131,854 0.0% 0.0% nil n/aJuly 2003 June 2006 n/a 18,424 157,442 0.0% 0.0% nil n/aJuly 2004 June 2007 n/a 30,501 315,030 0.0% 0.0% nil n/aJuly 2004 June 2007 n/a 38,728 400,002 0.0% 0.0% nil n/a
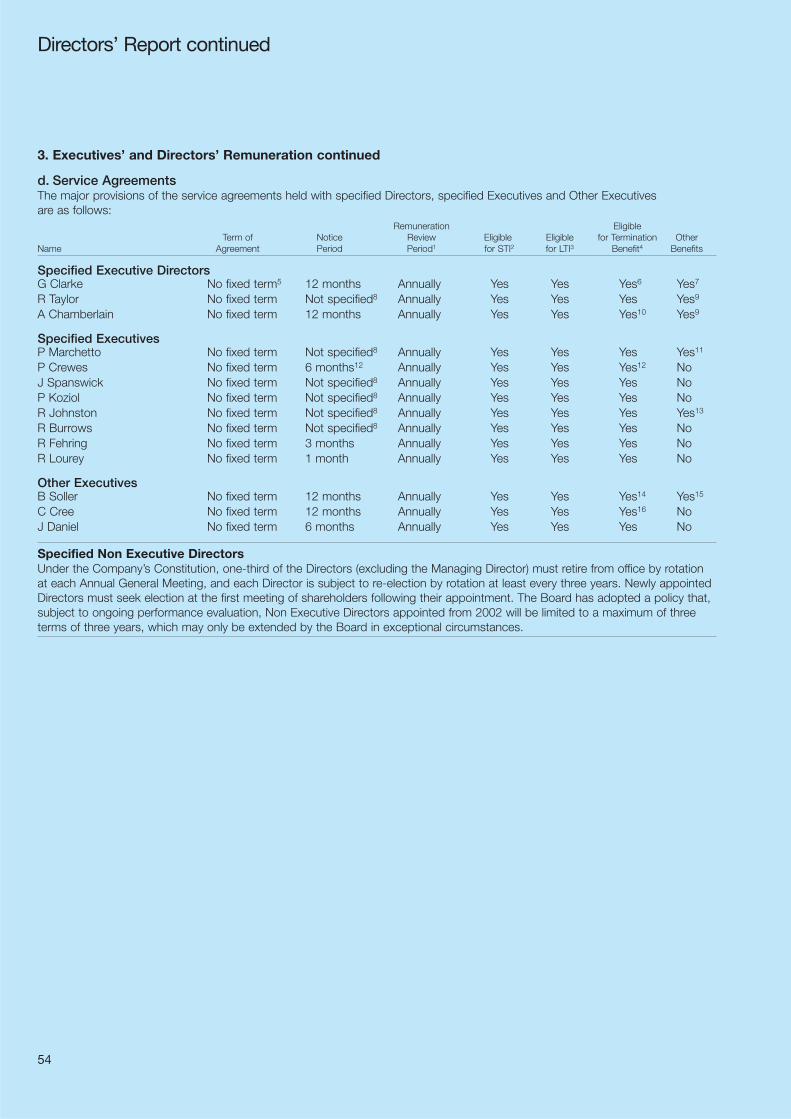
54
3. Executives’ and Directors’ Remuneration continued
d. Service AgreementsThe major provisions of the service agreements held with specified Directors, specified Executives and Other Executives are as follows:
Remuneration EligibleTerm of Notice Review Eligible Eligible for Termination Other
Name Agreement Period Period1 for STI2 for LTI3 Benefit4 Benefits
Specified Executive DirectorsG Clarke No fixed term5 12 months Annually Yes Yes Yes6 Yes7
R Taylor No fixed term Not specified8 Annually Yes Yes Yes Yes9
A Chamberlain No fixed term 12 months Annually Yes Yes Yes10 Yes9
Specified ExecutivesP Marchetto No fixed term Not specified8 Annually Yes Yes Yes Yes11
P Crewes No fixed term 6 months12 Annually Yes Yes Yes12 NoJ Spanswick No fixed term Not specified8 Annually Yes Yes Yes NoP Koziol No fixed term Not specified8 Annually Yes Yes Yes NoR Johnston No fixed term Not specified8 Annually Yes Yes Yes Yes13
R Burrows No fixed term Not specified8 Annually Yes Yes Yes NoR Fehring No fixed term 3 months Annually Yes Yes Yes NoR Lourey No fixed term 1 month Annually Yes Yes Yes No
Other ExecutivesB Soller No fixed term 12 months Annually Yes Yes Yes14 Yes15
C Cree No fixed term 12 months Annually Yes Yes Yes16 NoJ Daniel No fixed term 6 months Annually Yes Yes Yes No
Specified Non Executive Directors Under the Company’s Constitution, one-third of the Directors (excluding the Managing Director) must retire from office by rotationat each Annual General Meeting, and each Director is subject to re-election by rotation at least every three years. Newly appointedDirectors must seek election at the first meeting of shareholders following their appointment. The Board has adopted a policy that,subject to ongoing performance evaluation, Non Executive Directors appointed from 2002 will be limited to a maximum of threeterms of three years, which may only be extended by the Board in exceptional circumstances.
Directors’ Report continued

55
1 Reviewed annually by the P&O Committee of the Lend Lease Corporation Board.2 Refer to Section 3a of this Report for further details and conditions.3 Refer to Sections 3a and 3c of this Report for further details and conditions.4 Unless otherwise stated, termination payment includes base salary for remainder of notice period not served (up to 12 months), pro-rated STI entitlements
and LTI entitlements per LTI rules.5 Appointed for a period of five years from 9 December 2002 in accordance with the Lend Lease Corporation Constitution.6 Termination payment includes base salary for remainder of notice period not served, cash value of pro-rated benefits, pro-rated STI entitlements
(based on 60% achievement of objectives), LTI entitlements per LTI rules and the value of the retention award (refer to footnote 7).7 Includes a retention award which will fully vest if Mr Clarke remains until 9 December 2007 or if the Company terminates his employment without cause prior
to that date. At that time, Mr Clarke will be entitled to a cash payment equal to the value of 279,728 Lend Lease shares. This equates to an award value of£1,000,000 at the date of grant with the end payment value referable to the market value of that number of Lend Lease shares as at that date. The retentionaward will be forfeited altogether if Mr Clarke resigns prior to 9 December 2007 or if his employment is terminated by Lend Lease for cause. A pro-rata amountwill be payable if the company determines that Mr Clarke’s employment should be terminated for poor performance. In addition, Mr Clarke’s service agreementincludes a non compete (for six months) and non-solicitation obligation (for 12 months) post termination. Following relocation to Australia effective 1 July 2004, the contract includes a relocation package entitlement including accommodation, school fees, home leave travel, club membership and tax advice.
8 It is expected that the required notice would be in the range of that given to other Specified Executives having regard to seniority and length of service.9 A cash retention award of A$1,000,000, payable 20 December 2005.10 Termination payment includes base salary for remainder of notice period not served, cash value of pro-rated prescribed/non monetary benefits, pro-rated STI
entitlements (based on 60%achievement of objectives) and LTI entitlements per LTI rules. The service agreement includes a non compete (for 6 months) and non-solicitation obligation (for 12 months) post termination.
11 Mr Marchetto has a US$300,000 loan, payable at call. A cash retention of US$500,000, vested on 30 June 2005.12 In addition to notice, Mr Crewes is entitled to a lump sum termination payment which includes base salary for six months, a pro-rata bonus amount and the cash
value of prescribed/non monetary benefits. Mr Crewes’ service agreement includes a non compete (for six months) and non-solicitation obligation (for 12 months)post termination.
13 Mr Johnston has a cash retention award of A$110,000, payable 1 July 2005.14 Mr Soller is entitled to relocation assistance on company termination or post June 2006 on resignation.15 Following Mr Soller’s relocation to Australia in 2004, the contract includes a living allowance, school fees, tax advice, and home leave travel allowance.16 Termination payments include base salary for remainder of notice period not served, pro-rated STI entitlements (based on 60%achievement of objectives)
and LTI entitlements per LTI rules. The service agreement includes a non-compete/non-solicitation obligation for three months.
e. Additional InformationAdditional information in relation to Executives’ and Directors’ Equity Holdings and Transactions, Loans and Other Transactions is contained in Note 8 of the Concise Financial Statements.

56
Directors’ Report continued
3. Executives’ and Directors’ Remuneration continued
f. Remuneration Details – Comparative Year
Primary
Short TermIncentive
Salary & Fees Bonus1
June 2004 Location A$000’s A$000’s
Specified Directors
Executive Directors
ContinuingG Clarke – Managing Director2 UK 1,443 1,476J Curin – Finance Director (appointed 8 September 2003) UK 794 488
2,237 1,964
Non ContinuingR Tsenin – Finance Director (retired 31 August 2003)5 UK 197 300
Non Executive Directors3
D Crawford – Chairman Aust 282R Longes – Deputy Chairman Aust 2224
P Goldmark US 139G Edington UK 124
767 –Total Specified Directors 3,201 2,264
1 All Short Term Incentive bonuses have been paid in cash and are based upon the performance criteria as outlined in Section 3a of this Report.2 Relocated to Australia in July 2004.3 Salary and Fees for Non Executive Directors includes fees for attending, chairing and travelling to Board and Board Committee meetings.
Equity represents the amount accrued in Lend Lease shares for retirement benefits under Lend Lease’s Non Executive Directors’ retirement plan (refer to Section 3a of this Report).
4 Includes Directors’ Fees for the Lend Lease Corporation Board of A$102,180 and Directors’ Fees for Associated Company Boards of A$120,000.5 Equity remuneration is in respect of Mr Taylor’s participation in the Employee Share Acquisition Plan (ESAP).

57
Employment Equity Other Benefits
Long Term Proportion ofIncentive Non Super- Retirement June 2004 RemunerationBonus Monetary annuation Benefits ESP/Other Termination Other Total Performance
A$000’s A$000’s A$000’s A$000’s A$000’s A$000’s A$000’s A$000’s Related %
724 28 414 26 4,111 53.5%116 69 238 24 1,729 34.9%840 97 652 – – – 50 5,840
146 10 9 – 5 1,929 34 2,630 17.0%
11 61 3546 16 2446 18 1636 18 148
– – 29 – 113 – – 909986 107 690 – 118 1,929 84 9,379

58
Directors’ Report continued
3. Executives’ and Directors’ Remuneration continued
f. Remuneration Details – Comparative Year continued
Primary
Short TermIncentive
Salary & Fees Bonus1
June 2004 Location A$000’s A$000’s
Specified Executives
ContinuingR Oakley – CEO America (commenced 11 November 2003)2 US 435 441R Taylor – CEO Asia Pacific2 Aust 719 581A Chamberlain – CEO EMEA (commenced 26 September 2003)2 UK 759 431P Crewes – General Counsel and Secretary2 UK 373 351R Fisher – CEO Global Markets (commenced 1 September 2003) UK 709 359S Bird – Group Head HR UK 534 302
3,529 2,465
Non ContinuingD Ross – CEO REI Global (cessation 31 December 2003)2 US 394 219P Ladron de Guevara – CEO Global Markets(cessation 31 March 2004)2 Spain 351 106C Bacon – CEO BLL US (cessation 31 October 2003) US 173 97
918 422Total Specified Executives 4,447 2,887
Other Executives
ContinuingP Marchetto – Operations Manager BLL US2 US 570 426
Non ContinuingD Skidmore – REI US Debt Principal (cessation 31 January 2004)2 US 251 1,001Total Other Executives 821 1,427
1 All Short Term Incentive bonuses have been paid in cash and are based upon the performance criteria as outlined in Section 3a of this Report.2 Identified as one of the five most highly remunerated Company and Group Executives under S300A of the Corporations Act 2001.
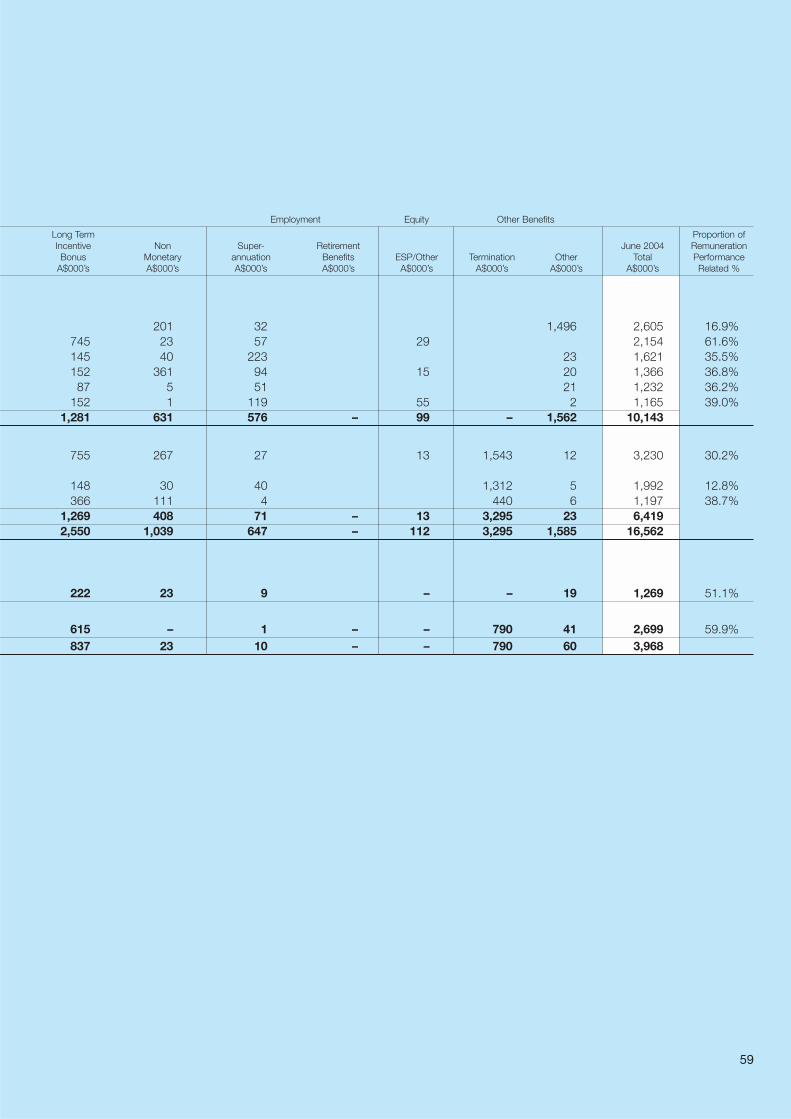
59
Employment Equity Other Benefits
Long Term Proportion ofIncentive Non Super- Retirement June 2004 RemunerationBonus Monetary annuation Benefits ESP/Other Termination Other Total Performance
A$000’s A$000’s A$000’s A$000’s A$000’s A$000’s A$000’s A$000’s Related %
201 32 1,496 2,605 16.9%745 23 57 29 2,154 61.6%145 40 223 23 1,621 35.5%152 361 94 15 20 1,366 36.8%87 5 51 21 1,232 36.2%
152 1 119 55 2 1,165 39.0%1,281 631 576 – 99 – 1,562 10,143
755 267 27 13 1,543 12 3,230 30.2%
148 30 40 1,312 5 1,992 12.8%366 111 4 440 6 1,197 38.7%
1,269 408 71 – 13 3,295 23 6,4192,550 1,039 647 – 112 3,295 1,585 16,562
222 23 9 – – 19 1,269 51.1%
615 – 1 – – 790 41 2,699 59.9%837 23 10 – – 790 60 3,968

60
4. Other
a. Share OptionsNo share options were issued during theyear by the Company or any of itscontrolled entities, and there are no suchoptions on issue.
b. Indemnification and Insurance of Directors and Officers
The Company’s Constitution provides for indemnification in favour of each ofthe Directors named on pages 40 to 42of this Report, the Company Secretaries, Mr Crewes and Ms Sharpe, and officersof the Company or of wholly ownedsubsidiaries or related entities of theCompany (Officers) to the extentpermitted by the Corporations Act 2001.
For related entities, the indemnification isprovided unless the Directors determineotherwise. For unrelated entities in whichLend Lease has an interest, deeds ofindemnity may be entered into betweenLend Lease Corporation Limited and theDirector or Officer. Since the date of thelast report, the Company has entered into separate deeds of indemnity inrelation to the participation by Mr Crewesand Mr Taylor on the Due DiligenceCommittee for the proposed mergertransaction with General Property Trustwhich did not proceed.
In accordance with the Corporations Act2001, the Constitution also permits theCompany to purchase and maintaininsurance or pay or agree to pay apremium for insurance for Officersagainst any liability incurred as an Officerof the Company or of a related bodycorporate. This may include a liability forreasonable costs and expenses incurredin defending proceedings, whether civil or criminal, and whatever their outcome.During the year, Lend Lease paidinsurance premiums of A$1,344,545 in respect of its Directors’ and Officers’liability policies.
c. Non-Audit ServicesDuring the year KPMG, the Company’sauditor, performed certain other servicesin addition to its statutory duties.
The Board has considered the non-auditservices provided during the year by theauditor and in accordance with writtenadvice provided by resolution of the Risk Management and Audit Committee,is satisfied that the provision of those non-audit services during the year by the auditor is compatible with, and did not compromise, the auditorindependence requirements of theCorporations Act 2001 for the following reasons:
– All non-audit services were subject tothe corporate governance proceduresadopted by the Company and havebeen reviewed by the RiskManagement and Audit Committee to ensure they do not impact theintegrity and objectivity of the auditor;and
– The non-audit services provided donot undermine the general principlesrelating to the auditor’s independenceas set out in Professional StatementF1 Professional Independence, asthey did not involve reviewing orauditing the auditor’s own work,acting in a management or decisionmaking capacity for the Company,acting as an advocate for theCompany or jointly sharing risks and rewards.
A copy of the Lead Auditor’sIndependence Declaration as requiredunder Section 307C of the CorporationsAct 2001 is included at the end of the Directors’ Report.
Details of the amounts paid to the auditorof the Company, KPMG, and its relatedpractices for audit and non-audit servicesprovided during the year, are set out below.
Directors’ Report continued
Consolidated
June June2005 2004
A$000s A$000s
Auditing and Review of Financial Reports 4,856 5,522
Other Services
KPMGInternational assignees tax services 1,877 2,532Tax services 1,748 3,148Accounting advice 384 714Other services 173 605
KPMG Related PracticesDue diligence 3,545 1,045
Total Other Services 7,727 8,044

61
d. Rounding OffLend Lease Corporation Limited is acompany of the kind referred to in theAustralian Securities and InvestmentsCommission Class Order 98/100 dated10 July 1998 and, in accordance with
that class order, amounts in the financialstatements and this Report have beenrounded off to the nearest tenth of amillion dollars, or where the amount isA$50,000 or less, zero, unless specificallystated to be otherwise.
This Report is made in accordance with aresolution of the Board of Directors and issigned for and on behalf of the Directors.
D A Crawford Chairman
G A ClarkeManaging Director
Sydney, 17 August 2005.
Lead Auditor’s IndependenceDeclaration under Section 307Cof the Corporations Act 2001
To: The Directors of Lend LeaseCorporation Limited
I declare that, to the best of myknowledge and belief, in relation to theaudit for the financial year ended 30 June2005 there have been:
(i) no contraventions of the auditorindependence requirements as setout in the Corporations Act 2001 in relation to the audit; and
(ii) no contraventions of any applicablecode of professional conduct inrelation to the audit.
KPMG G R WilsonPartner

62
Five Year Profile
June June June June June2005 2004 2003 2002 2001
ProfitabilityOperating revenue A$m 9,539 9,726 10,114 12,478 11,454Operating profit/(loss) before tax A$m 344 466 (567) 391 241Operating profit before tax, excluding one-off items1, 2, 3 A$m 451 385 315 391 241Operating profit/(loss) after tax A$m 211 334 (715) 226 151Operating profit after tax, excluding one-off items1, 2, 3 A$m 310 256 230 226 151
Divisional Contribution1, 2, 3, 4
Bovis Lend Lease (BLL) A$m 138 105 158 113 90Integrated Development Businesses (IDB) A$m 104 79 42 40 31Real Estate Investments (REI) A$m 137 110 161 141 117Other5 A$m 22 (10) 54 27Corporate amortisation A$m (44) (48) (75) (92) (89)Corporate other6 A$m (25) (12) (46) (30) (25)Total7 A$m 310 256 230 226 151
EBITDA, excluding one-off items1, 2, 3 A$m 512 430 474 593 339Earnings per share, excluding one-off items1, 2, 3, 8 cents 77.8 61.8 52.5 52.1 33.5Operating profit after tax to shareholders’ equity (ROE) for the period, excluding one-off items1, 2, 3, 9 % 11.0 9.0 6.5 6.1 4.1Dividend per share10 cents 57 44 30 18 21Dividend payout ratio, excluding one-off items1, 2, 3, 10 % 73.2 69.2 56.0 34.4 59.6
Corporate StrengthTotal assets A$m 6,557 7,131 7,409 8,587 9,060Cash A$m 569 1,380 867 904 1,119Borrowings A$m 500 862 885 939 1,081Current assets A$m 2,601 3,455 3,703 4,015 4,278Current liabilities A$m 3,281 3,328 2,993 3,245 3,568Shareholders’ equity A$m 2,791 2,836 3,008 3,752 3,667Cash flows from operations A$m (29) 443 191 557 287Net asset backing per share A$ 7.00 7.08 6.86 8.63 8.54Ratio of current assets to current liabilities times 0.79 1.04 1.24 1.24 1.20Debt to shareholders’ equity % 17.9 30.4 29.4 25.0 29.5Debt to shareholders’ equity plus debt % 15.2 23.3 22.7 20.0 22.8Net debt to shareholders’ equity % (2.5) (18.3) 0.6 0.9 (1.0)Debt to total market capitalisation % 9.7 20.9 24.2 20.5 20.0Shares on issue m 399 400 439 435 430Number of shareholders No. 52,878 63,143 74,878 86,003 87,516Number of equivalent full time employees No. 8,791 9,060 9,992 10,554 10,484Assets under management11 A$b 11.6 19.6 82.0 86.1 92.1
Shareholders’ Returns and StatisticsProportion of shares on issue to top 20 shareholders % 75.6 69.8 61.5 59.9 54.3Staff shareholdings % 10.8 11.9 13.5 13.7 14.1Total dividends paid or declared A$m 227 177 129 78 90Share price as at 30 June as quoted on the Australian Stock Exchange A$ 12.96 10.28 8.35 10.54 12.55
Footnotes are located on next page.

63
1 June 2005 is based on operating results excluding gains on exiting the Real Estate Investments (REI) businesses (A$26.9 million before tax, A$11.6 million after tax), cost savings implementation expenses (A$65.8 million before tax, A$47.7 million after tax), Lend Lease/GPT merger and net separation costs (A$24.2 million before tax, A$19.4 million after tax) and the write-off of GPT and Homemaker management agreements (before and after tax A$44.2 million).
2 Consistent with June 2005, June 2004 operating results have been restated to also exclude the impact of Group restructuring and merger costs (A$23.2 millionbefore tax and A$18.5 million after tax). June 2004 was based on operating results excluding the profit from the sale of IBMGSA (A$111.5 million before tax,A$79.7 million after tax), impact of exiting the REI businesses (A$7.2 million loss before tax, A$2.3 million loss after tax) and capital loss tax benefits arising fromAustralian tax consolidations (A$nil before tax, A$18.7 million after tax) and including capital loss tax benefits (A$nil before tax, A$13.0 million recouped against the capital gain on sale of IBMGSA).
3 June 2003 excludes the write-down of REI businesses of A$882.0 million before tax, A$945.0 million after tax.4 Consistent with June 2004, corporate costs are no longer allocated to the regions for segment reporting purposes. All corporate costs are shown gross as part
of the Corporate segment. The June 2003 results have been restated on a consistent basis. The years prior to June 2003 have not been restated.5 Other consists of non-core businesses including Capital Services, IT+T (IBMGSA) and eBusiness Investments and Equity Investments.6 Includes Group Treasury and Corporate administration services.7 Includes A$28.8 million (June 2004 A$7.9 million) operating results relating to discontinued operations.8 Earnings per share, including gains on exiting the REI businesses, cost savings implementation expenses, Lend Lease/GPT merger and net separation costs
and write-off of GPT and Homemaker management agreements were 52.8 cents for June 2005. Equity represents the average balance for the period.9 Return On Equity, including gains on exiting the REI businesses, cost savings implementation expenses, Lend Lease/GPT merger and net separation costs
was 7.5% for June 2005.10 June 2005 is calculated using the final dividend declared since 30 June 2005 to be paid 14 September 2005.11 June 2005 represents assets under management relating to continuing operations only. The years prior to June 2004 have not been restated to exclude
discontinued operations.

64
Concise Management’s Discussion and Analysis of Financial Condition and Results of Operations (Concise MD&A)
All amounts in the MD&A are expressed in Australian dollars unless otherwise specified.
The following discussion and analysis is based on the Group’s Consolidated Financial Statements for the financial year ended 30 June 2005 and should be read in conjunction with those Financial Statements.
Overview
IntroductionLend Lease provides a broad range of real estate services to clients in three regions – Asia Pacific, Americas and Europe.
During the year ended June 2005, the principal activities were conducted through three divisions, Bovis Lend Lease, IntegratedDevelopment Businesses, and Real Estate Investments. Bovis Lend Lease provides construction, project management and designservices across all regions. Integrated Development Businesses comprises Delfin Lend Lease, Lend Lease Development andSenior Living in Australia; Actus Lend Lease in America; and the Public Private Partnerships (PPP), Retail Development andCommunities businesses in Europe. Real Estate Investments’ principal business is real estate investment management in AsiaPacific and Europe.
In management’s opinion, no single factor determines the Group’s financial condition or the profitability of its divisions. Lend Leaseuses a range of performance measures for evaluating different businesses. In addition to profit, the key performance measuresused to evaluate future profitability of the businesses are Backlog Gross Profit Margin (GPM) for Bovis Lend Lease, Backlog forUrban Communities, and Assets Under Management (AUM) for Real Estate Investments. The following provides a summary of the Group’s performance.
Segment Results SummaryThe financial results for the year ended June 2005 are summarised below.
Operating Profit/(Loss) Operating Profit/(Loss)Operating Revenue EBITDA Before Tax After Tax1, 2, 3
June 2005 June 2004 June 2005 June 2004 June 2005 June 2004 June 2005 June 2004$m $m $m $m $m $m $m $m
Bovis Lend Lease 8,082.5 7,696.0 204.3 183.3 191.1 169.2 137.8 105.1
Integrated Development Businesses 910.7 808.0 170.5 118.0 170.4 116.8 103.9 78.8
Real Estate InvestmentsContinuing operations 245.7 228.0 157.9 146.5 157.4 145.4 108.4 100.3Discontinuing operations2 72.9 134.5 39.0 24.0 38.6 20.8 28.9 10.1Total Real Estate Investments 318.6 362.5 196.9 170.5 196.0 166.2 137.3 110.4Total Operating 9,311.8 8,866.5 571.7 471.8 557.5 452.2 379.0 294.3
Non-Core Investments 0.5 25.5 0.5 19.7 0.5 19.7 0.3 22.1
CorporateNet corporate 27.4 65.4 (51.4) (50.3) (51.5) (51.0) (23.0) (28.4)Group amortisation
Continuing operations (44.6) (46.2) (43.9) (46.2)Discontinuing operations2 (0.1) (2.2) (0.1) (2.2)
Group Treasury 44.6 62.9 (8.5) (11.5) (10.4) 12.2 (1.9) 16.3Total Corporate 72.0 128.3 (59.9) (61.8) (106.6) (87.2) (68.9) (60.5)Total Group results before one-off items 9,384.3 9,020.3 512.3 429.7 451.4 384.7 310.4 255.9
One-off Items Cost saving implementation (65.8) (13.5) (65.8) (13.5) (47.7) (9.5)General Property Trust merger scheme and net separation costs4 114.4 (18.3) (9.7) (24.2) (9.7) (19.4) (9.0)Write-down of management agreements (44.2) (44.2) (44.2)Net impact of exit from Real Estate Investments businesses5 39.8 547.9 26.9 (7.2) 26.9 (7.2) 11.6 (2.3)Profit on sale of IBMGSA 157.3 111.5 111.5 79.7Tax benefit from tax consolidation 18.7Total Group 9,538.5 9,725.5 410.9 510.8 344.1 465.8 210.7 333.5
1 Operating profit/(loss) after tax is after deducting the amount attributable to outside equity interests of $10.0 million (June 2004 $4.1 million).2 Discontinuing operations include those businesses which have been sold or are in the process of being divested or wound down. 3 The June 2004 Group result of $255.9 million before one-off items excludes $18.5 million of restructuring and merger costs which have been separately disclosed
within one-off items.4 General Property Trust merger scheme and net separation costs include advisor and legal fees, marketing and loan facility arrangement costs, net of $1.1 million
profit (after tax) on the sale of General Property Trust units and a separation payment received of $16.0 million.5 Net impact of exit from Real Estate Investments businesses of $11.6 million includes profit after tax on the sale of Real Estate Investments businesses of $10.0 million.
64

Operating Profit After TaxThe Group’s operating profit after tax (including one-off items) of $210.7 million for the year ended June 2005 is a decrease of $122.8 million from the year ended June 2004. The June 2005 result included a loss after tax relating to one-off items of $99.7 million, whereas June 2004 included profit after tax from one-off items of $77.6 million.
The Group’s operating profit after tax before one-off items of $310.4 million is an increase of $54.5 million from the previous year.The main reasons for the higher profit after tax before one-off items are as follows:
– An increase of $32.7 million in the Bovis Lend Lease profit after tax, principally due to an improvement in the Asia Pacific resultof $41.7 million;
– An increase in the Integrated Development Business profit after tax of $25.1 million, principally due to an increase in Europe of $12.2 million reflecting the timing of bid costs and bid cost recoveries relating to UK PFI Healthcare projects, and anincrease in the Actus Lend Lease profit after tax of $17.2 million due to development fees earned on three military privatisationprojects which reached financial close during the year;
– An increase in the Real Estate Investments profit after tax of $26.9 million, comprising an increase in continuing operations of $8.1 million due to increased investment income from Bluewater, King of Prussia, Lend Lease’s interest in units in GeneralProperty Trust, Australian Prime Property Fund (APPF) and Asia Pacific Investment Company (APIC); and an increase in profitafter tax from discontinuing operations of $18.8 million due to reduced losses of $9.7 million in Asia and increased profit aftertax of $12.0 million from the sale of co-investments in America;
– A reduction in the net corporate costs after tax of $5.4 million; and
– A reduction in amortisation of $4.4 million after tax.
These increases were offset by:
– A decline of $21.8 million profit after tax from non-core investments; and
– A decline in the treasury result of $18.2 million largely due to a reduction in interest income.
The Group’s operating profit after tax before one-off items, discontinuing operations and non-core investments of $281.3 million is $55.4 million (25%) above the year to June 2004 profit of $225.9 million.
Backlog GPM SummaryBacklog GPM represents the expected GPM to be earned for the balance of work to be completed under existing constructionand facilities management contracts. Backlog GPM is a key measure for Bovis Lend Lease, Actus Lend Lease and the facilitiesmanagement business associated with PPP contracts (New Work Secured and Backlog GPM information is unaudited).
The following table provides a summary of New Work Secured GPM for the year ended June 2005 and the Backlog GPM as atthat date.
New Work Backlog ClosingOpening Foreign Secured GPM Backlog
Backlog GPM Exchange GPM1 Realised GPM at at June 2004 Adjustment June 2005 June 2005 June 2005
$m $m $m $m $m
Bovis Lend Lease 521.6 (41.5) 701.3 (500.1) 681.3PPP/PFI (facilities management) 44.6 (2.1) 19.5 (4.3) 57.7Actus Lend Lease 73.7 (9.1) 381.4 (70.6) 375.4Total Secured Backlog GPM 639.9 (52.7) 1,102.2 (575.0) 1,114.4
Preferred bidder 425.7 (44.3) (316.2) 65.2Total Backlog 1,065.6 (97.0) 786.0 (575.0) 1,179.6
1 The negative New Work Secured of $316.2 million for preferred bidder projects reflects GPM on projects that were awarded preferred bidder status during the year less GPM transferred from preferred bidder status to operational project New Work Secured following project financial close.
– Bovis Lend Lease Backlog increased by $159.7 million (31%) to $681.3 million as at June 2005. The increase was largely dueto an increase in the Bovis Lend Lease Europe Backlog of $125.4 million where Leeds and Manchester Hospitals reachedfinancial close during the year and the BP Alliance agreement was renewed for a further five years. The Leeds and ManchesterHospitals Backlog GPM was previously included as part of preferred bidder Backlog;
– Total Backlog including Actus Lend Lease projects, facilities management and Backlog for projects at preferred bidder stageincreased 11% from $1,065.6 million at June 2004 to $1,179.6 million at June 2005; and
– Total New Work Secured, including projects at preferred bidder status, increased by $26.1 million to $786.0 million in the yearended June 2005.
65

66
Concise Management’s Discussion and Analysis of Financial Condition and Results of Operations (Concise MD&A) continued
Overview continued
Urban Communities BacklogLend Lease is involved in the development of large scale urban communities in the UK, the US and Australia. The number of lotsunder management is a key guide to future profitability and growth potential of the Urban Communities businesses. Lots/unitsunder management is relevant for Delfin Lend Lease, Lend Lease Development, Senior Living, Actus Lend Lease and theCommunities business in the UK. The Backlog (unaudited) for each business unit is summarised below:
June 2005 June 2004 Average ProjectNumber Backlog Backlog Life Remaining
of Projects (No. of Lots/Units) (No. of Lots/Units) (Years)
Delfin Lend Lease (Australia) 17 27,500 29,200 1 – 14Lend Lease Development (Australia) 9 8,100 8,000 1 – 13Senior Living (Australia)1 8 533 600 1 – 5Actus Lend Lease (Americas)2 7 27,700 24,400 48 – 50Communities (UK) 1 10,000 10,000 15 – 20Total zoned lots under management 42 73,833 72,200Delfin Lend Lease unzoned 4 41,800 21,800Communities (UK) unzoned 1 5,000Total zoned and unzoned 47 120,633 94,000
1 Senior Living number of units relates to potential units on existing sites.2 Includes projects at preferred bidder stage.
Property InvestmentsAs at June 2005 Lend Lease had $1.5 billion invested in property assets held directly or indirectly (excluding inventory held as partof Delfin Lend Lease and Lend Lease Development). The Group had a return on its direct and indirect property interests for theyear ended June 2005 of 8.3% before tax.
These interests include:
– A 30% direct interest in the Bluewater shopping centre in the UK plus a 1% indirect holding through the Lend Lease Retail Partnership;
– A 50% interest in the King of Prussia shopping centre in the US; and
– Investments held in property funds in Asia Pacific, Europe, the US and the Global Fund.
Book MarketIncome1 Value Value2
June 2005 June 2005 June 2005$m $m $m
Bluewater3 62.6 550.0 1,318.3King of Prussia 23.2 195.8 358.4Other investments4
Asia Pacific 13.7 429.9 462.1Europe 8.6 163.5 215.9North America 20.2 69.7 84.8Global Fund 129.2 171.9
Total direct and indirect assets 128.3 1,538.1 2,611.4
1 Represents Lend Lease’s income before tax from properties and investments, net of direct expenses.2 Market value is the gross value based on independent valuations.3 The independent market valuation at 30 June 2005 of 100% of Bluewater was £1,823.6 million ($4,394.2 million).4 Other investments relate to investments in property funds currently or previously managed by Lend Lease.

67
Assets Under Management (AUM) The Real Estate Investments businesses in Asia Pacific and Europe earn management fees from assets under management from both retail and wholesale funds.
The following table summarises assets under management of the continuing Real Estate Investments businesses:
Total TotalAustralia Asia Europe June 2005 June 2004
$b $b £b $b $b
AUM at the beginning of financial year1 13.1 0.9 2.2 19.6 17.4Additions 1.4 0.1 1.7 1.9Reductions (10.9) (0.1) (11.0) (0.7)Net revaluations 0.9 0.3 1.7 1.1Exchange movement2 (0.4) (0.1)AUM at the end of financial year 4.5 0.8 2.6 11.6 19.6Movement in AUM (65.6%) (11.1%) 18.2% (40.8%) 12.6%
1 AUM represents the gross market value of real estate assets managed in an advisory capacity on behalf of investors.2 Exchange movement arising from translating AUM in local currency between June 2004 and June 2005.
Assets under management decreased $8.0 billion from $19.6 billion to $11.6 billion, primarily due to the loss of AUM from GeneralProperty Trust, following the internalisation of its management. Excluding the impact of General Property Trust internalisation, AUMremained constant at $11.6 billion between June 2004 and June 2005.
Shareholder Returns (before one-off items)June June2005 20041
EBITDA $m 512.3 429.7
Earnings per share (EPS)2 (including amortisation) cents 77.8 61.8Earnings per share (EPS)2 (excluding amortisation) cents 88.3 72.7
Return on equity (ROE)2 for the financial year (including amortisation) % 11.0 9.0Return on equity (ROE)2 for the financial year (excluding amortisation) % 11.6 9.9
1 The June 2004 EBITDA, earnings per share and return on equity have been restated to reflect the reclassification of $23.2 million group restructuring and merger costs from normal operations to one-off items.
2 Ratios included in the table above are calculated with reference to operating profit after tax before one-off items.
EBITDA for the year ended June 2005 increased by $82.6 million to $512.3 million, primarily due to increased earnings from BovisLend Lease, Integrated Development Businesses and Real Estate Investments. These increases were partially offset by a reductionin non-core investment earnings.
EPS (including amortisation) increased by 16.0 cents to 77.8 cents for the year ended June 2005 (up 26%) due to an increase in earnings and the lower average number of shares on issue. ROE (including amortisation) increased by 2% to 11% for the year ended June 2005.
Dividends A final franked dividend of 29 cents per share for the year ended June 2005 will be paid on 14 September 2005 (26 cents pershare unfranked in June 2004). On a full year basis this represents a payout ratio of 73% of operating profit after tax before one-offitems and a total dividend of 57 cents for the year ended June 2005.
Management StructureAs announced on 8 July 2005, Lend Lease has reorganised its management structure to align with its long term growth strategy.The Group will now be organised into three global business lines: Retail and Communities; Investment Management; and ProjectManagement, Construction and PFIs.

68
Concise Management’s Discussion and Analysis of Financial Condition and Results of Operations (Concise MD&A) continued
Overview continued
Statement of Financial Position (Balance Sheet)
Balance Sheet Summary by Major Component Increase/
June 2005 June 2004 (Decrease)$m $m $m
Cash 569.0 1,380.1 (811.1)Real estate development inventories 1,652.2 1,364.9 287.3Real estate development investments 220.7 151.0 69.7Real estate co-investments 787.7 679.3 108.4Other real estate investments 203.1 218.5 (15.4)Other investments 17.4 9.2 8.2Goodwill 565.6 634.3 (68.7)Management agreements 28.3 57.1 (28.8)Borrowings (500.0) (862.0) 362.0Other net assets/(liabilities)1 (752.9) (796.5) 43.6Shareholders’ equity 2,791.1 2,835.9 (44.8)
1 Other net assets/liabilities includes trade creditors and receivables, provisions and other liabilities.
The key balance sheet movements are explained as follows:
– Real estate development inventories increased due to expenditure on Chapelfield, Norwich and the Urban Communitiesbusinesses in Australia;
– Real estate co-investments increased due to the investment in Australian Prime Property Fund (APPF) in Australia, partly offsetby the sale of US REI businesses during the year; and
– Borrowings decreased due to the repayment of the US$250.0 million Guaranteed Notes in June 2005.

69
Cash FlowThe following table summarises the major cash flows for the year ended June 2005.
Year Ended Year EndedJune 2005 June 2004 Variance
$m $m $m
Cash at the beginning of financial year 1,380.1 867.2 512.9
Summary of major cash transactions during financial yearOperating Activities
Net receipts in the course of operations – continuing1 344.9 391.7 (46.8)Net (payment)/receipts in the course of operations – discontinuing (9.7) 54.7 (64.4)Net investment in property developments2 (206.6) (13.6) (193.0)Tax payments (161.0) (46.0) (115.0)Net interest paid (25.8) 12.7 (38.5)GPT merger costs (36.0) (2.0) (34.0)Other operating cash receipts 64.8 45.3 19.5
Net cash (used in)/provided by operating activities (29.4) 442.8 (472.2)
Investing ActivitiesProceeds from sale of REI businesses/capital redemption3 73.9 521.1 (447.2)Net Real Estate Investments co-investments (235.6) 5.4 (241.0)Net payment for purchase of current investments (11.4) (9.0) (2.4)Proceeds on sale of other investments4 232.1 110.1 122.0Net payment for purchase of controlled entities (27.4) (237.2) 209.8Purchase of other investments (139.4) (69.7) (69.7)Net mortgage loans and tax credit properties 213.8 (213.8)Other (73.0) (15.2) (57.8)
Net cash (used in)/provided by investing activities (180.8) 519.3 (700.1)
Financing ActivitiesPayment of dividends (215.3) (159.6) (55.7)Share buyback/net of shares issued (21.1) (387.2) 366.1Net borrowing repayments (330.3) 109.2 (439.5)Capital of outside equity interest (0.2) 1.9 (2.1)
Net cash used in financing activities (566.9) (435.7) (131.2)
OtherEffect of exchange rate changes on cash and cash equivalents (28.4) (13.8) (14.6)Net cash balances in controlled entities (sold)/acquired (5.6) 0.3 (5.9)
Net decrease from other items (34.0) (13.5) (20.5)Net cash (deployed)/generated for financial year (811.1) 512.9 (1,324.0)Closing cash balance at end of financial year5 569.0 1,380.1 (811.1)
1 Net receipts in the course of operations for the year ended June 2005 included a $14.3 million inflow (June 2004 $208.4 million) relating to the Group’s foreignexchange hedging activities including hedging of receivables, payables, revenue, expenses and intercompany transactions and loans. Current year net receipts in the course of operations were impacted by negative cash flows relating to the Bovis Lend Lease Asia Pacific project losses booked in prior periods.
2 Includes expenditure on the Chapelfield, Norwich project of $152.4 million.3 Proceeds from sale of Real Estate Investments businesses include controlled entities, investments and various assets and operations of the underlying businesses.4 The June 2004 deferred proceeds from sale of IBMGSA ($80.0 million) and Fox Studios Showground ($24.3 million) were received in the year to June 2005.5 In addition to the closing cash balance of $569.0 million, an amount of $16.9 million (June 2004 $9.0 million) is held in short term investments.
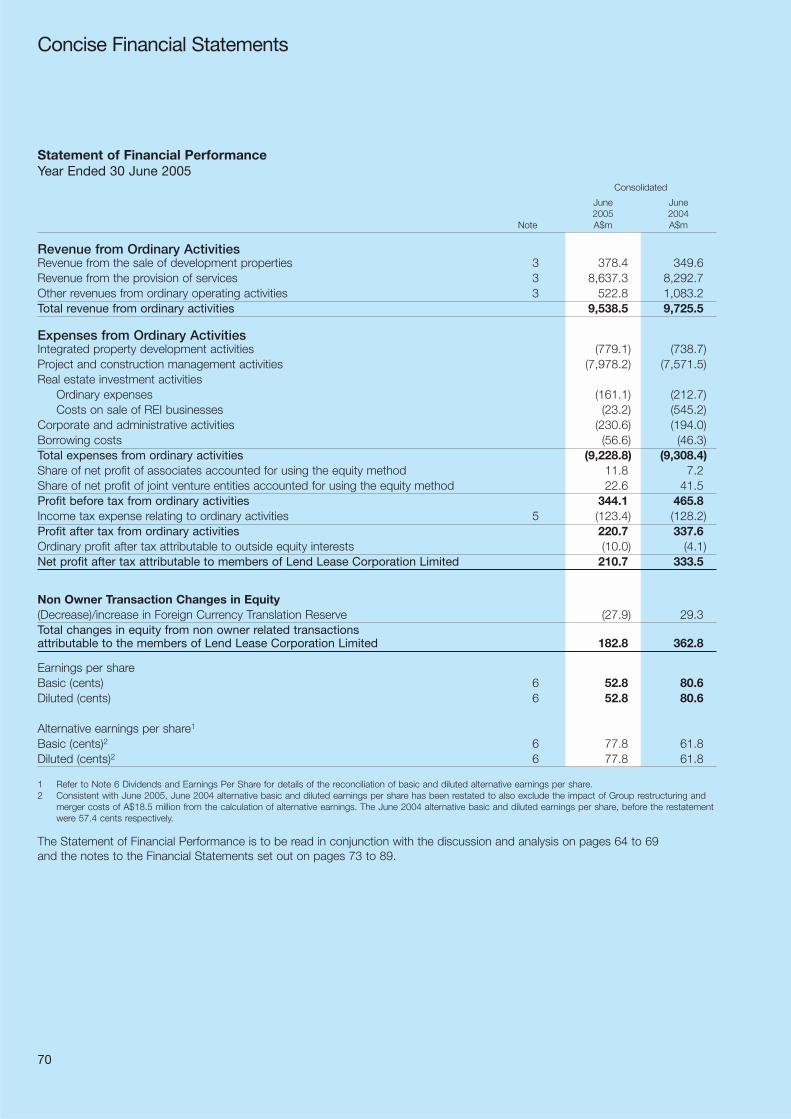
70
Concise Financial Statements
Statement of Financial PerformanceYear Ended 30 June 2005
Consolidated
June June2005 2004
Note A$m A$m
Revenue from Ordinary ActivitiesRevenue from the sale of development properties 3 378.4 349.6Revenue from the provision of services 3 8,637.3 8,292.7Other revenues from ordinary operating activities 3 522.8 1,083.2Total revenue from ordinary activities 9,538.5 9,725.5
Expenses from Ordinary ActivitiesIntegrated property development activities (779.1) (738.7)Project and construction management activities (7,978.2) (7,571.5)Real estate investment activities
Ordinary expenses (161.1) (212.7)Costs on sale of REI businesses (23.2) (545.2)
Corporate and administrative activities (230.6) (194.0)Borrowing costs (56.6) (46.3)Total expenses from ordinary activities (9,228.8) (9,308.4)Share of net profit of associates accounted for using the equity method 11.8 7.2Share of net profit of joint venture entities accounted for using the equity method 22.6 41.5Profit before tax from ordinary activities 344.1 465.8Income tax expense relating to ordinary activities 5 (123.4) (128.2)Profit after tax from ordinary activities 220.7 337.6Ordinary profit after tax attributable to outside equity interests (10.0) (4.1)Net profit after tax attributable to members of Lend Lease Corporation Limited 210.7 333.5
Non Owner Transaction Changes in Equity(Decrease)/increase in Foreign Currency Translation Reserve (27.9) 29.3Total changes in equity from non owner related transactions attributable to the members of Lend Lease Corporation Limited 182.8 362.8
Earnings per shareBasic (cents) 6 52.8 80.6Diluted (cents) 6 52.8 80.6
Alternative earnings per share1
Basic (cents)2 6 77.8 61.8Diluted (cents)2 6 77.8 61.8
1 Refer to Note 6 Dividends and Earnings Per Share for details of the reconciliation of basic and diluted alternative earnings per share.2 Consistent with June 2005, June 2004 alternative basic and diluted earnings per share has been restated to also exclude the impact of Group restructuring and
merger costs of A$18.5 million from the calculation of alternative earnings. The June 2004 alternative basic and diluted earnings per share, before the restatementwere 57.4 cents respectively.
The Statement of Financial Performance is to be read in conjunction with the discussion and analysis on pages 64 to 69 and the notes to the Financial Statements set out on pages 73 to 89.

71
Statement of Financial PositionAs at 30 June 2005
Consolidated
June June2005 2004
Note A$m A$m
Current AssetsCash and cash equivalents 569.0 1,380.1Receivables 1,288.9 1,593.3Inventories 556.8 380.1Other investments 16.9 9.0Other assets 169.6 112.7Total current assets 2,601.2 3,475.2
Non Current AssetsReceivables 123.7 95.2Inventories 1,463.6 1,268.4Equity accounted investments 190.1 140.1Other investments 1,021.9 888.7Future income tax benefit 289.3 255.1Property, plant and equipment 102.4 102.8Goodwill 565.6 634.3Management agreements 28.3 57.1Other assets 171.3 213.8Total non current assets 3,956.2 3,655.5Total assets 6,557.4 7,130.7
Current LiabilitiesCreditors 2,416.1 2,519.6Borrowings 500.0 357.1Current tax liabilities 67.9 98.4Provisions 264.3 281.8Other interest bearing liabilities 11.3 28.1Other non interest bearing liabilities 21.5 43.0Total current liabilities 3,281.1 3,328.0
Non Current LiabilitiesCreditors 45.5 51.4Borrowings 504.9Provisions 25.8 37.3Provision for deferred income tax 187.2 153.1Other interest bearing liabilities 220.4 214.0Other non interest bearing liabilities 6.3 6.1Total non current liabilities 485.2 966.8Total liabilities 3,766.3 4,294.8Net assets 2,791.1 2,835.9
EquityContributed equity 834.6 834.4Reserves 44.0 71.9Retained profits 1,893.9 1,915.5Total parent equity interest 2,772.5 2,821.8Outside equity interests in controlled entities 18.6 14.1Total equity 7 2,791.1 2,835.9
The Statement of Financial Position is to be read in conjunction with the discussion and analysis on pages 64 to 69 and the notes to the Financial Statements set out on pages 73 to 89.
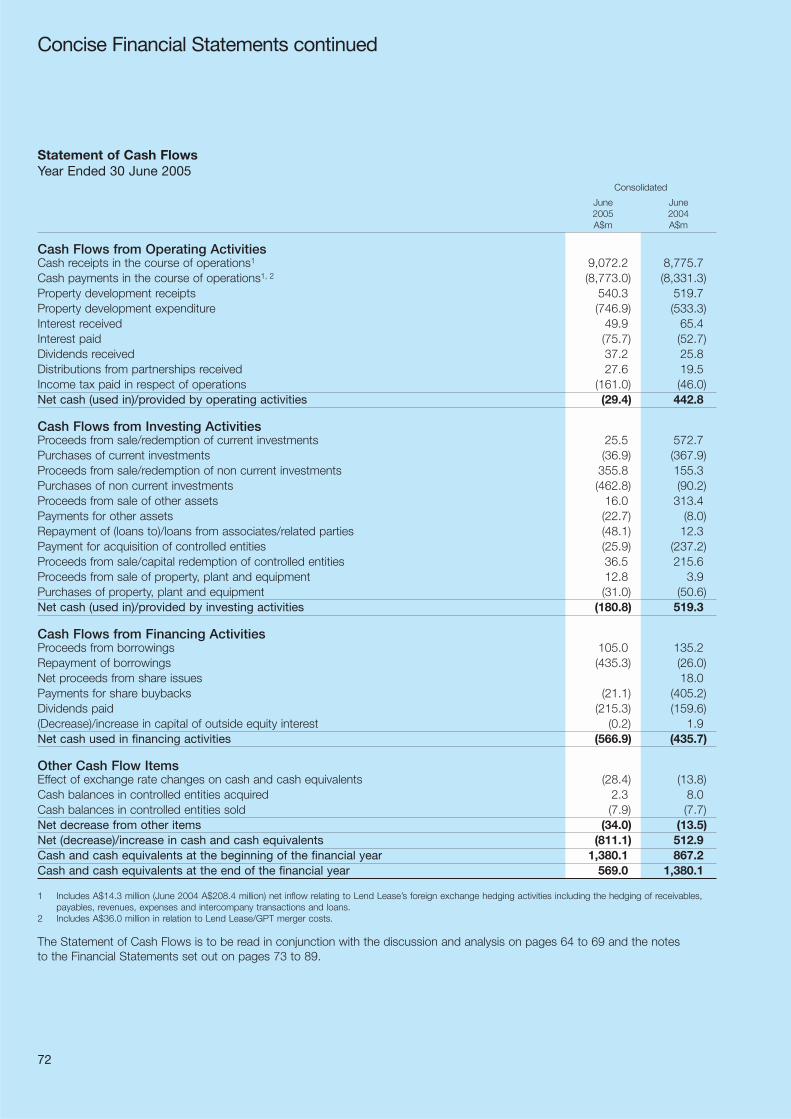
72
Concise Financial Statements continued
Statement of Cash FlowsYear Ended 30 June 2005
Consolidated
June June2005 2004A$m A$m
Cash Flows from Operating ActivitiesCash receipts in the course of operations1 9,072.2 8,775.7Cash payments in the course of operations1, 2 (8,773.0) (8,331.3)Property development receipts 540.3 519.7Property development expenditure (746.9) (533.3)Interest received 49.9 65.4Interest paid (75.7) (52.7)Dividends received 37.2 25.8Distributions from partnerships received 27.6 19.5Income tax paid in respect of operations (161.0) (46.0)Net cash (used in)/provided by operating activities (29.4) 442.8
Cash Flows from Investing ActivitiesProceeds from sale/redemption of current investments 25.5 572.7Purchases of current investments (36.9) (367.9)Proceeds from sale/redemption of non current investments 355.8 155.3Purchases of non current investments (462.8) (90.2)Proceeds from sale of other assets 16.0 313.4Payments for other assets (22.7) (8.0)Repayment of (loans to)/loans from associates/related parties (48.1) 12.3Payment for acquisition of controlled entities (25.9) (237.2)Proceeds from sale/capital redemption of controlled entities 36.5 215.6Proceeds from sale of property, plant and equipment 12.8 3.9Purchases of property, plant and equipment (31.0) (50.6)Net cash (used in)/provided by investing activities (180.8) 519.3
Cash Flows from Financing ActivitiesProceeds from borrowings 105.0 135.2Repayment of borrowings (435.3) (26.0)Net proceeds from share issues 18.0Payments for share buybacks (21.1) (405.2)Dividends paid (215.3) (159.6)(Decrease)/increase in capital of outside equity interest (0.2) 1.9Net cash used in financing activities (566.9) (435.7)
Other Cash Flow ItemsEffect of exchange rate changes on cash and cash equivalents (28.4) (13.8)Cash balances in controlled entities acquired 2.3 8.0Cash balances in controlled entities sold (7.9) (7.7)Net decrease from other items (34.0) (13.5)Net (decrease)/increase in cash and cash equivalents (811.1) 512.9Cash and cash equivalents at the beginning of the financial year 1,380.1 867.2Cash and cash equivalents at the end of the financial year 569.0 1,380.1
1 Includes A$14.3 million (June 2004 A$208.4 million) net inflow relating to Lend Lease’s foreign exchange hedging activities including the hedging of receivables,payables, revenues, expenses and intercompany transactions and loans.
2 Includes A$36.0 million in relation to Lend Lease/GPT merger costs.
The Statement of Cash Flows is to be read in conjunction with the discussion and analysis on pages 64 to 69 and the notes to the Financial Statements set out on pages 73 to 89.

73
Notes to the Concise Financial Statements
1. Basis of Preparation of Concise Financial ReportThe Concise Financial Report has been prepared in accordance with the Corporations Act 2001 and Accounting Standard AASB1039 “Concise Financial Reports” and Urgent Issues Group Consensus Views. The financial statements and specific disclosureshave been derived from the consolidated entity’s full Financial Report for the financial year. Other information included in theConcise Financial Report is consistent with the consolidated entity’s full Financial Report. The Concise Financial Report does not,and cannot be expected to, provide as full an understanding of the financial performance, financial position and financing andinvesting activities of the consolidated entity as the full Financial Report. It has been prepared under the historical cost conventionand, except where stated, does not take into account changing values or fair values of non-current assets. The accounting policieshave been consistently applied by each entity in the consolidated entity and are consistent with those of the previous financial year.
Basis of ConsolidationThe Lend Lease Group (Lend Lease) consolidation comprises all entities controlled by Lend Lease Corporation Limited.
Where an entity either began or ceased to be controlled during the year, the results are included only from the date controlcommenced or up to the date control ceased.
The balances, and effects of transactions, between controlled entities included in the Consolidated Financial Statements, have been eliminated.
Outside interests in the equity and results of the entities that are controlled by Lend Lease are shown as a separate item in the Consolidated Financial Statements.

74
Notes to the Concise Financial Statements continued
Core Real Estate BusinessesProject and Construction Management 8,082.5 7,691.9 8,082.5 7,696.0 100.8 123.7 140.5 169.2Integrated Property Development 903.4 783.7 910.7 808.0 125.1 52.6 166.8 116.8Real Estate Investments9 280.5 358.5 374.4 910.4 146.6 166.8 190.5 159.0Total Core Real Estate 9,266.4 8,834.1 9,367.6 9,414.4 372.5 343.1 497.8 445.0Total Non-Core Businesses10 0.5 25.5 0.5 182.8 0.5 19.7 0.5 131.2Total Segment 9,266.9 8,859.6 373.0 362.8Unallocated Corporate 170.4 128.3 (154.2) (110.4)Total Group 9,538.5 9,725.5 344.1 465.8
1 AASB 1005 “Segment Reporting” does not permit certain items of revenue and expenses to be attributed to particular segments for the purposes of determining segment revenues and segment results. These include corporate expenses, interest and dividend revenue, proceeds on the sale of investments (unless the segment’s operations are primarily of a financial nature) and income tax expenses.
2 Segment revenues, expenses and results do not include inter segment transfers between business segments. Inter segment transfers are priced on an arm’s length basis.
3 Segment results include amortisation of A$44.0 million, representing amortisation adjusted for foreign exchange hedge allocation.4 Presentation and classification is consistent with MD&A.5 Real Estate Investments includes discontinuing operations’ segment revenue of A$34.2 million (June 2004 A$134.5 million), segment profit before tax
of A$32.1 million (June 2004 profit of A$18.4 million), and segment profit after tax of A$20.1 million (June 2004 profit of A$10.2 million). 6 Group operating profit/(loss) before tax excluding cost savings implementation and GPT merger and net separation costs are A$191.1 million for Project
and Construction Management, A$170.4 million for Integrated Property Development, A$196.0 million for Real Estate Investments, A$0.5 million for Non-Core Businesses, and a loss of A$106.6 million for Unallocated Corporate.
7 Group operating profit/(loss) after tax excluding cost savings implementation and GPT merger and net separation costs are A$137.8 million for Project and Construction Management, A$103.9 million for Integrated Property Development, A$137.3 million for Real Estate Investments, A$0.3 million for Non-Core Businesses, and loss of A$68.9 million for Unallocated Corporate.
8 AASB 1005 “Segment Reporting” does not permit certain assets and liabilities to be attributed to particular segments for the purposes of determining segment assetsand segment liabilities. These include income tax assets and liabilities and borrowings and liabilities related to assets that are the subject of finance lease liabilities.
9 Real Estate Investment includes discontinuing operations’ segment assets of A$240.3 million (June 2004 A$418.9 million) and segment liabilities of A$64.3 million (June 2004 A$140.0 million).
10 Non-Core Businesses includes IT&T (IBMGSA) and Capital Services.
June June June June June June June June2005 2004 2005 2004 2005 2004 2005 2004A$m A$m A$m A$m A$m A$m A$m A$m
Segment Group OperatingSegment Group Operating Result Before Profit/(Loss)
Revenue1, 2, 5 Revenue4 Tax1, 2 , 3, 5 Before Tax6
2. Segment ReportingThe segment results are discussed and analysed in the Concise Management’s Discussion and Analysis of Financial Condition and Results of Operations (CMD&A) included with this report.
Business Segment Summary
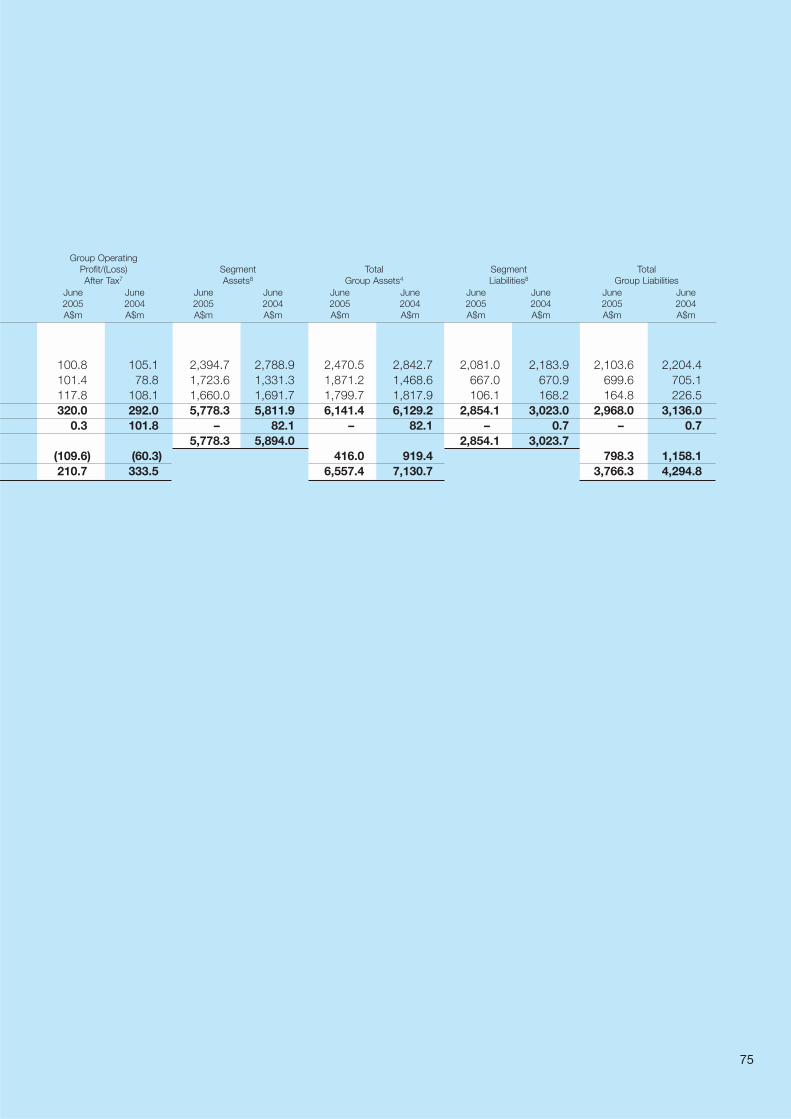
75
100.8 105.1 2,394.7 2,788.9 2,470.5 2,842.7 2,081.0 2,183.9 2,103.6 2,204.4101.4 78.8 1,723.6 1,331.3 1,871.2 1,468.6 667.0 670.9 699.6 705.1117.8 108.1 1,660.0 1,691.7 1,799.7 1,817.9 106.1 168.2 164.8 226.5320.0 292.0 5,778.3 5,811.9 6,141.4 6,129.2 2,854.1 3,023.0 2,968.0 3,136.0
0.3 101.8 – 82.1 – 82.1 – 0.7 – 0.75,778.3 5,894.0 2,854.1 3,023.7
(109.6) (60.3) 416.0 919.4 798.3 1,158.1210.7 333.5 6,557.4 7,130.7 3,766.3 4,294.8
June June June June June June June June June June2005 2004 2005 2004 2005 2004 2005 2004 2005 2004A$m A$m A$m A$m A$m A$m A$m A$m A$m A$m
Group OperatingProfit/(Loss) Segment Total Segment TotalAfter Tax7 Assets8 Group Assets4 Liabilities8 Group Liabilities
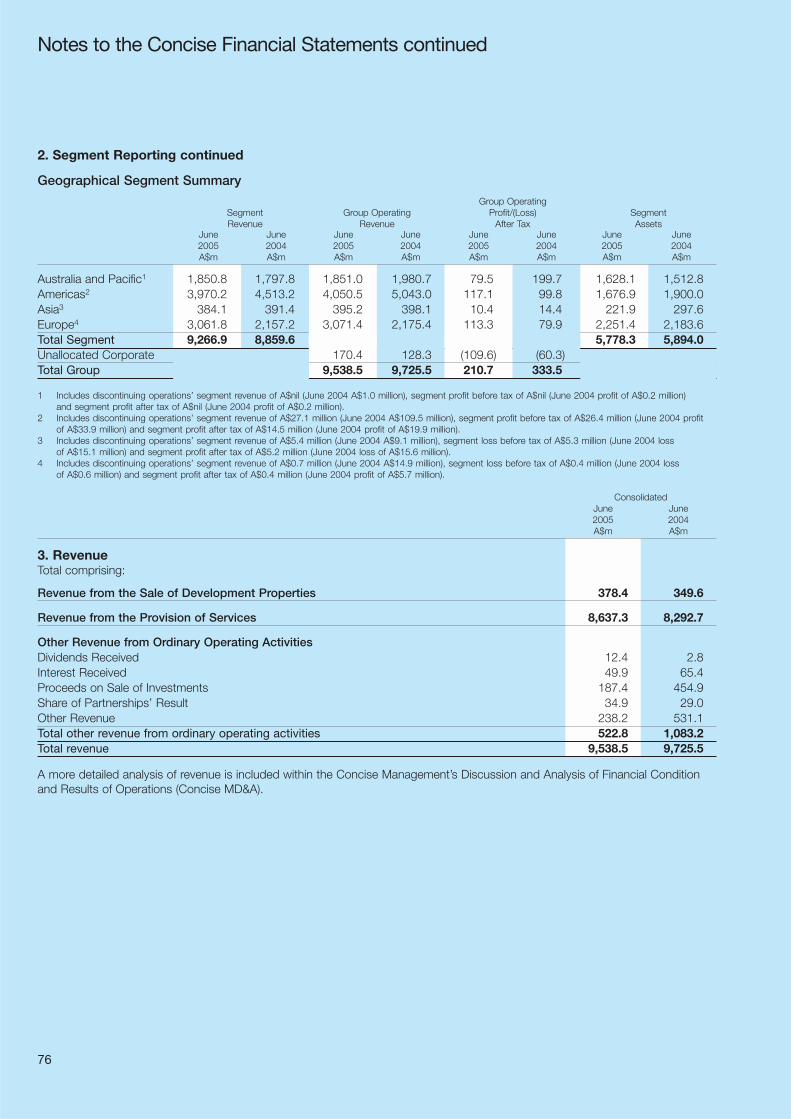
76
Notes to the Concise Financial Statements continued
2. Segment Reporting continued
Geographical Segment Summary
June June June June June June June June2005 2004 2005 2004 2005 2004 2005 2004A$m A$m A$m A$m A$m A$m A$m A$m
Australia and Pacific1 1,850.8 1,797.8 1,851.0 1,980.7 79.5 199.7 1,628.1 1,512.8Americas2 3,970.2 4,513.2 4,050.5 5,043.0 117.1 99.8 1,676.9 1,900.0Asia3 384.1 391.4 395.2 398.1 10.4 14.4 221.9 297.6Europe4 3,061.8 2,157.2 3,071.4 2,175.4 113.3 79.9 2,251.4 2,183.6Total Segment 9,266.9 8,859.6 5,778.3 5,894.0Unallocated Corporate 170.4 128.3 (109.6) (60.3)Total Group 9,538.5 9,725.5 210.7 333.5
1 Includes discontinuing operations’ segment revenue of A$nil (June 2004 A$1.0 million), segment profit before tax of A$nil (June 2004 profit of A$0.2 million) and segment profit after tax of A$nil (June 2004 profit of A$0.2 million).
2 Includes discontinuing operations’ segment revenue of A$27.1 million (June 2004 A$109.5 million), segment profit before tax of A$26.4 million (June 2004 profit of A$33.9 million) and segment profit after tax of A$14.5 million (June 2004 profit of A$19.9 million).
3 Includes discontinuing operations’ segment revenue of A$5.4 million (June 2004 A$9.1 million), segment loss before tax of A$5.3 million (June 2004 loss of A$15.1 million) and segment profit after tax of A$5.2 million (June 2004 loss of A$15.6 million).
4 Includes discontinuing operations’ segment revenue of A$0.7 million (June 2004 A$14.9 million), segment loss before tax of A$0.4 million (June 2004 loss of A$0.6 million) and segment profit after tax of A$0.4 million (June 2004 profit of A$5.7 million).
ConsolidatedJune June2005 2004 A$m A$m
3. RevenueTotal comprising:
Revenue from the Sale of Development Properties 378.4 349.6
Revenue from the Provision of Services 8,637.3 8,292.7
Other Revenue from Ordinary Operating ActivitiesDividends Received 12.4 2.8Interest Received 49.9 65.4Proceeds on Sale of Investments 187.4 454.9Share of Partnerships’ Result 34.9 29.0Other Revenue 238.2 531.1Total other revenue from ordinary operating activities 522.8 1,083.2Total revenue 9,538.5 9,725.5
A more detailed analysis of revenue is included within the Concise Management’s Discussion and Analysis of Financial Condition and Results of Operations (Concise MD&A).
Group OperatingSegment Group Operating Profit/(Loss) SegmentRevenue Revenue After Tax Assets

77
ConsolidatedJune June2005 2004 A$m A$m
4. Ordinary Profit ItemsIndividually significant items included in (profit) from ordinary activities before income tax expense:
Lend Lease/GPT merger and net separation costsWrite-off of GPT and Homemaker management agreements 44.2Merger scheme and net separation costs 24.2
Cost savings implementation expensesEmployee terminations 33.3Other 32.5
Profit on sale of IBMGSA1 (111.5)134.2 (111.5)
Significant employee benefit transactions:
Distribution received from Employee Investment Trust (EIT) (53.7)Increased contribution to the Lend Lease Employee Share Acquisition Plan (ESAP) and other employee benefits 53.7
– –
1 Sale of IBMGSA profit after tax A$79.7 million. The tax on the capital gain has been offset by the capital loss benefit arising from Australian tax consolidations and recovery of capital tax losses not previously recognised (refer to Note 5 Taxation).
ConsolidatedJune June2005 2004 A$m A$m
5. Taxation
Income Tax ExpenseProfit before tax from ordinary activities 344.1 465.8
Prima facie income tax expense at 30% of profit from ordinary activities 103.2 139.7
Tax effect on permanent differences 35.7 30.0Capital loss benefit arising from Australian tax consolidations (18.7)Recovery of capital tax losses not previously recognised (15.4)Income tax over provided in previous financial years (15.5) (7.4)Total income tax expense 123.4 128.2

78
Notes to the Concise Financial Statements continued
CompanyJune June
Cents per 2005 2004share A$m A$m
6. Dividends and Earnings Per Share
Dividends
Interim DividendDecember 2004 – paid 8 March 2005 28 Unfranked 111.6December 2003 – paid 17 March 2004 18 Unfranked 73.7
Final DividendJune 2005 – declared subsequent to reporting date (payable 14 September 2005) 29 Franked 115.6June 2004 – paid 15 September 2004 26 Unfranked 103.7
227.2 177.4
Dividend FrankingLend Lease advised of its intention to return to franking in the short term, in its Australian Stock Exchange announcement of 23 June 2005. The final dividend of 29 cents per share declared since 30 June 2005 will be fully franked at the tax rate of 30%. The interim dividend paid on 8 March 2005 (28 cents per share) was unfranked.
The dividend franking account balance at 30 June 2005 is A$105.0 million based on 30% tax rate (30 June 2004 A$45.0 million). This is calculated after adjusting for franking credits which will arise from the payment of income tax provided in the accounts; tax losses utilised in the current period; and expected franking debits arising from refunds of tax in dispute and the proposed dividend.
ConsolidatedJune June2005 2004
Number Numberm m
Earnings Per Share (EPS)Weighted average shares and share equivalents 398.8 413.7
Cents Cents
Earnings Per ShareBasic 52.8 80.6Diluted 52.8 80.6
Consolidated12 Months 12 MonthsJune 2005 June 2004
A$m A$m
Reconciliation of Alternative EarningsNet profit after income tax attributable to members of Lend Lease Corporation Limitedused in calculating basic and diluted EPS 210.7 333.5Exclude after tax impact of:
Cost savings implementation expenses 47.7 9.5Write-off of GPT and Homemaker management agreements 44.2Lend Lease/GPT merger and net separation costs 19.4 9.0Impact of exit of REI businesses (11.6) 2.3Capital loss tax benefits arising from Australian tax consolidations (18.7)Gain on sale of IBMGSA (79.7)
Earnings used in calculating alternative basic and diluted EPS1 310.4 255.9
Cents Cents
Alternative Earnings Per ShareBasic1 77.8 61.8Diluted1 77.8 61.8
1 The June 2004 alternative basic and diluted earnings per share amounts which were calculated including the after tax impact of the Group restructuring and merger costs of A$18.5 million were 57.4 cents respectively.

79
ConsolidatedJune June2005 2004A$m A$m
7. Total Equity ReconciliationEquity at beginning of financial year 2,835.9 3,007.6
Movements comprise:
Movements in contributed equity 0.2 18.0Share buybacks (17.0) (399.8)Dividends paid (215.3) (159.6)Net profit attributable to members of Lend Lease Corporation Limited 210.7 333.5Other changes in equity
Movement in foreign currency translation reserve (27.9) 29.3Total revenues, expenses and valuation adjustments attributable to members of Lend Lease Corporation Limited (49.3) (178.6)Total changes in outside equity interests in controlled entities 4.5 6.9Total movement in equity for the financial year (44.8) (171.7)Equity at end of the financial year 2,791.1 2,835.9

80
Notes to the Concise Financial Statements continued
8. Executives’ and Directors’ DisclosuresExecutives’ and Directors’ remuneration details are set out in Section 3 of the Directors’ Report.
Equity Holdings and Transactions
Shareholdings Year Ended 30 June 2005Shares
Received Other NetShares Held During the Change to Shares Held1 July 2004 Year1,2 Shares 30 June 2005
Executive DirectorsG Clarke 1,000 1,000R Taylor 89,406 2,439 91,845A Chamberlain 1,000 1,000J Curin 1,000 (1,000)
Non Executive Directors1
D Crawford 10,674 6,794 17,468G Edington 19,816 1,557 21,373P Goldmark 8,441 1,557 9,998R Longes 55,419 1,885 57,304D Ryan 96 10,000 10,096
Specified ExecutivesP Marchetto 5,555 5,555P Crewes 40,170 850 41,020J Spanswick 1,130 1,130P Koziol nilR Johnston 58,003 930 58,933R Burrows 35,181 1,050 36,231R Fehring 19,196 953 20,149R Lourey 64 64
Other ExecutivesB Soller 23,445 (20,000) 3,445C Cree nilJ Daniel 230 230
345,221 41,620 (10,000) 376,841
1 Non Executive Directors’ share allocations relating to retirement benefits are made in arrears on 1 January each year. Refer to Section 3a of the Directors’ Reportfor further details.
2 For Executive Directors, Specified Executives and Other Executives; relates to share entitlements under employee benefit vehicles.

81
Loans to Directors and Specified ExecutivesAt reporting date there was one interest free loan outstanding, where the aggregate loan balance exceeded A$100,000 at any timeduring the reporting period, from the specified executive, Mr P Marchetto (June 2005 US$300,000 (A$389,600); June 2004 US$nil(A$nil) (not a specified executive)). The loan is payable at call.
At reporting date there were no outstanding loans from Directors (June 2004 A$nil).
Other Transactions with Directors and Specified ExecutivesFrom time to time Directors and Specified Executives of the Company or its controlled entities, or their personally-related entities,may purchase goods from the consolidated entity. These purchases are on terms and conditions no more favourable than thoseentered into by unrelated customers and are trivial or domestic in nature.
9. Explanation of Transition to Australian Equivalents to International Financial Reporting Standards (AIFRS)The rules for the first time adoption to AIFRS are set out in AASB 1 “First Time Adoption of Australian Equivalents to InternationalFinancial Reporting Standards”. In general, AIFRS accounting policies must be applied retrospectively to determine the openingAIFRS balance sheet at transition date, being 1 July 2004. The standard allows a number of voluntary exemptions to this generalprinciple to assist in the transition to reporting under AIFRS. The Group will elect the following exemptions on transition to AIFRS:
Standard Standard Name Election Intended To Be Applied
AASB 3 Business Combinations Prospective application elected
AASB 121 The Effects of Changes Cumulative translation differences reset to zero on transitionin Foreign Exchange Rates
AASB 2 Share Based Payment No expense to profit or loss for both equity and cash settled share basedpayment transactions vested before 1 January 2005
AASB 132 Financial Instruments: Comparative information not restated in December 2005 and June 2006 Disclosure & Presentation financial statements
AASB 139 Financial Instruments: Comparative information not restated in December 2005 and June 2006Recognition & Measurement financial statements
AASB 4 Insurance Contracts Comparative information not restated in December 2005 and June 2006 financial statements
AASB 1023 General Insurance Contracts Comparative information not restated in December 2005 and June 2006 financial statements
AASB 119 Employee Benefits Corridor approach elected prospectively

82
9. Explanation of Transition to AIFRS continued
The key potential implications of theconversion to AIFRS on the Lend LeaseGroup are set out below.
Intangible Assets
Goodwill and BusinessCombinationsAll business combinations are accountedfor by applying the purchase method.Goodwill represents amounts arising onacquisition of subsidiaries, associates andjoint ventures, and represents thedifference between the cost of theacquisition and the fair value of the netidentifiable assets acquired. The fair valueof the net identifiable assets acquired maychange materially from that calculatedunder Australian Generally AcceptedAccounting Principles (AGAAP). Thisdifference may arise due to the recognitionof additional intangible assets, therecognition of the fair value of contingent liabilities, and the recognitionof additional deferred tax balances at theconsolidated entity level due to changes inthe Income Taxes standard. The businesscombinations standard provides examplesof items acquired in a businesscombination that may be separatelyrecognised as an intangible asset fromgoodwill. The examples relevant to theLend Lease Group are: trademarks, tradenames, production backlog, constructioncontracts, lease agreements andconstruction permits. The classificationsbetween goodwill and intangible assets onfuture acquisitions may change materially,however, it is anticipated that there will beno reclassifications between intangibleassets and goodwill on transition relatingto the Bovis and Delfin acquisitions.
Goodwill is stated at cost less anyaccumulated impairment losses. Goodwillis allocated to cash generating units and istested annually for impairment. In respectof associates, the carrying amount ofgoodwill is included in the carrying amountof the investment of the associate.
The Group will elect the exemptionavailable in relation to businesscombinations, therefore the classificationand accounting treatment of businesscombinations that occurred prior totransition date will not be restated as at 1 July 2004.
Management Agreements Management agreements and otherintangible assets that are acquired arestated at cost less accumulatedamortisation and impairment losses. On transition to AIFRS, managementagreements and other intangible assetswere reviewed to ensure they are capableof recognition under AASB 138 “IntangibleAssets”, and tested for impairment. APPFManagement Agreements currently remainclassified as an intangible asset; however,the amortisation period will be reduced toten years under AIFRS. GPT managementagreements did not satisfy the stricterdefinition of an intangible asset and weretransferred to goodwill on transition toAIFRS. (GPT management agreementswere written-off under AGAAP during theJune 2005 financial year.)
AmortisationAmortisation is recognised on a straight-line basis over the estimateduseful lives of the intangible assets unlesssuch lives are indefinite. Goodwill andintangible assets with an indefinite usefullife are not subject to amortisation but aretested for impairment annually. Otherintangible assets are amortised from thedate they are available for use.
On transition to AIFRS, the APPFmanagement agreements amortisationcharge was accelerated in accordancewith the requirements of AASB 138“Intangible Assets” (which requires thatthe life of the asset should not exceedany legal or contractual arrangements inplace). This resulted in an adjustment to retained earnings of A$2.9 million.
ImpairmentUnder AIFRS, the carrying amount of theconsolidated entity’s non-current assets,excluding investment property, definedbenefit assets, deferred tax assets,goodwill and indefinite life intangibleassets, are reviewed at each reportingdate to determine whether there is anyindication of impairment. If suchindication exists, the asset is tested forimpairment by comparing its recoverableamount to its carrying amount. Forgoodwill, assets that have an indefiniteuseful life and intangible assets not yetready for use, an impairment test isperformed annually.
If there is any indication that an asset is impaired, the recoverable amount is
estimated for the individual asset. If it isnot possible to estimate the recoverableamount for the individual asset, therecoverable amount of the cash generating unit (CGU) to whichthe asset belongs is determined.
An impairment loss is recognisedwhenever the carrying amount of anasset or its CGU exceeds its recoverableamount. Impairment losses arerecognised in the income statementunless it relates to a revalued asset,when the impairment loss is treated inthe same way as a revaluation decrease.
Impairment losses recognised in respectof a CGU are allocated first to reduce thecarrying amount of goodwill allocated tothe CGU and then to reduce the carryingamount of the other assets in the CGUon a pro rata basis.
Lend Lease has three regional segments:Asia Pacific, Americas, and Europe.Within these segments Lend Leaseidentified the following CGUs: IntegratedDevelopment Businesses Australia, BovisLend Lease Asia Pacific, Real EstateInvestments Asia Pacific, Bovis LendLease Americas, Actus Lend Lease,Bovis Lend Lease Europe, IntegratedDevelopment Businesses Europe, andReal Estate Investments Europe.Goodwill was tested for impairment attransition date in accordance with thevalue-in-use methodology prescribed bythe standard, and no impairment losseswere identified.
On transition to AIFRS, there was noindication of impairment on Lend Lease’snon current assets.
Investment PropertyAIFRS permits one of the followingmethods to be applied to the Lend LeaseGroup’s investment property portfolio:
– Measurement at fair value withsubsequent changes in fair valuerecorded in the income statement; or
– Measurement at cost depreciatedover the useful life.
The elected method will be the fair valuemethod. At transition, Lend Lease held adirect interest in investment propertiesthrough the Senior Living business(A$186.0 million). Lend Lease’s only otherinterests in investment properties wereheld by associates and partnerships
Notes to the Concise Financial Statements continued

83
which are equity accounted under AIFRS.This related primarily to the King ofPrussia. The transition adjustment toequity accounted investments arisingfrom the restatement of underlyinginvestment properties from cost to fairvalue was an increase of A$131.1 millionbefore tax.
RevenueRevenue from the sale of goods requiresadditional conditions to be satisfied underAIFRS before recognition can occur.Revenue recognition is primarilydetermined by assessing whether thesignificant risks and rewards ofownership of the asset have transferredand the nature of any continuinginvolvement with the asset.
Development RevenueRevenue recognition on pre-saleresidential projects under AGAAP isaccounted for on the percentagecompletion method currently adoptedunder UIG 53 “Pre-Completion Contractsfor the Sale of Residential DevelopmentProperties”. The AASB has determinedthat this UIG Abstract is not consistentwith AIFRS principles.
Lend Lease will recognise revenue andprofit from the sale of developmentproperties when the significant risks andrewards have been transferred to thebuyer, and when Lend Lease retainsneither continuing managerial involvementnor effective control over the propertiessold. The impact of this change is a delayin revenue and profit recognition. Ontransition to AIFRS, the adjustmentcreated a reduction in net assets ofA$16.3 million before tax (includingSenior Living Properties).
Senior Living Properties(Retirement by Design)A review of the Retirement by Designbusiness and any impacts AIFRS mayhave on revenue and profit recognitioncommenced in 2004. The review hasfocused on whether the significant risksand rewards of ownership of the assethave transferred to the resident on sale,and whether the operator’s continuingmanagerial involvement is deemedsignificant so as to defer revenue andprofit recognition. It is likely that underAIFRS a sale will not be recognised at thecompletion of the development phase forloan licence, loan lease and some strata
title structures. Where this occurs, thecompleted inventory will be reclassified to investment property and recorded atfair value. A non-interest bearing liabilitywill also be created when the residentoccupies the premises, representing theultimate repayment by Retirement byDesign to the resident. Refer to theReconciliation of Balance Sheet sectionfor expected quantitative impacts.
Construction AccountingLend Lease will continue to recogniserevenue and profit from constructionactivities in accordance with its existingpolicy under AGAAP.
TaxationIncome tax on the profit or loss for theyear comprises current and deferredtaxes. Income tax is recognised in theincome statement except to the extentthat it relates to items recognised directlyin equity, in which case it is recognised in equity, or in respect of a businesscombination, in which case it isrecognised against goodwill.
Current tax is the expected tax payableon the taxable income for the year, usingtax rates enacted or substantivelyenacted at reporting date and anyadjustments to tax payable in respect of previous years.
Deferred tax is provided using thebalance sheet liability method, providingfor temporary differences between thecarrying amount of assets and liabilitiesfor financial reporting purposes and theamounts used for taxation purposes. The following temporary differences arenot provided for: goodwill for whichamortisation is not tax deductible; theinitial recognition of assets and liabilitiesthat affect neither accounting or taxableprofit; and differences relating toinvestments in subsidiaries to the extentthat it is probable they will not reverse inthe foreseeable future. The amount ofdeferred tax provided is based on theexpected manner of realisation of theasset or settlement of the liability, usingtax rates enacted or substantivelyenacted at reporting date.
A deferred tax asset is recognised only to the extent that it is probable that futuretaxable profits will be available againstwhich the asset can be utilised. Deferredtax assets are reduced to the extent thatit is no longer probable that the related
tax benefit will be realised. Thisrecognition criteria replaces the virtualcertainty test with respect to tax losses,and the beyond reasonable doubt test for all other deferred tax assets undercurrent AGAAP. Lend Lease has reviewedits policy for recognising deferred taxassets in respect of unbooked tax lossesand US deferred interest having regard to the revised recognition criteria. Ontransition to AIFRS there was noadjustment recorded.
Employee Benefits
Defined Benefit PlansThe Lend Lease Group’s net obligation inrespect of defined benefit superannuationplans is calculated separately for eachplan by estimating the amount of futurebenefits that employees have earned inreturn for their service in the current andprior financial years. That benefit isdiscounted to determine its presentvalue, and the fair value of any plan assetis deducted.
Under AGAAP, defined benefit plans havebeen accounted for on a cash basis, withno defined benefit obligation of planassets or liabilities recognised in thebalance sheet on the basis that LendLease has no legal or constructiveobligation to meet any plan deficits. All actuarial gains and losses will berecognised in full at transition datethrough retained earnings. Lend Leasehas two defined benefitsuperannuation/pension schemesrequiring initial recognition under AIFRS:the Bovis UK Pension Scheme, currentlyin deficit, and the Lend LeaseSuperannuation Fund currently in surplus.A net debit to retained earnings ofA$121.5 million will be made to reflectthe net liability required to be bookedunder the Standard.
The standard allows a choice from threeoptions for the recognition of definedbenefit plan actuarial gains and losses:
– Option 1: full recognition throughprofit or loss;
– Option 2: full recognition directly in retained earnings; and
– Option 3: the ‘corridor’ approach.
Lend Lease will elect to adopt thecorridor approach prospectively.
84
9. Explanation of Transition to AIFRS continued
Employee Benefits continued
Share Based PaymentThe fair value of equity or cash settledshare based payments is required to beexpensed in the income statement overthe vesting period. The fair value of equitysettled share based payments will bemeasured at grant date only. The fairvalue of cash settled share basedpayments will be remeasured at eachreporting date until settlement. LendLease has elected to apply the exemptionavailable and will not recognise the fairvalue of equity or cash settled sharebased payments that vest before 1 January 2005 in the income statement.
Lend Lease does not currently utiliseoptions. Lend Lease predominantlyutilises cash settled share basedpayments under its short and long termincentive compensation plans, andoccasionally retention payments. Lend Lease has funded some of thesepayments over several years from anunallocated pool of shares within theLend Lease employee share plans.
Employee Share PlansIn December 2004, the AASB madeamendments to UIG Interpretation 112“Consolidation – Special Purpose Entities”.The effect of the scope amendments is toinclude equity compensation plans, andexclude other long-term employee benefitplans from its scope. The amendmentrequires the company that hasestablished employee benefit trusts forthe purposes of a share-based paymentplan to consider whether they controlthose vehicles, and hence shouldconsolidate them. Lend Lease is currentlyreviewing all share plan vehicles itsponsors to determine whether they are controlled in accordance with theprinciples contained in UIG 112. UnderAGAAP principles Lend Lease does nothave accounting control. However, underAIFRS it is likely that Lend Lease will bedeemed to have accounting control ofthe majority of the employee share plansand, hence, may consolidate them. In theevent that Lend Lease consolidates the
employee share plans, the impact toretained earnings on transition is notexpected to be material.
Foreign Currency
Financial Statements of Foreign OperationsThe assets and liabilities of foreignoperations, including goodwill and fairvalue adjustments arising onconsolidation, are translated to Australiandollars at foreign exchange rates atreporting date. The revenues andexpenses of foreign operations aretranslated to Australian dollars at theexchange rate (or average rate) ruling at the date of the transaction. Foreignexchange differences arising ontranslation are recognised in a separatecomponent of equity.
The functional currency of the LendLease Group will be Australian dollars.
Lend Lease will be electing the option to reset the foreign currency translationreserve to A$nil on transition, resulting in a debit adjustment of A$32.7 million to retained earnings. The gain or loss ona disposal of any foreign operation posttransition date shall exclude translationdifferences that arose before the date of transition to AIFRS.
Goodwill and fair value adjustmentsarising from acquisitions post transitiondate are treated as assets of the acquiredentity and therefore translated toAustralian dollars at each reporting date.
Net Investment in Foreign OperationsExchange differences arising from the translation of the net investment in foreign operations are taken to thetranslation reserve on consolidation. They are subsequently released to theincome statement on disposal versusretained earnings under AGAAP.
Financial Instruments/InsuranceContractsLend Lease will elect the exemptionwhich does not require comparativeinformation to be restated for AASB 132“Financial Instruments: Disclosure &
Presentation”, AASB 139 “FinancialInstruments: Recognition andMeasurement”, AASB 4 “InsuranceContracts”, and AASB 1023 “GeneralInsurance Contracts”. Therefore, no re-measurements are expected to bemade in relation to these standards as at 1 July 2004, as the transitionaladjustments will be made at 1 July 2005.
Lend Lease will therefore follow AGAAPaccounting for the measurement offinancial instruments and insurancecontracts to 30 June 2005.
HedgingLend Lease currently uses derivativecontracts to economically hedgeexposures to interest rates and foreigncurrency. Under current AGAAP, all of theCompany’s derivatives contracts areaccounted for as hedges.
Under AIFRS, derivative contracts that do not qualify for hedge accounting willbe required to recognise any subsequentchanges in fair value in the profit or loss.In order to qualify for hedge accounting,strict requirements over hedgedesignation, documentation andeffectiveness must be satisfied. Derivativecontracts that qualify for hedgeaccounting will be accounted for as cashflow or fair value hedges.
Cash flow hedges are measured at fairvalue with changes in fair value recorded in equity, to the extent that the hedge isdeemed effective until the hedgedtransaction occurs. Any ineffective portionis recorded in the profit or loss immediately.
Fair value hedges are measured at fairvalue with changes in fair value recordedin the profit or loss. Changes in fair valueof the designated hedged item are alsorecorded in the profit or loss immediately.Any ineffective portion is recognised inthe profit or loss.
Lend Lease will continue with its interestrate risk management policies in theAIFRS environment. Lend Lease expectsto qualify for hedge accounting for itsforeign currency hedges for the June 2006 financial year. Due to a recentamendment to the hedge accounting
Notes to the Concise Financial Statements continued

85
requirements under AIFRS (which areeffective for the June 2007 reportingperiod), Lend Lease’s hedging of foreigncurrency revenues from foreignoperations will not qualify for hedgeaccounting. In the event that thesehedging instruments are retained, anyunrealised gains/losses will be recordedin the profit or loss (as opposed to beingdeferred on balance sheet).
Co-investmentsCurrently, equity co-investments in realestate funds are carried at the lower ofcost or recoverable amount. In the AIFRSenvironment, these co-investments will berecognised as an available for sale asset inaccordance with the Financial Instrumentsstandard, at fair value with subsequentchanges in fair value recorded in arevaluation reserve within equity.
Service Concession Arrangements(Private Financing Initiatives)There is currently no Australian (or AIFRS)standard that addresses serviceconcession arrangements (otherwiseknown as Private Financing Initiatives or PFI’s). The International FinancialReporting Interpretations Committee(IFRIC) released three draft interpretationsin March 2005 addressing the accountingfor service concession arrangements bythe operator (the private entity). Theyaddress how to determine theaccounting model and how to accountfor the PFI using the Financial AssetModel or the Intangible Asset Model. The standards are not expected to befinalised until late 2005.
Borrowing CostsAIFRS permits one of the followingmethods to be applied to Lend Lease’sborrowing costs:
– The benchmark treatment is toexpense borrowing costs; and
– The permitted alternative treatment is to capitalise borrowing costs inrelation to qualifying assets (which is consistent with AGAAP).
Lend Lease will elect to capitaliseborrowing costs on qualifying assets.
Reconciliation of Balance SheetThe following page contains a line by linereconciliation of the Lend Lease Groupand parent entity’s AIFRS transitionadjustments as at 1 July 2004.
The Lend Lease Group has commencedthe preparation of the June 2005 AIFRSresults and will disclose any materialimpacts once they have been reliablydetermined in accordance with the LendLease Group’s continuous disclosureobligations. This information was notavailable for disclosure at the time ofreleasing these financial statements.
There is a significant amount ofjudgement involved in the preparation of the reconciliation from AGAAP toAIFRS, consequently the finalreconciliations presented in the firstfinancial report prepared in accordancewith AIFRS (being the half year ending 31 December 2005) may vary materiallyfrom the reconciliations presented.
Revisions to the selected AIFRSaccounting policies may be required as a result of:
– Changes in financial reportingrequirements that are relevant to the first financial report prepared inaccordance with AIFRS, arising from new or revised standards orinterpretations issued subsequent tothe preparation of this report. This isparticularly relevant for the followingissues that remain uncertain at thedate of preparation of this report and may have material impacts when finalised:
– The accounting for PFIs;
– The accounting for share based payments;
– The potential consolidation of the Lend Lease sponsoredbenefit vehicles and share plans;
– Hedge accounting;
– Accounting for the RetirementVillage Sector;
– Amendments adopted inDecember 2004 by the AASBwith respect to the accounting for actuarial gains and losses ofdefined benefit plans.
– Additional deferred taxes arisingunder the balance sheet approach;
– Additional guidance on theapplication of AIFRS in a particularindustry or to a particular transaction;
– Elections and models required to beelected by the Lend Lease Groupmay change; and
– Changes to the consolidated entity’s operations.

86
Notes to the Concise Financial Statements continued
9. Explanation of Transition to AIFRS continued
Reconciliation of Balance SheetConsolidated
Effect ofTransition toAustralian Australian
Equivalents EquivalentsAGAAP to IFRS to IFRS
Balance Sheet1 June 2004 1 July 2004 1 July 2004As at 1 July 2004 Note A$m A$m A$m
Current AssetsCash and cash equivalents 1,380.1 1,380.1Receivables a 1,573.1 (41.4) 1,531.7Inventories a 380.1 22.6 402.7Other investments 9.0 9.0Other assets 112.7 112.7Total current assets 3,455.0 (18.8) 3,436.2
Non Current AssetsReceivables b 95.2 (9.5) 85.7Inventories 1,316.0 1,316.0Equity accounted investments c 112.7 502.1 614.8Investment property d 186.0 186.0Other investments c 888.7 (371.9) 516.8Deferred tax asset h 255.1 125.1 380.2Property, plant and equipment 102.8 102.8Goodwill e 634.3 45.2 679.5Management agreements f 57.1 (48.1) 9.0Defined benefit plan asset g 25.5 25.5Other assets d 213.8 (37.1) 176.7Total non current assets 3,675.7 417.3 4,093.0Total assets 7,130.7 398.5 7,529.2
Current LiabilitiesCreditors a 2,519.6 (3.3) 2,516.3Borrowings 357.1 357.1Current tax liabilities h 98.4 (0.6) 97.8Provisions 281.8 281.8Other interest bearing liabilities 28.1 28.1Other non interest bearing liabilities 43.0 43.0Total current liabilities 3,328.0 (3.9) 3,324.1
Non Current LiabilitiesCreditors 51.4 51.4Borrowings 504.9 504.9Provisions 37.3 37.3Deferred tax liability h 153.1 108.7 261.8Other interest bearing liabilities 214.0 214.0Other non interest bearing liabilities d 6.1 186.0 192.1Defined benefit plan liability g 199.2 199.2Total non current liabilities 966.8 493.9 1,460.7Total liabilities 4,294.8 490.0 4,784.8Net assets 2,835.9 (91.5) 2,744.4
EquityContributed equity 834.4 834.4Reserves i 71.9 32.7 104.6Retained profits j 1,915.5 (123.4) 1,792.1Total parent equity interest 2,821.8 (90.7) 2,731.1Outside equity interests in controlled entities k 14.1 (0.8) 13.3Total equity 2,835.9 (91.5) 2,744.4
1 The transition adjustments reported above exclude the effects of consolidating the Lend Lease sponsored benefit vehicles.

87
Notes to the Reconciliation of Balance Sheeta. Revenue recognition on sale of development properties has been revised. The impact of the change in policy is:
ConsolidatedJuly 2004
A$m
Current receivables under AGAAP 1,573.1De-recognition of receivables due to change in revenue recognition policy (41.4)Current receivables under AIFRS 1,531.7
Current inventories under AGAAP 380.1Re-recognition of inventories due to change in revenue recognition policy 22.6Current inventories under AIFRS 402.7
Current creditors under AGAAP 2,519.6Reduction in creditors due to change in revenue recognition policy (3.3)Current creditors under AIFRS 2,516.3
b. In accordance with AIFRS (AASB 118 “Revenue”), revenue shall be measured at fair value of the consideration received orreceivable. If any of the consideration is deferred, the fair value of the consideration is determined by discounting all futurereceipts using an imputed rate of interest. The difference between the discounted and the nominal amount of consideration is recognised as interest revenue.
The Pyrmont Trust receivable and management fees due to Actus Lend Lease have been discounted to their present valuesunder AIFRS. The effect is:
ConsolidatedJuly 2004
A$m
Non current receivables under AGAAP 95.2AIFRS reconciliation
Discounting Pyrmont Trust receivable (6.3)Discounting Management Fees receivable by Actus Lend Lease (3.2)
Non current receivables under AIFRS 85.7
c. Under AIFRS (AASB 128 “Investment in Associates”), partnerships over which the investor has significant influence have beenclassified as associates. Under this standard, investments in associates have been accounted for using the equity method. LendLease has identified several partnerships that have been reclassified as associates. This has resulted in the reclassification ofA$371.8 million from “Other Investments” to “Equity Accounted Investments”. Further, as the underlying assets of the partnershipsare investment properties (which are recorded at fair value under AIFRS) an additional incremental adjustment of A$131.1 millionwas recorded against “Equity Accounted Investments” on transition. The detailed adjustments are outlined on the following page.

88
Notes to the Concise Financial Statements continued
9. Explanation of Transition to AIFRS continued
Notes to the Reconciliation of Balance Sheet continuedConsolidated
July 2004A$m
Equity accounted investments under AGAAP 112.7AIFRS reconciliation
King of Prussia 332.2Lend Lease Overgate Partnership 109.7Yarmouth Capital Partners Limited Partnership 39.2Lend Lease International Distressed Debt 21.8Adjustment due to change in revenue recognition policy (0.8)
Equity accounted investments under AIFRS 614.8
Other investments under AGAAP 888.7AIFRS reconciliation
King of Prussia (207.4)Lend Lease Overgate Partnership (103.4)Yarmouth Capital Partners Limited Partnership (39.2)Lend Lease International Distressed Debt (21.8)Other – foreign exchange adjustments (0.1)
Other investments under AIFRS 516.8
d. Senior Living Properties
On transition to AIFRS the following properties (held under leasehold arrangements) are expected to fail the stricter revenuerecognition criteria: Abervale, Glenaeon, Keperra and Trinity Green. As a consequence, they will be recorded on the balancesheet as investment property, with a matching non interest bearing liability. The value of investment properties is expected to be A$186.0 million. The calculation of Retirement by Design’s entitlement to deferred management fees will reduce on transitionto AIFRS by approximately A$37.2 million. Deferred management fees will be calculated as the present value of the anticipatedfinal deferred management fees utilising the current property value, amortised over the expected tenure of the resident. This represents a reduction in the deferred management fee accrual from current AGAAP as follows:
ConsolidatedJuly 2004
A$m
Other non current assets under AGAAP 213.8AIFRS reconciliation
Other 0.1Adjustment to Retirement by Design deferred management fees (37.2)
Other non current assets under AIFRS 176.7
e. Intangible assets that fail the stricter recognition criteria are reclassified to goodwill if the asset was acquired through a businesscombination. As a result of the transition to AIFRS, the 30 June 2004 carrying value of GPT Management Agreements in theamount of A$45.2 million was reclassified from Management Agreements to Goodwill (GPT Management Agreements werewritten-off under AGAAP during the June 2005 financial year).
f. As stated in note e, GPT management agreements did not satisfy the stricter recognition requirements of the intangible assetsstandard. The carrying value of GPT management agreements was reclassified to goodwill, as it was purchased as part of abusiness combination.
Consistent with AIFRS, APPF management agreements were amortised at an accelerated rate (a reduction to ten years) inaccordance with a contractual arrangement between Lend Lease and APPF. The resulting adjustment was to increase theamortisation charge of the APPF Management Agreements by A$2.9 million, which was transferred to retained earnings at 1 July 2004. Goodwill amortisation relating to GPT Management Agreements ceased at 1 July 2004 under AIFRS.
g. Lend Lease has two defined benefit superannuation/pension schemes requiring initial recognition under AIFRS; the Bovis UKPension Scheme (gross liability of A$199.2 million) and the Lend Lease Superannuation Fund (gross asset of A$25.5 million).

h. Deferred Taxes and Current Tax
Deferred tax assets increased primarily due to the creation of the Bovis UK Pension Scheme Defined Benefit Plan liability (A$59.8 million) and the creation of the Senior Living non interest bearing liability (A$55.8 million) at 1 July 2004. Deferred taxliabilities increased primarily due to the fair value increment in the King of Prussia partnership: (A$51.8 million), the creation of the Lend Lease Superannuation Fund Defined Benefit Plan asset (A$7.6 million) and the creation of investment property for SeniorLiving (A$55.8 million) at 1 July 2004. The remainder of the variances in deferred tax assets and deferred tax liabilities were due tothe adoption of the revised income taxes standard AASB 112 “Income Taxes” which utilises a balance sheet approach.
i. Lend Lease has reset the Foreign Currency Translation Reserve to zero, resulting in an adjustment to FCTR and retained profitsof A$32.7 million.
j. The effect of the above adjustments on retained earnings is as follows:
ConsolidatedNotes A$m
Retained earnings as at 30 June 2004 under AGAAP 1,915.5AIFRS Reconciliation
Derecognition of revenue from pre-completion contracts a,c (16.3)Discounting of deferred revenue b (9.5)Derecognition of Senior Living Properties deferred management fees d (37.2)Increase in equity accounted investments share of profits c 131.1Movements in deferred tax assets/liabilities and current tax h 17.0APPF management agreement – accelerated amortisation f (2.9)Defined benefit plans net (deficit)/surplus g (173.7)Resetting of foreign currency translation reserve i (32.7)Outside equity interest adjustment (due to discounting deferred revenue) k 0.8
Retained earnings as at 1 July 2004 under AIFRS 1,792.1
k. In accordance with AIFRS (AASB 118 “Revenue”), management fees receivable by Actus Lend Lease have been discounted to their present value. The effect is to reduce outside equity interest in controlled entities by A$0.8 million on transition.
10. Events Subsequent to Balance Date
Acquisition of The Crosby Group plcOn 8 July 2005, Lend Lease acquired The Crosby Group plc, a UK based urban regeneration specialist for £261.0 million (A$612.0 million). The acquisition was 100% debt funded and represented 97% of the voting shares, with managementco-investing so as to own the remaining 3%.The goodwill on acquisition is being finalised in accordance with the “BusinessCombinations” standard under AIFRS. As a result, the financial effect of the acquisition cannot be reliably estimated at the date of this report.
Acquisition of Final Minority Stake in Actus Lend LeaseOn 8 July 2005, Lend Lease acquired the final 12.5% minority stake in Actus Lend Lease, a division of its US communitiesbusiness, which is primarily focused on the provision and management of family housing for the US military. The purchase pricewas US$71.0 million (A$96.1 million). The goodwill on acquisition is being finalised in accordance with the “Business Combinations”standard under AIFRS. As a result, the financial effect of the acquisition cannot be reliably estimated at the date of this report.
Acquisition of One-Third Interest in Performance Retail Limited PartnershipOn 2 August 2005, Lend Lease acquired a one-third interest in Performance Retail Partnership Limited, a UK based retail propertyinvestment fund. The purchase price was £28.4 million (A$66.0 million) and represented one-third of the voting shares.
Sale of US Real Estate Investments Interests in the VEF FundsOn 13 July 2005, Lend Lease sold Value Enhancement Fund III, IV and V for US$54.5 million (A$72.3 million), resulting in a profitbefore tax of US$9.1 million (A$12.1 million). The profit after tax is estimated to be US$5.6 million (A$7.4 million). The buyer was a CSFB fund that invests in secondary market interests in real estate funds.
Sale of Gotham 80/20 Housing Project in New YorkOn 9 August 2005, the partnership with Gotham sold the Foundry in New York, an 80/20 housing project. Lend Lease’s share of net proceeds realised by the partnership was US$10.3 million (A$13.5 million), resulting in a profit before tax of US$8.4 million(A$11.0 million). The profit after tax is estimated to be US$5.2 million (A$6.8 million). The buyer was Archstone Smith, a largepublic apartment Real Estate Investment Trust.
The financial effects of the above transactions have not been brought to account in the financial statements for the year ended 30 June 2005.
89
90
Directors’ Declaration
In the opinion of the Directors of Lend Lease CorporationLimited, the accompanying Concise Financial Report of theconsolidated entity, comprising Lend Lease Corporation Limitedand its controlled entities for the year ended 30 June 2005 setout on pages 64 to 89:
(a) Has been derived from and is consistent with the fullFinancial Report for the financial year; and
(b) Complies with Accounting Standard AASB1039 “Concise Financial Reports”.
D A Crawford Chairman
G A ClarkeManaging Director
Sydney, 17 August 2005.
Signed in accordance with a resolution of Directors:
91
Independent Audit Report on Concise Financial Report to the Members of Lend Lease Corporation Limited
Scope
The Financial Report and Directors’ ResponsibilityThe Concise Financial Report comprises the statement offinancial performance, statement of financial position, statementof cash flows, accompanying notes 1 to 10, the disclosuresmade by the Company in accordance with the CorporationsRegulations 2001, including the disclosures as required byAASB 1046 “Director and Executive Disclosures by DisclosingEntities” in the Executives’ and Directors’ RemunerationDisclosures in Section 3 of the Directors’ Report (remunerationdisclosures) and the accompanying Discussion and Analysis onthe Statement of Financial Performance, Statement of FinancialPosition, and Statement of Cash Flows for Lend LeaseCorporation Limited (the Company) and its controlled entities(the Consolidated Entity) for the year ended 30 June 2005.
The Directors of the Company are responsible for thepreparation of the Concise Financial Report in accordance withAustralian Accounting Standard AASB 1039 “Concise FinancialReports”. This includes responsibility for the maintenance ofadequate accounting records and internal controls that aredesigned to prevent and detect fraud and error, and for theaccounting policies and accounting estimates inherent in theConcise Financial Report.
Audit ApproachWe conducted an independent audit in order to express anopinion to members of the Company. Our audit was conducted in accordance with Australian Auditing Standards in order to provide reasonable assurance as to whether theConcise Financial Report is free of material misstatement. The nature of an audit is influenced by factors such as the use of professional judgement, selective testing, the inherentlimitations of internal control, and the availability of persuasiverather than conclusive evidence. Therefore an audit cannotguarantee that all material misstatements have been detected.We have also performed an independent audit of the fullFinancial Report including the disclosures made by theCompany in accordance with the Corporations Regulations2001, including the remuneration disclosures of the Companyand its controlled entities for the year ended 30 June 2005. Our audit report on the full Financial Report was signed on 17 August 2005 and was not subject to any qualification.
We performed procedures in respect of the audit of the Concise Financial Report to assess whether, in all materialrespects, the Concise Financial Report is presented fairly inaccordance with Australian Accounting Standard AASB 1039“Concise Financial Reports”.
We formed our audit opinion on the basis of these procedures,which included:
– Testing that the information in the Concise Financial Report is consistent with the full Financial Report, and
– Examining, on a test basis, information to provide evidencesupporting the amounts, discussion and analysis, and otherdisclosures, which were not directly derived from the fullFinancial Report.
While we considered the effectiveness of management’sinternal controls over financial reporting when determining the nature and extent of our procedures, our audit was notdesigned to provide assurance on internal controls.
Audit OpinionIn our opinion, the Concise Financial Report of Lend LeaseCorporation Limited and its controlled entities for the yearended 30 June 2005 complies with Australian AccountingStandard AASB 1039 “Concise Financial Reports”.
Sydney, 17 August 2005
KPMG
G R WilsonPartner

92
Lend Lease Foundation 2005 Annual Report
At Lend Lease, business success isevaluated not only by financial measures,but also by the value attributed to ourknowledge and emotional assets. Theseassets include employee know-how andeducation, effective employee relations,and employee motivation, commitmentand trust. We recognise that successfullymanaging and leveraging our intellectualand emotional capital is directly alignedto our performance.
Since its establishment in 1983, the LendLease Foundation has providedemployees with unique opportunities for growth and development. Importantly,the Foundation’s knowledge initiatives are complemented by a commitment todeveloping innovative ways foremployees to support the communities inwhich they work and live. We believe thisrecognition of social returns differentiatesus from our competitors and drivesoutcomes that give Lend Lease astrategic competitive advantage.
The Foundation operates through anetwork of more than 200 Foundationrepresentatives worldwide. Theserepresentatives are full-time Lend Lease
employees who volunteer to help makeLend Lease a rewarding place to work.The Foundation’s programmes can becategorised as follows:
Developing U: these programmesprovide employees with learning anddevelopment opportunities well beyondthe scope of normal business operations.Our flagship global programme,Springboard, brings employees of alllevels together for a four-day conferenceon personal leadership and growth. Otherexamples include presentation skillstraining, personal interest courses andwork/life balance seminars.
Business Partnerships: theseprogrammes allow employees to engagewith each other in a relaxed environmentwhile learning more about developmentsin our business. These programmes aimto foster lasting employee networks andinclude the very popular Jam Sessions inthe Pacific, Team Connexions in theAmericas and NetworX in the UnitedKingdom and Europe.
Connections: these programmes aredesigned to build camaraderie and giveemployees and their families a broader
sense of the Lend Lease community.Examples include family days and movienights. In the US, the popular AnnualNational Bowling Tournament this yearbrought together 18 offices and over 880Lend Lease employees and their families.
Community: our longest running, mostpopular Foundation programme isCommunity Day. One day every yearmany of the Group’s 9,000 employeesaround the globe take time out tovolunteer on local community projects.Since Community Day began in 1995, weestimate our employees have spent morethan 200,000 hours on Community Dayactivities alone.
The Foundation’s activities are funded by distributions from existing employeebenefit vehicles. Lend Lease businessunits do not fund the Foundation and theFoundation makes no claims on LendLease for funding or administration.
Lend Lease is proud of the Foundationand its history. It is recognised as specialto Lend Lease and represents our long-standing commitment to buildingand sustaining the social capital of theLend Lease global community.
Lend Lease FoundationJune 2005 June 2004
A$m A$m
RevenueGross income from employee benefit vehicles 19.9 7.0(includes funding for future employee programmes)Total Revenue 19.9 7.0
ExpensesGlobal programmes/operations 2.2 2.0Asia/Pacific programmes 3.3 2.2Europe programmes 3.1 1.6USA programmes 2.7 1.2Provision for future employee programmes 8.6 –Total Expenses 19.9 7.0
Profit Before Tax 0.0 0.0Tax benefit 0.0 0.0Profit After Tax 0.0 0.0

93
Stock Exchange Listings and CodeLend Lease Corporation Limited is listedon the Australian and New ZealandStock Exchanges and trades under thecode LLC.
American Depository ReceiptsIn the US, Lend Lease shares are tradedin the form of sponsored AmericanDepository Receipts (ADRs) on the overthe counter market under the symbolLLESY. Each ADR represents oneordinary share. Information about ADRs is available from the depository, The Bankof New York (www.adrbny.com).
Share Accumulation PlanThe Share Accumulation Plan is designedto be a convenient way for shareholderswith a registered address in Australia orNew Zealand to build their shareholdingswithout incurring transaction costs. Thelaws of other countries make it difficult forus to offer shares in this way.
Lend Lease shareholders are able toreinvest their dividends to acquire moreLend Lease shares through the DividendReinvestment Plan (DRP) or the ShareElection Plan (SEP). Shareholders mayalso make contributions of betweenA$500 and A$2,500 to acquire newLend Lease shares under the Share
Purchase Plan (SPP). Together the DRP,SEP and SPP constitute the ShareAccumulation Plan.
The Share Accumulation Plan wassuspended with effect from thedividend paid in September 2003 for the SEP and SPP and from thedividend paid in March 2004 for theDRP. The SEP was reinstated for thedividend paid on 14 September 2005,however, the DRP and SPP remainsuspended.
The rules of each of these plans are setout in the Share Accumulation PlanInformation Sheet. Copies are available from the Registry (ASXPerpetual Registrars Limited) or the Lend Lease website.
Share Disposition FacilityAs a service to small shareholders, a Share Disposition Facility (SDF) isprovided that allows shareholders to sell part of their shareholding in aconvenient and cost effective mannerwithout incurring any brokerage costs.The SDF allows shareholders to sell thatnumber of their Lend Lease shares with avalue of up to $1,500 every six months.
Annual ReportThis Annual Report can be found on ourwebsite. Shareholders who do not wishto receive future Annual Reports shouldcontact the Registry. Shareholderselecting not to receive Annual Reports willcontinue to receive all other shareholderinformation, including Notices of AnnualGeneral Meetings.
Privacy LegislationUnder Chapter 2C of the CorporationsAct 2001, a shareholder’s information(including the name, address and detailsof shares held) is required to be includedin Lend Lease’s public register. Thisinformation must continue to be includedin Lend Lease’s public register for sevenyears after a person ceases to be ashareholder. These statutory obligationsare not altered by the PrivacyAmendment (Private Sector) Act 2000.Information is collected to administer theshareholder’s holding and if some or all of the information is not collected, then itmight not be possible to administer theholding. Lend Lease’s privacy policy isavailable on our website. The Registry’sprivacy policy is available on its website(www.asxperpetual.com.au).
Shareholder Information
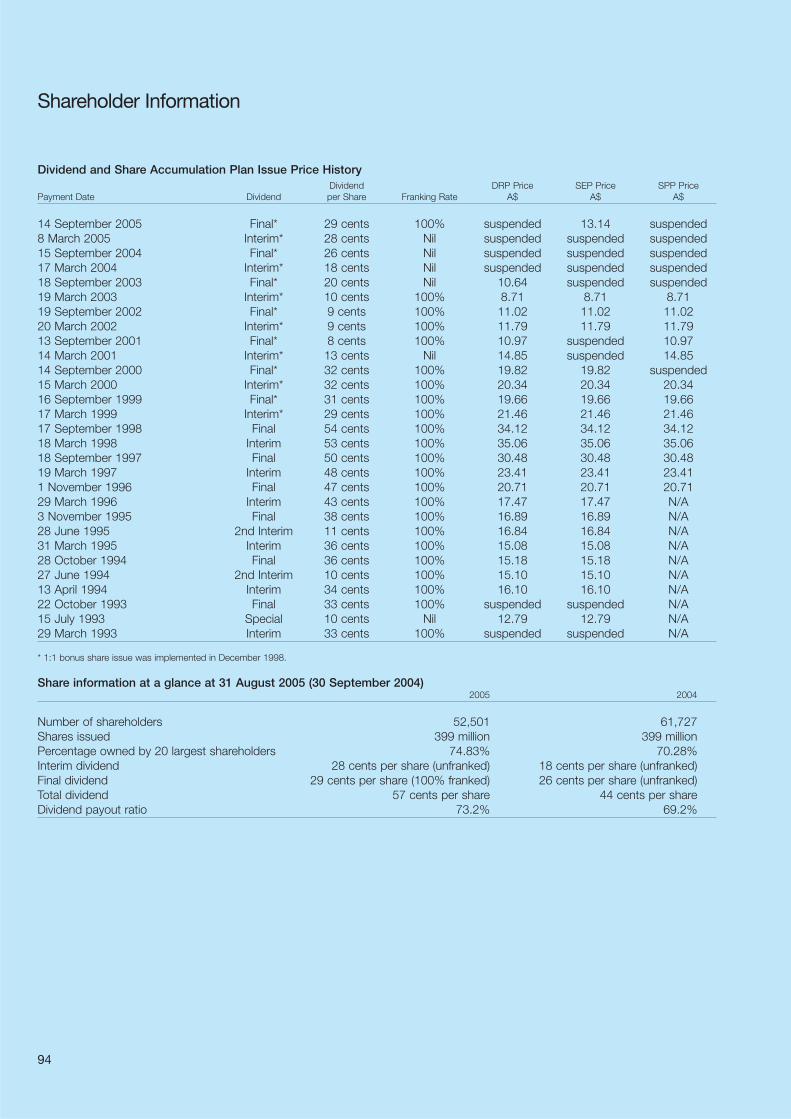
94
Shareholder Information
Dividend and Share Accumulation Plan Issue Price HistoryDividend DRP Price SEP Price SPP Price
Payment Date Dividend per Share Franking Rate A$ A$ A$
14 September 2005 Final* 29 cents 100% suspended 13.14 suspended8 March 2005 Interim* 28 cents Nil suspended suspended suspended15 September 2004 Final* 26 cents Nil suspended suspended suspended17 March 2004 Interim* 18 cents Nil suspended suspended suspended18 September 2003 Final* 20 cents Nil 10.64 suspended suspended19 March 2003 Interim* 10 cents 100% 8.71 8.71 8.7119 September 2002 Final* 9 cents 100% 11.02 11.02 11.0220 March 2002 Interim* 9 cents 100% 11.79 11.79 11.7913 September 2001 Final* 8 cents 100% 10.97 suspended 10.9714 March 2001 Interim* 13 cents Nil 14.85 suspended 14.8514 September 2000 Final* 32 cents 100% 19.82 19.82 suspended15 March 2000 Interim* 32 cents 100% 20.34 20.34 20.3416 September 1999 Final* 31 cents 100% 19.66 19.66 19.6617 March 1999 Interim* 29 cents 100% 21.46 21.46 21.4617 September 1998 Final 54 cents 100% 34.12 34.12 34.1218 March 1998 Interim 53 cents 100% 35.06 35.06 35.0618 September 1997 Final 50 cents 100% 30.48 30.48 30.4819 March 1997 Interim 48 cents 100% 23.41 23.41 23.411 November 1996 Final 47 cents 100% 20.71 20.71 20.7129 March 1996 Interim 43 cents 100% 17.47 17.47 N/A3 November 1995 Final 38 cents 100% 16.89 16.89 N/A28 June 1995 2nd Interim 11 cents 100% 16.84 16.84 N/A31 March 1995 Interim 36 cents 100% 15.08 15.08 N/A28 October 1994 Final 36 cents 100% 15.18 15.18 N/A27 June 1994 2nd Interim 10 cents 100% 15.10 15.10 N/A13 April 1994 Interim 34 cents 100% 16.10 16.10 N/A22 October 1993 Final 33 cents 100% suspended suspended N/A15 July 1993 Special 10 cents Nil 12.79 12.79 N/A29 March 1993 Interim 33 cents 100% suspended suspended N/A
* 1:1 bonus share issue was implemented in December 1998.
Share information at a glance at 31 August 2005 (30 September 2004)2005 2004
Number of shareholders 52,501 61,727Shares issued 399 million 399 millionPercentage owned by 20 largest shareholders 74.83% 70.28%Interim dividend 28 cents per share (unfranked) 18 cents per share (unfranked)Final dividend 29 cents per share (100% franked) 26 cents per share (unfranked)Total dividend 57 cents per share 44 cents per shareDividend payout ratio 73.2% 69.2%

95
Spread of ShareholdingsDetails of the spread of shareholdings at 31 August 2005 (30 September 2004) are as follows:
2005 2004
1 to 1,000 shares 31,535 36,9191,001 to 5,000 shares 17,935 21,3145,001 to 10,000 shares 1,920 2,20410,001 to 100,000 shares 1,024 1,199100,001 shares and over 87 91Total number of shareholders 52,501 61,727Shareholders with less than a marketable parcel 1,509 1,800
(representing 21,386 shares) (representing 29,718 shares)
Twenty Largest Shareholders at 31 August 2005No. of % of Issued
Name Shares Capital
Westpac Custodian Nominees Limited 67,245,276 16.87J P Morgan Nominees Australia Limited 53,408,834 13.40National Nominees Limited 41,584,185 10.43LL Employee Holdings Custodian Pty Limited 41,118,416 10.31ANZ Nominees Limited 19,373,975 4.86Citicorp Nominees Pty Limited 18,883,097 4.74Queensland Investment Corporation 10,721,010 2.69Cogent Nominees Pty Limited 9,886,182 2.48RBC Global Services Australia Nominees Pty Limited 9,299,951 2.33HSBC Custody Nominees (Australia) Limited 4,932,394 1.24Tasman Asset Management Limited 3,663,823 0.92AMP Life Limited 3,345,823 0.84IAG Nominees Pty Limited 3,155,669 0.79PSS Board 2,877,864 0.72CSS Board 2,099,773 0.53Government Superannuation Office 1,891,017 0.47Argo Investments Limited 1,350,000 0.34Victorian Workcover Authority 1,269,541 0.32Promina Equities Limited 1,258,574 0.32Transport Accident Commission 976,070 0.24
74.83
Substantial Shareholders as shown in the Company’s Register at 31 August 2005Date of Last No. of % of Issued
Name Notice Received Shares Capital
Balanced Equity Management Pty Ltd 21 July 2004 20,288,610 5.08Deutsche Bank AG 22 October 2004 21,578,014 5.41LL Employee Holdings Custodian Pty Limited1 5 May 2005 43,555,829 10.91Maple-Brown Abbott Limited 5 March 2004 33,306,194 8.13Schroder Investment Management Group 19 July 2005 20,652,134 5.18
1 This is a Lend Lease employee benefit vehicle.

96
Directory
Lend Lease Corporation LimitedABN 32 000 226 228Incorporated in New South Wales,Australia
Registered OfficeLevel 4, 30 The Bond30 Hickson RoadMillers Point NSW 2000
Telephone: 61 (2) 9236 6111Facsimile: 61 (2) 9252 2192
DirectorsD A Crawford,Chairman
G A Clarke, Managing Director and Chief Executive Officer
R A Longes, Deputy Chairman
A Chamberlain
G G Edington
P C Goldmark
D J Ryan
R H Taylor
SecretariesP W Crewes
S J Sharpe
Stock Exchange ListingsAustralia
New Zealand
AuditorsKPMG10 Shelley StreetSydney NSW 2000
Share Registry and Shareholder Queries
Principal RegisterASX Perpetual Registrars LimitedLevel 8, 580 George StreetSydney NSW 2000Locked Bag A14Sydney South NSW 1235
Telephone: 1800 230 300 (within Australia) or 61 (2) 8280 7123 (outside Australia)
Facsimile: 61 (2) 9287 0303
Email: [email protected]
Website: www.asxperpetual.com.au
UK RegisterB Davis & CoPark House158-160 Arthur RoadWimbledon ParkLondon SW19 8AQ
Telephone: 44 (20) 8947 3361Facsimile: 44 (20) 8944 1039
USA AgentThe Bank of New YorkInvestor ServicesPO Box 11258Church Street StationNew York NY 10286-1258
Telephone: 1 (212) 815 3700Email: shareholders @bankofny.comWebsite: www.adrbny.com
Investor InformationLend Lease Corporation Limited’s AnnualReport, Annual Consolidated FinancialReport and other information on the Lend Lease Group can be obtained from Investor Relations.
Telephone: 61 (2) 9236 6065Facsimile: 61 (2) 9252 2192Email: [email protected]: www.lendlease.com
2006 Financial Calendar
Announcement of Half-Year ResultsFebruary
Interim Dividend PayableMarch
Announcement of Final ResultsAugust
Final Dividend PayableSeptember
Annual General MeetingNovember
Annual General MeetingThe 2005 Annual General Meeting ofLend Lease Corporation Limited will be held at 10.00am on Thursday, 17 November 2005 at the WesleyConference Centre, 220 Pitt Street,Sydney, Australia. Full details of theMeeting are contained in the Notice of Annual General Meeting sent with this Report.

Paper Specifications The cover and pages 1 to 36 of this report are printedon Monza Satin, an environmentally responsible papermanufactured with 50% recycled fibre (15% post-consumer waste and 35% pre-consumer waste [notincluding mill-broke]) using Elemental Chlorine Free(ECF) pulp sourced from sustainable, well managedforests. Water is mostly recyclable through manufacturingand waste is treated to strict local standards. MonzaSatin is produced by Burgo, a company certified underISO14001 environmental management systems andIntegrated Pollution Prevention & Control (IPPC).
The remainder of this report is printed on Nordset, an environmentally responsible paper manufacturedusing Elemental Chlorine Free (ECF) pulp sourced from sustainable, well managed forests. Nordset isproduced by Nordland Papier, a company certifiedunder ISO14001 environmental management systemsand registered under the EU Eco-management and Audit Scheme EMAS (Nordland Papier, Reg. No. D-162-00007).
Lend Lease CorporationABN 32 000 226 228

www.lendlease.com
2005 Annual R
epo
rt to S
harehold
ersLend
Lease Co
rpo
ration
2005 Annual Reportto Shareholders