feb 2017 water supply briefing - national oceanic and ... · 02-02-2017 · forecast system...
TRANSCRIPT
Feb 2017 Water Supply Briefing National Weather Service, Northwest River Forecast Center
Presentation available after brief at: www.nwrfc.noaa.gov/presentations/presentations.cgi
Telephone Conference: 1-888-677-0012 Pass Code: 91999
Taylor Dixon, NWRFC [email protected]
(503) 326-7291
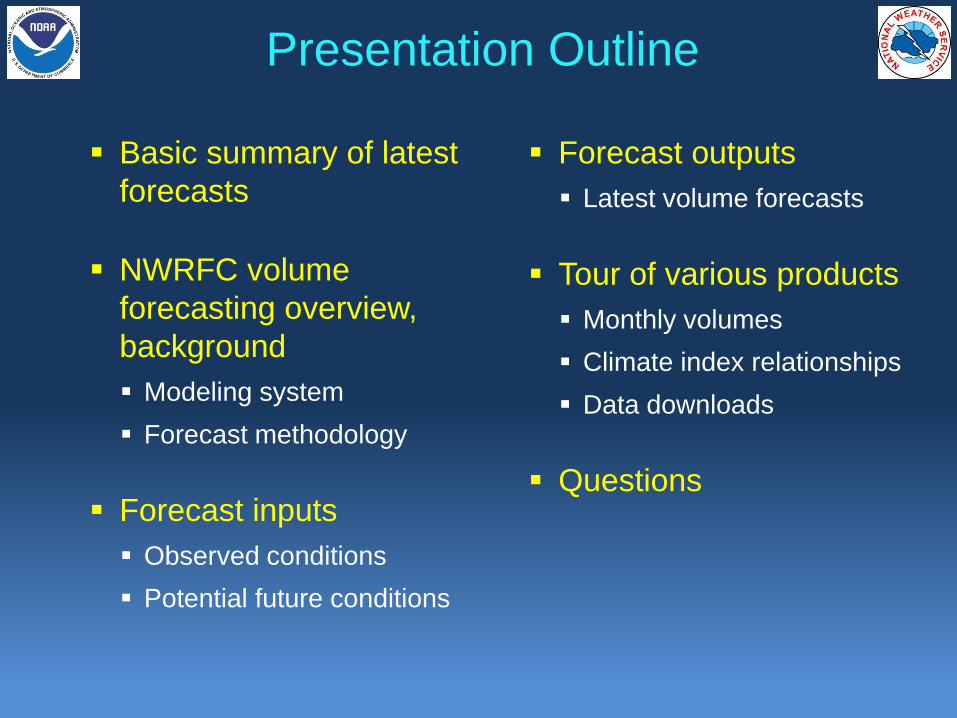
Presentation Outline
Basic summary of latest
forecasts
NWRFC volume
forecasting overview,
background
Modeling system
Forecast methodology
Forecast inputs
Observed conditions
Potential future conditions
Forecast outputs
Latest volume forecasts
Tour of various products
Monthly volumes
Climate index relationships
Data downloads
Questions
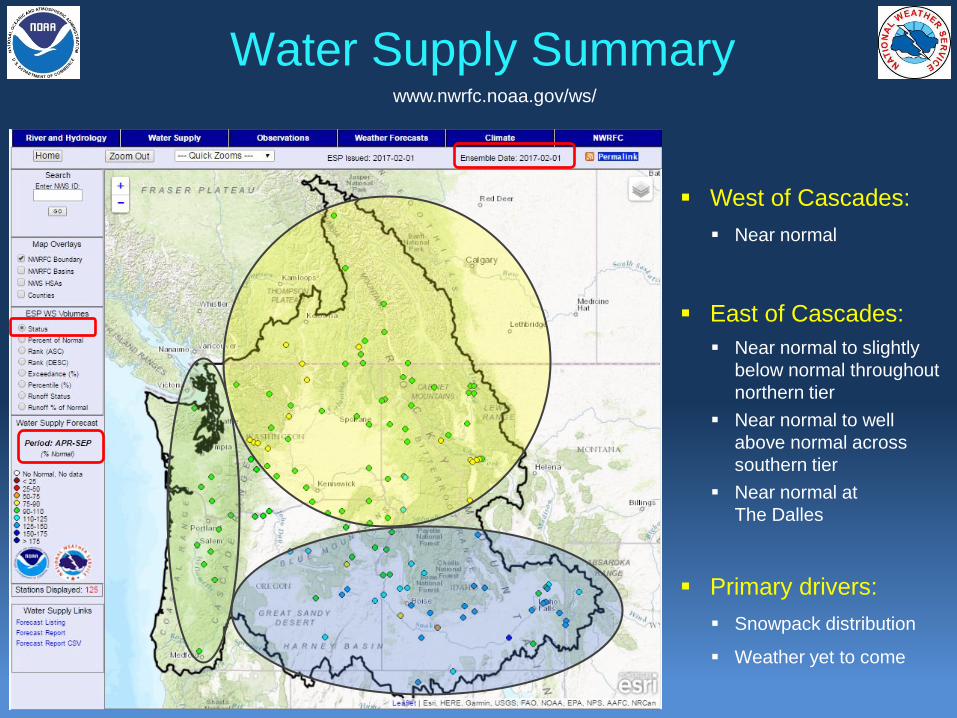
Water Supply Summary
West of Cascades:
Near normal
East of Cascades:
Near normal to slightly
below normal throughout
northern tier
Near normal to well
above normal across
southern tier
Near normal at
The Dalles
Primary drivers:
Snowpack distribution
Weather yet to come
www.nwrfc.noaa.gov/ws/
Volume Forecasting Overview
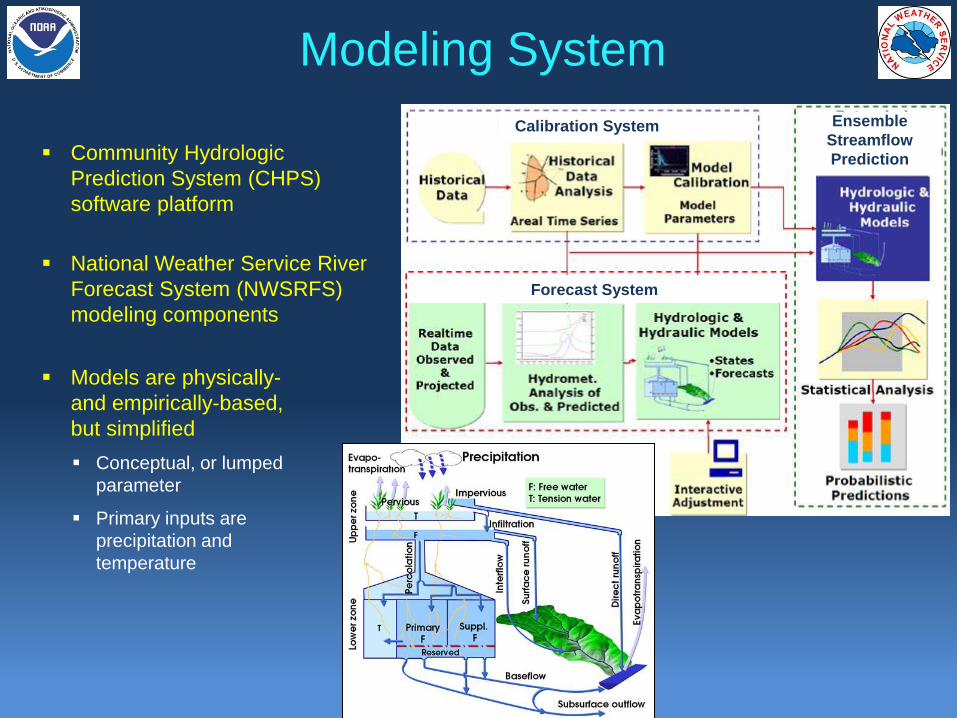
Modeling System
Community Hydrologic
Prediction System (CHPS)
software platform
National Weather Service River
Forecast System (NWSRFS)
modeling components
Models are physically-
and empirically-based,
but simplified
Conceptual, or lumped
parameter
Primary inputs are
precipitation and
temperature
Ensemble
Streamflow
Prediction
Calibration System
Forecast System
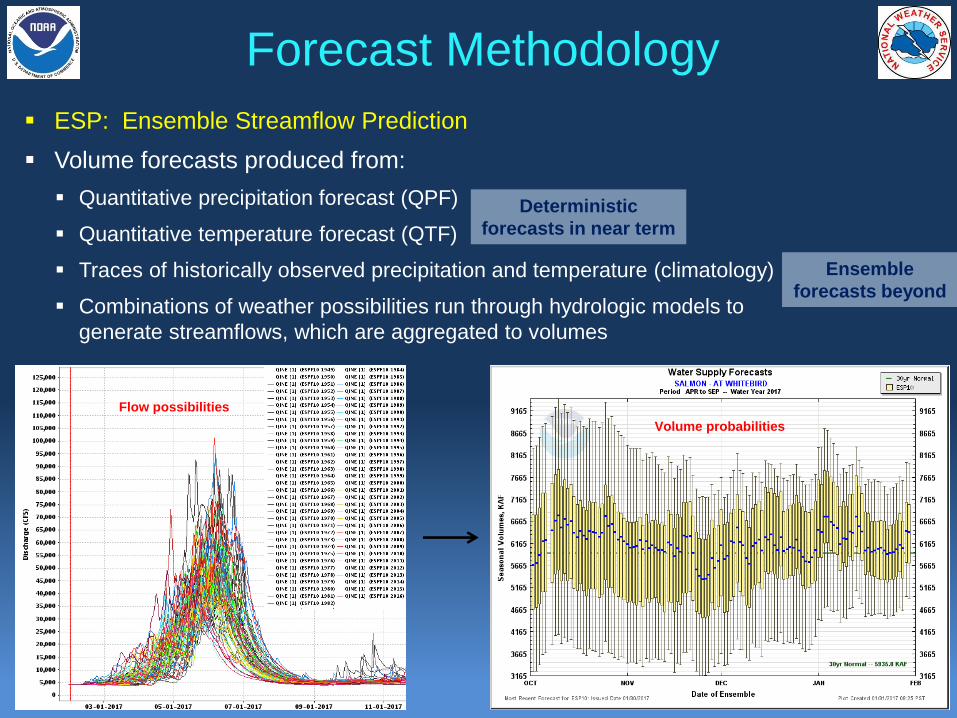
ESP: Ensemble Streamflow Prediction
Volume forecasts produced from:
Quantitative precipitation forecast (QPF)
Quantitative temperature forecast (QTF)
Traces of historically observed precipitation and temperature (climatology)
Combinations of weather possibilities run through hydrologic models to
generate streamflows, which are aggregated to volumes
Flow possibilities
Volume probabilities
Forecast Methodology
Deterministic
forecasts in near term
Ensemble
forecasts beyond
Forecasts are updated daily, but observed data is assimilated and models are run
continuously
Forecasts are compared to 30 year observed (adjusted) runoff normals (currently
1981-2010)
Water supply forecasts:
Volumes are adjusted for significant upstream reservoir storage, as described in the
adjustment section of the NWRFC water supply webpage
Natural volume forecasts:
Volumes are adjusted for all man-made upstream activity, including storage, consumptive
use, and diversions.
Forecast Methodology
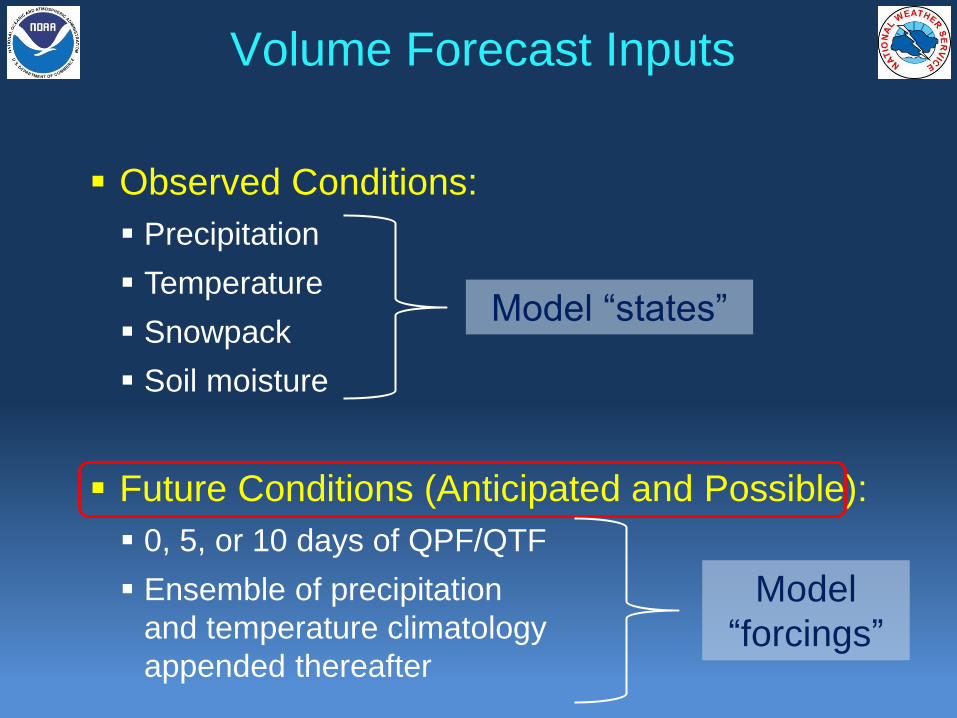
Volume Forecast Inputs
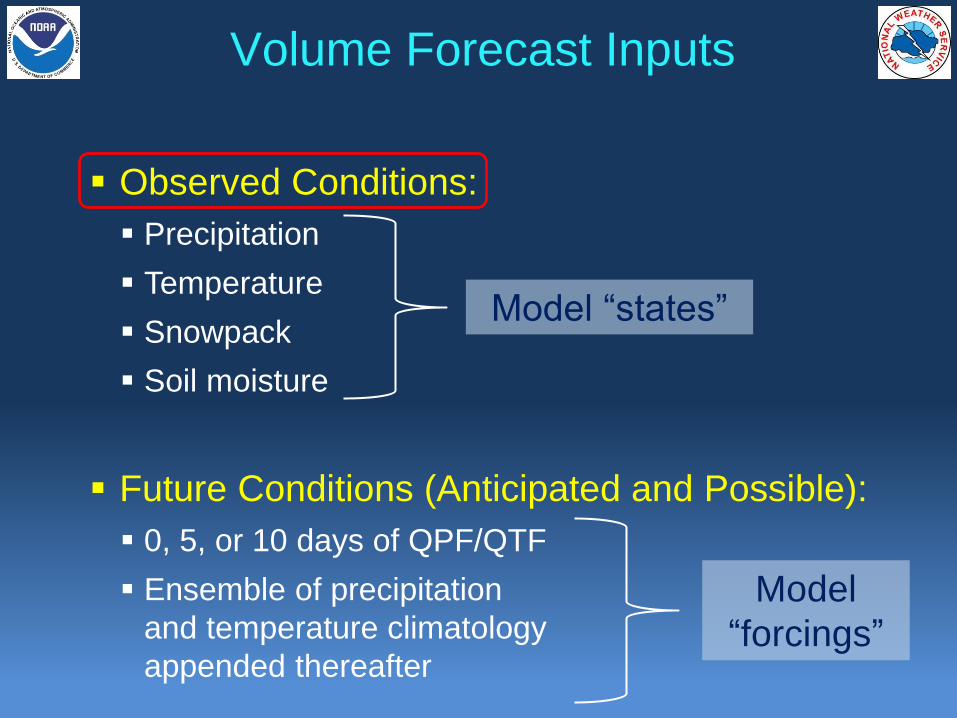
Volume Forecast Inputs
Observed Conditions:
Precipitation
Temperature
Snowpack
Soil moisture
Future Conditions (Anticipated and Possible):
0, 5, or 10 days of QPF/QTF
Ensemble of precipitation
and temperature climatology
appended thereafter
Model “states”
Model
“forcings”
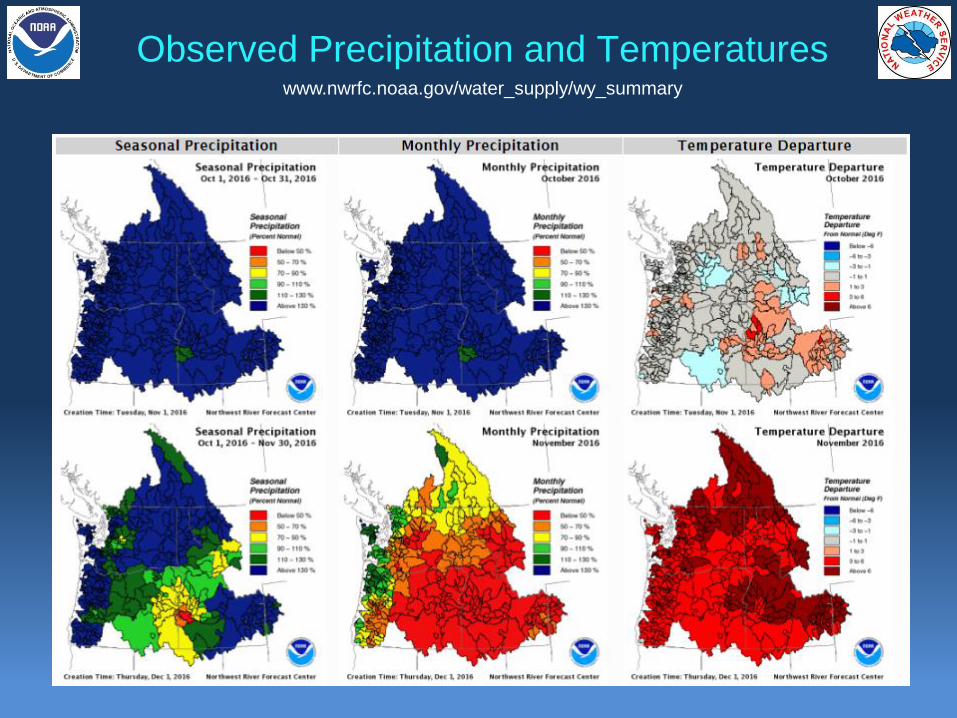
Observed Precipitation and Temperatures www.nwrfc.noaa.gov/water_supply/wy_summary
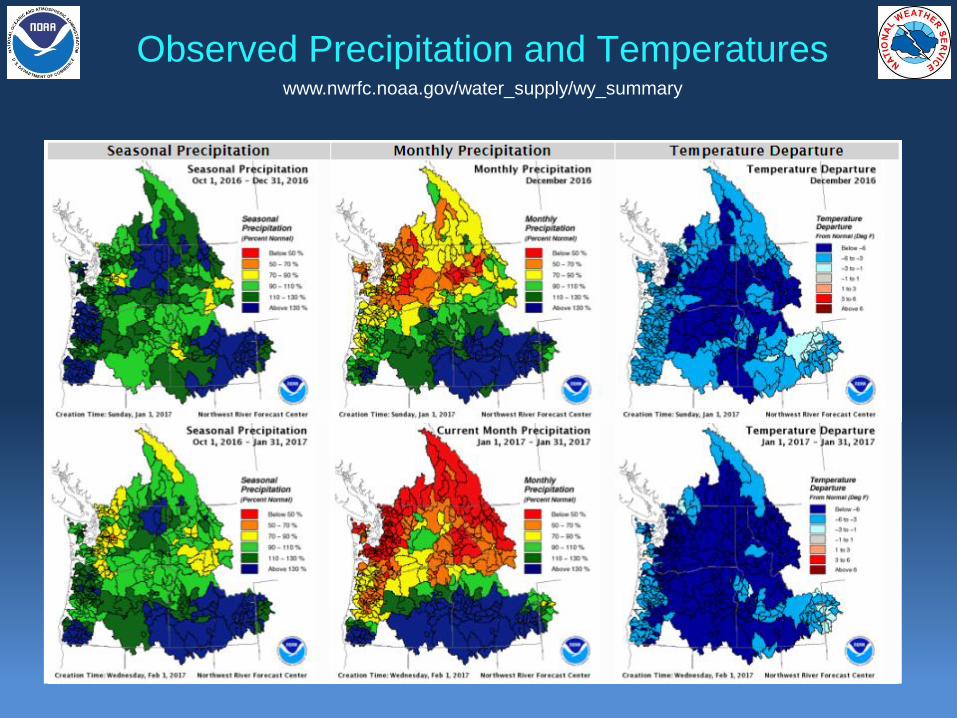
www.nwrfc.noaa.gov/water_supply/wy_summary
Observed Precipitation and Temperatures
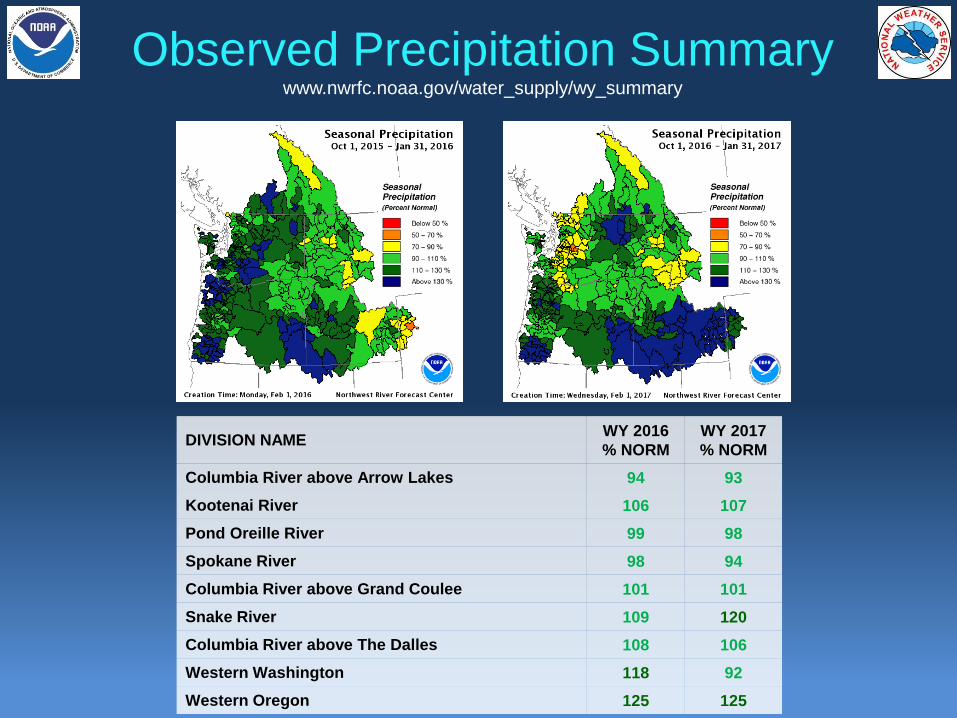
DIVISION NAME WY 2016
% NORM
WY 2017
% NORM
Columbia River above Arrow Lakes 94 93
Kootenai River 106 107
Pond Oreille River 99 98
Spokane River 98 94
Columbia River above Grand Coulee 101 101
Snake River 109 120
Columbia River above The Dalles 108 106
Western Washington 118 92
Western Oregon 125 125
Observed Precipitation Summary www.nwrfc.noaa.gov/water_supply/wy_summary
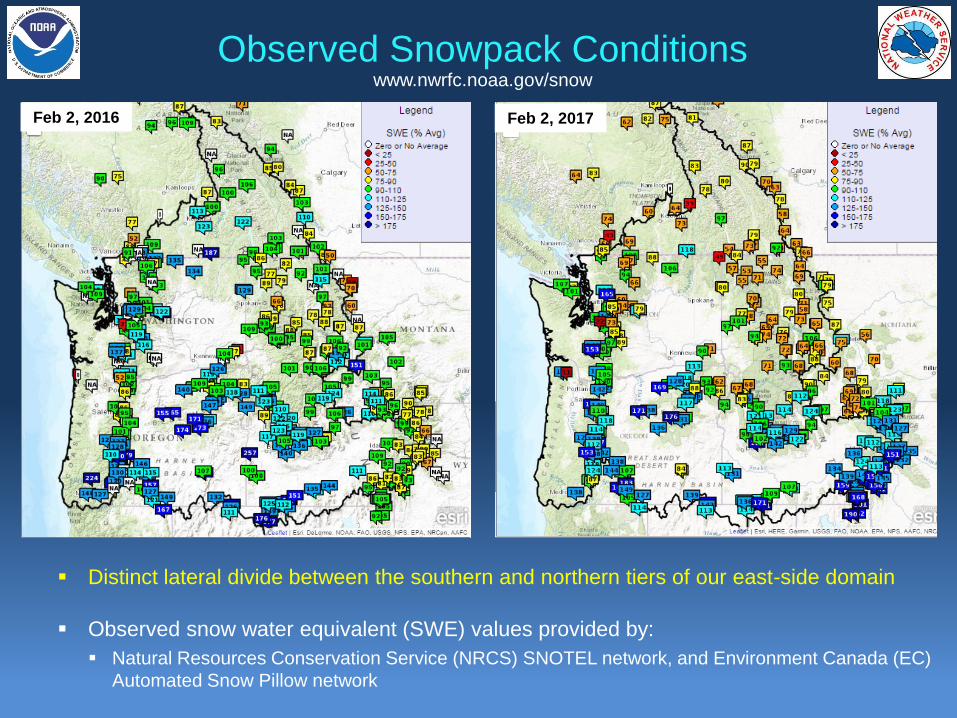
Observed Snowpack Conditions
Distinct lateral divide between the southern and northern tiers of our east-side domain
Observed snow water equivalent (SWE) values provided by:
Natural Resources Conservation Service (NRCS) SNOTEL network, and Environment Canada (EC)
Automated Snow Pillow network
Feb 2, 2017 Feb 2, 2016
www.nwrfc.noaa.gov/snow
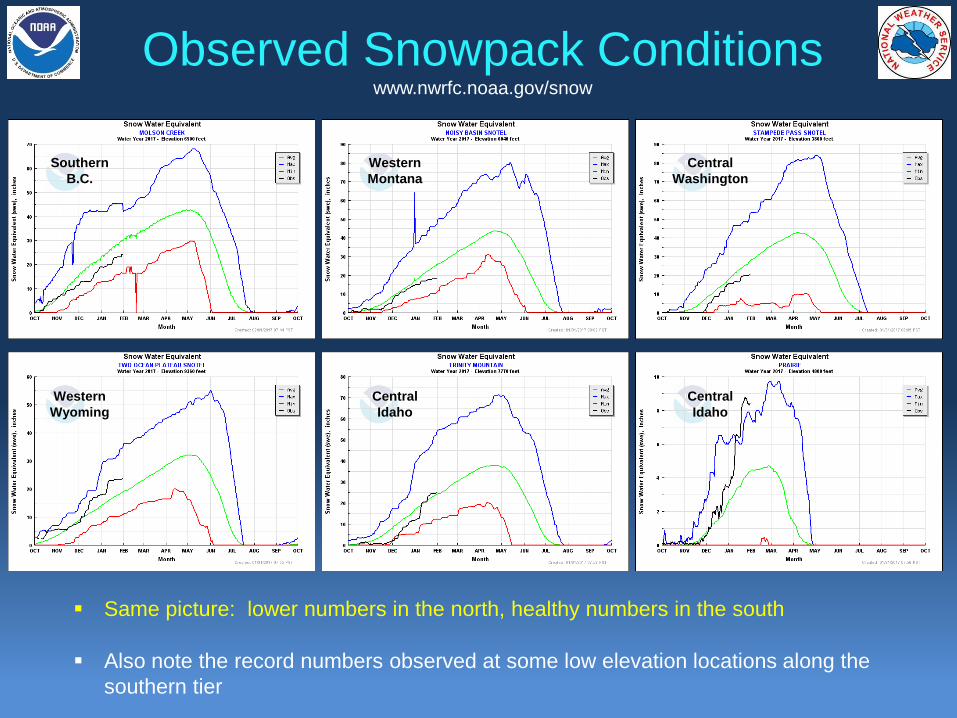
Observed Snowpack Conditions www.nwrfc.noaa.gov/snow
Southern
B.C.
Western
Montana
Central
Washington
Western
Wyoming
Central
Idaho
Central
Idaho
Same picture: lower numbers in the north, healthy numbers in the south
Also note the record numbers observed at some low elevation locations along the
southern tier
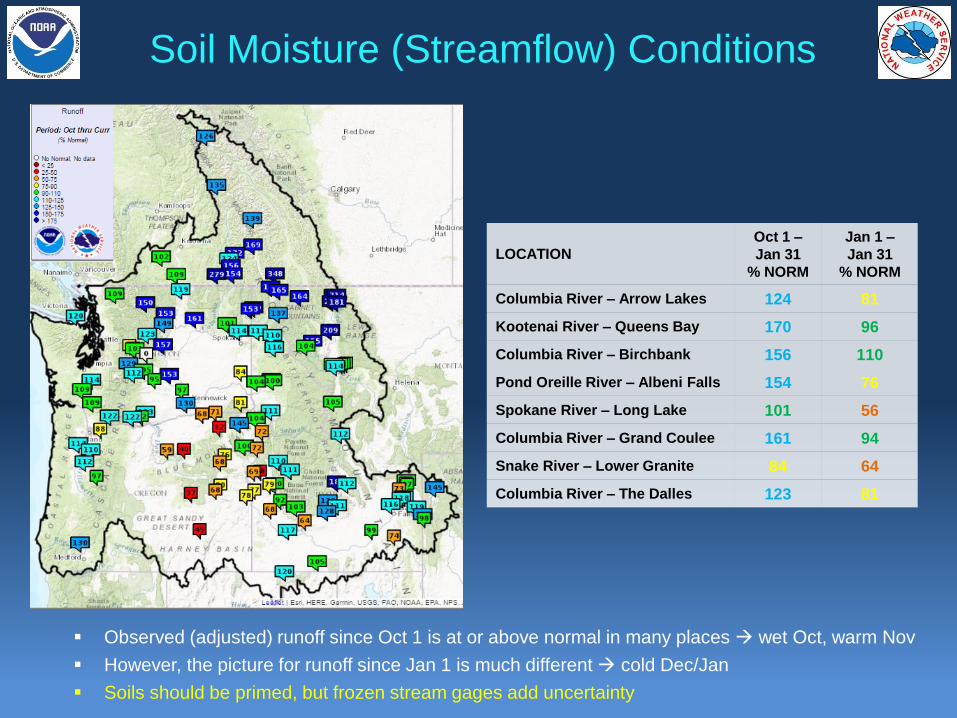
Soil Moisture (Streamflow) Conditions
LOCATION
Oct 1 –
Jan 31
% NORM
Jan 1 –
Jan 31
% NORM
Columbia River – Arrow Lakes 124 81
Kootenai River – Queens Bay 170 96
Columbia River – Birchbank 156 110
Pond Oreille River – Albeni Falls 154 76
Spokane River – Long Lake 101 56
Columbia River – Grand Coulee 161 94
Snake River – Lower Granite 84 64
Columbia River – The Dalles 123 81
Observed (adjusted) runoff since Oct 1 is at or above normal in many places wet Oct, warm Nov
However, the picture for runoff since Jan 1 is much different cold Dec/Jan
Soils should be primed, but frozen stream gages add uncertainty
Volume Forecast Inputs
Observed Conditions:
Precipitation
Temperature
Snowpack
Soil moisture
Future Conditions (Anticipated and Possible):
0, 5, or 10 days of QPF/QTF
Ensemble of precipitation
and temperature climatology
appended thereafter
Model “states”
Model
“forcings”
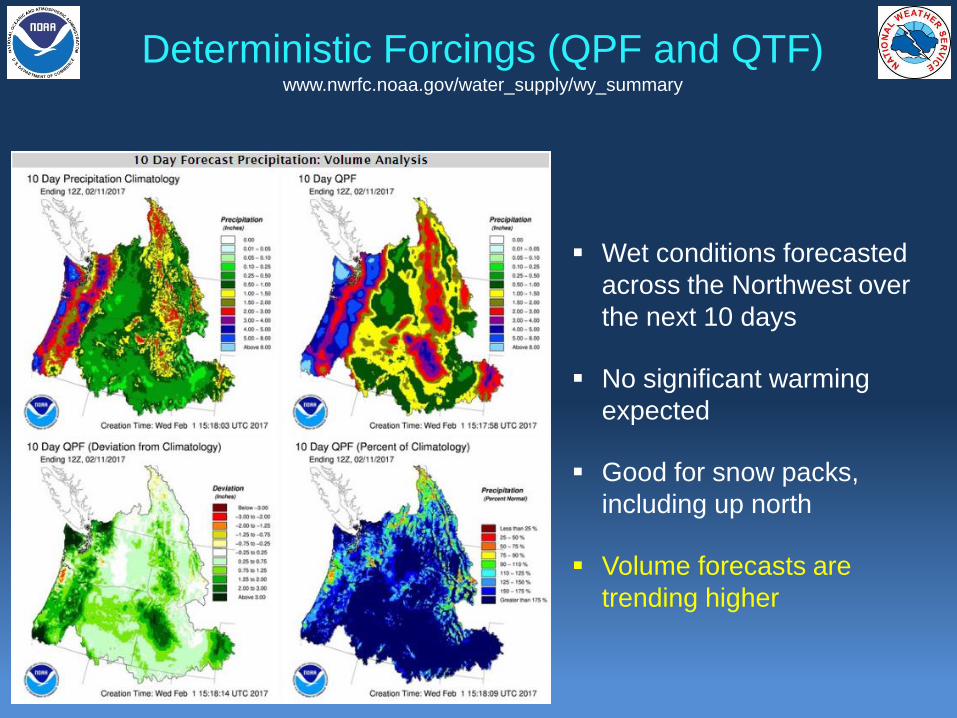
Wet conditions forecasted
across the Northwest over
the next 10 days
No significant warming
expected
Good for snow packs,
including up north
Volume forecasts are
trending higher
www.nwrfc.noaa.gov/water_supply/wy_summary
Deterministic Forcings (QPF and QTF)
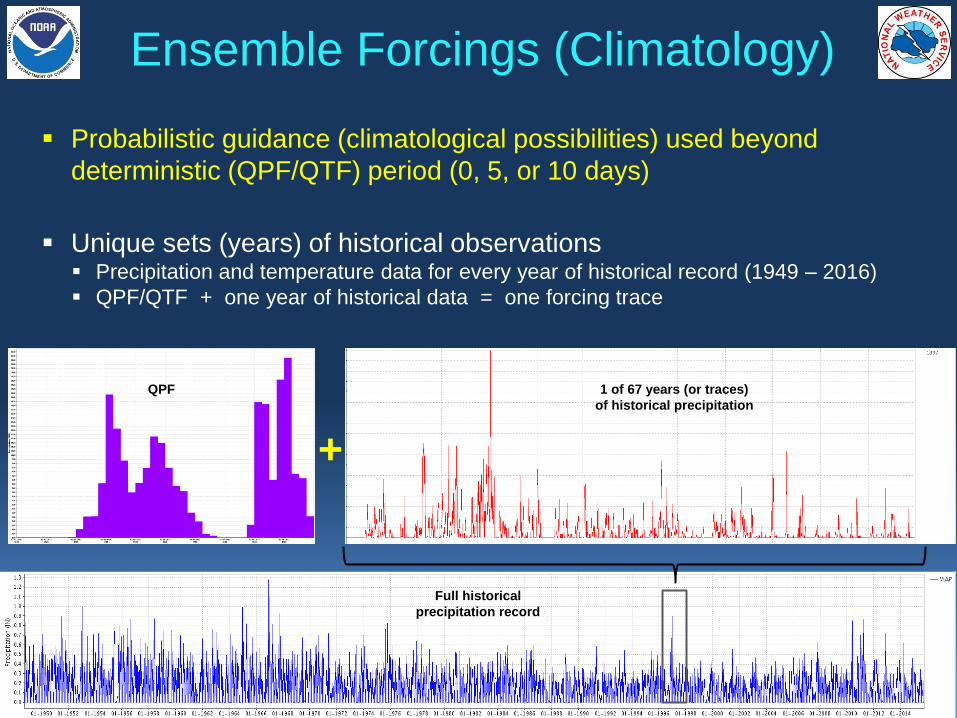
Ensemble Forcings (Climatology)
Probabilistic guidance (climatological possibilities) used beyond
deterministic (QPF/QTF) period (0, 5, or 10 days)
Unique sets (years) of historical observations Precipitation and temperature data for every year of historical record (1949 – 2016)
QPF/QTF + one year of historical data = one forcing trace
Full historical
precipitation record
1 of 67 years (or traces)
of historical precipitation
+
QPF

Latest Volume Forecasts
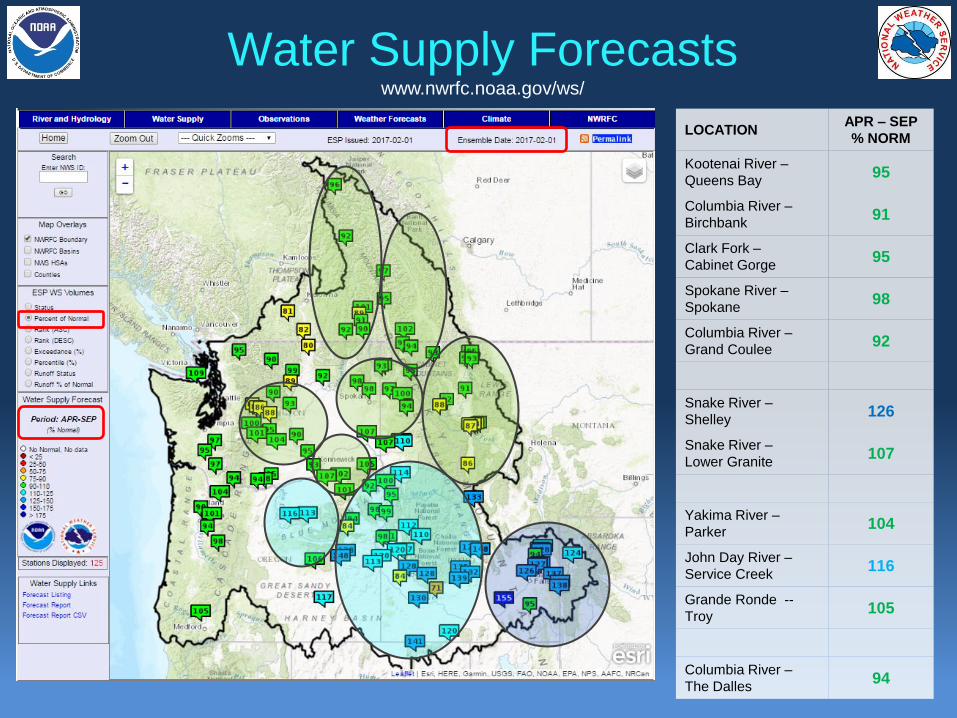
Water Supply Forecasts
LOCATION APR – SEP
% NORM
Kootenai River –
Queens Bay 95
Columbia River –
Birchbank 91
Clark Fork –
Cabinet Gorge 95
Spokane River –
Spokane 98
Columbia River –
Grand Coulee 92
Snake River –
Shelley 126
Snake River –
Lower Granite 107
Yakima River –
Parker 104
John Day River –
Service Creek 116
Grande Ronde --
Troy 105
Columbia River –
The Dalles 94
www.nwrfc.noaa.gov/ws/
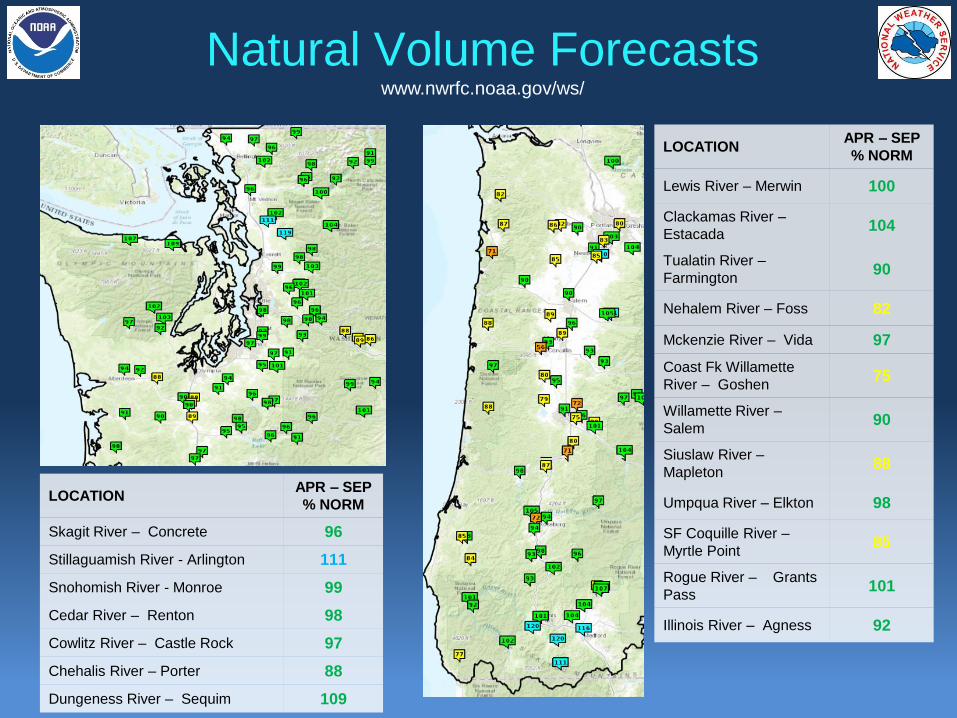
Natural Volume Forecasts
LOCATION APR – SEP
% NORM
Lewis River – Merwin 100
Clackamas River –
Estacada 104
Tualatin River –
Farmington 90
Nehalem River – Foss 82
Mckenzie River – Vida 97
Coast Fk Willamette
River – Goshen 75
Willamette River –
Salem 90
Siuslaw River –
Mapleton 88
Umpqua River – Elkton 98
SF Coquille River –
Myrtle Point 85
Rogue River – Grants
Pass 101
Illinois River – Agness 92
www.nwrfc.noaa.gov/ws/
LOCATION APR – SEP
% NORM
Skagit River – Concrete 96
Stillaguamish River - Arlington 111
Snohomish River - Monroe 99
Cedar River – Renton 98
Cowlitz River – Castle Rock 97
Chehalis River – Porter 88
Dungeness River – Sequim 109
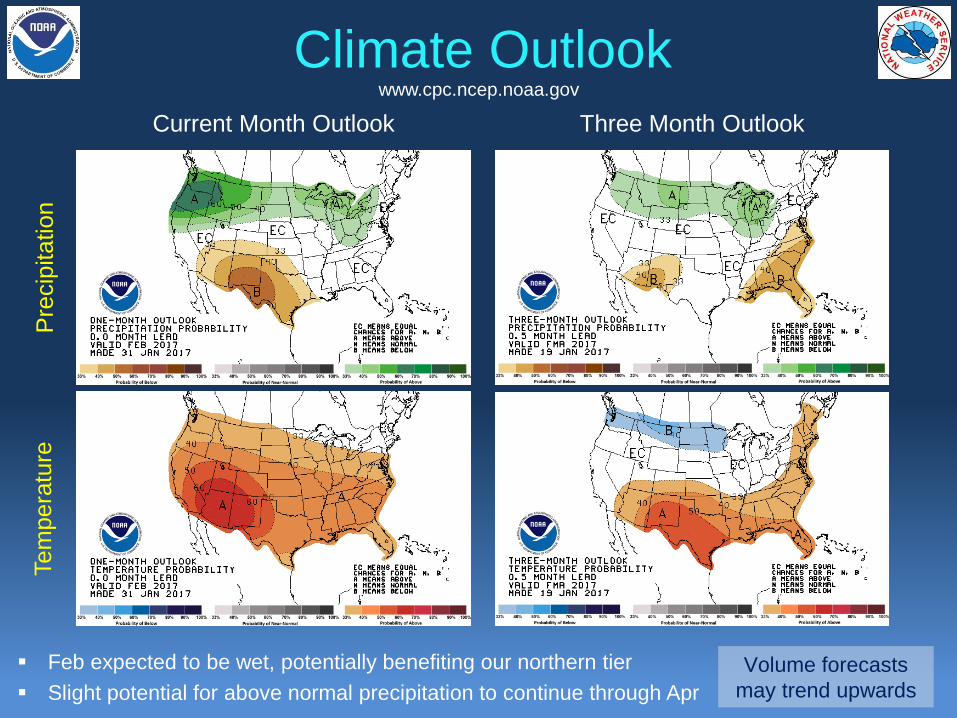
Current Month Outlook Three Month Outlook
Pre
cip
itation
Tem
pera
ture
Climate Outlook
www.cpc.ncep.noaa.gov
Feb expected to be wet, potentially benefiting our northern tier
Slight potential for above normal precipitation to continue through Apr
Volume forecasts
may trend upwards

Volume Forecast Products
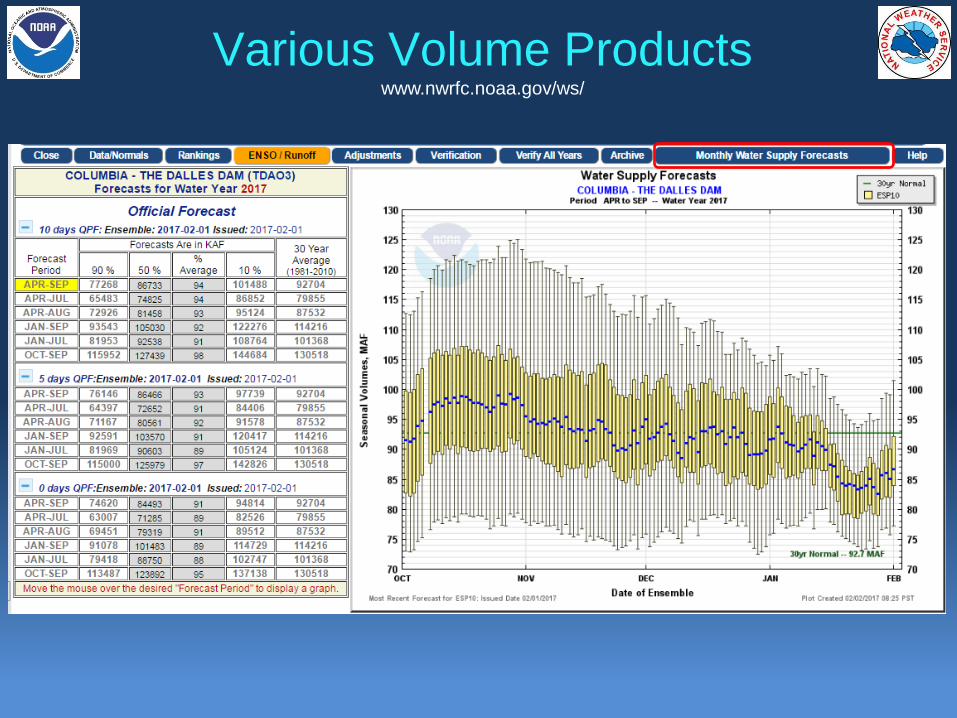
Various Volume Products www.nwrfc.noaa.gov/ws/
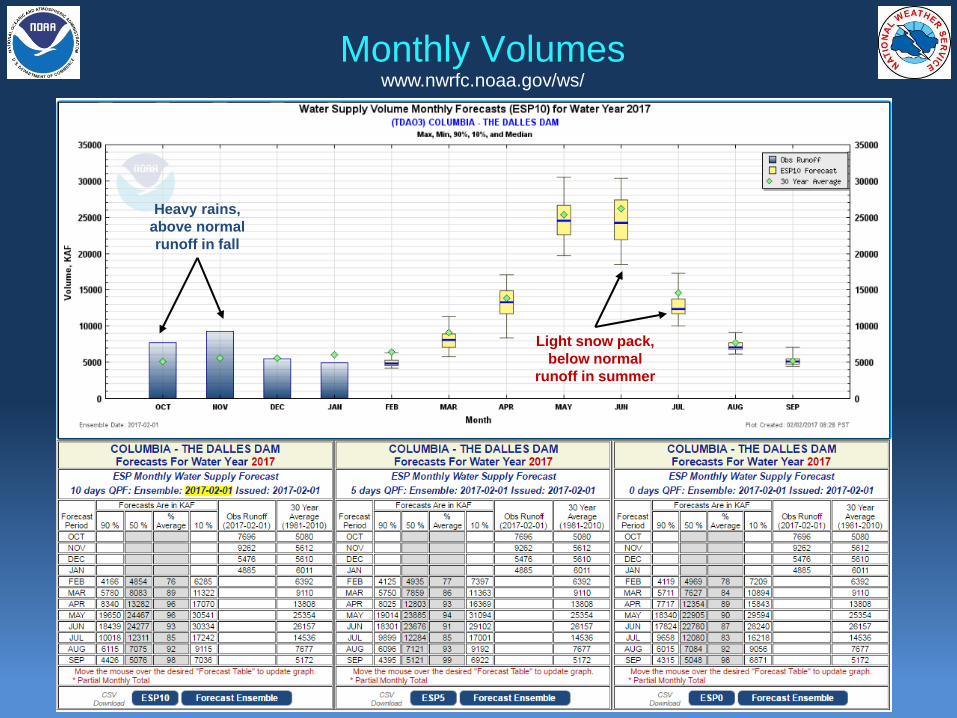
Monthly Volumes www.nwrfc.noaa.gov/ws/
Heavy rains,
above normal
runoff in fall
Light snow pack,
below normal
runoff in summer
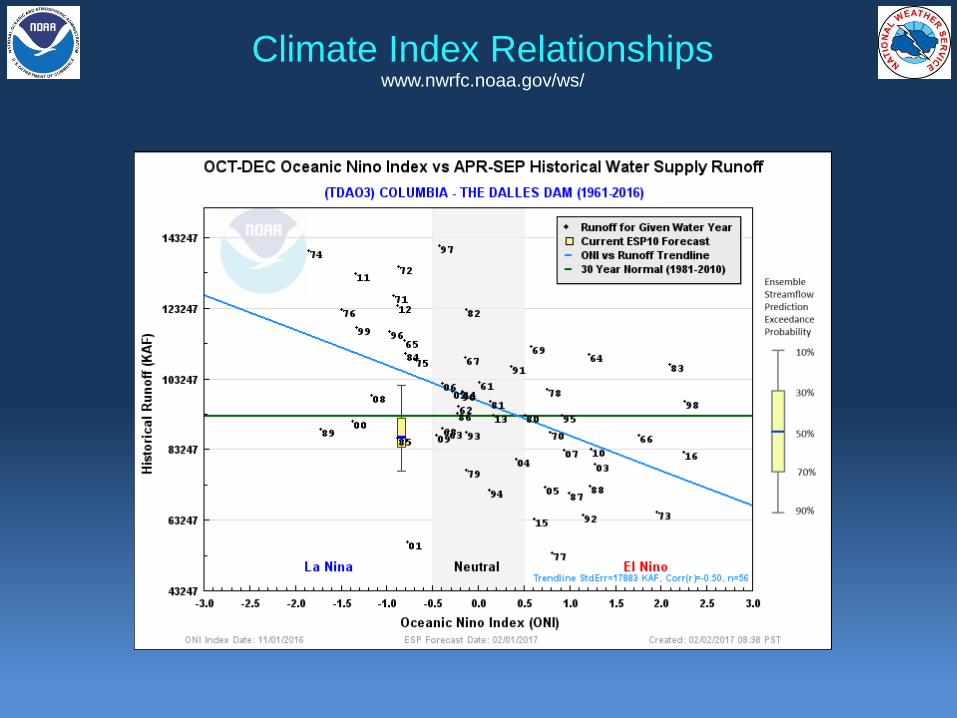
Climate Index Relationships www.nwrfc.noaa.gov/ws/
Heavy early
runoff
Light runoff
ahead
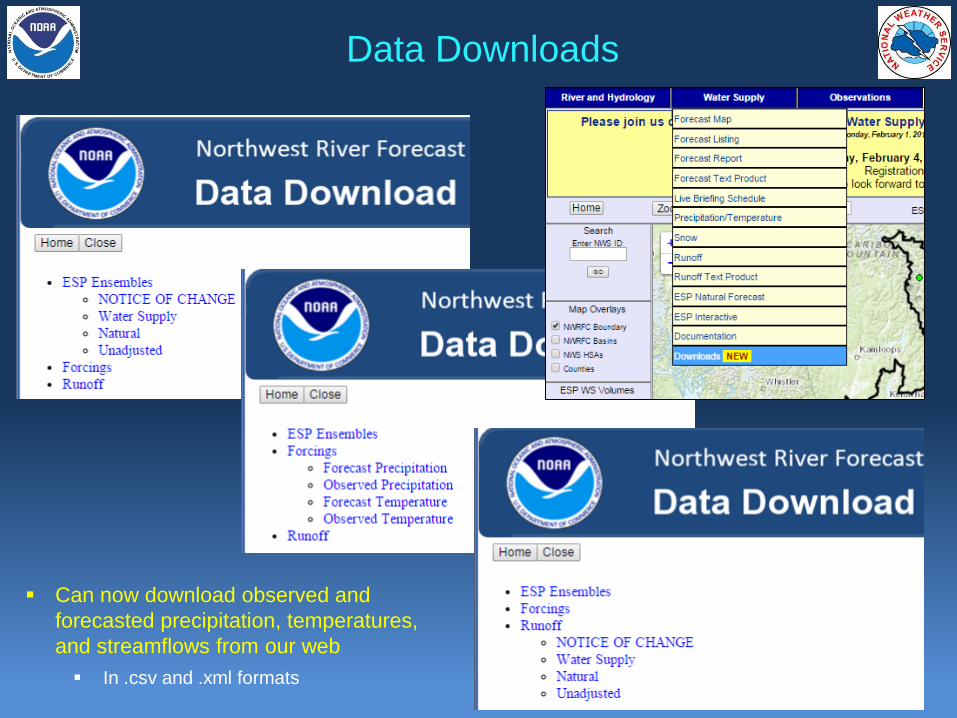
Data Downloads
Can now download observed and
forecasted precipitation, temperatures,
and streamflows from our web
In .csv and .xml formats
Questions?
Presentation available after brief at: www.nwrfc.noaa.gov/presentations/presentations.cgi
Kevin Berghoff, Taylor Dixon, NWRFC [email protected]
(503) 326-7291
Feb 2017 Water Supply Briefing National Weather Service, Northwest River Forecast Center