fc receptor-like 5 and anti-cd20 treatment response in
TRANSCRIPT

Fc receptor-like 5 and anti-CD20 treatment response ingranulomatosis with polyangiitis and microscopic polyangiitis
Kasia Owczarczyk, … , Paul Brunetta, Marco Prunotto
JCI Insight. 2020. https://doi.org/10.1172/jci.insight.136180.
In-Press Preview
Background: Baseline expression of FCRL5, a marker of naïve and memory B cells, was shown to predict response torituximab (RTX) in rheumatoid arthritis. This study investigated baseline expression of FCRL5 as a potential biomarker ofclinical response to RTX in granulomatosis with polyangiitis (GPA) and microscopic polyangiitis (MPA). Methods: Apreviously validated RT-qPCR-based platform was used to assess FCRL5 expression in patients with GPA/MPA (RAVEtrial, NCT00104299). Results: Baseline FCRL5 expression was significantly higher in patients achieving completeresponse (CR) at 6, 12, and 18 months, independent of other clinical and serological variables, among those randomizedto RTX but not CYC/AZA. Patients with baseline FCRL5 expression ≥ 0.01 expression units (termed FCRL5hi) exhibitedsignificantly higher CR rates at 6, 12, and 18 months as compared to FCRL5low subjects (84% vs 57% p=0.016, 68% vs40% p=0.02 and 68% vs 29% p=0.0009, respectively). Conclusion: Our data taken together suggest that FCRL5 is abiomarker of B cell lineage associated with increased achievement and maintenance of complete remission amongpatients treated with RTX and warrant further investigation in a prospective manner.
Clinical Medicine Clinical trials
Find the latest version:
https://jci.me/136180/pdf
Diagnostic advances
Fc receptor-like 5 and anti-CD20 treatment response in granulomatosis with polyangiitis and microscopic polyangiitis Kasia Owczarczyk1, Matthew D. Cascino2, Cecile Holweg2, Gaik W. Tew2, Ward Ortmann2, Timothy Behrens2, Thomas Schindler3, Carol A. Langford4, E. William St. Clair5, Peter A. Merkel6, Robert Spiera7, Philip Seo8, Cees G.M. Kallenberg9, Ulrich Specks10†, Noha Lim11†, John Stone12†, Paul Brunetta2*, ¥ and Marco Prunotto2,13*,# 1 Department of Cancer Imaging, King’s College London, London, United Kingdom 2 Genentech, South San Francisco, California, USA 3 Hoffmann – La Roche, Basel, Switzerland 4 Cleveland Clinic, Cleveland, OH, USA 5 Duke University Medical Center, Durham, NC, USA 6 University of Pennsylvania, Philadelphia, PA, USA 7 Hospital for Special Surgery, New York, NY, USA 8 Johns Hopkins University, Baltimore, MD, USA 9 University Medical Center Groningen, Groningen, The Netherlands 10 Mayo Clinic College of Medicine and Science, Rochester, MN, USA 11 Immune Tolerance Network, Seattle, WA, USA 12 Massachusetts General Hospital, Boston, MA, USA 13 School of Pharmaceutical Sciences, University of Geneva, Geneva, Switzerland
* Co-Senior authors ¥ now at Sana Biotechnology, South San Francisco, CA, USA
†on behalf of RAVE-ITN Research Group
#To whom correspondence should be addressed: Marco Prunotto, PhD School of Pharmaceutical Sciences, University of Geneva 30, quai Ernest-Ansermet CH-1211, Geneva Switzerland Tel: +41 22 379 42 55. E-mail: [email protected]
Role of funding source: The analysis for this study was funded by Genentech Inc.

2
Abstract
Background: Baseline expression of FCRL5, a marker of naïve and memory B cells, was shown to predict response to rituximab (RTX) in rheumatoid arthritis. This study investigated baseline expression of FCRL5 as a potential biomarker of clinical response to RTX in granulomatosis with polyangiitis (GPA) and microscopic polyangiitis (MPA). Methods: A previously validated RT-qPCR-based platform was used to assess FCRL5 expression in patients with GPA/MPA (RAVE trial, NCT00104299). Results: Baseline FCRL5 expression was significantly higher in patients achieving complete response (CR) at 6, 12, and 18 months, independent of other clinical and serological variables, among those randomized to RTX but not CYC/AZA. Patients with baseline FCRL5 expression ≥ 0.01 expression units (termed FCRL5hi) exhibited significantly higher CR rates at 6, 12, and 18 months as compared to FCRL5low subjects (84% vs 57% p=0.016, 68% vs 40% p=0.02 and 68% vs 29% p=0.0009, respectively). Conclusion: Our data taken together suggest that FCRL5 is a biomarker of B cell lineage associated with increased achievement and maintenance of complete remission among patients treated with RTX and warrant further investigation in a prospective manner.

3
Introduction
Granulomatosis with polyangiitis (GPA) and microscopic polyangiitis (MPA) are small-vessel vasculitides that are characterized by the presence of antineutrophil cytoplasmic autoantibodies (ANCA). These autoantibodies activate neutrophils and monocytes, resulting in damage to the vascular endothelium (1). B cell depletion through treatment with rituximab (RTX), an anti-CD20 monoclonal antibody, was shown to be non-inferior to a cyclophosphamide-azathioprine (CYC/AZA) regimen for the induction of remission in GPA/MPA in the RAVE trial (NCT00104299) (2). 64% of the patients in the RTX group, as compared with 53% of the patients in the CYC/AZA group, had complete remission at 6 months. At 12 and 18 months, 48% and 39%, respectively, of the patients in the RTX group had maintained complete remission, as compared with 39% and 33%, respectively, in the comparison (3).
The RAVE study also showed that patients with relapsing disease (versus a new diagnosis) and those who were proteinase 3 ANCA positive at baseline achieved complete response more frequently when treated with RTX compared to those patients without these characteristics. In contrast, there was no observed difference in response by treatment group among patients who were positive for anti-myeloperoxidase (MPO) ANCA (4). Interestingly, PR3–ANCA positivity and relapsing disease at presentation are variables associated with highest risk of relapse (3, 5).
In our previous work, we developed an RT-qPCR based platform to identify B cell lineage biomarkers of clinical response to RTX in rheumatoid arthritis (6). A subgroup of treated patients characterized by a combination of elevated baseline mRNA levels of IgJ (a marker for antibody secreting plasmablasts) and reduced levels of Fc receptor-like 5 (FCRL5), preferentially expressed on naïve and memory B cells, predicted non-response to RTX in inadequate responders to anti-TNF therapy.
FCRL5, also known as CD307, is encoded by the immunoglobulin superfamily receptor translocation-associated 2 (IRTA2) gene and was originally cloned from myeloma cell lines. FCRL5 contains nine extracellular Ig domains as well as two immunoreceptor tyrosine-based inhibitory motifs (ITIM) and one presumed immunoreceptor tyrosine-based activation motif (ITAM) in its cytoplasmic tail. Using a chimeric receptor containing the cytoplasmic tail of FCRL5, crosslinking FCRL5 and the BCR was shown to recruit SHP-1 to the two ITIM motifs of FCRL5, resulting in reduced BCR-induced calcium mobilization and protein tyrosine phosphorylation (7). FCRL5 binds intact IgG via a complex mechanism and therefore immune complexes may link FCRL5 to the BCR, potentially blocking B cell activation similarly to the inhibitory FcγRIIB or CD22 (8).
Intriguingly, FCRL5 was found to be overexpressed in tissue-like memory B cells based on microarray analysis (9, 10). FCRL5+ cells were found enriched on CD21−/lo/CD27+/IgM+ marginal zone–like B cells in hepatitis C virus–related mixed cyoglobulinemia vasculitis (HCV-MC) patients, but not in healthy donors (11) and feature t-bet expression and may be enriched during chronic antigenemia. Consistent with this, FCRL5 mRNA and cell surface protein expression required prolonged BCR stimulation and de novo protein synthesis (12). FCRL5 was also found

4
to be upregulated in circulating "atypical" memory B cells which are associated with exposure to Plasmodium falciparum and may represent dysfunctional or exhausted B cells with down-modulated BCR signaling and reduced capacity to produce antibody and to undergo recall responses (13).
We investigated FCRL5 expression levels in patients from the RAVE trial with the goal of determining whether FCRL5 mRNA expression at baseline could serve as a predictive biomarker for achieving complete remission.
Results
Baseline FCRL5 expression in responders versus non-responders
FCRL5 mRNA gene expression analysis was successfully carried out in 190 out of 197 study subjects and matched with clinical data in 188 subjects, 97 in the RTX arm and 91 in the CYC/AZA arm (Figure 1). Flow cytometry data was available for a subset of patients (n=168; 86 in RTX arm and 82 in CYC/AZA arm).
The proportion of patients achieving complete remission (CR) at 6 months in this patient cohort was 64% in the RTX arm versus 54% in the CYC/AZA arm, consistent with response rates observed in the RAVE trial population.
In the RTX arm, mean baseline FCRL5 level was significantly higher in patients who went on to achieve CR at 6 months as compared to these who did not (median 0.005 expression units (range 0.003-0.012) vs 0.004 (range 0.002-0.006); p=0.026) (Figure 2A). There was no difference in baseline FCRL5 expression in responders versus non-responders in the CYC/AZA arm.
Response rates to RTX at 6, 12 and 18 months in the FCRL5hi (FCRL5≥0.01) and FCRL5lo (FCRL5<0.01) subgroups
A threshold sensitivity analysis identified a threshold of 0.01 FCRL5 expression units to be most discriminatory CR at 6 months response to RTX. Application of this threshold resulted in a significant enrichment for responders in the FCRL5hi subgroup, in the RTX but not the CYC/AZA arm. In the RTX arm, baseline FCRL5 expression was associated with complete response at 6 months (FCRL5hi 84% vs. FCRL5lo 57%, p = 0.016) (Figure 2B). In contrast, there was no difference in response in the CYC/AZA arm (FCRL5hi 48% vs. FCRL5lo 56%, p = 0.8). In both arms, FCRL5hi subgroup represented roughly 25% of patients (25/97 in the RTX arm and 22/92 in the CYC/AZA arm).
Similar associations were identified at 12 months in the RTX arm (FCRL5hi 68% vs. FCRL5lo 40%, p = 0.02); CYC/AZA arm FCRL5hi 29% vs. FCRL5lo 44%, not significant) (Figure 2C).

5
The rate of CR at 18 months in RTX arm was only 29% in the FCRL5lo subset (p=0.0009) and 47% in all patients. In the CYC/AZA arm, these percentage rates were 38% and 34%, respectively (Figure 2D). These results and a summary of FCRL5 levels by CR were shown in Table 1.
Examining the baseline characteristics between FCRL5hi vs. FCRL5lo patients, we observed a significantly lower proportion of FCRL5hi patients were GPA (65%) and PR3+ (52%) as compared to FCRL5lo where 81% and 73% of patients were GPA (p=0.03) and PR3+ (p=0.01), respectively (Table 2). Such trends were not observed in CYC/AZA patients stratified by FCRL5 and CR (Table S1). Interestingly, a significantly lower proportion of RTX FCRL5hi patients who achieved complete remission were PR3+ (48%) as compared to 78% in FCRL5lo subgroup (Table S2). No other differences were observed.
Association of FCRL5 expression with peripheral B cell subtypes
At baseline, FCRL5 expression was positively correlated with the frequency of CD19+ cells (Spearman’s ρ = 0.46), specifically with the frequency of activated naïve B cells (CD19+CD27-CD86+; Spearman’s ρ = 0.47 and CD19+CD27-HLA-DR+ Spearman’s ρ = 0.47, respectively). There were no significant correlations with baseline CD20+ B cells, non-activated and CD95 expressing memory cells, plasma or GC founder cells. No correlation was observed with any of the T or myeloid cell populations.
In a random forest model, activated naïve and memory B cell subsets were the most important predictors of FCRL5 expression at baseline (CD19+CD27-HLA-DR % Mean Squared Error (MSE) 8.15; CD19+CD27-CD86+ 6.63; IGD+CD27+CD19+IGM+ 6.23; CD19+HLA-DR+ 5.84 and CD19+CD38-IgD+CD23+ 5.51, respectively) (Table 3).
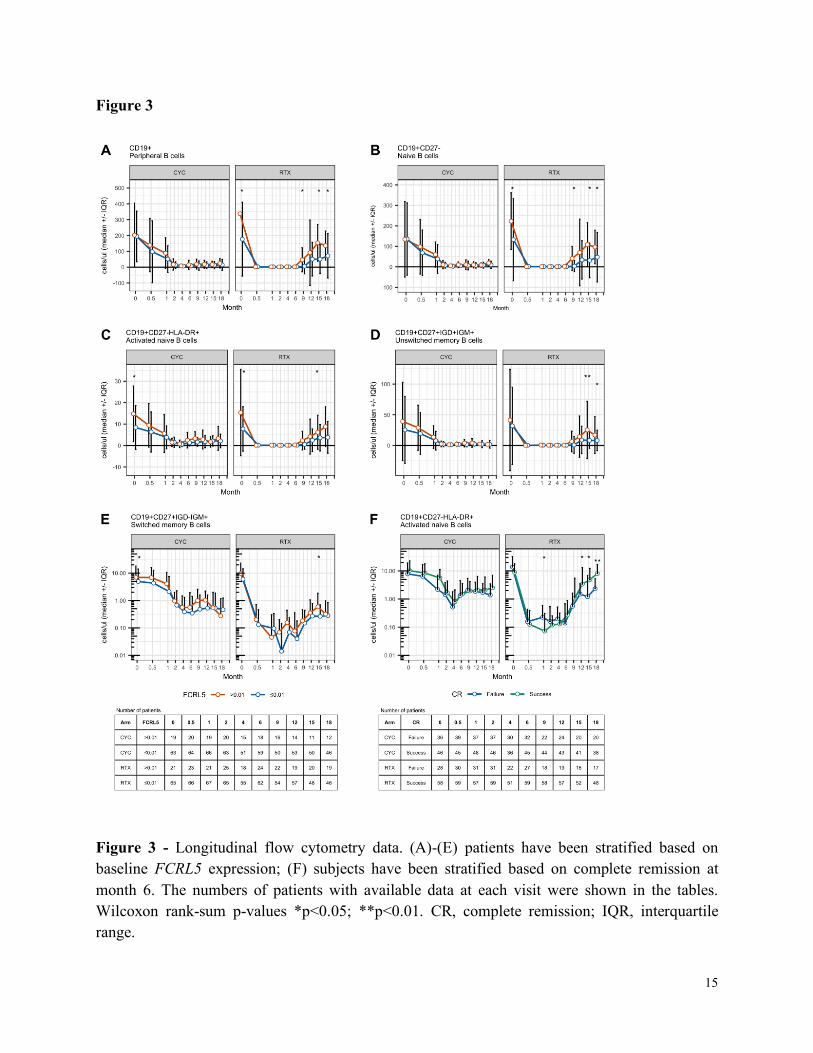
The effect of induction treatment on peripheral blood B cell subsets was similar in both treatment groups regardless of baseline FCRL5 status (Figure 3). During the follow-up period after induction, particularly in the RTX group, many of the examined B cell subsets repopulated more rapidly among FCRL5hi patients compared with FCRL5lo patients. The difference in median values achieved statistical significance at several time points after month 6. When treated with RTX but not CYC/AZA, FCRL5hi subjects repopulated with significantly higher CD19+ counts (Figure 3A), naïve B cells (CD19+CD27-) (Figure 3B), activated naïve B cells (CD19+CD27-HLA-DR+) (Figure 3C), non-switched memory B cells (Figure 3D) and switched memory B cells (Figure 3E).
Of note, RTX subjects who failed to achieve CR at 6 months had higher activated naïve B cells at the 1-month time point (Figure 3F). There was no difference in the percentage of the CD19+ B cells or the aforementioned B cell subsets throughout the induction period between patients who achieved or failed to achieve CR at 6 months in either the RTX or CYC/AZA arms (not shown).
Univariate and multivariate analysis adjusting for clinical and serological parameters

6
In univariate logistic regression analysis, FCRL5 expression was significantly associated with CR at 18 months in the RTX arm (p=0.016), and there was a trend toward achieving CR at 6 and 12 months. This trend at 6 months became significant in the multivariate analysis after adjusting for PR3-ANCA status, new onset versus relapsing disease status, and baseline BVAS/WG score (Table 4).
We found an association between log-transformed FCRL5 as a continuous variable and achievement of CR at months 6 and 18. This implies direct correlation of response with FCRL5 expression level, with an increase in FCRL5 throughout the range of baseline values being associated with an increasing probability of CR in the RTX group. In contrast, there was no association between CR achievement and FCRL5 levels in the CYC/AZA arm at any FCRL5 level. There was sufficient separation between the RTX and CYC/AZA curves at the highest FCRL5 levels to suggest a treatment benefit of RTX over CYC/AZA in this population. This effect nearly reaches statistical significance with respect to the primary endpoint (CR at 6 months; p=0.087) despite being significantly underpowered for the analysis.
Discussion
ANCA-associated vasculitis is a rare and life threatening autoimmune disease associated with B cell hyperactivity, the presence of autoantibodies, and elevated BAFF levels (14), suggesting that B cells play a critical role in the pathogenesis of this disease. Recent trials have begun to identify targeted immunotherapies that represent new options compared to conventional cyclophosphamide (2). PR3-ANCA positive and relapsing disease subgroups of patients in RAVE appear to receive greater benefit from RTX compared to CYC/AZA, providing clinicians with information that might impact therapeutic choices. Our analysis is important because it demonstrates that a baseline B-cell marker in GPA and MPA is associated with increased achievement of complete remission among patients treated with RTX and may be associated with a prolonged duration of clinical remission following a single cycle of RTX therapy. In RAVE, patients who achieved complete remission off glucocorticoids at 6 months in the RTX arm had significantly higher baseline FCRL5 expression. FCRL5 expression at baseline seems to predict complete remission at 6, 12, and 18 months in patients treated with RTX but not those treated with CYC/AZA. Furthermore, FCRL5 expression appears to have a predictive value independent of other response predictive factors such as type of vasculitis, serology or presence of relapsed disease in a multivariate analysis. While both RTX and CYC/AZA are peripheral blood B cell depleting agents, our paper’s findings may relate to the greater depletion of CD20+ B cells seen with rituximab. Baseline FCRL5 expression in the peripheral blood of patients with GPA or MPA is correlated with the frequency of memory B cells, specifically non-switched IgD+IgM+ B cells, and to a lesser extent naïve B

7
cells. Although FCRL5 was reported to be associated with switched memory B cells in health individuals (9), we observed only a weak correlation between FCRL5 and switched IgD-IgM+ B cells in this study, potentially due to the differences in the population of the subjects, or the possibility that FCRL5 was enriched only in CD27- atypical memory B cells which were not quantified in this study. Despite higher total naïve and memory B cell numbers at baseline, RTX FCRL5high patients had similar extent of B cell depletion during the induction period compared to FCRL5low patients. The significance of B cells repletion in FCRL5high patients at later time points will require further investigation to understand the potential impact on relapse or PR3-ANCA status. This analysis has several strengths. It represents an unbiased selection of available samples from the RAVE study, one of the largest, extensively-sampled, blinded placebo controlled interventional trials in GPA or MPA. The proportion of FCRL5high patients is approximately 25% of the baseline cohort in RAVE, making these findings relevant to a sub-fraction of patients. Taken together, these results are an intriguing step in the direction of precision medicine for these patients, but are purely hypothesis generating. These findings should be replicated in additional studies of anti-CD20 agents or cyclophosphamide in the treatment of these severely ill patients in need of complete remission. One weakness of our analysis is that the sampling used for it was incomplete, and missing samples could have skewed or altered the analysis in an unknown manner. However, the number of unavailable samples was low (5%), and the trial outcomes of the subset included in our analysis mirrored that of the entire cohort. Another limitation of the study is that we do not have direct confirmation of FCRL5 surface expression on B cells. It would be important for future studies to develop correlations between mRNA levels and surface expression in similar cohorts of clinically active GPA and MPA patients. A third weakness of the analysis is that further combinations of potentially predictive biomarkers such as B cell depletion status or ANCA status (3) were not evaluated together. Other groups have evaluated a Granularity Index from the RAVE publicly available database (15). Our analysis introduces a new and biologically relevant biomarker for consideration. In conclusion, there is increasing interest in the identification of novel response biomarkers in ANCA associated vasculitis (15) that might aid therapeutic selection as new choices are made available to patients. RAVE is a NIAID sponsored, Immune Tolerance Network supported open-source database that is available to a global community of researchers interested in these diseases. Truly useful biomarkers in many immunologic diseases are relatively rare. Our study findings of a subset of participants with higher baseline FCRL5 expression could identify a subgroup of patients that may achieve a sustained benefit of rituximab compared to CYC.

8
Materials and Methods
Study design
The RAVE trial (NCT00104299) was a multi-center, randomized, double-blind non-inferiority trial, that compared rituximab (RTX) administered at a dose of 375 mg per square meter of body-surface area once a week for 4 weeks followed by placebo with cyclophosphamide (CYC) administered at a dose of 2mg/kg for 3 to 6 months followed by azathioprine (AZA) at a dose of 2mg/kg for 12 to 15 months for a total of 18 months of therapy. It enrolled antineutrophil cytoplasmic antibody (ANCA)-positive patients with granulomatosis with polyangiitis (GPA) and microscopic polyangiitis (MPA) who met criteria for severe disease (Birmingham Vasculitis Activity Score for Wegener’s Granulomatosis [BVAS/WG] >3). Patients were randomly assigned in a 1:1 fashion to either RTX or CYC followed by azathioprine (AZA). Details of the RAVE trial design have been published elsewhere (2).
Clinical assessments and outcome measures
Study visits occurred weekly over the first four weeks of therapy, followed by visits at months 2, 4, and 6. Disease activity was assessed using the BVAS/WG instrument (16). The primary outcome measure for this study was complete remission at 6 months ([BVAS/WG] of 0 with a glucocorticoid dose of 0 which was the primary endpoint in the original RAVE study analysis (2)). Secondary endpoints included remission maintained through 12 and 18 months.
Sample collection and gene expression analysis.
Whole blood sample collection for gene expression analysis occurred at screening (visit 1) according to the trial protocol (17).
The samples were stored at the Immune Tolerance Network core facility and transferred to Genentech for analysis. The methodology of mRNA gene expression analysis of candidate B cell markers has been previously published (6).
In brief, RNA was extracted from whole blood using PAXgeneTM blood RNA kits (Qiagen Inc, Valencia, CA) according to manufacturer’s protocol. The amount and quality of RNA extracted were assessed using both NanoDrop (ThermoFisher Scientific, Waltham, MA) and Agilent 2100 Bioanalyzer (Agilent Technologies Inc, Santa Clara, CA) technologies, respectively.
Real Time-Quantitative Polymerase Chain Reaction (RT-qPCR) was performed using the ABI 7900HT instrument (Applied Biosystems, Foster City, CA). We used a commercially available, inventoried ABI assay encoding FCRL5 splice variant – FCRL5/IRTA2C (Hs01070204_m1) (Applied Biosystems, Foster City, CA) shown in preliminary experiments to be expressed predominantly on naïve and mature B cells, as opposed to IRTA2A and IRTA2B which are
9
expressed predominantly in bone marrow plasma cells. Expression of each gene was measured in duplicate in each experiment, and the average of the replicates was normalized to human housekeeping gene GAPDH (Hs99999905_m1) (Applied Biosystems, Foster City, CA) to generate a delta Ct (ΔCt) value for each gene. Data was analyzed using BioMark Gene Expression Data Analysis software (Fluidigm Corporation, South San Francisco, CA) to obtain Ct values. Expression data was then calculated as relative abundance, using the formula 2-ΔCt.
Flow cytometry data
Flow cytometry data was provided by the Immune Tolerance Network (ITN)-RAVE Group. This dataset is available for download from the Immunology Database and Analysis ITN Portal and TrialShare public repositories.
Flow cytometry analysis was carried out at pre-defined time points in the RAVE trial – at screening, at week 2 as well as months 1, 2, 4, 6, 9, 12, 15 and 18 following enrollment and was carried out using standardized protocols described in detail elsewhere (15).
Statistical analysis
The Biostatistics Team from the study sponsor (NIAID) provided raw, de-identified, individual level patient data. These datasets are accessible to readers through TrialShare, a publicly accessible website developed and managed by the Immune Tolerance Network (ITN). Selected clinical data was transferred from clinical trial databases into a customized Valicert database designed to facilitate analysis. Data analysis was performed using JMP (SAS, Cary, NC), GraphPad Prism (GraphPad, La Jolla, CA) and R statistical package (version 3.5.3) (www.R-project.org).
Differences in baseline FCRL5 expression between responders vs. non-responders (expressed as complete remission (CR) at 6, 12 and 18 months) in the RTX and CYC/AZA arms with respect to the linearly transformed values were measured using the nonparametric Wilcoxon rank-sum test.
A threshold sensitivity method described elsewhere (6) was applied to baseline RNA samples in order to identify FCRL5 biomarker threshold that enriched for control arm corrected CR (at 6 months) response to RTX. This threshold once established was then used in binary comparisons to compare outcomes in patients termed FCRL5low and FCRL5high respectively. Differences in baseline variables (demographic, clinical, serological and molecular data) as well as in the proportion of patients achieving complete remission at 6, 12 and 18 months for the FCRL5low and FCRL5high patient subsets were calculated, and nominal P-values determined. Continuous variables were compared using the Wilcoxon rank-sum test. For categorical variables, two separate contingency tables, one for the experimental arm (RTX) and one for the control arm (CYC/AZA), were created to compare the proportion of responders in the FCRL5low and FCRL5high subsets, and p-values were calculated using Fisher's exact test.

10
Spearman’s rank correlation (ρ) was used as a nonparametric test of association between flow cytometry cell populations at the screening visit and baseline FCRL5 expression
To identify flow cytometry populations that were independently correlated with FCRL5 expression, a random forest decision tree algorithm was used to rank variables based on their predictive importance (expressed as proportion of Mean Squared Error (%MSE)).
Differences in Fluorescence-activated cell sorting (FACS) populations between FCRL5 subgroups (high ≥0.01 versus low <0.01) at each time point were compared using Wilcoxon rank-sum test.
Logistic regression was used to investigate the relationship between FCRL5 and other baseline clinical characteristics. In univariate analysis, each characteristic was considered individually in separate logistic regression models. For multivariate analysis, all characteristics were included in a single logistic regression model to see if effects remained after adjustment for other factors. Statistical significance threshold was set at p<0.05. No correction was applied to account for multiple testing.
Study approval The RAVE trial was approved by the institutional review board at each participating site. Written informed consent was obtained from all patients prior to inclusion in the study.

11
Acknowledgments
We acknowledge the contribution of the RAVE trial site-principal investigators as well as the Immune Tolerance Network (ITN). See Supplemental Acknowledgments for consortium details. Research specimens from the ITN021AI RAVE trial were provided by the ITN and sponsored by the National Institute of Allergy and Infectious Diseases of the National Institutes of Health under Award Number UM1AI109565. The content is solely the responsibility of the authors and does not necessarily represent the official views of the National Institutes of Health, the NIHR or the Department of Health.
Author contributions
K.O., G.W.T., M.P., P.B. have written and edited the manuscript. T.S., M.C., W.O., T.B., C.H., C.A.L., G.W.T have generated and analyzed the data contained in the present manuscript. J.S. and U.S. have contributed critical thinking and revision of the manuscript. P.M, M.D.C and C.H reviewed the manuscript and provided comments.

12
References: 1. Jennette JC, and Falk RJ. Pathogenesis of antineutrophil cytoplasmic autoantibody-mediated disease. Nat
Rev Rheumatol. 2014;10(8):463-73. 2. Stone JH, Merkel PA, Spiera R, Seo P, Langford CA, Hoffman GS, et al. Rituximab versus
cyclophosphamide for ANCA-associated vasculitis. N Engl J Med. 2010;363(3):221-32. 3. Specks U, Merkel PA, Seo P, Spiera R, Langford CA, Hoffman GS, et al. Efficacy of remission-induction
regimens for ANCA-associated vasculitis. N Engl J Med. 2013;369(5):417-27. 4. Unizony S, Villarreal M, Miloslavsky EM, Lu N, Merkel PA, Spiera R, et al. Clinical outcomes of
treatment of anti-neutrophil cytoplasmic antibody (ANCA)-associated vasculitis based on ANCA type. Ann Rheum Dis. 2016;75(6):1166-9.
5. Hogan SL, Falk RJ, Chin H, Cai J, Jennette CE, Jennette JC, et al. Predictors of relapse and treatment resistance in antineutrophil cytoplasmic antibody-associated small-vessel vasculitis. Ann Intern Med. 2005;143(9):621-31.
6. Owczarczyk K, Lal P, Abbas AR, Wolslegel K, Holweg CT, Dummer W, et al. A plasmablast biomarker for nonresponse to antibody therapy to CD20 in rheumatoid arthritis. Sci Transl Med. 2011;3(101):101ra92.
7. Haga CL, Ehrhardt GR, Boohaker RJ, Davis RS, and Cooper MD. Fc receptor-like 5 inhibits B cell activation via SHP-1 tyrosine phosphatase recruitment. Proc Natl Acad Sci U S A. 2007;104(23):9770-5.
8. Franco A, Damdinsuren B, Ise T, Dement-Brown J, Li H, Nagata S, et al. Human Fc receptor-like 5 binds intact IgG via mechanisms distinct from those of Fc receptors. J Immunol. 2013;190(11):5739-46.
9. Li H, Borrego F, Nagata S, and Tolnay M. Fc Receptor-like 5 Expression Distinguishes Two Distinct Subsets of Human Circulating Tissue-like Memory B Cells. J Immunol. 2016;196(10):4064-74.
10. Chang LY, Li Y, and Kaplan DE. Hepatitis C viraemia reversibly maintains subset of antigen-specific T-bet+ tissue-like memory B cells. J Viral Hepat. 2017;24(5):389-96.
11. Terrier B, Nagata S, Ise T, Rosenzwajg M, Pastan I, Klatzmann D, et al. CD21(-/low) marginal zone B cells highly express Fc receptor-like 5 protein and are killed by anti-Fc receptor-like 5 immunotoxins in hepatitis C virus-associated mixed cryoglobulinemia vasculitis. Arthritis Rheumatol. 2014;66(2):433-43.
12. Damdinsuren B, Dement-Brown J, Li H, and Tolnay M. B cell receptor induced Fc receptor-like 5 expression is mediated by multiple signaling pathways converging on NF-kappaB and NFAT. Mol Immunol. 2016;73:112-21.
13. Sullivan RT, Kim CC, Fontana MF, Feeney ME, Jagannathan P, Boyle MJ, et al. FCRL5 Delineates Functionally Impaired Memory B Cells Associated with Plasmodium falciparum Exposure. PLoS Pathog. 2015;11(5):e1004894.
14. Krumbholz M, Specks U, Wick M, Kalled SL, Jenne D, and Meinl E. BAFF is elevated in serum of patients with Wegener's granulomatosis. J Autoimmun. 2005;25(4):298-302.
15. Nasrallah M, Pouliot Y, Hartmann B, Dunn P, Thomson E, Wiser J, et al. Reanalysis of the Rituximab in ANCA-Associated Vasculitis trial identifies granulocyte subsets as a novel early marker of successful treatment. Arthritis Res Ther. 2015;17:262.
16. Stone JH, Hoffman GS, Merkel PA, Min YI, Uhlfelder ML, Hellmann DB, et al. A disease-specific activity index for Wegener's granulomatosis: modification of the Birmingham Vasculitis Activity Score. International Network for the Study of the Systemic Vasculitides (INSSYS). Arthritis and rheumatism. 2001;44(4):912-20.

13
Figures
Figure 1
Figure 1 - Sample processing flowchart

14
Figure 2
Figure 2 - Validation of FCRL5 mRNA gene expression biomarker in patients in the RAVE trial. (A) Baseline FCRL5 mRNA levels assayed by RT-qPCR in whole blood were compared in patients who achieved and failed to achieve complete remission at 6 months in both the RTX (n=62 and n=35, respectively) and the CYC arm (n=49 and n=42, respectively). Median and interquartile range shown as boxplot. Identified biomarker threshold (FCRL5≥0.01 versus FCRL5<0.01) was tested in baseline mRNA samples from patients in the RAVE trial as a predictor of complete remission at (B) 6 months, (C) 12 months, and (D) 18 months, in subjects treated with RTX (blue bars) versus CYC (red bars). The number on the top of the bars in (B – D) denotes percentage remission rate in each subgroup, the number in brackets refers to the total number of subjects in each respective subgroup whereas the number above it refers to the number of remitters. Wilcoxon rank-sum p-value and Fisher’s exact p-values shown in (A) and (B – D) respectively.
15
Figure 3
Figure 3 - Longitudinal flow cytometry data. (A)-(E) patients have been stratified based on baseline FCRL5 expression; (F) subjects have been stratified based on complete remission at month 6. The numbers of patients with available data at each visit were shown in the tables. Wilcoxon rank-sum p-values *p<0.05; **p<0.01. CR, complete remission; IQR, interquartile range.

16
Table 1. FCRL5 levels at baseline in all patients and in patients achieving complete remission at 6, 12, and 18 months. Complete remission rates stratified by baseline FCRL5 biomarker status N % FCRL5
Median IQR p-value
<0.01 ≥0.01 p-value n % n %
Rituximab 97 51.6 0.005 0.003 – 0.01
0.43 72 74.2 25 25.7 0.74
Cyclophosphamide 91 48.4 0.006 0.003 – 0.09
70 76.9 21 23.1
Rituximab Achieved CR at 6 months
62 63.9 0.005 0.003 – 0.012
0.02 41 56.9 21 84 0.02
Not achieved 35 36.1 0.004 0.002 – 0.006
31 43.1 4 16
Cyclophosphamide Achieved CR at 6 months
49 53.8 0.006 0.003 – 0.011
0.71 39 55.7 10 47.6 0.80
Not achieved 42 46.2 0.006 0.004 – 0.009
31 44.3 11 52.3
Rituximab
Achieved CR at 12 months
46 47.4 0.005 0.004 – 0.013
0.02 29 40.3 17 68 0.02
Not achieved 51 52.6 0.004 0.002 – 0.008
43 59.7 8 32
Cyclophosphamide Achieved CR at 12 months
37 40.7 0.004 0.004 – 0.009
0.55 31 44.3 6 28.6 0.23
Not achieved 54 59.3 0.006 0.002 – 0.01
39 55.7 15 71.4
Rituximab
17
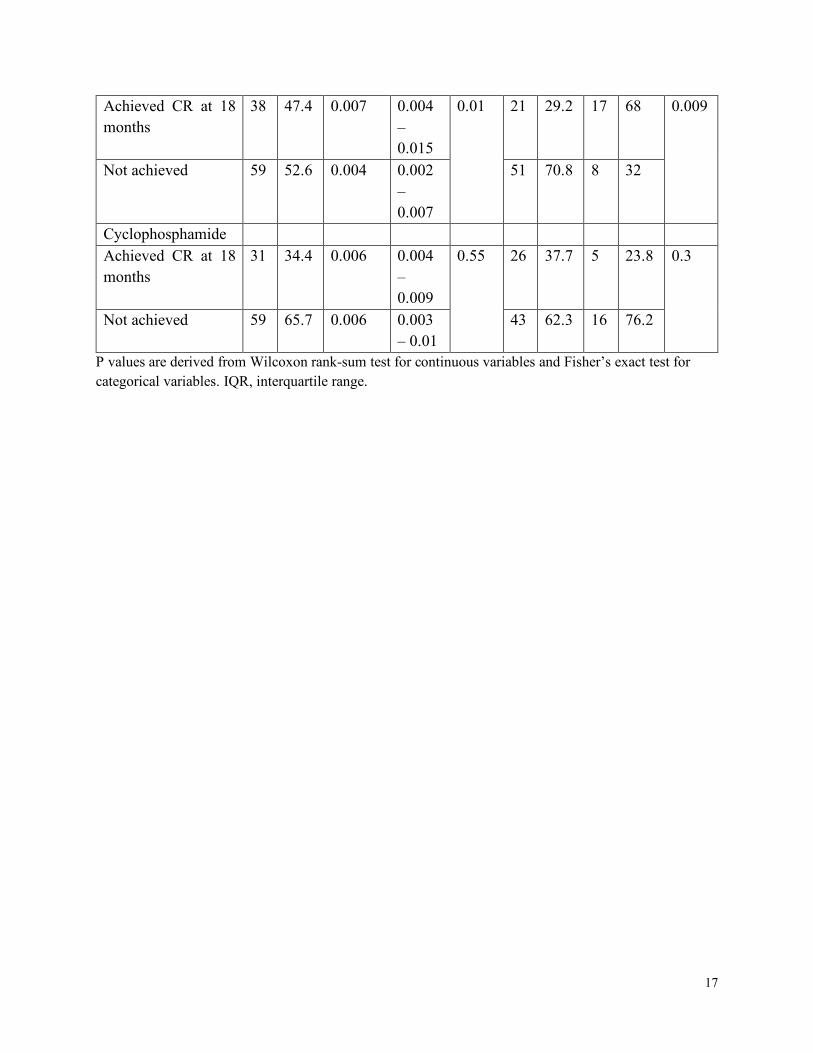
Achieved CR at 18 months
38 47.4 0.007 0.004 – 0.015
0.01 21 29.2 17 68 0.009
Not achieved 59 52.6 0.004 0.002 – 0.007
51 70.8 8 32
Cyclophosphamide Achieved CR at 18 months
31 34.4 0.006 0.004 – 0.009
0.55 26 37.7 5 23.8 0.3
Not achieved 59 65.7 0.006 0.003 – 0.01
43 62.3 16 76.2
P values are derived from Wilcoxon rank-sum test for continuous variables and Fisher’s exact test for categorical variables. IQR, interquartile range.

18
Table 2. Baseline demographics and clinical characteristics in FCRL5high versus FCRL5low patients.
Baseline characteristics FCRL5>0.01
(n=46)
FCRL5 ≤ 0.01
(n=142)
P value
Treatment RTX (%) 54 51 0.73
Sex (% female) 67 44 0.01
Age (median, years) 49.5 53.5 0.1
Vasculitis type: % MPA/ %GPA 33/65 19/81 0.03
ANCA type: %MPO+/%PR3+ 48/52 27/73 0.01
% Newly diagnosed 50 47 0.8
% Alveolar hemorrhage 20 29 0.2
Baseline BVAS/WG (median) 8.0 8.0 0.8
Baseline WBC (median, 109 cells/l)
10.000 9.000 0.3
Baseline CD19+ cells (median, cells/ul)
217 201 0.3
P values are derived from Wilcoxon rank-sum test for continuous variables and Fisher’s exact test for categorical variables.

19
Table 3. Effect of B cell subset populations on FCRL5 expression Cell population Description %incMSE CD19+CD27-HLA-DR Activated Naive B cells (HLA-DR) 8.152 CD19+CD27-CD86+ Activated Naive B cells (CD86) 6.628 IGD+CD27+CD19+IGM+ Memory B cells (IgD+ IgM+) 6.225 CD19+HLA-DR+ Activated B cells (HLA-DR) 5.840 CD19+CD38-IgD+CD23+ Bm2 Naive B cells 5.506 CD77-IGD-CD38-CD19+CD23- Bm5 Memory B cells (CD77- CD23-) 5.221 CD27-CD19+ Naive B cells 5.206 CD27+CD19+ Memory B cells 5.009 CD20+ B cells (CD20) 4.918 CD19+ B cells (CD19) 4.896 CD19+CD80+ Activated B cells (CD80) 4.427 CD44+IGD-CD38-CD19+CD10- Bm5 Memory B cells (CD44+, CD10-) 4.274 CD19+CD27-CD80+CD86+ Activated Naive B cells (CD80, CD86) 3.983 CD8-CD69+CD4+CD3+ Activated CD4 T cells (CD69) 3.925 CD19+CD86+ Activated B cells (CD86) 3.525
Random Forest model examining the effect of different B cell subset populations on baseline FCRL5 expression in patients with available flow cytometry data (n=168). Percent increase in Mean Squared Error (%incMSE) is a robust measure of variable importance; the higher the number, the greater a variable’s importance. Other B cells subsets with %incMSE less than 3.525 were not listed in the table.

20
Table 4. Logistic regression analysis of log-transformed FCRL5 predicting complete remission (CR) at Months 6, 12, 18 in Rituxan arm. Adjusted models include terms for PR3 status, new diagnosis vs. relapsing disease, and baseline BVAS/WG score.
Outcome variable
Unadjusted
Odd Ratio
P value Adjusted
Odd Ratio
P value
CR at 6 months 1.47 0.075 1.59 0.049
CR at 12 months 1.46 0.079 1.51 0.067
CR at 18 months 1.76 0.016 1.74 0.023