factors affecting glomerular function in …jeb.biologists.org/content/jexbio/73/1/261.full.pdf ·...
TRANSCRIPT

J. exp. Biol. (1978), 73, 261-277 2 6 lWith 6 figures
Printed in Great Britain
FACTORS AFFECTING GLOMERULAR FUNCTIONIN THE PACIFIC HAGFISH EPTATRETUS STOUTI
(LOCKINGTON)
BY J. A. RIEGEL(Westfield College, London, NW3 7ST
(Received i^July 1977)
SUMMARY
Single glomerulus filtration rate in Eptatretus stouti averaged 20-3 + 2-13(S.E.M.) nl min"1. Single glomerulus glomerular filtration rate (GFR) couldbe correlated with arterial pressure when arterial pressure exceeded about4 cm H2O. Glomerular filtration was affected by postglomerular resistancebrought about by alteration of the volume of urinary spaces. Filtration un-doubtedly plays a role in glomerular function. However, average colloidosmotic pressure (COP) of the plasma is almost double the average hydro-static pressure in the segmental arteries serving the glomeruli. The COP ofglomerular fluid is essentially nil, therefore it is difficult to see how pressurefiltration alone can account for primary urine formation.
When single glomeruli were perfused with colloid-containing Ringer atpressures within the normal range of blood pressures, GFR was within thenormal range. GFR was related inversely to the colloid osmotic pressure ofthe perfusion Ringer. Colloid entered the urine during perfusion. However,in only a few instances did this result in conditions favourable to pressurefiltration.
To assess the role of active processes in glomerular filtration, chemicalinhibitors were added to the perfusion Ringer. Amiloride, acetazolamide,cyanide, 2-deoxy-D-glucose, iodoacetate and ethacrynic acid were withoutmarked effect on glomerular filtration. Ouabain and dinitrophenol markedlyreduced GFR; inhibition was probably not due to indirect effects upon therenal vasculature.
INTRODUCTION
The hagfish mesonephric kidney consists of but two epithelial elements of thevertebrate pattern: segmentally arranged renal corpuscles which empty via short necksegments into a larger ureter. The renal corpuscles are very similar to those of othervertebrates (Heath-Eves & McMillan, 1974; Kiihn, Stolte & Reale, 1975). Theepithelium of the ureter wall consists of cords of columnar cells between which arebunched cuboidal cells (Conel, 1917; Ericsson, 1967; Heath-Eves & McMillan, 1974).The columnar cells bear a superficial resemblance to cells of the proximal tubule ofother vertebrates. Analyses of urine collected from the ureter suggest that secretionand reabsorption of ions occurs (Munz & McFarland, 1964; Rail & Burger, 1967;Mclnerey, 1974) as does reabsorption of glucose (Eisenbach et al. 1971). However,some functions assigned to the proximal tubule appear not to occur. Phenol red is not

262 J. A. RlEGEL
concentrated (Fange & Krog, 1963; Rail & Burger, 1967). Furthermore, inulin is notconcentrated by the kidney, so apparently no water reabsorption occurs duringelaboration of the urine (Munz & McFarland, 1964; Rail & Burger, 1967).
MATERIALS AND METHODS
The studies reported here were made on the Pacific hagfish Epatretus stouti carriedout at the Hopkins Marine Station of Stanford University in Pacific Grove, California,U.S.A. Animals were trapped in Monterey Bay adjacent to the marine station. Theywere kept, unfed, in a shaded concrete tank through which circulated chilled(6-10 °C) sea water. A fresh stock of animals was trapped at about bimonthly intervals.All experiments were carried out at temperatures between 6 and 8 °C.
Measurements of urine flow
A hagfish was weighed and placed in 11 of chilled sea water to which a small amountof MS 222 (Sandoz, Basel, Switzerland) was added. After relaxation was complete,the body cavity was exposed by a ventral midline incision. The animal was placeddorsal side down in a V-shaped perspex trough which had been immersed previouslyin a sea water-filled, temperature-controlled bath. An amount of MS 222 was addedto the bath sufficient to sustain relaxation for several hours.
Whilst observing with a stereomicroscope mounted over the bath, connective tissueand fat bodies overlying a short section of the kidney were removed. A catheter wastied into the ureter adjacent to the glomerulus chosen for study. Catheters were madefrom polythene tubing pulled in a microflame to an average internal diameter ofabout 0-5 mm. Where urine flow was to be measured by collection of urine formed overa timed period, short lengths of catheter partially filled with liquid paraffin were tiedinto the ureter. Urine was collected from the catheter by inserting a micropipettethrough the liquid-paraffin seal. Urine droplets were deposited under liquid paraffinon the waxed surface of a Petri dish resting on the stage of a stereomicroscope. Thevolume of the urine droplets was estimated from measurements of their diametermade at x 40 to x 80 with an ocular graticule.
The foregoing procedure created variable backpressure in the ureter. In some studiesit was desired either to study or to minimize the effects of ureter backpressure on GFR.In these studies the catheter was connected to a reservoir and pressure transducerwhich were filled with liquid paraffin. Urine volume was estimated from measure-ments of fluid advance in the catheter made at x 40 with an ocular graticule. Strandsof ligature ca. 5 /im in diameter tied around the catheter at intervals of 3-5 mmprovided fixed points of reference for lining up the ocular graticule and catheter.
Estimations of ion concentrations and colloid osmotic pressure
Urine was collected as described above. Blood was collected from the caudalsubdermal sinus (Germain & Gagnon, 1968). About 2 ml of blood was mixed rapidlywith dry heparin in a prechilled centrifuge tube to a final concentration of ca.500 i.u./ml (Fange & Gidholm, 1973). Blood was centrifuged for 10 min at o °C andca. 2000 rev/min. To obtain plasma samples from animals upon whom experimentshad been performed, blood was collected by puncture of the dorsal aorta withcentrifugible pipettes (Riegel, 1968).
Glomerular function in the Pacific hag fish 263
Colloid osmotic pressure of urine and plasma samples was measured using a com-parative method devised for use on small samples of fluid. The details of this methodwill be published elsewhere, but a brief description follows. A small disc of Millipore'Pellicon' ultrafiltration membrane (25 000/45 000 mol. wt cutoff) was wetted withhagfish Ringer in its centre, and on one side was deposited a drop (2-5 /i\) of standardcolloid solution. The disc was fixed in place in the liquid-paraffin bath of an apparatuswhich allowed the upper surface of the disc to be observed from the side at a mag-nification of about x 100. Droplets of standard colloid solutions, plasma and urine,10-20 nl in volume, were deposited, one at a time, on the upper surface of the disc.Using a calibrated graticule in the eyepiece of the viewing microscope, the rate ofshrinkage of each of the droplets was measured over a short interval (usually 3-5 min.).The COP of unknown droplets was obtained by interpolation from a standard curveconstructed using the shrinkage rates of droplets of standard colloid. The methodappears to be accurate only to about 2 cm H2O, but that accuracy is sufficient for thepresent purpose.
Analyses of ions in plasma and urine were made with a Perkin Elmer heated graphiteatomizer (HGA 2100).
Measurements of hydrostatic pressure
Hydrostatic pressures were measured in the dorsal aorta, segmental artery, leftposterior cardinal vein and ureter. One port of a blood-pressure transducer wasconnected to a perfusion pump and the other port was connected to a small cannula.Cannulae were made of 2 mm diameter capillary that had been pulled to a tipdiameter of ca. 0-05 mm and sharpened. Placement of the cannulae was facilitated byuse of a Narishige micromanipulator.
All pressure measurements were made with Elcomatic type EM 750 transducerscoupled to a George Washington recorder (MD 400/2) through full-bridge strain-gauge preamplifiers. The sensitivity of the recorder amplifier was set in most casesso that pressure changes of 0-25 cm H2O produced a deflexion of 1 mm on the record-ing chart. Pressure was usually read to the nearest mm, but small pressure changeswere read to the nearest 0-5 mm.
Perfusion studies
Ureters of relaxed hagfishes were catheterized as described earlier. Loose ligatureswere placed around the dorsal and ventral branches of the segmental artery (Fig. 1).GFR was measured until a consistent rate was established with blood perfusing theglomerulus. The segmental artery was then cannulated, the pressure in the segmentalartery recorded briefly, and perfusion begun. At this time, the loose ligatures weretightened. The composition of the perfusion fluid is shown in Table 1.
Ficoll 70 (Pharmacia (GB) Ltd.), a polymer whose molecular weight averaged67000, served as a colloid and glucose served as a metabolizable substrate. Perfusionfluid was made up each day by adding weighed amounts of glucose and Ficoll 70 tostock buffered Ringer. Each batch of perfusion fluid was filtered through a Milliporefilter of i -2 fim average pore diameter.
In one series of experiments the following chemical inhibitors were used:acetazolamide (Diamox), 2,4-dinitrophenol, 2-deoxy-D-glucose, ouabain (Strophanthin
264 J. A. RlEGEL
Table 1. The composition of fluid used to perfuse isolated renal segments of hagfishes
(A buffered Ringer (upper part of the table) was added to the organic constituents listed inthe lower part of the Table. The Ringer composition was based on analyses of plasma ionsmade by Munz & McFarland (1964); the sodium concentration was reduced to compensatefor Tris.)
Substance g ml"1 x 500 mM I"1
NaClKC1CaCla.2HaOMgCl2.6H2ONa2SO4.ioH2OTrisPH
GlucoseFicoll 70
6cmH2O12 cm H8O24 cm H2O
15-50-26110-33081-21980-1870i'5i45
Adjusted
g
53074-S
12
0-8525
1 to 7-6 with HC1ml~lx 100-0032
0-17460-34920-6984
G), iodoacetic acid, sodium cyanide, amiloride and ethacrynic acid. The lattertwo chemicals were supplied through the courtesy of Dr G. M. Fanelli of Merck,Sharp and Dohm, West Point, Pennsylvania, U.S.A.
In experiments involving chemical inhibitors a dual perfusion arrangement wasused. One of two identical channels of a perfusion pump could be selected by sim-ultaneously turning 3-way stopcocks at the cannula and pump. Both channels wereconnected to blood-pressure transducers and pressure in the channel perfusingisolated renal segments was recorded continuously.
RESULTS
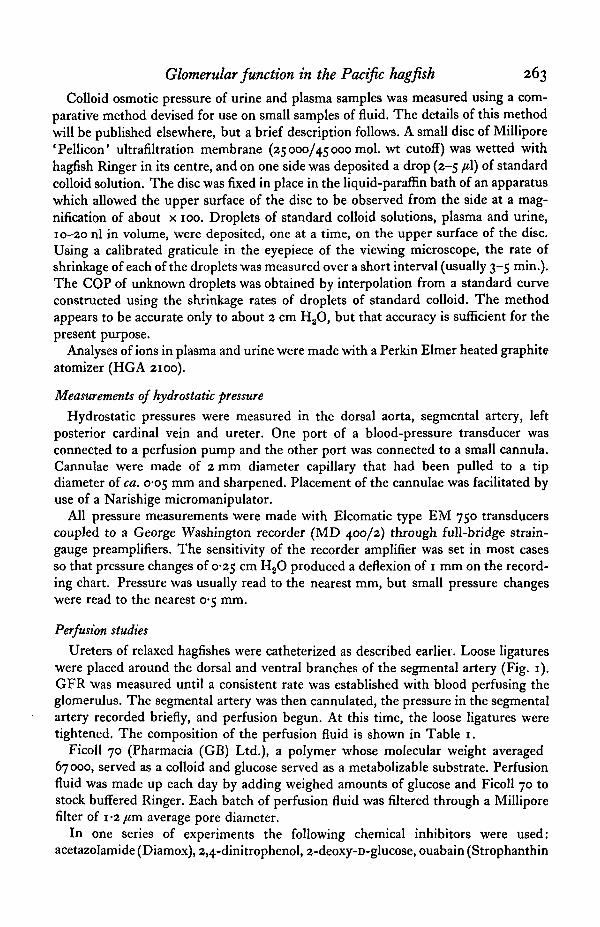
Fig. 1. depicts the renal structures found in one of the 30 or so body segments whichbear glomeruli. The kidney is served by renal arteries which are said to supply theglomerulus exclusively (Grodziriski, 1926; Heath-Eves & McMillan, 1974). In Fig. 1the renal artery is shown as a branch of a segmental artery, but renal arteries alsoarise directly from the dorsal aorta or as a branch of a mesenteric artery (Grodzinski,1926). Efferent to the glomerulus are 1-3 vessels said by Heath-Eves & McMillan(1974) to be arterioles. These vessels supply the extensive capillary network of theureter wall. The ureter wall is also supplied by blood vessels which branch directlyoff the segmental arteries (personal observation).
Shown in the upper part of Fig. 1 is the configuration of the renal corpuscle andureter in a freshly dissected hagfish. After some hours of functioning with a cathetertied into the ureter (and blocking it), the renal capsule and ureter usually becamegrossly distended. This is shown in the lower part of Fig. 1. Distension of the renalsegment caused the closely packed cords of columnar epithelial cells seen in thecollapsed ureter to move apart. Commonly also blood flow in the postglomerularvasculature was slowed or halted, and the glomerular capillary tuft became collapsed.

Glomerular function in the Pacific hag fish 265
Right postcardinal vein
GlomerulusBowmans capsule
Mesenteric artery
Renal capsular vascular networkEpithelial cords
of the ureter
Left postcardinalvein
Dorsalaorta
Dorsalbranch
segmentalartery /Renal artery
Segmental vein
Renal veinVentrolateral branch
segmental artery
Fig. 1. Kidney and associated vasculature in one body segment viewed from the ventrolateralaspect with the animal lying on its back. The overlying peritoneum and associated fat bodieshave been removed. The upper part of the figure shows the freshly dissected kidney. The lowerpart of the figure shows the kidney after several hours of function with the ureter blocked.
The rate of urine formation
In the following discussion the rate of fluid movement into ureter catheters will becalled 'glomerular filtration rate' (GFR). The justification for this rests on twoobservations. Firstly, the ionic composition of fluid collected from the ureter cathetermore nearly resembles plasma than does final urine (Munz & McFarland, 1964;Stolte & Eisenbach, 1973). Secondly, water apparently is not reabsorbed from theurine in hagfishes (Munz & McFarland, 1964; Rail & Burger, 1967). Therefore, fluidcollected in the ureter catheter should ba isovolumetric with glomerular fluid.
Seventy-one measurements of maximum GFR made in 58 animals averaged20-3 ±2-13 (s.E.M.) nl min"1. In the vast majority of the estimates ureter pressure wasapproximately atmospheric. There seemed to be no practical way of independentlyassessing the accuracy of measurements of GFR. However, on average, advance offluid in the ureter catheter of one graticule division (= 0-05 mm) represented a volumeof ca. 10 nl (i.e. n r2h = 3-14 (o-25)2(o-O5) = 0-00981 mm3). Fluid advance in thecatheter usually was read to a graticule division, although one-half division was easilyestimated. Except when GFR was very slow, readings were made after fluid hadadvanced 10 divisions or so in the catheter. Therefore the accuracy of estimatingfluid advance was at least 10%; the accuracy of estimating GFR probably was
266 J. A. RlEGEL
1 2 3 4 5 6 7Segmental artery pressure (cm H2O)
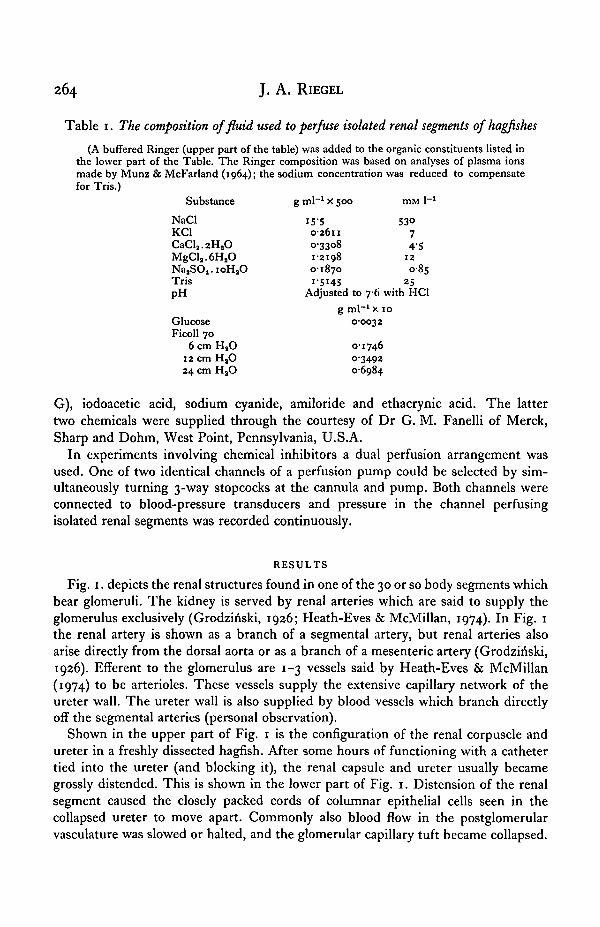
Fig. 2. Relationship between segmental artery pressure and GFR of the adjacent glomerulus.The line was plotted by least squares; its slope is significantly different from zero (P -^ ooi) .
similar. No GFR was measurable in 25 animals, although the blood flow through therenal vasculature was apparently normal.
Measurements of hydrostatic pressure in the segmental artery serving the catheter-ized ureter segment were made in 48 animals. In 29 such animals GFR was measur-able. Fig. 2 illustrates the relationship between GFR and segmental artery pressure.The slope of the regression line (plotted by least squares) is statistically different fromzero (P <̂ o-oi). As shown in Fig. 2, GFR appears to be dependent upon arterialpressure when arterial pressure exceeds about 4 cm H2O. The average pressuremeasured in segmental arteries of urine-producing glomeruli was 4*94 + 0-16 (s.E.M.)cm H2O. The average pressure measured in segmental arteries of hagfishes in whichGFR was not measurable was 3-93 ± 0-20 (S.E.M.) cm H2O.
Isolation of single glomeruli possibly could have an adverse or enhancing affect onGFR. To check this, measurements were made of urine produced by the entire kidneyon one side of the body. A catheter was tied into the ureter well posterior to theglomerulus-bearing portion of the kidney. Six successful estimations of urine flowwere made. These averaged 0-956/il min-1 (range = 0-687 t o I'22//A min"1). Three

Glomerular function in the Pacific hagfish 267
Table 2. Averages of the estimations of concentrations of major cations in plasma andurine of seven hagfishes and three samples of habitat water
(Also shown are averages of the urine: plasma concentration ratios.)
Na K Ca Mg
Plasma concentration (mil)Urine concentration (HIM)Seawater (HIM)Urine: plasma concentration ratio
506519496
1 02
6-88774
1 2 51 2 9
9868-37
n - 40 8 9
12-220-65°'5
1 07
Table 3. Average hydrostatic pressures (cm H^O) measured in the vasculature andureter of hagfishes
PosteriorDorsal Segmental Cardinal Blocked Ureteraorta artery vein (left) ureter segment
Pressure 5-31 4-64 o-i 1-3 I-IRange 4-25-6-90 2-80-575 0-0-4 0-5-2-75 0-3Number 13 13 7 13 8
animals in which a count of glomeruli was made had a GFR per glomerulus of 34*3,31-3 and 23-3 nl min-1. These values fall well within the range of maximum GFRmeasured in single glomeruli (Fig. 2).
Estimates of COP and concentrations of ions
The average COP of the plasma of nine animals was 10-5 cm H20; bloodsamples from the caudal sinus appeared to be identical with blood samples taken fromthe dorsal aorta. The average COP of urine of four animals was 0-4 cm H20.
Estimations of the concentrations of major cations in plasma and urine aresummarized in Table 2. Also shown are the average urine: plasma concentration ratiosand the average concentrations of major cations in habitat water. Limits of error inanalyses using the HGA 2100 were not studied systematically. However, the variationof individual estimations suggests that, except for calcium, the limits of errorcertainly were within 10% and probably closer to 5%. Calcium analyses were attimes so difficult they were abandoned. It seems likely that except for potassium,concentrations of cations in the primary urine approximate to the plasma cationconcentrations.
Measurements of hydrostatic pressure
Hydrostatic pressure measurements are summarized in Table 3. On average, thedorsal aorta pressure was higher than the pressure in the adjacent segmental artery.However, withdrawal of the pressure-detecting cannula from the dorsal aorta usuallyled to extensive haemorrhage. For this reason pressure recordings in the dorsal aortawere made at the end of experiments. The average difference may reflect only thetime interval (generally 5-6 h) between the two measurements. Hydrostatic pressurein the left posterior cardinal vein was negligible.
The procedure adopted for isolating renal segments blocked the ureter. As shownin Table 3, hydrostatic pressures in blocked ureters could rise to quite appreciablelevels. This was reflected by the degree of distension of the ureters.

268 J. A. RlEGEL
- 1
I
- 0 - 4
0 - 0 - 5 0
1 II I28
f 24
U
2 16cge 12
I1 4o
0
0 30 60 90 120
Elapsed time (min)
150 180 210
Fig. 3. Relationship between GFR and backpressure applied to the ureter (upper arrows).Lower (narrow) arrows indicate times at which backpressure caused fluid to move fromcatheter to ureter.
Effects of ureteral backpressure on GFR
Ureter distension accompanied the slowing and (ultimately) complete cessation ofblood flow in the ureteral and glomerular capillaries. A gradual rise in GFR usuallyaccompanied ureter distension. Obviously, ureter distension resulted in increasedhydrostatic pressure in the ureter lumen (Table 3). Two questions arose from theseobservations: (1) Does lumenal pressure represent a backpressure on the glomerulus?(2) Is GFR directly affected by lumenal pressure? Experiments of the kind illustratedin Fig. 3 provided at least partial answers to these two questions. The ureter pressurewas adjusted initially to minus one centimetre of water, and the GFR was determinedfor about 1 \ h. At this point the ureter pressure was adjusted to atmospheric, causingfluid to move from catheter into ureter (narrow arrow at the bottom of the figure).After some minutes during which no GFR was measurable, the ureter pressure waslowered and GFR became measurable again. A slight elevation of ureter pressure atthis time slowed GFR, but only momentarily. Return of the ureter pressure toatmospheric caused fluid to move rapidly out of the catheter again, but recovery wasfairly rapid and GFR rose to a high value quickly.
As shown in Fig. 3, pressure in the ureter lumen does seem to exert a backpressureon the glomerulus because GFR slowed. However, the effect of increased ureterbackpressure on GFR seemed to diminish the longer the experiment continued. Forexample, the only obvious difference between conditions at ca. 104 and 145 minelapsed time was the greater ureter distension visible at the latter time. Theseobservations suggest that when the ureter is distended, the resulting backpressure inthe lumen has a tendency to slow GFR. However, if the ureter wall is well distended

Glomerular function in the Pacific hagfish 269
4-62 6-673-96 5-28 1-32
I II II I
O 6 -
• = G F R
O =Perfusion pressure
O£
30 60 90 120 150 180 210 240 270 300Elapsed time (min)
Fig. 4. Results typical of perfusions of isolated renal segments with 6 cm colloid Ringer.Arrows indicate the times at which perfusion at the rates indicated (in ftl min~l) was begun.Perfusion pressure and GFR indicated on the left-hand ordinate are those measured just priorto canulation of the segmental artery.
the lumenal backpressure may collapse the capillaries of the ureter wall, increasingpostglomerular vascular resistance and increasing GFR. That the compliance of theureter wall is related to blood pressure may be shown by the following observation.In some experiments there was a rapid deterioration in the blood circulation leadingto a slowing or cessation of GFR; occasionally, urine moved from catheter into ureter.Assuming that a fall in blood pressure accompanied a slowing of circulation, thenre-entry of urine into the ureter probably was caused by expansion of the ureter wall.This observation raises the possibility that blood vessels of the ureter wall controlthe compliance of that structure (and vice versa).
Perfusion studies
Perfusion studies produced few definitive results. These are of interest if only toillustrate that glomerular filtration may be a more complex phenomenon thanbelieved generally.
Effects on GFR of colloid in the perfusion Ringer
Preliminary estimates of the COP of hagfish plasma suggested that a normal valuewas ca. 12 cm H2O. To assess the influence of COP on GFR, glomeruli were perfusedwith Ringer whose calculated COP was adjusted to one-half normal, normal, and twicenormal for plasma (i.e. 6, 12 and 24 cm H2O).
Isolated renal segments perfused with Ringer whose calculated COP was 6 cmH2O (6 cm colloid Ringer) produced urine in a manner most like blood-perfusedrenal segments. The perfusion rate was varied between 0-08 fii min-1 and 6-67 fi\ min"1;
270 J. A. RlEGEL
Table 4. Summary of perfusion rates, hydrostatic pressures and glomerular filtrationrates during perfusion of renal segments with Ringer having colloid osmotic pressures(COP) of 6 and 12 cm Hfi
Average Average Averageurine flow perfusion perfusion
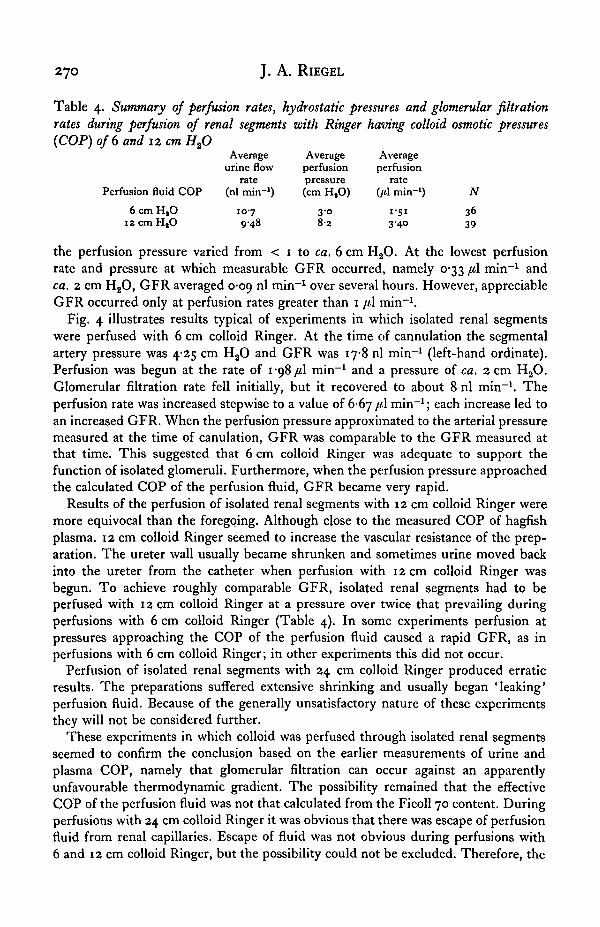
rate pressure ratePerfusion fluid COP (nl min"1) (cm HSO) (/tl min"1) N
6 c m H , 0 107 3-0 1-51 36i2cmH,O 9-48 8-2 3-40 39
the perfusion pressure varied from < 1 to ca. 6 cm H2O. At the lowest perfusionrate and pressure at which measurable GFR occurred, namely 0-33 /tl min"1 andca. 2 cm H2O, GFR averaged 0-09 nl min"1 over several hours. However, appreciableGFR occurred only at perfusion rates greater than 1 [i\ min"1.
Fig. 4 illustrates results typical of experiments in which isolated renal segmentswere perfused with 6 cm colloid Ringer. At the time of cannulation the segmentalartery pressure was 4-25 cm H2O and GFR was 17-8 nl min"1 (left-hand ordinate).Perfusion was begun at the rate of 1-98/41 min"1 and a pressure of ca. 2 cm H2O.Glomerular filtration rate fell initially, but it recovered to about 8 nl min"1. Theperfusion rate was increased stepwise to a value of 6-67 //.I min"1; each increase led toan increased GFR. When the perfusion pressure approximated to the arterial pressuremeasured at the time of canulation, GFR was comparable to the GFR measured atthat time. This suggested that 6 cm colloid Ringer was adequate to support thefunction of isolated glomeruli. Furthermore, when the perfusion pressure approachedthe calculated COP of the perfusion fluid, GFR became very rapid.
Results of the perfusion of isolated renal segments with 12 cm colloid Ringer weremore equivocal than the foregoing. Although close to the measured COP of hagfishplasma. 12 cm colloid Ringer seemed to increase the vascular resistance of the prep-aration. The ureter wall usually became shrunken and sometimes urine moved backinto the ureter from the catheter when perfusion with 12 cm colloid Ringer wasbegun. To achieve roughly comparable GFR, isolated renal segments had to beperfused with 12 cm colloid Ringer at a pressure over twice that prevailing duringperfusions with 6 cm colloid Ringer (Table 4). In some experiments perfusion atpressures approaching the COP of the perfusion fluid caused a rapid GFR, as inperfusions with 6 cm colloid Ringer; in other experiments this did not occur.
Perfusion of isolated renal segments with 24 cm colloid Ringer produced erraticresults. The preparations suffered extensive shrinking and usually began 'leaking'perfusion fluid. Because of the generally unsatisfactory nature of these experimentsthey will not be considered further.
These experiments in which colloid was perfused through isolated renal segmentsseemed to confirm the conclusion based on the earlier measurements of urine andplasma COP, namely that glomerular filtration can occur against an apparentlyunfavourable thermodynamic gradient. The possibility remained that the effectiveCOP of the perfusion fluid was not that calculated from the Ficoll 70 content. Duringperfusions with 24 cm colloid Ringer it was obvious that there was escape of perfusionfluid from renal capillaries. Escape of fluid was not obvious during perfusions with6 and 12 cm colloid Ringer, but the possibility could not be excluded. Therefore, the

Glomerular function in the Pacific hag fish 271
Table 5. Estimates of the colloid osmotic pressure (COP) of per fusion fluid and urineproduced during per fusions of single glomeruli
(Values are expressed as the average with the range of data in parentheses.)
Perfusion fluid UrinePerfusion fluid COP (cm H2O) COP (cm H2O) N
6 cm colloid Ringer 6-3 (5-8-7-5) 1-2 (0-1-7) 412 cm colloid Ringer 13-2 (12-4.-14.-2) 7-1 (3-9-9-9) 6
COP of samples of urine produced during perfusion of renal segments with 6 and12 cm colloid Ringer was measured. Table 5 shows that when 12 cm colloid Ringerperfused the glomeruli appreciable amounts of colloid entered the urine. Three offour samples of urine produced by glomeruli perfused with 6 cm colloid Ringer alsohad a slight but measurable COP. However, in only two of the examples shown inTable 5 was the COP of the urine sufficiently high to permit the possibility of a pressuregradient favourable to filtration.
Effects of chemical inhibitors on GFR of perfused glomeruli
Numerous studies have shown that infusion of inhibitors into the general circulationof intact animals causes a reduction in the GFR (e.g. Lie, Johanneson & Kiil, 1973,1975). This effect is generally attributed to an indirect influence of inhibitors onplasma volume or renal vasculature. In the present studies it was hoped that by per-fusing individual renal segments specific effects of inhibitors upon the glomerulicould be separated from generalized effects.
Although 6 cm colloid Ringer has a COP somewhat less than the average of hagfishplasma, of the Ringers tried it seemed to be the most suitable as a perfusion mediumConsequently it was used as the standard perfusion fluid during studies of the effectsof chemical inhibitors on GFR.
The variability of the GFR of isolated renal segments is large (Fig. 2). For thisreason, each preparation served as its own control. A renal segment was perfusedwith 6 cm colloid Ringer which lacked inhibitor (control channel) for 1 h or more.Then switchover was made to 6 cm colloid Ringer containing inhibitor (experimentalchannel). Switchover resulted in a momentary lowering of pressure in the perfusionchannel, usually with a brief slowing of GFR. However, it must be emphasized thata prolonged lowering of GFR followed by subsequent recovery (such as seen inFigs. 5 and 6) was never observed during control perfusions. This observation supportsthe view expressed below that lowering of GFR was a specific effect of chemicalinhibitors rather than a random effect.
After it was established whether or not perfusion with inhibitor affected GFR,perfusion was switched to the control channel. At each switchover it took 14-40 minbefore the alternative fluid perfused the preparation. This was due to a 'dead space'between the 3-way stopcock and canula tip whose volume was estimated for eachcanula. The stippled arrows in Figs. 5 and 6 indicate the shortest and longest possible'lag' times. Table 6 summarizes the results of perfusions with inhibitors. Onlyouabain and dinitrophenol (DNP) had a consistently observed effect on the GFR ofrenal segments.
272 J. A. RlEGEL
Ouabain4 61 5-53 3 61 . °" 1 ,
• • • A 5 •
O= GFR
• = Perfusion pressure
150 180 210Elapsed time (min)
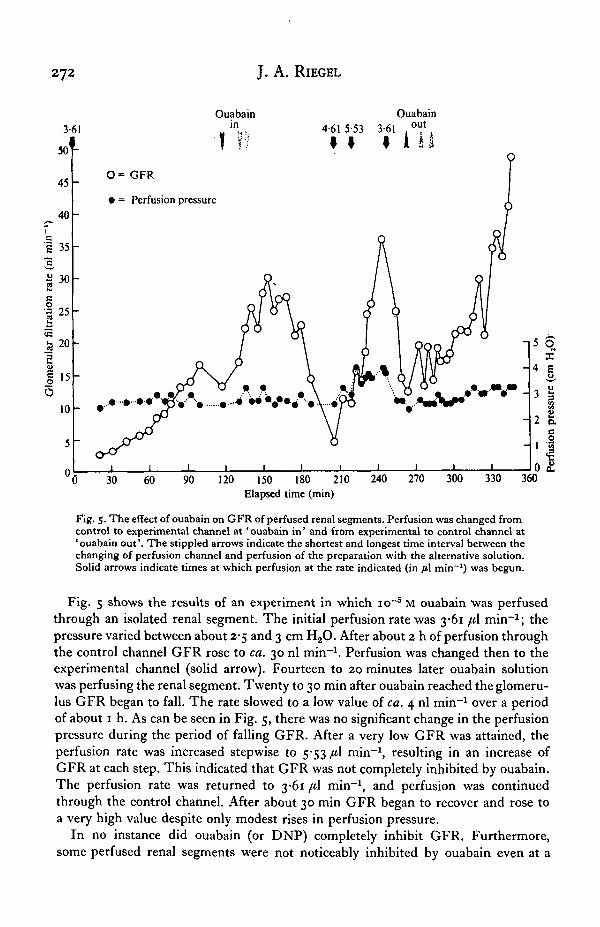
Fig. 5. The effect of ouabain on GFR of perfused renal segments. Perfusion was changed fromcontrol to experimental channel at ' ouabain in' and from experimental to control channel at'ouabain out'. The stippled arrows indicate the shortest and longest time interval between thechanging of perfusion channel and perfusion of the preparation with the alternative solution.Solid arrows indicate times at which perfusion at the rate indicated (in fil min~l) was begun.
Fig. 5 shows the results of an experiment in which io~5 M ouabain was perfusedthrough an isolated renal segment. The initial perfusion rate was 3-61 /tl min"1; thepressure varied between about 2-5 and 3 cm H2O. After about 2 h of perfusion throughthe control channel GFR rose to ca. 30 nl min""1. Perfusion was changed then to theexperimental channel (solid arrow). Fourteen to 20 minutes later ouabain solutionwas perfusing the renal segment. Twenty to 30 min after ouabain reached the glomeru-lus GFR began to fall. The rate slowed to a low value of ca. 4 nl min"1 over a periodof about 1 h. As can be seen in Fig. 5, there was no significant change in the perfusionpressure during the period of falling GFR. After a very low GFR was attained, theperfusion rate was increased stepwise to 5-53 [i\ min"1, resulting in an increase ofGFR at each step. This indicated that GFR was not completely inhibited by ouabain.The perfusion rate was returned to 3-61 /*1 min"1, and perfusion was continuedthrough the control channel. After about 30 min GFR began to recover and rose toa very high value despite only modest rises in perfusion pressure.
In no instance did ouabain (or DNP) completely inhibit GFR. Furthermore,some perfused renal segments were not noticeably inhibited by ouabain even at a
Glomerular function in the Pacific hagfish 273
36 r
r 3 2
1 28c~S 24S
I 1 65 n
<L>
I 8O
DNPin
I i
DNPout
O= GFR
• = Perfusion pressure
30 60 90 120 150 180Elapsed time (min)
210 270 300
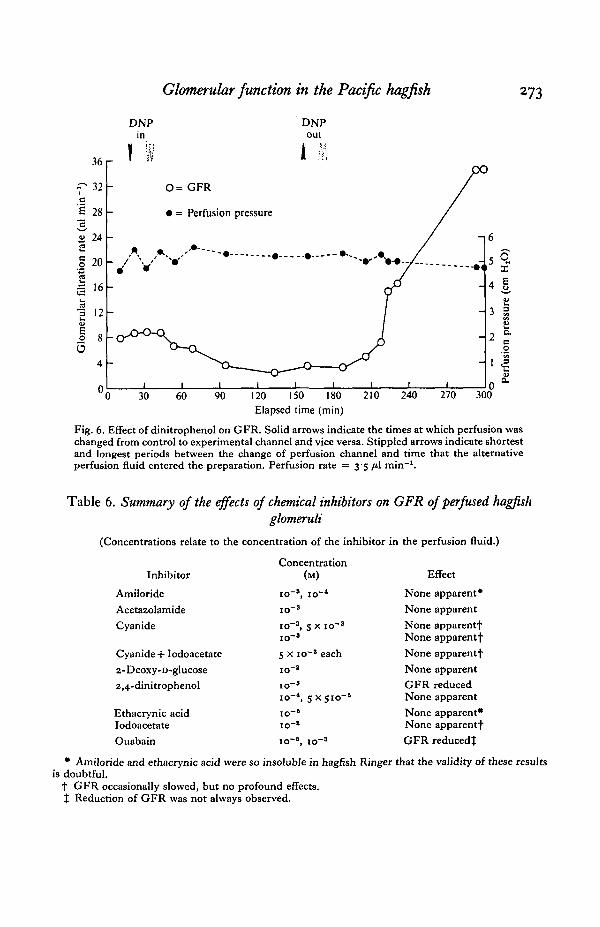
Fig. 6. Effect of dinitrophenol on GFR. Solid arrows indicate the times at which perfusion waschanged from control to experimental channel and vice versa. Stippled arrows indicate shortestand longest periods between the change of perfusion channel and time that the alternativeperfusion fluid entered the preparation. Perfusion rate = 3-5 /tl min"1.
Table 6. Summary of the effects of chemical inhibitors on GFR of perfused hagfishglomeruli
(Concentrations relate to the concentration of the inhibitor in the perfusion fluid.)
Inhibitor
AmilorideAcetazolamideCyanide
Cyanide + Iodoacetate2-Deoxy-D-glucose2,4-dinitrophenol
Ethacrynic acidIodoacetateOuabain
Concentration(M)
IO~3, IO~4
IO"»
io~a, s x io~s
10-3
5 x io~s eachio-a
10-3
io"4 , s x 510""6
10-6
io-s
10-5, 10-3
Effect
None apparent*None apparentNone apparent"!"None apparent")"None apparent")"None apparentGFR reducedNone apparentNone apparent*None apparentfGFR reducedl
* Amiloride and ethacrynic acid were so insoluble in hagfish Ringer that the validity of these resultsis doubtful.
t GFR occasionally slowed, but no profound effects.% Reduction of GFR was not always observed.
274 J- A. RlEGEL
concentration of io~3 M. In such experiments, however, relatively high perfusionpressures (4-5 cm H2O) prevailed.
Dinitrophenol did not inhibit GFR except at a concentration of io~3 M, whichalways caused inhibition. A typical experiment is shown in Fig. 6. The GFR reacheda maximum value of 9 nl min"1 during perfusion through the control channel. AfterDNP began perfusing the renal segment, GFR was affected relatively rapidly. Similarly,after perfusion with control Ringer was recommenced, recovery of the GFR wasrelatively rapid.
Although the data in Table 6 suggest that only ouabain and DNP affect GFR ofperfused renal segments, this conclusion might be misleading. The poor solubilityof amiloride and ethacrynic acid in hagfish Ringer makes it possible that very little ofthose compounds remained in solution in the perfusion fluid. Furthermore, GFRwas reduced during some perfusions with cyanide and iodoacetate, but the reductionwas never large and the effect was not observed consistently.
DISCUSSION
The results reported here are roughly comparable to those obtained by others.Compared to plasma ion analyses made by Munz & McFarland (1964), present resultsexhibit considerably lower sodium and somewhat higher magnesium concentrations.However, plasma ion concentrations (especially sodium) seem to be very variable inhagfishes, possibly reflecting conditions under which the animals are kept in captivity(Mclnerey, 1974). Eisenbach et al. (1971) measured osmolality and concentrations ofsodium and potassium in plasma and glomerular fluid of hagfishes. Sodium andpotassium concentrations of glomerular fluid approximated to plasma concentrationsof those ions. Curiously, the osmolality of glomerular fluid was significantly less thanthe osmolality of the plasma.
Average 'whole animal' urine-flow rate of specimens of Eptatretus stouti calculatedfrom single glomerulus GFR was 15 ml kg"1 per day. This is greater than the averagevalue (5-4 ml kg"1 per day) obtained by Morris (1965) by collection of urine fromspecimens of Myxine glutinosa. However, it is comparable to the maximum value(10 ml kg"1 per day) measured by Munz & McFarland (1964) on a single specimenof E. stouti.
The primary purpose of the present experiments was to elucidate the process ofglomerular filtration in the hagfish. The present state of knowledge makes it hazardousto extrapolate the results to conditions which may exist in conscious; intact hagfishes.
Effects of colloid on renal hydrodynamicsThe results of the present studies of colloid effects appear to contrast with some of
those obtained in studies of mammalian kidneys. Perfusion of hagfish renal segmentswith colloid-containing solutions led to an apparent increase in the resistance to flow.Colloidal solutions cause an increased flow in mammalian kidneys, implying a de-creased intrarenal resistance. It can be surmised from the data shown in Table 4 thatin the hagfish, filtration fraction (GFR -r- perfusion rate) varies inversely with theCOP of the perfusion fluid. The same relationship holds true for mammalian kidneys(Navar et al. 1971; Bowman & Maack, 1974; Little & Cohen, 1974). Therefore both
Glomerular function in the Pacific hag fish 275
in mammals and hagfishes the specific effect of colloid appears to be a reduction offlow in the glomerular capillaries. Work of Piene (1976) on the vascular bed of thecat's lung suggests an explanation of the apparent paradox. In the cat lung small andmedium-sized arteries may react to perfused colloid by vasoconstriction, whilst largearteries dilate. Dilatation of larger arteries may mask the constriction of smaller arteriesand arterioles. Since the vasculature of the hagfish kidney consists preponderantly ofvessels smaller than 100 /im, the constriction of these vessels may not be masked asperhaps occurs in mammalian kidneys.
Effects of colloid on glomerular filtration rate
Aside from its effects on the renal vasculature, colloid has further effects on GFRwhich are also difficult to interpret. Ficoll 70 enters the urine and it would be expectedthat small amounts of colloid of the molecular weight of this compound would enterthe glomerular filtrate. However, the actual amounts which did so seem excessiveand probably are not due entirely to filtration. Entry of perfused or infused colloidinto the urine is observed commonly. If leakage of Ficoll 70 occurred across glomerularcapillaries, it is puzzling that GFR was so little affected in most cases. Glomerularnitration rate increased rapidly only after perfusion pressure exceeded the calculatedCOP of the perfusion fluid.
Effects of backpressure on glomerular filtration rate
Stolte & Eisenbach (1973) perfused kidney segments of specimens of Myxineglutinosa using a technique similar to the one used here, except that their Ringerlacked colloid. When isolated glomeruli were perfused at pressures normally recordedin the dorsal aorta (i.e. 5-6 cm H2O), the GFR averaged ca. 23 nl min"1. Whenperfusion pressures were increased above the physiological range (up to 17 cm H2O),GFR rose to an average value of 159 nl min-1. Backpressure applied to the renalvasculature through the posterior cardinal vein caused GFR to be elevated enormously.For example, when the postcardinal vein pressure was 4-8—5*3 cm H2O and the arterialperfusion pressure was 5-6-2 cm H2O, GFR averaged 306 nl min"1! Stolte & Eisen-bach concluded that the glomeruli of the hagfish exhibit a degree of autoregulationof the filtration rate. Results of the present studies are in accord with this conclusionand suggest that autoregulation is due primarily to changes in the postglomerularresistance. However, the results of Stolte & Eisenbach imply that backpressure in thepostglomerular vasculature has no influence on preglomerular pressures. This findingis not in accord with the present studies.
Effects of drugs on the glomerular filtration rate
The effects of inhibitors on GFR probably are not susceptible to simple inter-pretation. Although ouabain and DNP have well known and fairly specific effects, it isdifficult to decide how these effects might affect GFR. That is, whether or not theinhibitors affect GFR directly by some action upon the glomerular epithelial cells orindirectly by acting upon the cells of the renal vasculature. It was the consistentobservation in the present studies that any change in postglomerular resistance ofperfused renal segments was reflected in the perfusion (preglomerular) pressure aswell as GFR. However, Stolte & Eisenbach have demonstrated that GFR can be

276 J. A. RlEGEL
markedly affected without apparent change in perfusion (preglomerular) pressure.Therefore, it is possible that ouabain and DNP have a differential effect on glomerularand postglomerular vasculature. Certainly there is a precedent for this in frog kidneys :cyanide and oxygen lack reduce GFR by perfused frog kidneys with no apparenteffect on perfusate flow. Beck, Kempton & Richards (1938) demonstrated thatglbmerular and non-glomerular arterioles react differently to anoxia: glomerulararterioles constrict, non-glomerular arterioles dilate. Unlike the frog kidney, however,there do not appear to be blood vessels derived from the renal artery (and thereforeperfused in the present experiments) which shunt the glomerulus (Grodzinski, 1926;Heath-Eves & McMillan, 1974). Therefore, the mechanism whereby collapse of oneresistance (glomerular capillaries) could be compensated by altering a resistance inseries (postglomerular arterioles or venules) remains obscure.
It is equally difficult to interpret the results of these studies with respect to possibledirect effects of drugs upon glomerular epithelia. That the inhibitors which havea pronounced effect on GFR are also those which block phosphorylation/dephos-phorylation reactions may be of significance. However, it must be admitted that thepresent data do not permit of even a good guess as to the significance of inhibitoreffects and point to the obvious need for further experimentation.
It is a pleasure to record my thanks to Dr Donald Abbott, Mr O. R. Blanton and thestaff of the Hopkins Marine Station, particularly Mr John Kono for their help inmaking my stay there both productive and enjoyable. Doctor John Martin of theCalifornia State University Marine Facility at Moss Landing very kindly permittedme to use his facilities and equipment for analyses with the heated graphite atomizer.For the construction of most of the apparatus used in this study I owe a debt ofgratitude to members of the Science Faculty Central Workshop of Westfield College.Derek Newman-Coburn of that faculty has contributed much to this researchthrough his unfailing interest and considerable engineering talent. My stay in Americawas made possible through several agencies. The Royal Society provided a grant fromthe Browne Research Fund for which I thank them warmly. Westfield Collegeprovided tangible support including the granting of sabbatical leave.
REFERENCES
BECK, L. V., KEMPTON, R. T. & RICHARDS, A. N. (1938). The action of cyanide and of oxygen lack onglomerular function in the perfused frog's kidney. Am. J. Physiol. 122, 676-687.
BOWMAN, R. H. & MAACK, T. (1974). Effect of albumin concentration and ADH on H2O and electrolytetransport in perfused rat kidney. Am. J. Physiol. 226, 426-430.
CONEL, J. LE R. 1917. The urogenital system of myxinoids. J. Morph. 29, 75-163.KISENBACH, G. M., WEISE, M., WEISE, R., HANKE, K., STOLTE, H. & BOYLAND, J. W. (1971). Renal
handling of protein in the hagfish, Myxine glutinosa. Bull. Mt Desert hi. biol. Lab. II , 11-15.ERICSSON, J. L. E. (1967). Fine structure of ureteric duct epithelium in the north Atlantic hagfish
{Myxine glutinosa L.). Z. Zellforsch. mikrosk. Anat. 83, 219-230.FANCE, R. & GIDHOLM, L. (1973). Blood coagulation. In: Myxine glutinosa. Biochemistry, Physiology
and Structure (ed. R. Fange). Acta R. Soc. scient. litt. gothoburg. Zool, 8, 104 pages.FANCE, R. & KHOG, J. (1963). Inability of the kidney of the hagfish to secrete phenol red. Nature,
Lond. 17, 713.GHRMAIN, P. & GAGNON, A. (1968). A simple and reliable method for obtaining large blood samples
from the anaesthetized hagfish. Comp. Biochem. Physiol. 26, 371-375.GHODZINSKI, Z. (1926). (Jber das Blutgefass-system von Myxine glutinosa L. Bull. Acad. pol. Sci.
U "23-155-

Glomerular function in the Pacific hagfish 277HEATH-EVES, M. J. & MCMILLAN, D. B. (1974). The morphology of the kidney of the Atlantic hagfish,
Myxine glutinosa (L.). Am. J. Anat. 139, 309-334.KCHN, K., STOLTE, H. & REALE, E. (1975). The fine structure of the kidney of the hagfish (Myxine
glutinosa L.). Cell Tiss. Res. 164, 201-213.LIE, M., JOHANNESEN, J. & KHL, F. (1973). Glomerulotubular balance and renal metabolic rate.
Am.J. Physiol. 225, 1181-1186.LIE, M., JOHANNESEN, J. & KIIL, F. (1975). Effect of cyanide on renal metabolic rate and glomerulo-
tubular balance. Am. J. Physiol. 229, 55-59.LITTLE, J. R. & COHEN, J. J. (1974). Effect of albumin concentration on function of isolated perfused
rat kidney. Am.J. Physiol. 226, 512-517.MCINEREY, J. W. (1974). Renal sodium reabsorption in the hagfish, Eptatretus stouti. Comp. Biochem.
Physiol. 49 A, 273-280.MORRIS, R. (1965). Studies on salt and water balance in Myxine glutinosa (L.).J. exp. Biol. 42, 359-371.MUNZ, F. W. & MCFARLAND, W. N. (1964). Regulatory function of a primitive vertebrate kidney.
Comp. Biochem. Physiol. 13, 381-400.NAVAR, L. G., BAER, P. G., WALLACE, S. L. & MCDANIEL, J. K. (1971). Reduced intrarenal resistance
and autoregulatory capacity after hyperoncotic dextran. Am. J. Physiol. ZZi, 329-334.PIENE, H. (1976). Some physical properties of the pulmonary arterial bed deduced from pulsative
arterial flow and pressure. Ada physiol. scand. 98, 295—306.RALL, D. P. & BURGER, J. W. (1967). Some aspects of hepatic and renal excretion in Myxine. Am. J.
Physiol. 212, 354-35°-RIEGEL, J. A. (1968). Analysis of the distribution of sodium, potassium and osmotic pressure in the
urine of crayfishes. J. exp. Biol. 48, 587-596.STOLTE, H. & EISENBACH, G. M. (1973). Single nephron filtration rate in the hagfish Myxine glutinosa.
Bull. Mt Desert Id. biol. Lab. 13, 120-121.