facility assessment for reproductive … assessment for reproductive health commodities and...
TRANSCRIPT

GLOBAL PROGRAMME FOR REPRODUCTIVE HEALTH COMMODITIES SECURITY
(GPRHCS)
SURVEY REPORT - 2014
FACILITY ASSESSMENT FOR REPRODUCTIVE HEALTH
COMMODITIES AND SERVICES-UGANDA
SUBMITED BY
Facility Assessment for reproductive health commodities and services- 2014 FINAL REPORT
i
Foreward Availability of Reproductive, Maternal, New born and Child health (RMNCH) commodities and services at service delivery points is key to ensuring that we reach every woman, girl, man and boy who needs services to enable us achieve Millennium Development Goals (MDGs) 1, 3, 4, 5 and 6. While some commodities have been reported to be overstocked at central level, access to them at facility level has still remained a challenge mainly due to supply chain challenges and inadequate technical and functional capacities at service delivery level. The Ministry of Health has continued to build capacity towards achieving real-time monitoring of commodity stock status and service delivery standards at facility level. In the meantime, supervision reports and surveys have remained vital sources of information from service delivery points. This annual facility assessment for reproductive health commodities and services in Uganda is one of the initiatives from the Global Programme to enhance Reproductive Health Commodity Security (GPRHCS) and is conducted across 46 countries worldwide. This report will not only guide the Global Programme, but also many stakeholders and implementing partners in Uganda, to better focus their resources in ensuring RMNCH commodity security by addressing both the supply and demand sides of commodities. I am confident that this document will not only provide guidance to stakeholders and individuals to increase commodity security, but will also serve as a baseline for future monitoring and evaluation of projects and programs working to increase RMNCH commodity security. I therefore urge all stakeholders to use the information in this report to guide our investment in improving availability of services and commodities for RMNCH.
Dr. Asuman Lukwago Permanent Secretary
Facility Assessment for reproductive health commodities and services- 2014 FINAL REPORT
ii
Acknowledgement The ministry of Health would like to thank all of those who took part in the survey in the various consultative meetings, interviews and validation workshops for their efforts in rendering the successful completion of the study. Particular thanks go to the members of the FP/RHCS working Group at the Ministry of Health and Knowledge Management Team at the UNFPA for tirelessly working to fine tune the methodology, tools and sampling design and consequently approving the draft report. In a special way, I would like to thank the coordinators of the assignment; Christine Kajungu from UNFPA and Lawrence Were from the Ministry of Health for their tireless efforts in organizing meetings and validation workshops. I would further like to thank the in-charges of the various health facilities in the country that dedicated time to respond to the many questions from the research team and allowed our team to interview the many clients for FP services. Special thanks also to the patients who made time to respond to the exit interviews. Special thanks to Dr. Collins Tusingwire, Dr. Zainab Akol and Dr. Anthony Mugasa from the Reproductive Health Division, Mr. Morries Seru and Mr. Martin Oteba from the Pharmacy Division for the guidance and oversight role in the implementation of this activity. We are grateful to Eficon Consulting firm for ably carrying out the Survey. Finally, the Ministry of health extends sincere gratitude to the UNFPA’s Global Programme for enhancing Reproductive Health commodity Security (GPRHCS) for the financial and technical support provided for executing this survey. Prof. Anthony K. Mbonye Director Health Services, Clinical and Community
Facility Assessment for reproductive health commodities and services- 2014 FINAL REPORT
iii
Acronyms ANC : Antenatal Care CBO : Community Based Organisation DHO : District Health Officer EMHSLU : Essential Medicines and Health Supplies list of Uganda EmOC : Emergency Obstetric Care FP : Family Planning GH : General Hospitals GPRHCS : Global Programme for Reproductive Health Securities Commodities GPS : Global Positioning System HC : Health Centre HMIS : Health management information HSSIP : Health Sector Strategic and investment Plan HSSIP : Health Sector Strategic Investment Plan ICT : Information Communication Technology JMS : Joint Medical Stores MMR : Maternal Mortality Rate MoH : Ministry of Health MSU : Marie Stopes Uganda NDA : National drug Authority NGO : None Governmental Organisation NMS : National Medical Stores NRH : National Referral Hospital PACE : Program for Access and Community Education PNFP : Private-Not-for-Profit RH : Reproductive Health RHCS : Reproductive Health Commodities Security RHU : Reproductive Health Uganda RRH : Regional Referral Hospital SDP : Service Delivery Points SPSS : Statistical Package for the Social Sciences SRH : Sexual Reproductive Health TOR : Terms of Reference UCG : Uganda Clinical Guidelines UCMB : Uganda Catholic Medical Bureau UDHS : Uganda Demographic and Health Survey UHMG : Uganda Health Marketing Group UMMB : Uganda Muslim Medical Bureau UNFPA : United Nations Populations Fund UNMHCP : Uganda National Minimum Health Care Package UOMB : Uganda Orthodox Medical Bureau UPMA : Uganda Private Midwives Association UPMB : Uganda Protestant Medical Bureau VHT : Village Health Team
Facility Assessment for reproductive health commodities and services- 2014 FINAL REPORT
iv
Table of Contents
Contents
Foreward .................................................................................................................................... i
Acknowledgement .................................................................................................................... ii
Acronyms .................................................................................................................................. iii
Table of Contents .....................................................................................................................iv
List of Tables .............................................................................................................................vi
Executive Summary ................................................................................................................ viii
Introduction: ........................................................................................................................... viii
1 INTRODUCTION ................................................................................................................. 1
1.1 Background ................................................................................................................. 1
1.2 Rationale and Objectives of the study ..................................................................... 2
1.3 Survey Organisation and Management .................................................................... 2
1.4 Methodology ............................................................................................................. 3
1.5 Sample design ............................................................................................................ 3
1.6 Data collection tools .................................................................................................. 7
1.7 Data Analysis .............................................................................................................. 7
1.8 Challenges during field work .................................................................................... 7
1.9 Outline of the report ................................................................................................. 8
2 NATIONAL GUIDELINES, PROTOCOLS AND LAWS ......................................................... 9
2.1 Summary of guidelines, protocols and laws for provision of modern
contraceptives .................................................................................................................. 9
2.2 Summary of guidelines, protocols and laws for provision of maternal/RH
medicines...........................................................................................................................11
3 SURVEY FINDINGS FOR AVAILABILITY OF COMMODITIES AND SERVICES................ 13
3.1 Geographic distribution of facilities ........................................................................ 13
3.2 Distance of SDPs from the source of supplies ........................................................ 13
3.3 Modern contraceptives offered by facilities ........................................................... 15
3.4 Availability of maternal and RH medicines .............................................................. 19
Facility Assessment for reproductive health commodities and services- 2014 FINAL REPORT
v
3.5 Incidence of No Stock-Outs of modern Contraceptives ........................................ 22
3.6 Supply Chain, including cold chain .......................................................................... 24
3.7 Staff Training and Supervision ................................................................................ 35
3.8 Availability of guidelines, Checklists and Job aids ................................................. 44
3.9 Use of Information Communication and Technology and Waste disposal .......... 46
3.10 Charges for User fees ..............................................................................................52
3.11 Availability of Maama Kits ....................................................................................... 55
4 RESULTS OF THE EXIT INTERVIEW ................................................................................ 60
4.1 Background Characteristics of clients for exit interviews ..................................... 60
4.2 Client’s Perception of family Planning Service provision ...................................... 64
4.3 Client appraisal of Cost of family Planning Services .............................................. 68
5 CONCLUSIONS AND RECOMMENDATIONS .................................................................. 79
5.1 Availability of Modern Contraceptive methods ..................................................... 79
5.2 Not all staff trained on insertion and removal of implants were providing FP
services: ........................................................................................................................... 79
5.3 Lack of Guidelines and job aids for FP: ................................................................... 79
5.4 Charging of user fees for family planning services: ............................................... 79
5.5 High transportation costs for FP clients: ................................................................ 79
5.6 Long waiting time for FP services by clients in Karamoja: .................................... 79
5.7 High levels of satisfaction with services by FP clients: .......................................... 80
5.8 Un-availability of essential lifesaving maternal and RH medicines: ...................... 80
5.9 Support supervision had some gaps: ..................................................................... 80
5.10 Stock-outs of Maama kits: ....................................................................................... 80
5.11 Long time taken between ordering and receiving of supplies: ............................ 80
5.12 Waste disposal methods: ........................................................................................ 80
5.13Recommendations: ................................................................................................... 81
6. REFERENCEs .................................................................................................................... 86

Facility Assessment for reproductive health commodities and services- 2014 FINAL REPORT
vi
List of Tables Table 1: Relative Proportion of Categories of SDPs in Uganda ............................................................ 4
Table 2: SDPs Surveyed by region and category ................................................................................... 5
Table 3: Shows the number of family planning clients by region. ....................................................... 6
Table 4: Table on General Characteristics ............................................................................................ 13
Table 5: Distance from source of supply by SDP type ......................................................................... 14
Table 6: Distance from source of supply by administrative Unit ........................................................ 14
Table 7: Distance from source of supply by Location .......................................................................... 14
Table 8: Primary SDPs offering at least three types of contraceptives .............................................. 15
Table 9: Secondary and Tertiary SDPs offering at least five types of contraceptives ....................... 16
Table 10: Reasons for not offering certain contraceptives ................................................................. 18
Table 11: Percentage distribution of service delivery points with seven (Including 2 essential)
lifesaving maternal/reproductive health medicines ........................................................................... 20
Table 12: Reasons for not offering certain lifesaving maternal and RH medicines ............................ 21
Table 13: Percentage distribution of service delivery points with “no stock-out” of modern
contraceptive method in the last six months by type of facility ........................................................ 22
Table 14: Percentage distribution of SDPs with persons responsible for ordering medical supplies
by type of SDPs ...................................................................................................................................... 25
Table 15: How resupply is quantified ................................................................................................... 26
Table 16: Availability of logistical forms for ordering supplies ........................................................... 27
Table 17: Responsibility for transportation of supplies ...................................................................... 29
Table 18: Estimated Length of time between order and receiving of supplies.................................. 31
Table 19: Frequency of resupply by type of SDPs ................................................................................ 32
Table 20: Availability of cold chain by type of SDP .............................................................................. 33
Table 21: Source of power for Fridges used for cold chain by type of SDP ....................................... 34
Table 22: Percentage of SDPs with staff trained to provide FP services including insertion and
removal of Implants ............................................................................................................................. 36
Table 23: Trained staff in FP who are actually proving services ......................................................... 37
Table 24: Percentage distribution of the last time the facility was supervised in the past 12 months
with respect to RH including family Planning ..................................................................................... 39
Table 25: Frequency of supervisory visits ............................................................................................. 41
Table 26: Issues included in the supervision of staff for reproductive health including FP ............. 42
Table 27: Percentage of SDPs with guidelines, check-lists and job aids ............................................ 44
Table 28 Percentage of SDPs with types of ICT tools available ......................................................... 46
Table 29: Percentage of SDPs by how ICT was acquired at the SDP ................................................. 47
Facility Assessment for reproductive health commodities and services- 2014 FINAL REPORT
vii
Table 30: Main purpose of ICT per type of SDP, region and management of SDP ........................... 49
Table 31: Main method used by the SDP to dispose of health waste ................................................. 51
Table 32: Percentage distribution of SDPs by issues for which user fee is charged .......................... 52
Table 33: Percentage distribution of SDPs by issues for which user fee is charged ..........................53
Table 34: Percentage distribution of SDPs by issues for which user fee is charged for services
provided by a qualified health care provider .......................................................................................55
Table 35: Percentage of facilities offering Maama kits ...................................................................... 56
Table 36: Availability of maama kits by the time of the survey .......................................................... 57
Table 37: Reasons for not offering maama kits when SDP has a mandate to offer them ............... 59
Table 38: Showing Sex distribution of FP clients ................................................................................ 60
Table 39: Age distribution of FP clients ................................................................................................ 61
Table 40: Marital Status of FP Clients .................................................................................................. 62
Table 41: Percentage distribution of clients by educational level ...................................................... 63
Table 42: Percent Distribution of clients by frequency of visit to the SDP for FP services .............. 64
Table 43: Percentage distribution of client’s perception of FP service provider’s adherence to
technical issues ..................................................................................................................................... 65
Table 44: Percentage distribution of client’s perceptive of FP service organizational aspect ........ 66
Table 45: Percentage distribution of clients’ perspective of FP service inter-personal aspects ...... 67
Table 46: Percentage distribution of clients perceptive of FP service outcome aspect .................. 68
Table 47: Client appraisal of cost of Family Planning methods .......................................................... 70
Table 48: Percentage distribution of clients by mode of transportation, distance travelled and cost
of transportation ................................................................................................................................... 71
Table 49: Average time spent by client for FP service ........................................................................ 73
Table 50: Percentage distribution of clients by activities they would have engaged in during the
time spent receiving FP services .......................................................................................................... 74
Table 51: Percentage distribution of clients by persons indicated to have performed activities on
their behalf while they were away receiving FP services and the estimated payment..................... 75
Table 52: Average amount paid to persons who performed activities on behalf of clients by
activities while client was away receiving FP services ....................................................................... 76
Table 53: Percentage distribution of clients by source of funds used to pay for FP services ........... 77
Table 54: Average amount paid from each source by background characteristics of client ........... 78
Facility Assessment for reproductive health commodities and services- 2014 FINAL REPORT
viii
Executive Summary Introduction:
n 2009, Uganda received support from the Global Program for Reproductive Health Commodity Security (GPRHCS) to assist the
Ministry of Health in developing a national strategy. The strategy focused on logistics management to improve the functionality of the national and district Reproductive Health commodities Security (RHCS) coordination mechanisms. Uganda is among the 46 countries under the GPRHCS that has conducted these annual surveys to track RHCS indicators. The survey was designed to go beyond the availability of RH commodities to cover significant aspects of service delivery facilities that shore up good RH programmes. In addition to assessing the availability and stock-out of RH commodities, the survey looked at supply chain (including cold chain) systems; staff training and supervision; availability of guidelines and protocols, Information Communication Technology, method of waste disposal and user fees. The survey also obtained the views of clients about the quality and cost of services through exit interviews. The survey was conducted in Health facilities which were grouped into three categories of Service Delivery Points (SDPs); Primary (Health centre IIs & IIIs), Secondary (Health Centre IVs and General Hospitals), and Tertiary (Regional referrals Hospitals [RRHs] and National Referral Hospitals [NRHs]). A total of 734 health facilities were surveyed and this included 617 at primary level, 104 at secondary level, and 13 at tertiary level. Out of the 734 facilities surveyed; 491 were Government owned, 148 were privately owned, 90 were NGO owned and 5 were owned by others including CBOs. Modern contraceptives offered by facilities; the survey findings revealed that at primary service delivery points, 83% of the facilities offered at least three modern contraceptive methods1 while 17% did not offer at least three.
1 The modern contraceptive methods assessed for included; Male condoms, Female condoms, Oral contraception, injectables, emergency contraception,
At secondary and tertiary level, 75% offered at least five modern contraceptive methods while 25% did not. At secondary level alone, 73% offered up to five modern methods while 85% of the tertiary SDPs offered up to five modern methods. The main reasons given by health facilities for not offering certain contraceptive methods were; the delay by the suppliers/source institution to supply contraceptives, the lack of trained staff to provide certain methods such as insertion and removal of IUDs, implants, and female and male sterilization and low client demand for some methods such as female condoms. Availability of Maternal and RH medicines; the survey team assessed the availability of the Seven (including the 2 essential) lifesaving maternal/reproductive health medicines2 It was established that overall 62% of the SDPs had available (by the time of the survey) all the seven including the two essential lifesaving maternal and RH drugs while 38% did not have them available. On average, the main reason given for not having these medicines was the delay on the part of the supplier/warehouse to deliver the medicines. Incidence of No stock-out of the modern contraceptive methods; a facility that had a ‘stock-out” was determined as one that had one or more of the contraceptive methods being out of stock on a given day of the last six methods before the survey. The findings show that 79% of the SDPs had a stock-out of one or more methods in the six months preceding the survey, while only 21% had not had a stock-out. In terms of management, the NGO managed SDPs had the highest stock-out of 83%, followed by government owned SPDs (81%) and the privately owned SDPs(72%). Supply chain including Cold chain; the main source of supplies for contraceptives was the
IUDs, implants, sterilization for females, and sterilization for male. 2 The Seven including two essential lifesaving drugs included Ampicillin, Azithromycin, Benzathine, Benzylpenecilin Betamethasone, Calcium gluconate, Cefixime, Gentamicin, Hydralazine, and magnesium sulfate.
I
Facility Assessment for reproductive health commodities and services- 2014 FINAL REPORT
ix
Central Medical Stores (51%), followed by the private source (20%), the regional/district warehouse (17%), and the local medical store on site (6%), NGO (4%), and donors (2%). In terms of residence, 60% of the facilities in the rural area used the central medical stores compared to 35% of the urban facilities. In terms of management, 67% of government owned used the central medical stores while 72% of the privately owned 37% of NGO owned used the private sources as the main source of supply. The main establishment handling transportation of supplies is the National/central government (42%) through the National Medical Store, followed by Local/district administration (27%), the facilities themselves (27%) and the others at 4%. The estimated average time between ordering and receiving of supplies was mainly less than 2 weeks for 28% of the SDPs, more than 1 month but not up to 4 months for 24% of SDPs, more than six months for 17% of SDPs, and more than 2 weeks but not up to 1 month for 15% of SDPs. The frequency of resupply was mainly once every year (59%) of SDPs mainly government owned, and once every two weeks for 12% of the SDPs mainly privately owned. Of all the SDPs surveyed, only 27% did not have cold chain facilities. The SDPs with no cold chain included 30% at primary, 8% at Secondary, while all of the tertiary SDPs had cold chain facilities. The main cold chain equipment was the refrigerator and the main source of power was gas (45%) followed by electricity from the national grid (32%). Staff training and supervision Four out of five SDPs that offered FP had staff trained to provide family planning services and 70% had staff trained for the insertion and removal of implants. Only 56% of the staff trained to provide FP services were actually providing FP services. Some of the reasons for not providing the services included lack of equipment, materials and consumables, and low client demand for some methods. Out of all the SDPs surveyed, 70% had received support supervision. Important to note is that about two of every five SDPs had not been supervised in the last 12 months by their respective supervisory authority. Overall, the
SDPs received the direct supervisory visits from the authorities mainly every two to three months (42%). Availability of Guidelines, checklists and job aids; The survey findings indicated that; family planning guidelines (National or WHO), family planning check-lists, Maternal health (including PNC and ANC) guidelines, and/or job-aids, national waste disposal guidelines, national waste disposal check-lists and/or job-aids were on a whole available at most of the SDPs across the region and irrespective of residence and management of facility. The relatively low availability of guidelines at the Primary level is a cause of concern. It was determined that only three in five SDPs had FP guidelines, and only 51% had FP checklists and job aids at primary level. Use of information Communication technology (ICT) and waste disposal; About 72% of SDPs had Mobile phones - basic handsets, 39 % had computers and 15% had Mobile phones - Smart phones. Tablets, LAN and internet Wi-Fi were least available at SDPs. Most of the staff were using personal gadgets like phones, tablets and lap tops for SDP work. Majority of ICT are used for communication, patient registration and facility record keeping. In terms of waste disposal, majority of SDPs dispose heath wastes by burning (66%) in all regions followed by central collection by specific agency for disposal away from SDP (13%) and by use of incinerator (13%). Charges for user fees; User fees were charged for consultation on care of sick children (53% of SDPs), delivery and new born services (46%), and 41% on antenatal services. About 49% of all SDPs charged user fee on HIV medication, 43% on child health medicines, 28% on maternal health medicines and 20% on FP commodities. There were no user charges for HIV medicines at tertiary SDPs. Results show that majority of SDPs charge user fees for services provided by a qualified health care provider for Family Planning services, antenatal care services, delivery services, postnatal care services, newborn care services, HIV care, and caesarean section. Most of these fees are charged at primary and secondary SDPs.
Facility Assessment for reproductive health commodities and services- 2014 FINAL REPORT
x
Availability of Maama kits; Four in Five SDPs were supposed to provide maama kits as a matter of policy. Out of the SPDs that were supposed to provide Maama kits, 73% had maama kits available on the day of the survey while 27% did not have maama kits available. In terms of availability of maama kits by level, all tertiary level SDPs (100%), 75% of secondary level and 71% of primarily level had maama kits. The main reason advanced for not having maama kits was the delay on the part of the main source institution to supply maama kits on time (58%). Client’s perception of family planning service provision; Clients were generally satisfied with the quality of services from FP providers. Close to 95% of the clients reported to have been treated with courtesy while 94% were satisfied with the attitude of health care providers. Most clients (96%) were satisfied with the services received and expressed willingness to return to the SDP in future. Also about 98% reported that they would refer relatives to the SDP. Client’s appraisal of cost of family planning services; results show that nearly 12% of the clients paid for FP services. In terms of management, 63% of Clients who paid for FP were from the private SDPs. On average, FP services were generally more expensive in urban areas compared to rural areas. Those that reported to have paid for FP services, paid on average UGX 4,200 in government facilities, UGX 5, 400 in private facilities and UGX 6,000 in NGO managed facilities. Most FP clients (61%) walked to the SDP for services covering on average 3.2Km. The average travel cost was UGX 3,600 with Karamoja region registering the highest cost of transport of UGX 7,000. Recommendations The Ministry of health together with its partners and NMS should review the supply chain management process and ensure that supplies do not take long to get to the facilities. A business process re-engineering of the supply chain management system is recommended to ensure delays and unnecessary process are eliminated to reduce time it takes to supply from when orders are placed.
Continuous training and mentoring for the insertion and removal of implants is encouraged to cater for the gap of lack of trained service providers, a major reason for the stock-out of two methods including Implants (33%) and IUDs (8%). Sensitization at the community level using VHTs is recommended to increase the demand for some contraceptives like the female condom which was mainly out of stock due to lack of demand. Government and its partners should further sensitize on the use of condoms (male and female) in particular regions like Karamoja and northern Uganda where demand was low. It is strongly recommended that staff who make supply orders, are trained, mentored and supervised in supply chain and stock management including the filling in of order forms in the respective formats. Also important is to ensure that more than one staff has the ability to make the orders to cater for periods when another staff is either on leave, sick or when they leave the facility. The Facility in-charges especially at the primary level facilities have to manage exquisitely the supplies unit and to continually monitor its performance to ensure internal processes do no lead to drug stock-outs. It is recommended that the MoH and its partners intensify the distribution and use of the guidelines and job aids in the different facilities where they were missing. The MoH and its partners should ensure that all SDPs at all levels have the necessary job-aids in all departments that deliver FP services, and in a form that is easily usable as reference material by health workers. Regarding payment for FP services, it is recommended that further investigation be done on the issue of user fees payment in facilities where FP services are supposed to be provided for free. Government should provide guidance to private wings in tertiary level health facilities where user-fees are permitted to differentiate between chargeable and non-chargeable services. Government should further intensify the sensitization drive to the public in regards to FP services being free.
Facility Assessment for reproductive health commodities and services- 2014 FINAL REPORT
xi
Regarding transport costs hindering access to FP services in Karamoja, it is recommended that government and its partners consider taking FP services closer to the people in Karamoja through the use of VHTs, or incentivize transportation on particular days to cater for those that cannot afford the cost of transport to attend FP. Regarding the long waiting times for FP services in Karamoja region and Northern Uganda, it is recommended that further efforts to have more health workers in these regions be considered through staff motivation, incentives and better pay, for as long as it brings medical services to these regions up to standard. Regarding the glaring gap in availability of essential life-saving maternal and RH medicines, the recommendation to improve supply chain management has already been made and cannot be exaggerated. In particular, since most facilities (especially the government facilities) cited that the gap was
on the side of the suppliers, it is important that the recurrent problem of central stores constraining service delivery be dealt with through persistent leadership actions targeting these stores. This recommendation is also pertinent to the finding that about one in six health facilities (one in five government health facilities) receive their supplies on average six months from the time they are ordered. Regarding support supervision, Ministry of Health in collaboration with the District Health Office and implementing partners should design a schedule for support supervision for SDPs to ensure continued quality RH services including family planning. Regarding availability of mama kits, It is recommended as already stated that supplies systems be reviewed to eliminate the irregularities and delays, but also importantly provision of maama kits by private providers should be promoted where such public-private partnerships are possible.
Facility Assessment for reproductive health commodities and services- 2014 FINAL REPORT
1
1 INTRODUCTION 1.1 Background
Country Background The reduction in Uganda’s Maternal Mortality Ratio (MMR) has progressed slowly and currently stands at 438 deaths per 100,000 live births (UDHS 2011). On the other hand, Contraceptive Prevalence Rate increased from 14% in 2001, to 18% in 2006 and was at 26% in 2011 (UDHS 2011). Total fertility rate also slightly reduced from 6.9 in 2001, to 6.7 in 2006 and stood at 6.2 in 2011 according to the UDHS 2011 report. Although the unmet need for family planning fell from 41% in 2006 to 34% in 2011, it is undoubtedly still very high. Uganda government through the Ministry of Health and development partners are implementing interventions in the areas of emergency obstetric care (EmOC), skilled attendance at birth, family planning, and antenatal care (ANC) to meet its international and national obligations on maternal health. Government acknowledges that insufficient supplies and commodities is one of the key challenges facing effective delivery and utilisation of effective maternal health services. According to the Reproductive Health Commodity Security Strategic Plan (2009/10-2013/14), the key objectives are; to increase the contraceptive prevalence rate from 26% to 50% and reduce the unmet need for contraceptives from 41% to 5% by 2015 and to increase the proportion of health facilities with no stock-outs of selected Reproductive Health (RH) commodities to 80% by 2015. However, successive reports have indicated varied performance of the indicator on proportion of facilities without stock-out of essential medicines, including reproductive health commodities. Reproductive Health Commodity Security Reproductive Health Commodity Security is achieved when all individuals can obtain and use affordable, quality reproductive health commodities (GPRHCS Report 2009). This is a UNFPA Global Programme to Enhance Reproductive Health Commodity Security launched in 2007 to address the urgent and ongoing need for a reliable supply of contraceptives, condoms, medicines and equipment. The Global Programme is already yielding measurable results through a framework for assisting countries in planning for their own needs, with a focus on commodities as well as capacity development to strengthen health systems. The GPRHCS provides a structure for moving beyond ad-hoc responses to stock-outs towards more predictable, planned and sustainable country-driven approaches for securing essential supplies and ensuring their use. In 2010, funding for the GPRHCS reached nearly $100 million. Each year, more countries are establishing reproductive health commodity security (RHCS) as an integral and permanent component of the overall health sector plan and a key strategy in reducing maternal and newborn death and preventing the spread of HIV.
Facility Assessment for reproductive health commodities and services- 2014 FINAL REPORT
2
In 2009, Uganda received support from the GPRHCS to assist the Ministry of Health in developing a national strategy. The strategy focused on logistics management to improve the functionality of the national and district RHCS coordination mechanisms. As part of this effort, six district Medicine and Therapeutic Committees (MTCs) were established. Their members received training in logistics management, and then carried out supervisory visits to health facilities at the sub-district level.
1.2 Rationale and Objectives of the study
Uganda is one of the 46 countries under the Global Program for Reproductive Health Commodity Security (RHCS) that has conducted the annual surveys to track RHCS indicators. The survey was designed to go beyond the availability of RH commodities to cover salient aspects of service delivery facilities that underpin good RH programmes. In addition to assessing the availability and stock-out of RH commodities, the survey addresses supply chain (including cold chain) systems; staff training and supervision; availability of guidelines and protocols, Information Communication Technology, method of waste disposal and user fees. The survey also obtained the views of clients about the quality and cost of services through exit interviews.
Objectives of the Survey The main objectives of this survey were to: i. To generate information on the availability and stock-out of RH commodities in the
sampled health facilities; ii. To assess the family planning services as well as cost borne by clients to access
services; iii. Make key recommendations for RH commodities and services.
The survey obtained baseline information on a set of RHCS programmatic and managerial issues as set in the National Guidelines. The survey results will enable the Ministry of Health (MOH) and partners to develop milestones and targets for a set of agreed upon indicators in the framework in line with existing national policy frameworks, strategies and plans. In addition the survey data will be used in the preparation of the Annual Health Sector Performance Report and the Global Program report on RHCS.
1.3 Survey Organisation and Management
The Survey was carried out by Eficon Consulting Ltd, under the direct coordination and supervision of UNFPA in collaboration with the Ministry of Health. A survey committee was constituted comprising of the FP/RHCS team. The Assistant Commissioner Reproductive Health chaired the Survey Committee and had the powers to invite the members of the FP/RHCS committee to be members of the Survey Committee. The RHCS Coordinator at the MOH was the Secretary to the Survey Committee.
Facility Assessment for reproductive health commodities and services- 2014 FINAL REPORT
3
The Survey committee’s roles included the following:
Overall guidance for the national facility assessment of the RH commodities and services
Coordination of the survey processes
Organizing meetings to review progress on the planned activity schedule
Offering technical advice to enable the consultants to execute the designated tasks
Monitor implementation of the survey activity plan
Reporting progress to the MCH Cluster.
Coordinating the process of consolidating, formatting and editing the survey report
Coordinating the validation and peer review process of the report
Organizing fora for the dissemination of the final report 1.4 Methodology
The methodology used followed standardised methods, tools and procedures to enable global comparison in all the 46 Countries implementing the GPRHCS programme. The methodology was implemented along the four main stages including: Inception, Field work, Data analysis and reporting stages. During the inception stage, the consultant and the survey committee discussed in detail the survey methodology, the sampling methods and the work plan. The survey committee approved the inception report and the team of consultants proceeded to collect data in the different regions of the country. The details of data collection are discussed in a separate sub section below. After data collection, data was cleaned and entered into EpiData 3.02 software and analysed in STATA 10 and SPSS 17.
1.5 Sample design
The survey considered the following broad categories of Service Delivery Points (SDPs)/domains that provide modern methods of contraceptives and maternal/RH services as stratums: a) Primary Level Care SDPs/facilities (i.e Health Centre IIs and IIIs) b) Secondary level care SDPs (i.e Health Centre IVs and General Hospitals) c) Tertiary level care SDPs (i.e Regional referrals Hospitals (RRHs) and National
Referral Hospitals (NRHs3)
The Ugandan health System has four major categories (i.e. Hospitals, HCIV, HCIII, HCII) as pointed out in the MOH Master Health Facilities Inventory July 2012. The Hospitals are further broken down into General Hospitals, Regional Referral Hospitals and National Referral Hospitals. These categories were grouped to form the three survey categories of primary level, secondary level, and tertiary level.
Following the standardised methodology, the country was divided into 10 regions based on UBOS statistical regions used during Demographic and Health Surveys.4.
3 RRH and NRH, are tertiary level SDPs, but have been given special attention due to their vital role in the Ugandan Health System in health care provision, training and supervision. 4 UDHS 2011
Facility Assessment for reproductive health commodities and services- 2014 FINAL REPORT
4
These regions included, Kampala, Central 1, Central 2, East Central, Eastern, Karamoja, North, West Nile, Western, and South Western. The ten regions served as the administrative units, referred to in the standardised methodology. Sample size determination The sample size was computed using this standard formula (Leslie Kish, 1965) given below:
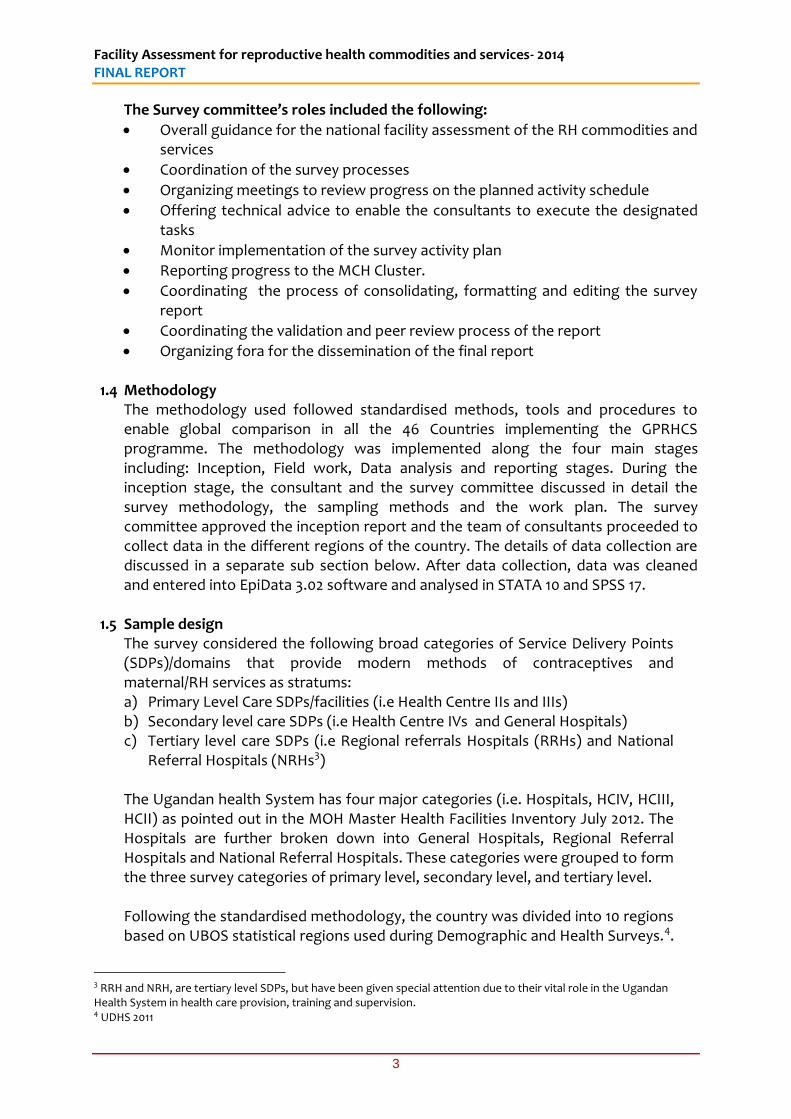
Where by n= expected sample size z= score that corresponds to a confidence interval = 1.96 at 5% level. p=the proportion of the attribute (type of SDP) expressed in decimal d= level of permissible error =0.05. The formula provides the minimum sample size that can be drawn at the specified level of precision from the SDPs under the assumptions of normal distribution. Using the Master Health Facilities Inventory 2012 from Ministry of Health (MoH), the above formula was used to obtain the total sample for the survey which was distributed among the different categories according to the relative share of each category in the total number as shown in table 1 below.
Table 1: Relative Proportion of Categories of SDPs in Uganda
Hospital HC IV HC II HCII Total
Number of SDPs 152 193 1279 3605 5229 Relative Proportion 0.029 0.037 0.245 0.689 1.00
These proportions were further proportionately distributed within the ten administrative units (regions) based on the proportionate share of each region under each category. A representative probability sample of 711 Service delivery Points was determined using the proportions. A non-response rate of 10% was added, to cater for any forms of non-response, thus bringing the final sample size to 782 Service delivery Points in the country. Selection of SDPs The sampled SDPs were selected using systematic sampling. The complete list of SDPs per region and per domain was obtained from the MoH. The GPRHC guideline (1) for systematic sampling states: For each domain (Health facility Level) the facilities were listed without any order or regard to any characteristics. Based on the above guideline, the SDPs per region and category were each given a unique code in Ms-Excel 2007 and used to calculate a sampling interval. The required number of SDPs in each category was the selected starting with the smallest unique code until the final sample was attained. During the selection, the SDPs whose unique codes were selected using the interval were considered as part of the sample.
Facility Assessment for reproductive health commodities and services- 2014 FINAL REPORT
5
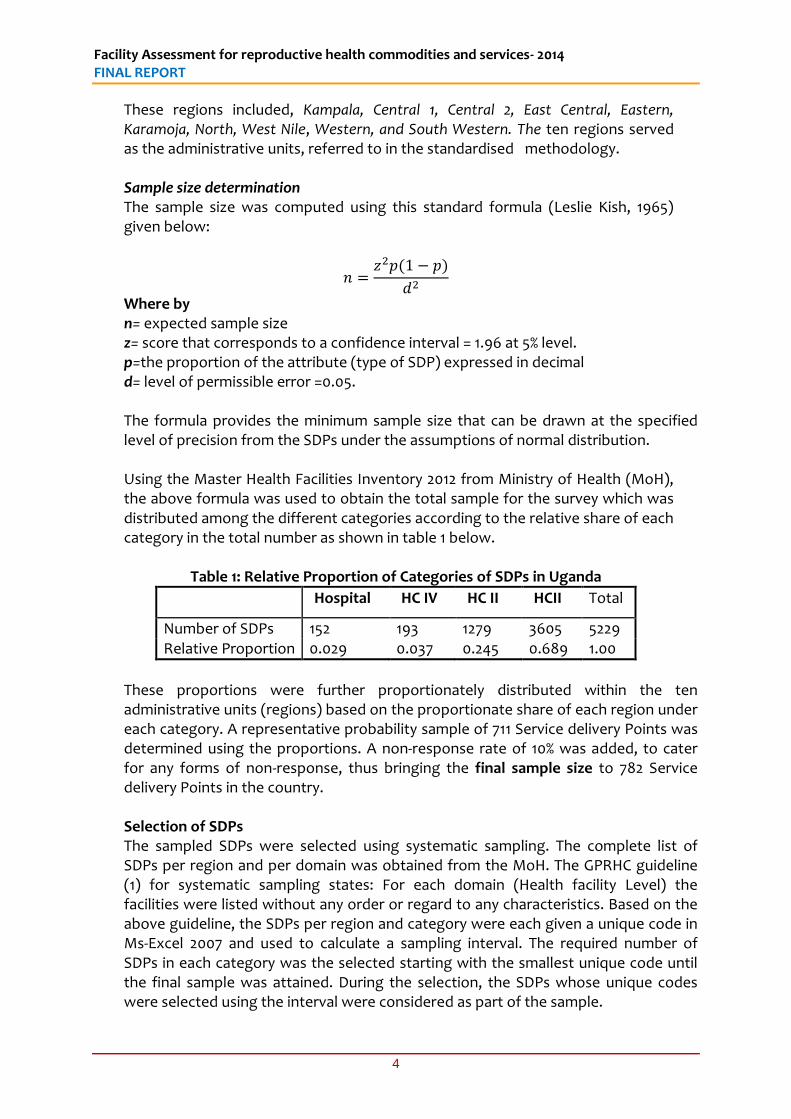
A total of 734 Service delivery Points were surveyed in Uganda. Though this number was below the inflated target of 782, it was well above the minimum sample of 711 which indicated a response rate (RR) of 94 percent higher than the initial assumed RR of 90 percent. These included 617 of primary level SDP (HC II and HCIII),104 of Secondary SDPs (HCIV and General hospitals) and 13 Tertiary level SDPs (Regional and National Referral hospitals).See Table 2 below for the details.
Table 2: SDPs Surveyed by region and category
Level of facility/SDP (%)
Administrative Unit (Region)
Primary SDP (HCII & HCIII)
Secondary SDP (General Hospital &
HCIV)
Tertiary SDP (RRHs & NRHs
Total (%)
Kampala 117 23 2 142 Central 1 62 11 1 74 Central 2 56 10 0 66 East Central 58 8 1 67 Eastern 83 14 1 98 Karamoja 16 2 1 19 Northern 39 5 2 46 WestNile 38 7 1 46 Western 64 7 2 73 South Western 84 17 2 103
Total (%) 617 104 13 734
Client Exit interviews
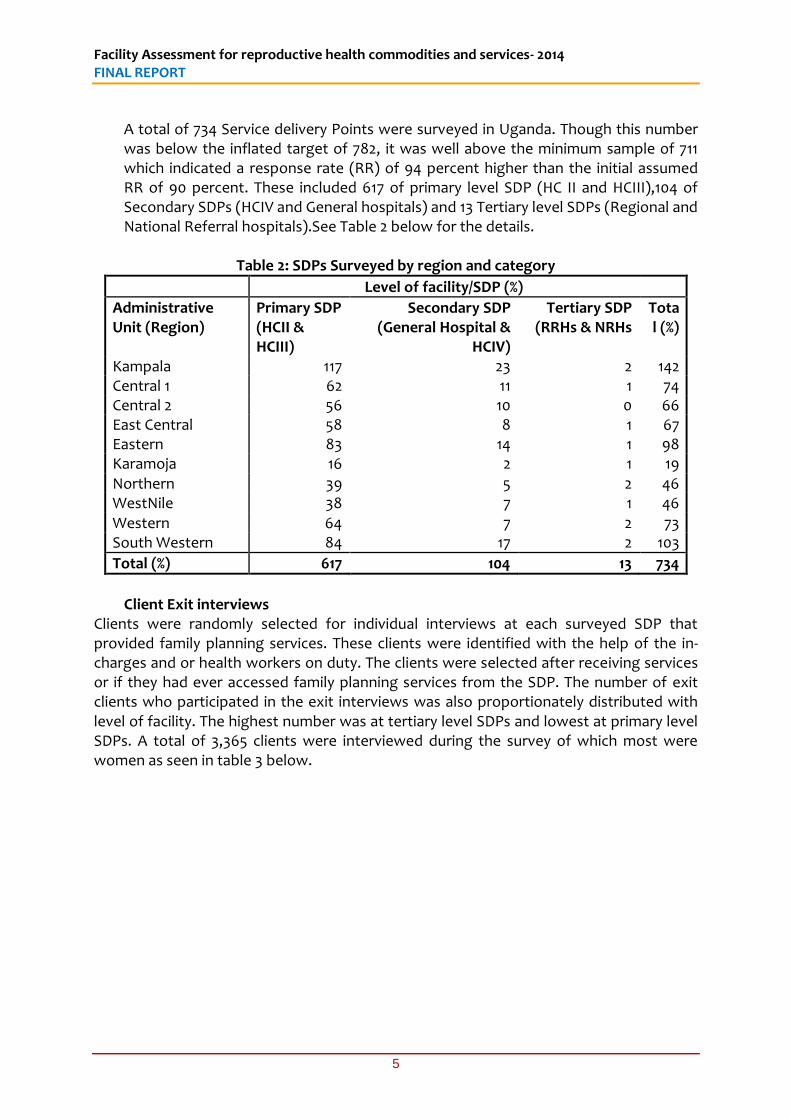
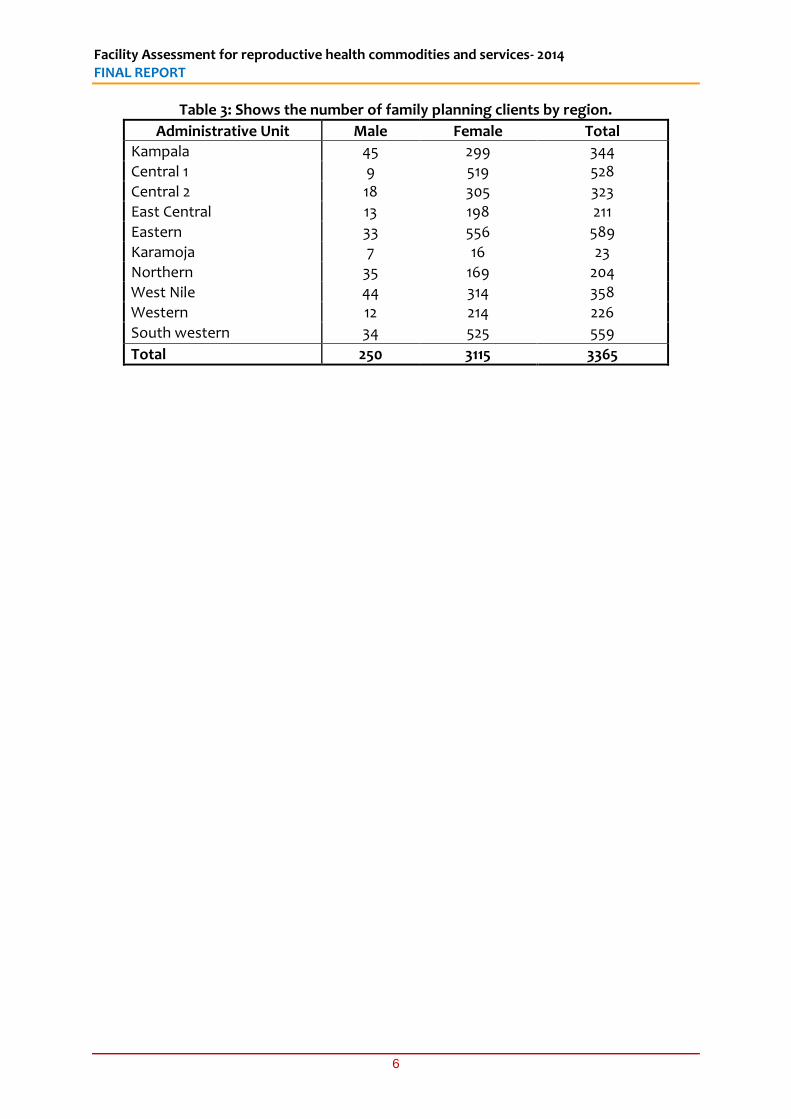
Clients were randomly selected for individual interviews at each surveyed SDP that provided family planning services. These clients were identified with the help of the in-charges and or health workers on duty. The clients were selected after receiving services or if they had ever accessed family planning services from the SDP. The number of exit clients who participated in the exit interviews was also proportionately distributed with level of facility. The highest number was at tertiary level SDPs and lowest at primary level SDPs. A total of 3,365 clients were interviewed during the survey of which most were women as seen in table 3 below.
Facility Assessment for reproductive health commodities and services- 2014 FINAL REPORT
6
Table 3: Shows the number of family planning clients by region.
Administrative Unit Male Female Total
Kampala 45 299 344
Central 1 9 519 528
Central 2 18 305 323
East Central 13 198 211
Eastern 33 556 589
Karamoja 7 16 23
Northern 35 169 204
West Nile 44 314 358
Western 12 214 226
South western 34 525 559
Total 250 3115 3365
Facility Assessment for reproductive health commodities and services- 2014 FINAL REPORT
7
1.6 Data collection tools The major objective of the facility assessment was to collect data on availability and stock-out of RH commodities at health facility level. There were two categories of data collected including: Commodity availability and Facility resources; This looked at availability of modern contraceptives, maternal medicines, stock-out rates, supply chains, existence of cold Chains, staff training in FP, ICT, staff supervision for RH, guidelines and job aids, waste disposal and charging of fees. This was collected using a standardised Health facility survey questionnaire provided by GPRHCs. The tool was slightly customised to capture some commodities relevant to the Ugandan situation such as the Maama kit, a package of simple essential utilities provided to mothers to help them receive a clean and safe delivery. Client perception and appraisal of FP services; the study also assessed the conditions of services at the facility. A Clients’ perception survey was conducted at each sampled health facility. This was intended to solicit client’s opinion about the FP services they receive. A client interview guide was used to collect client perceptions.
Pre-testing of tools; The Health facility survey questionnaire and a client interview guide were pre-tested in Wakiso district townships where five facilities were identified and assessed. Pre-testing helped the research teams to better understand the tools and improve their interpretation of questions.
1.7 Data Analysis
Data cleaning This involved a preliminary review of questionnaires in the field by the regional team leaders on a daily basis in order to ensure that errors are corrected while in the field. This was intended to allow for high quality datasets. Data entry was done using Epi-data 3.02 and exported into SPSS version 17.0 and STATA 12. Data was further cleaned using both visual and computer aided checks, based on summary statistics to identify errors, missing cases, outliers, and extremes, before the final analysis was done. Data were finally analysed using descriptive statistics frequencies, percentages, means and totals generated in STATA 10 and SPSS 17 in certain cases. Results have been presented in the table formats developed by UNFPA. The analysis was based on the Standardized GPRHCS table formats, including disaggregation by SDP, sub regions, rural and urban and management of SDPs.
1.8 Challenges during field work
i. Long distances and highly dispersed Health centres; this was partly as a result of systematic sampling which did not take into consideration access and availability of facilities. The survey teams had to contend with long distances and sometimes health facilities were hard to reach.
ii. Unavailability of health facility in-charges or facility representatives; some health facilities did not have available the in-charges or the representatives to give time
Facility Assessment for reproductive health commodities and services- 2014 FINAL REPORT
8
for interviews; this led to delays and several call backs that delayed the survey teams;
iii. Unavailability of clients for exit interviews; this was mostly experienced at the
Health centre IIs and Health centre IIIs, where clients were had to find. This increased the waiting time, given that on some days no client would report.
iv. The rainy season and bad roads; the survey was conducted in the month of
October 2014 which is a rainy season in most parts of the country. Given that most roads in the country-side are seasonal, this affected movement as some health facilities were hard to reach.
v. Slow and unfriendly response from privately owned health facilities; the responses
from the privately owned health facilities were not as prompt and timely as we would have wanted. A few cases declined to participate in the interviews and others were hesitant to cooperate until after long negotiations and convincing;
vi. Location of Health centres IIs was a big problem especially in Kampala as some of
them had shifted to different locations. A few of the facilities at HCII level in Kampala had closed and this explains the failure to meet the entire targeted samples.
1.9 Outline of the report The report is divided into five parts: First part; gives the introduction to the study where the background, the rational and objectives of the study, the organisation of the survey, methodology, sampling, data collection methods, data analysis and limitations to the survey are discussed. Second part; discusses and summarises the guidelines, protocols and laws for provision of modern contraceptives and for provision of maternal/RH medicines in Uganda. Third part; discusses the results of the survey on availability of commodities and services. This presents general information about facilities, modern contraceptives offered by facilities, availability of maternal and RH medicines, incidence of NO stock-outs of modern contraceptives, supply chain including cold chain, staff training and supervision, availability of guidelines, check-lists and job aids, use of information communication Technology (ICT) and infection prevention and control waste disposal, and charges for fees (user fees). Fourth part discusses the exit interview findings including background characteristics of clients, client’s perception of family planning service provisions, client’s appraisal of cost of family planning services provision, and client’s appraisal of cost of family planning services. Lastly Part five gives the recommendations and conclusions
Facility Assessment for reproductive health commodities and services- 2014 FINAL REPORT
9
2 NATIONAL GUIDELINES, PROTOCOLS AND LAWS
2.1 Summary of guidelines, protocols and laws for provision of modern contraceptives
The Second National Health Policy 2010 The Second National Health Policy 2010 provides a structure through which health service including Family planning methods are provided, this includes district health system [Village Health Teams (VHTs) and health facilities including HCII, HCIII, HCIV, General Hospitals (GH), Regional Referral Hospitals (RRH) and National Referral Hospital]. The health care system is further subdivided into public (government) and private health facilities with the latter comprising of Private for Profit (PFP) and Private not for Profit (PNFP). Seventy five percent of the facility-based PNFP organisations exist under four umbrella organisations: the Uganda Catholic Medical Bureau (UCMB), the Uganda Protestant Medical Bureau (UPMB), the Uganda Orthodox Medical Bureau (UOMB) and the Uganda Muslim Medical Bureau (UMMB). In some PNFP health facilities UCMB, family planning services are not provide but the facilities are expected to provide information and refer the clients to health facilities providing the required FP services. Health Sector Strategic and investment Plan (HSSIP) 2010/11-2014/15 HSSIP provides guidance on provision of family planning services as a priority and a cost effective means to lower maternal mortality rates mainly through i) reduction of the risk of exposure to pregnancy and death; ii) reduction of the incidence of abortion by averting unwanted and unplanned pregnancies; iii) averting of pregnancies that occur too early, too late or too frequently during the woman’s reproductive cycle, and those that are inadequately spaced, with ultimate outcome effect of reducing the current total fertility rate of 6.2 (UDHS 2011). As part of strategic intervention of HSSIP under cluster 4: Maternal and Child Health, the government of Uganda aims at i) reducing mortality and morbidity relating to sexual and reproductive health & rights ii) improving newborn health and survival by increasing coverage of high impact evidence based interventions iii) Scaling up and sustaining high, effective coverage of a priority package of cost-effective child survival interventions in order to reduce under five mortality. In all these interventions, family planning services have cross-cutting role in contributing to the effect of these interventions in the health service delivery structure. Specific targeted interventions include i) developing, printing and disseminating evidence based, gender sensitive IEC (including FP) materials, ii) through VHTs, creating awareness about sexual and reproductive health including pregnancy surveillance, family planning among community members with special focus on men, iii) providing integrated family planning services in all health facilities according to the level of care, iv) designing programmes to engage men in planning services and use, and v) increasing the number of health facilities providing adolescent friendly sexual and reproductive health services.
Facility Assessment for reproductive health commodities and services- 2014 FINAL REPORT
10
The Ministry of Health National Policy Guidelines and Service Standards for Sexual and Reproductive Health and Right: Under this policy document both service guidelines and service standards for sexual and reproductive health in Uganda are explicitly stated. The service policy guidelines spell out the general rules and regulations governing reproductive health services, components of reproductive health services, target and priority groups for services and basic information education and communication (IEC) for the target and priority groups. It also identifies the services, those eligible for services, the service providers, and how in-service training, logistics, supervision and evaluation activities will be planned and implemented. The service standards set out the minimum acceptable level of performance and expectations for each component of reproductive health services, expected functions of service providers and the various levels of service delivery. This policy also defines Family Planning as the practice of spacing children that are born using both natural (traditional) and modern (artificial) birth control methods. The modern methods are further sub-divided into short-term, long-term and emergency contraception methods. The goal of this policy is to provide information and services that will enable individuals and couples to decide freely and responsibly when, how often and how many children to have. Modern Family Planning Methods provided as per this policy include: a) Combined oral contraceptives (Lo-Feminal), Microgynon, Ovrette), b) Progesterone only pill (POP), c) Injectable contraceptives (Depo-medroxyprogesterone acetate (DMPA)), d) Implants, e) Intra-uterine contraceptive devices (IUCD), f) Barrier Methods (male condoms, female condoms, spermicides and diaphragms), g) Voluntary surgical contraception (Bilateral Tubal ligation and Vasectomy), h) emergency contraceptives. These are provided through existing health structure starting from VHT to the national referral hospitals. Reproductive Health Commodity Security Strategic Plan 2009/10-2013/15 This plan provides guidance for establishing and strengthening functional and institutionalized mechanisms for coordinated planning, procurement and distribution and review of reproductive health supplies including family planning methods at central, district & facility levels. It also guides how National Medical Store (NMS) supplies Reproductive health commodities including FP methods to public health facilities, Joint medical stores (JMS) to faith based health facilities and Medical Access Ltd provide to private facilities. Under this plan, the Ministry of Health intends to achieve the following objectives a) increase the contraceptive prevalence rate from 23% to 50% and reduce the unmet need for contraceptives from 40% to 5% by 2015. b) Increase the proportion of health facilities with NO stock-outs of selected RH commodities to 80% by 2015. c) Increase public sector/government budget allocation and expenditure on reproductive health commodities, including contraceptives to 80% by 2015.
Facility Assessment for reproductive health commodities and services- 2014 FINAL REPORT
11
Uganda Alternative Distribution Strategy for Contraceptives and selected Reproductive Health Commodities in Public and Private Sector 2012 ‐2016. Alternative distribution strategy for contraceptives and selected Reproductive Health Commodities was developed to overcome some distribution gap in the private sector when it was realized that Joint Medical Stores (JMS), a recognized channel of access for the private sector does not hade Family Planning commodities because of religious principles. Under this strategy, Uganda Health Marketing Group (UHMG), Reproductive Health Uganda (RHU), Program for Access and Community Education (PACE), Marie Stopes Uganda (MSU) and Uganda Private Midwives Association (UPMA) complement government efforts in distributing contraceptives and selected Reproductive Health Commodities with the objective of: i) Increasing uptake of contraceptives and other RH commodities at the public
service delivery points by 50% annually and ii) Reducing the number of service delivery points experiencing stock-outs of
contraceptives and other selected RH commodities in both the public and private sector to less than 30% in five years
Under this strategy, i) integration of Family Planning into Out Patient Department (OPD) will be strengthened, ii) Family Planning days/camps will be conducted at each Health Facility, iii) Family Planning will be integrated into none health sectors e.g. Environment, education institutions, Information, services and FP commodities will be provided at public places including places of entertainment, Hotels and lodges, salons, public transporters, universities and tertiary institutions.
2.2 Summary of guidelines, protocols and laws for provision of maternal/RH medicines Maternal and Reproductive Health medicines like any other medicines are controlled under the Uganda national drug Policy issued in 2002. The policy aims at ensuring that all drugs available to the public are of appropriate quality, safety and are efficacious. It also aims at ensuring that the essential medicines are accessible to all who need them by ensuring availability in the country and affordability. Medicinal drugs including maternal and RH medicines in the country are regulated by the National Drug Authority (NDA). The authority also controls the registration of drugs and their inclusion on to the National drugs list. The National drug procurement orders are based on this list. Most maternal and reproductive health medicines are usually not taxable whether they are destined for the private or the public sector. RH drugs for maternity and delivery are part of the essential drugs list and are therefore funded, forecasted and procured through the pharmacy division of the MoH with NMS acting as procurement agent. The NMS similarly largely manages the distribution system of the entire range of maternal and RH commodities particularly for the public sector. On the other hand, NGOs and private facilities may receive supplies from the NMS; the Joint Medical Stores (JMS) which is a substantially large non-government medical
Facility Assessment for reproductive health commodities and services- 2014 FINAL REPORT
12
store managed by the catholic and protestant religious medical bureaus. Private pharmaceutical companies are also permitted to import maternal and RH products and all sectors, private and public may procure from them. Placement of orders for maternal and RH medicines The management of supplies distribution including that of Medicines for maternal and reproductive health care is based on a dual ‘pull-push’ system since year 2010. The ‘push’ system is preferred for HCIIs and HCIIIs while for HCIVs and Hospitals, the ‘pull’ system is adopted. Under the push arrangement, medical kits are prepared at the NMS and pre-packed for delivery to HCIIs and HCIIIs. The quantification under the push system is an estimate of requirements based on past usage and the Health management information (HMIS) data that reflects client load. Under the pull system, HCIVs and hospitals raise order forms for their medicine requirements and submit them to the NMS for processing and delivery of the supplies. The Essential Medicines and Health Supplies list of Uganda (EMHSLU) of 2012 provides a guide on which RH commodities are to be situated at which level of service delivery according to service requirements stipulated for the specific level. Similarly, the Uganda Clinical Guidelines (UCG) of 2012 provides guide for patient management including prescription of medicines to end users.
Facility Assessment for reproductive health commodities and services- 2014 FINAL REPORT
13
3 SURVEY FINDINGS FOR AVAILABILITY OF COMMODITIES AND SERVICES
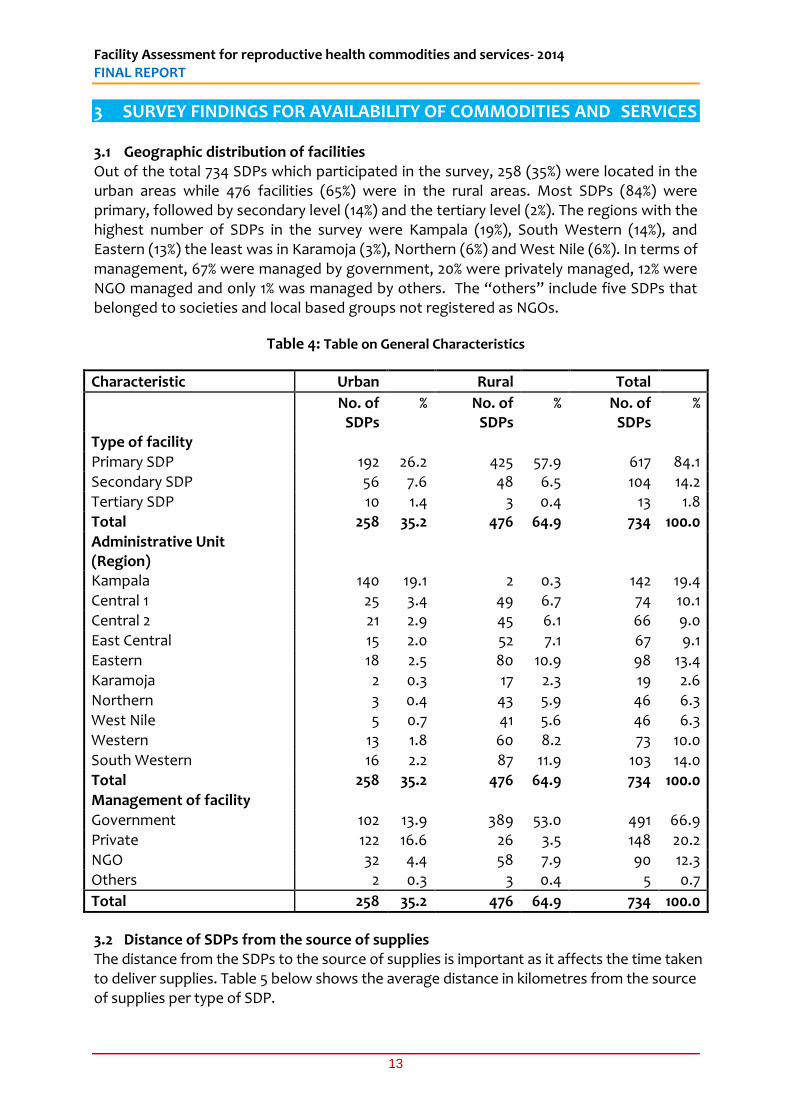
3.1 Geographic distribution of facilities Out of the total 734 SDPs which participated in the survey, 258 (35%) were located in the urban areas while 476 facilities (65%) were in the rural areas. Most SDPs (84%) were primary, followed by secondary level (14%) and the tertiary level (2%). The regions with the highest number of SDPs in the survey were Kampala (19%), South Western (14%), and Eastern (13%) the least was in Karamoja (3%), Northern (6%) and West Nile (6%). In terms of management, 67% were managed by government, 20% were privately managed, 12% were NGO managed and only 1% was managed by others. The “others” include five SDPs that belonged to societies and local based groups not registered as NGOs.
Table 4: Table on General Characteristics
Characteristic Urban Rural Total
No. of SDPs
% No. of SDPs
% No. of SDPs
%
Type of facility Primary SDP 192 26.2 425 57.9 617 84.1 Secondary SDP 56 7.6 48 6.5 104 14.2 Tertiary SDP 10 1.4 3 0.4 13 1.8 Total 258 35.2 476 64.9 734 100.0
Administrative Unit (Region)
Kampala 140 19.1 2 0.3 142 19.4 Central 1 25 3.4 49 6.7 74 10.1 Central 2 21 2.9 45 6.1 66 9.0 East Central 15 2.0 52 7.1 67 9.1 Eastern 18 2.5 80 10.9 98 13.4 Karamoja 2 0.3 17 2.3 19 2.6 Northern 3 0.4 43 5.9 46 6.3 West Nile 5 0.7 41 5.6 46 6.3 Western 13 1.8 60 8.2 73 10.0
South Western 16 2.2 87 11.9 103 14.0 Total 258 35.2 476 64.9 734 100.0 Management of facility Government 102 13.9 389 53.0 491 66.9 Private 122 16.6 26 3.5 148 20.2 NGO 32 4.4 58 7.9 90 12.3 Others 2 0.3 3 0.4 5 0.7
Total 258 35.2 476 64.9 734 100.0
3.2 Distance of SDPs from the source of supplies The distance from the SDPs to the source of supplies is important as it affects the time taken to deliver supplies. Table 5 below shows the average distance in kilometres from the source of supplies per type of SDP.
Facility Assessment for reproductive health commodities and services- 2014 FINAL REPORT
14
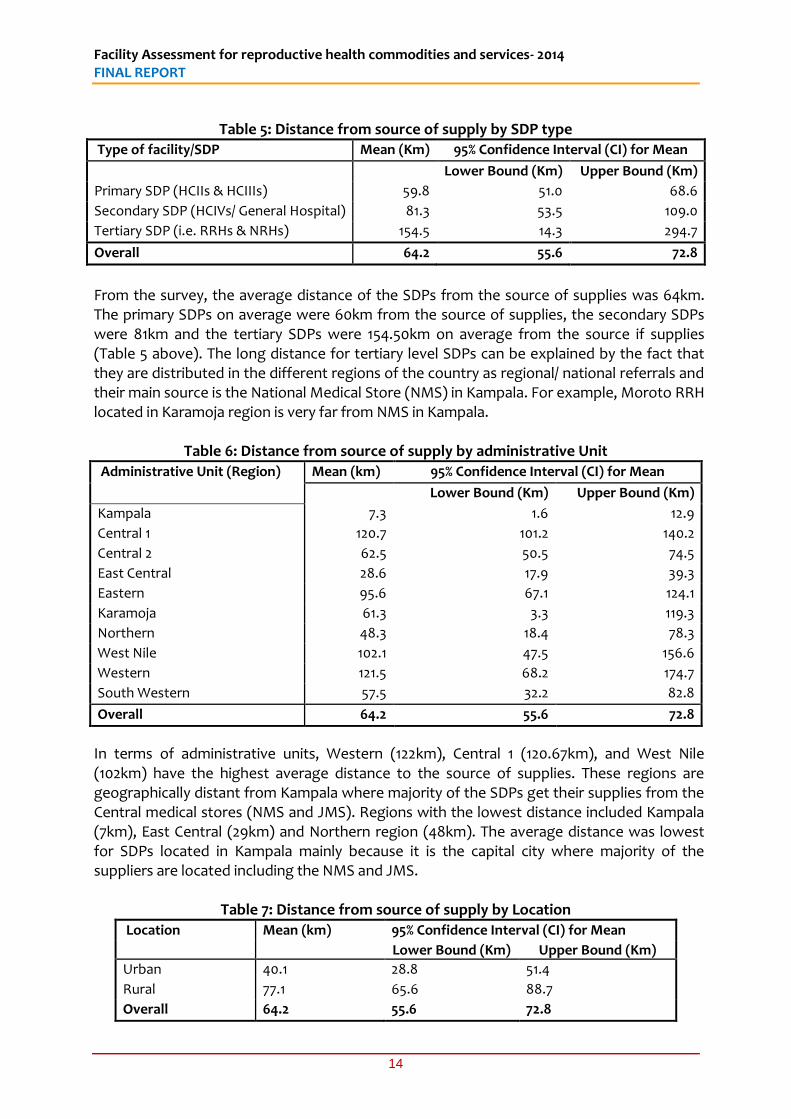
Table 5: Distance from source of supply by SDP type
Type of facility/SDP Mean (Km) 95% Confidence Interval (CI) for Mean
Lower Bound (Km) Upper Bound (Km)
Primary SDP (HCIIs & HCIIIs) 59.8 51.0 68.6
Secondary SDP (HCIVs/ General Hospital) 81.3 53.5 109.0
Tertiary SDP (i.e. RRHs & NRHs) 154.5 14.3 294.7
Overall 64.2 55.6 72.8
From the survey, the average distance of the SDPs from the source of supplies was 64km. The primary SDPs on average were 60km from the source of supplies, the secondary SDPs were 81km and the tertiary SDPs were 154.50km on average from the source if supplies (Table 5 above). The long distance for tertiary level SDPs can be explained by the fact that they are distributed in the different regions of the country as regional/ national referrals and their main source is the National Medical Store (NMS) in Kampala. For example, Moroto RRH located in Karamoja region is very far from NMS in Kampala.
Table 6: Distance from source of supply by administrative Unit
Administrative Unit (Region) Mean (km) 95% Confidence Interval (CI) for Mean
Lower Bound (Km) Upper Bound (Km)
Kampala 7.3 1.6 12.9
Central 1 120.7 101.2 140.2
Central 2 62.5 50.5 74.5
East Central 28.6 17.9 39.3
Eastern 95.6 67.1 124.1
Karamoja 61.3 3.3 119.3
Northern 48.3 18.4 78.3
West Nile 102.1 47.5 156.6
Western 121.5 68.2 174.7
South Western 57.5 32.2 82.8
Overall 64.2 55.6 72.8
In terms of administrative units, Western (122km), Central 1 (120.67km), and West Nile (102km) have the highest average distance to the source of supplies. These regions are geographically distant from Kampala where majority of the SDPs get their supplies from the Central medical stores (NMS and JMS). Regions with the lowest distance included Kampala (7km), East Central (29km) and Northern region (48km). The average distance was lowest for SDPs located in Kampala mainly because it is the capital city where majority of the suppliers are located including the NMS and JMS.
Table 7: Distance from source of supply by Location
Location Mean (km) 95% Confidence Interval (CI) for Mean
Lower Bound (Km) Upper Bound (Km)
Urban 40.1 28.8 51.4
Rural 77.1 65.6 88.7
Overall 64.2 55.6 72.8
Facility Assessment for reproductive health commodities and services- 2014 FINAL REPORT
15
The SDPs located in the urban areas had an average distance of 40km to the source of supplies, while the rural SDPs on average had 77km. The main explanation is that the urban SDPs mainly get their supplies from the National Medical Stores (NMS) which supplies to mainly government managed health facilities. Other SDPs located in the urban areas also get from private suppliers and Joint Medical Stores (JMS) which mainly supplies privately owned SDPs.
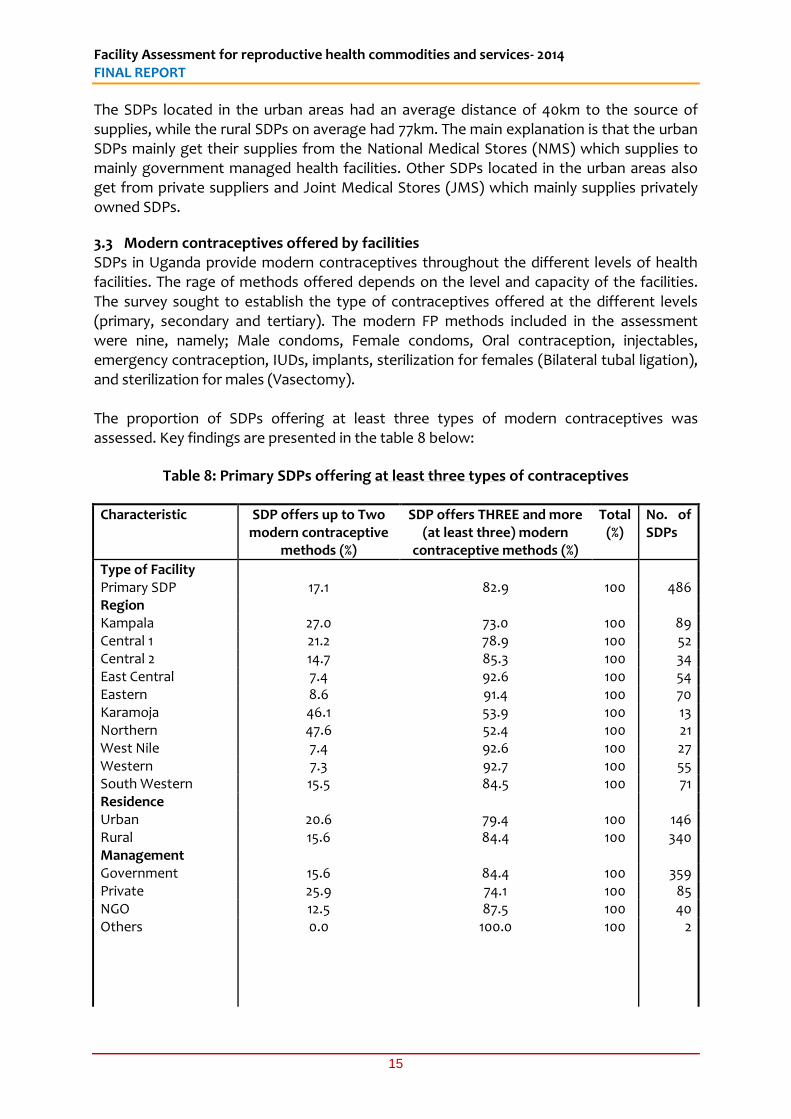
3.3 Modern contraceptives offered by facilities SDPs in Uganda provide modern contraceptives throughout the different levels of health facilities. The rage of methods offered depends on the level and capacity of the facilities. The survey sought to establish the type of contraceptives offered at the different levels (primary, secondary and tertiary). The modern FP methods included in the assessment were nine, namely; Male condoms, Female condoms, Oral contraception, injectables, emergency contraception, IUDs, implants, sterilization for females (Bilateral tubal ligation), and sterilization for males (Vasectomy). The proportion of SDPs offering at least three types of modern contraceptives was assessed. Key findings are presented in the table 8 below:
Table 8: Primary SDPs offering at least three types of contraceptives
Characteristic SDP offers up to Two modern contraceptive
methods (%)
SDP offers THREE and more (at least three) modern
contraceptive methods (%)
Total (%)
No. of SDPs
Type of Facility Primary SDP 17.1 82.9 100 486 Region Kampala 27.0 73.0 100 89 Central 1 21.2 78.9 100 52 Central 2 14.7 85.3 100 34 East Central 7.4 92.6 100 54 Eastern 8.6 91.4 100 70 Karamoja 46.1 53.9 100 13 Northern 47.6 52.4 100 21 West Nile 7.4 92.6 100 27 Western 7.3 92.7 100 55 South Western 15.5 84.5 100 71 Residence Urban 20.6 79.4 100 146 Rural 15.6 84.4 100 340 Management Government 15.6 84.4 100 359 Private 25.9 74.1 100 85 NGO 12.5 87.5 100 40 Others
0.0 100.0 100 2
Facility Assessment for reproductive health commodities and services- 2014 FINAL REPORT
16
Characteristic SDP offers up to Two modern contraceptive
methods (%)
SDP offers THREE and more (at least three) modern
contraceptive methods (%)
Total (%)
No. of SDPs
Distance from nearest warehouse/source of supplies (in Km).
≤ 4 19.5 80.5 100 82 5-9 17.9 82.1 100 67 10-14 12.5 87.5 100 40 15-19 10.5 89.5 100 19 10-24 21.7 78.3 100 23 25-29 21.7 78.3 100 23 30-34 20.8 79.2 100 24 35-39 11.1 88.9 100 9 40-44 10.0 90.0 100 10 45-49 8.3 91.7 100 12
≥ 50 19.5 80.5 100 101
Total 17.1 82.9 100 486
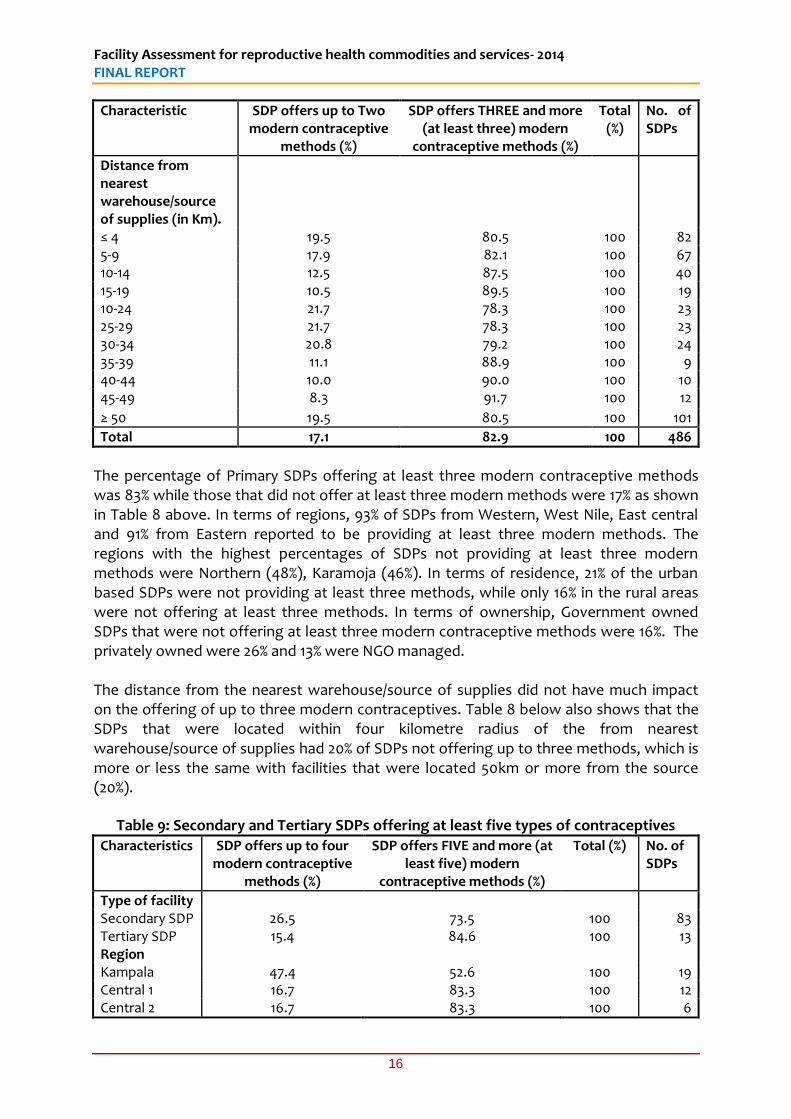
The percentage of Primary SDPs offering at least three modern contraceptive methods was 83% while those that did not offer at least three modern methods were 17% as shown in Table 8 above. In terms of regions, 93% of SDPs from Western, West Nile, East central and 91% from Eastern reported to be providing at least three modern methods. The regions with the highest percentages of SDPs not providing at least three modern methods were Northern (48%), Karamoja (46%). In terms of residence, 21% of the urban based SDPs were not providing at least three methods, while only 16% in the rural areas were not offering at least three methods. In terms of ownership, Government owned SDPs that were not offering at least three modern contraceptive methods were 16%. The privately owned were 26% and 13% were NGO managed. The distance from the nearest warehouse/source of supplies did not have much impact on the offering of up to three modern contraceptives. Table 8 below also shows that the SDPs that were located within four kilometre radius of the from nearest warehouse/source of supplies had 20% of SDPs not offering up to three methods, which is more or less the same with facilities that were located 50km or more from the source (20%).
Table 9: Secondary and Tertiary SDPs offering at least five types of contraceptives Characteristics SDP offers up to four
modern contraceptive methods (%)
SDP offers FIVE and more (at least five) modern
contraceptive methods (%)
Total (%) No. of SDPs
Type of facility Secondary SDP 26.5 73.5 100 83 Tertiary SDP 15.4 84.6 100 13 Region Kampala 47.4 52.6 100 19 Central 1 16.7 83.3 100 12 Central 2 16.7 83.3 100 6
Facility Assessment for reproductive health commodities and services- 2014 FINAL REPORT
17
East Central 25.0 75.0 100 8 Eastern 18.2 81.8 100 11 Karamoja 0.0 100.0 100 2 Northern 50.0 50.0 100 6 West Nile 16.7 83.3 100 6 Western 12.5 87.5 100 8 South Western 16.7 83.3 100 18 Residence Urban 20.0 80.0 100 55 Rural 31.7 68.3 100 41 Management Government 25.4 74.6 100 71
Private 35.3 64.7 100 17 NGO 0.0 100.0 100 7 Others 0.0 100.0 100 1
Total 25.0 75.0 100 96
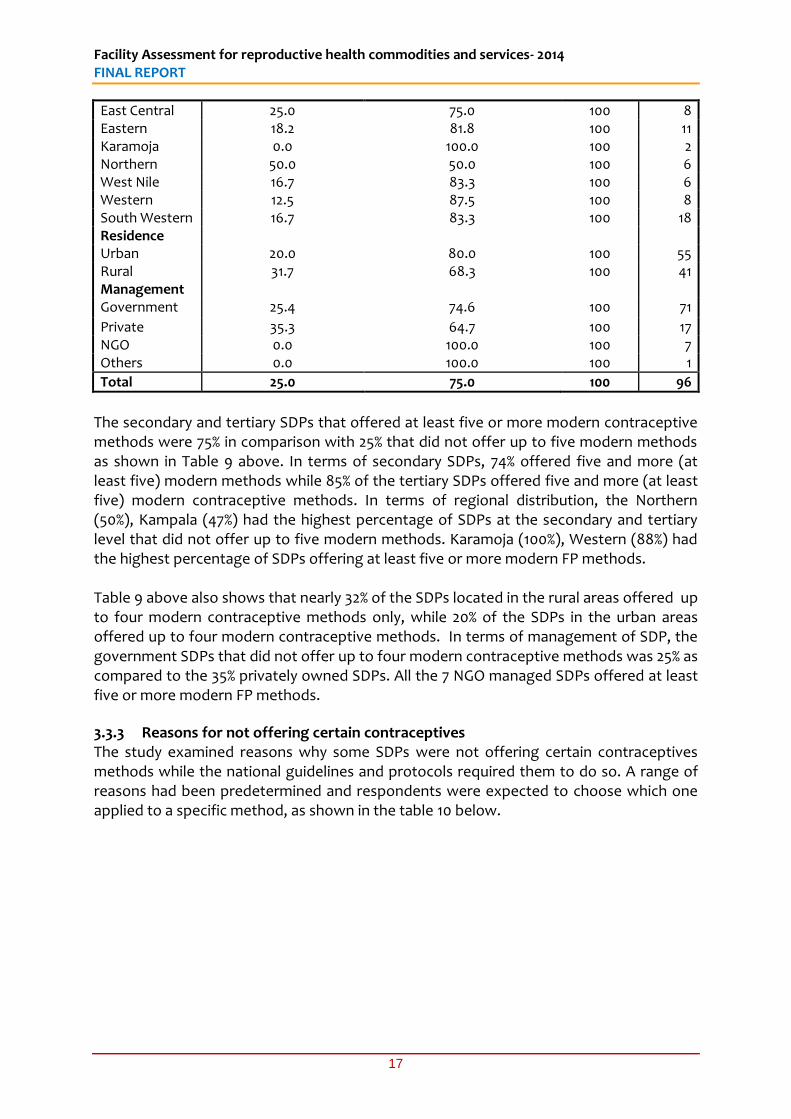
The secondary and tertiary SDPs that offered at least five or more modern contraceptive methods were 75% in comparison with 25% that did not offer up to five modern methods as shown in Table 9 above. In terms of secondary SDPs, 74% offered five and more (at least five) modern methods while 85% of the tertiary SDPs offered five and more (at least five) modern contraceptive methods. In terms of regional distribution, the Northern (50%), Kampala (47%) had the highest percentage of SDPs at the secondary and tertiary level that did not offer up to five modern methods. Karamoja (100%), Western (88%) had the highest percentage of SDPs offering at least five or more modern FP methods. Table 9 above also shows that nearly 32% of the SDPs located in the rural areas offered up to four modern contraceptive methods only, while 20% of the SDPs in the urban areas offered up to four modern contraceptive methods. In terms of management of SDP, the government SDPs that did not offer up to four modern contraceptive methods was 25% as compared to the 35% privately owned SDPs. All the 7 NGO managed SDPs offered at least five or more modern FP methods.
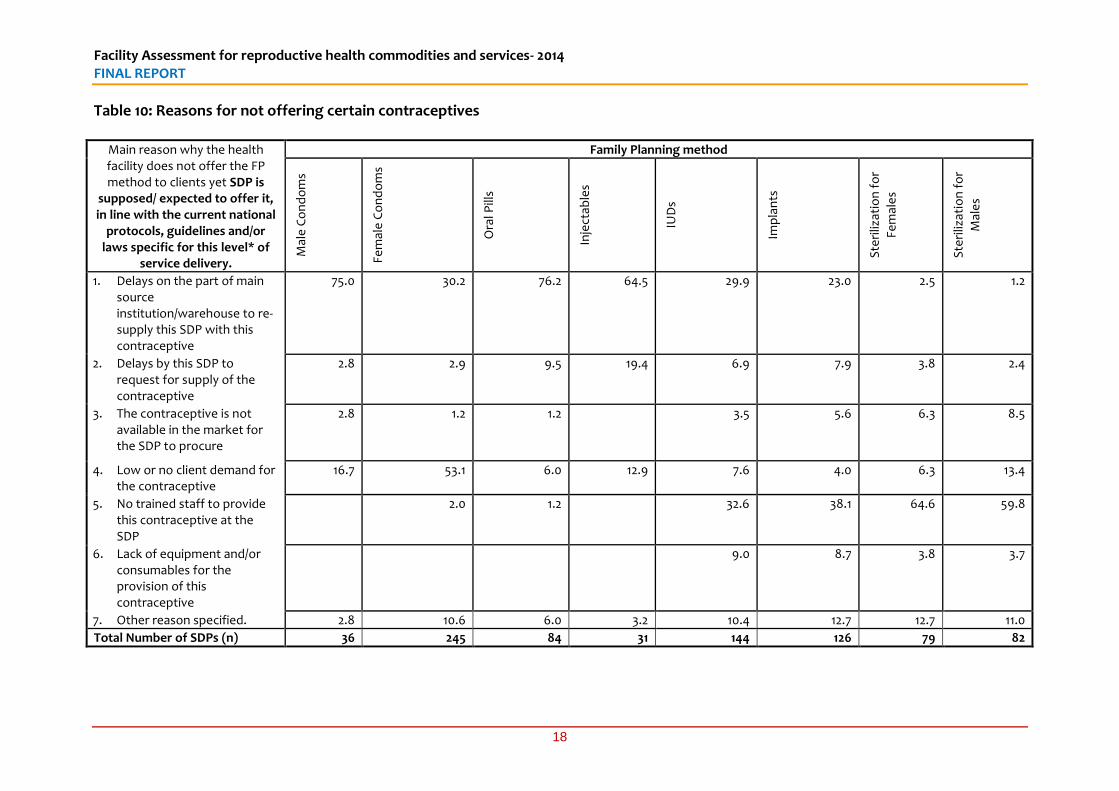
3.3.3 Reasons for not offering certain contraceptives The study examined reasons why some SDPs were not offering certain contraceptives methods while the national guidelines and protocols required them to do so. A range of reasons had been predetermined and respondents were expected to choose which one applied to a specific method, as shown in the table 10 below.
Facility Assessment for reproductive health commodities and services- 2014 FINAL REPORT
18
Table 10: Reasons for not offering certain contraceptives
Main reason why the health facility does not offer the FP method to clients yet SDP is
supposed/ expected to offer it, in line with the current national
protocols, guidelines and/or laws specific for this level* of
service delivery.
Family Planning method
Mal
e C
on
do
ms
Fem
ale
Co
nd
om
s
Ora
l Pill
s
Inje
ctab
les
IUD
s
Imp
lan
ts
Ste
riliz
atio
n f
or
Fem
ale
s
Ste
riliz
atio
n f
or
Mal
es
1. Delays on the part of main source institution/warehouse to re-supply this SDP with this contraceptive
75.0 30.2 76.2 64.5 29.9 23.0 2.5 1.2
2. Delays by this SDP to request for supply of the contraceptive
2.8 2.9 9.5 19.4 6.9 7.9 3.8 2.4
3. The contraceptive is not available in the market for the SDP to procure
2.8 1.2 1.2 3.5 5.6 6.3 8.5
4. Low or no client demand for the contraceptive
16.7 53.1 6.0 12.9 7.6 4.0 6.3 13.4
5. No trained staff to provide this contraceptive at the SDP
2.0 1.2 32.6 38.1 64.6 59.8
6. Lack of equipment and/or consumables for the provision of this contraceptive
9.0 8.7 3.8 3.7
7. Other reason specified. 2.8 10.6 6.0 3.2 10.4 12.7 12.7 11.0
Total Number of SDPs (n) 36 245 84 31 144 126 79 82
Facility Assessment for reproductive health commodities and services- 2014 FINAL REPORT
19
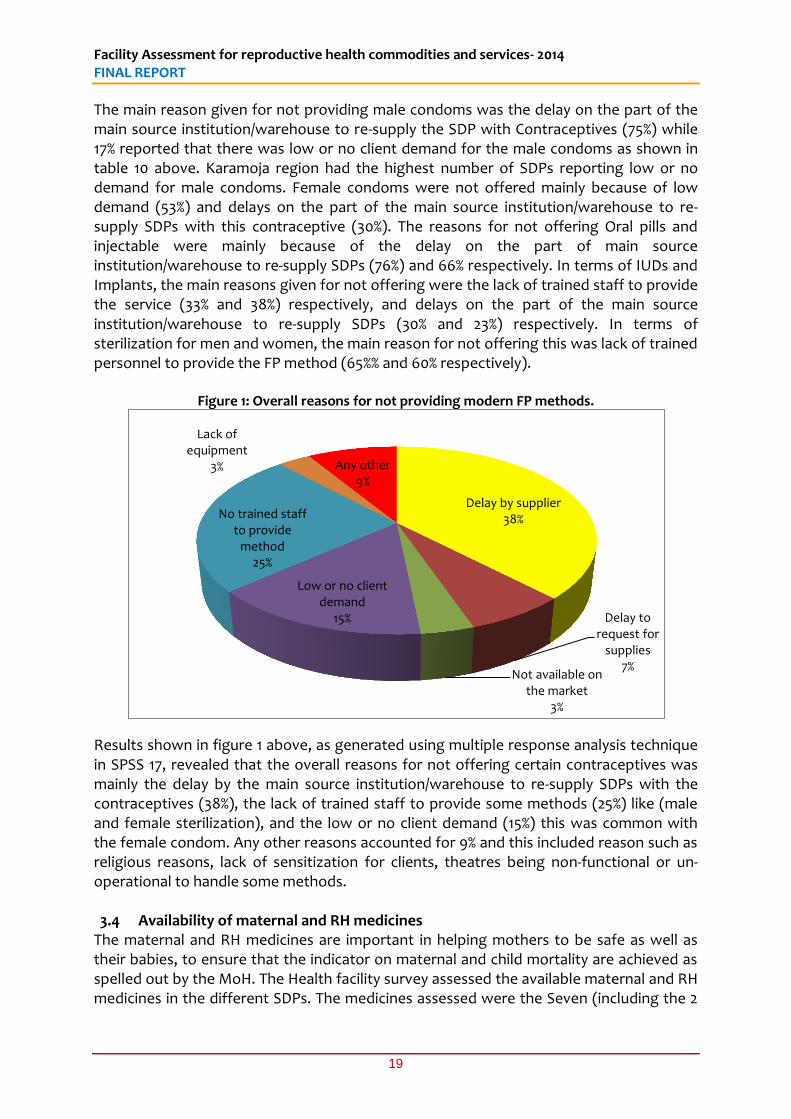
The main reason given for not providing male condoms was the delay on the part of the main source institution/warehouse to re-supply the SDP with Contraceptives (75%) while 17% reported that there was low or no client demand for the male condoms as shown in table 10 above. Karamoja region had the highest number of SDPs reporting low or no demand for male condoms. Female condoms were not offered mainly because of low demand (53%) and delays on the part of the main source institution/warehouse to re-supply SDPs with this contraceptive (30%). The reasons for not offering Oral pills and injectable were mainly because of the delay on the part of main source institution/warehouse to re-supply SDPs (76%) and 66% respectively. In terms of IUDs and Implants, the main reasons given for not offering were the lack of trained staff to provide the service (33% and 38%) respectively, and delays on the part of the main source institution/warehouse to re-supply SDPs (30% and 23%) respectively. In terms of sterilization for men and women, the main reason for not offering this was lack of trained personnel to provide the FP method (65%% and 60% respectively).
Figure 1: Overall reasons for not providing modern FP methods.
Results shown in figure 1 above, as generated using multiple response analysis technique in SPSS 17, revealed that the overall reasons for not offering certain contraceptives was mainly the delay by the main source institution/warehouse to re-supply SDPs with the contraceptives (38%), the lack of trained staff to provide some methods (25%) like (male and female sterilization), and the low or no client demand (15%) this was common with the female condom. Any other reasons accounted for 9% and this included reason such as religious reasons, lack of sensitization for clients, theatres being non-functional or un-operational to handle some methods. 3.4 Availability of maternal and RH medicines
The maternal and RH medicines are important in helping mothers to be safe as well as their babies, to ensure that the indicator on maternal and child mortality are achieved as spelled out by the MoH. The Health facility survey assessed the available maternal and RH medicines in the different SDPs. The medicines assessed were the Seven (including the 2
Delay by supplier 38%
Delay to request for
supplies 7%
Not available on the market
3%
Low or no client demand
15%
No trained staff to provide
method 25%
Lack of equipment
3% Any other 9%
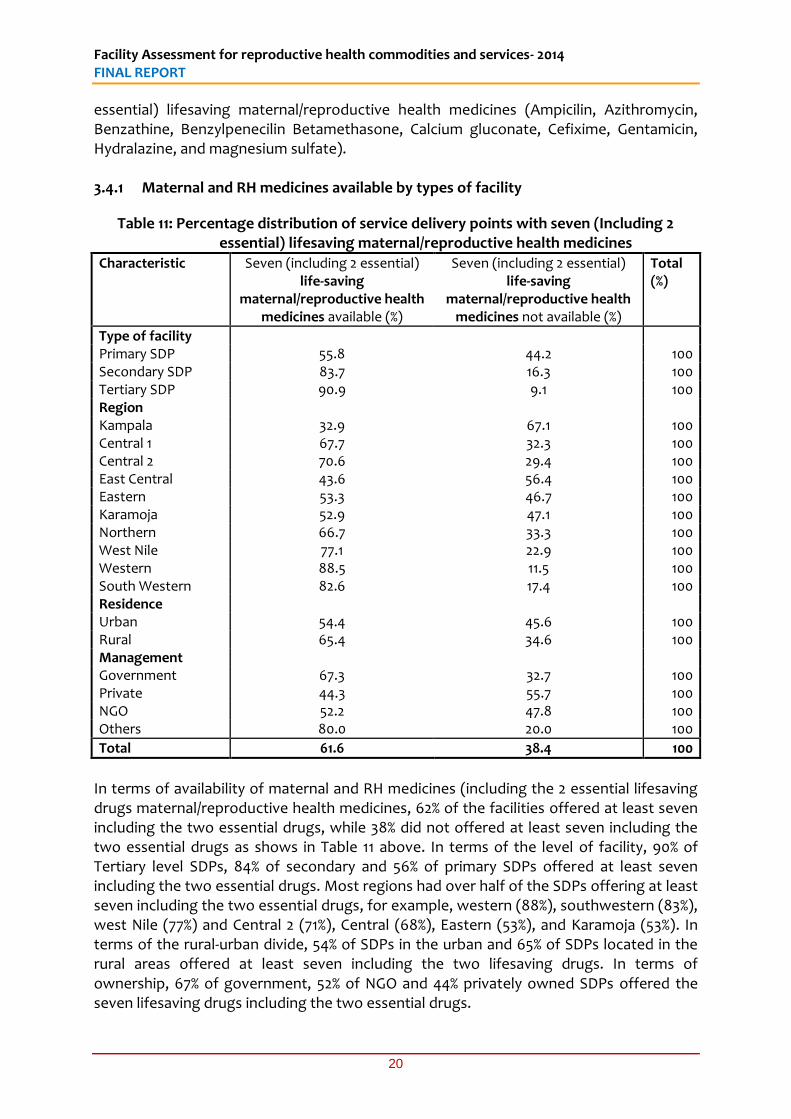
Facility Assessment for reproductive health commodities and services- 2014 FINAL REPORT
20
essential) lifesaving maternal/reproductive health medicines (Ampicilin, Azithromycin, Benzathine, Benzylpenecilin Betamethasone, Calcium gluconate, Cefixime, Gentamicin, Hydralazine, and magnesium sulfate). 3.4.1 Maternal and RH medicines available by types of facility
Table 11: Percentage distribution of service delivery points with seven (Including 2 essential) lifesaving maternal/reproductive health medicines
Characteristic Seven (including 2 essential) life-saving
maternal/reproductive health medicines available (%)
Seven (including 2 essential) life-saving
maternal/reproductive health medicines not available (%)
Total (%)
Type of facility Primary SDP 55.8 44.2 100 Secondary SDP 83.7 16.3 100 Tertiary SDP 90.9 9.1 100 Region Kampala 32.9 67.1 100 Central 1 67.7 32.3 100 Central 2 70.6 29.4 100 East Central 43.6 56.4 100 Eastern 53.3 46.7 100 Karamoja 52.9 47.1 100 Northern 66.7 33.3 100 West Nile 77.1 22.9 100 Western 88.5 11.5 100 South Western 82.6 17.4 100 Residence Urban 54.4 45.6 100 Rural 65.4 34.6 100 Management Government 67.3 32.7 100 Private 44.3 55.7 100 NGO 52.2 47.8 100 Others 80.0 20.0 100
Total 61.6 38.4 100
In terms of availability of maternal and RH medicines (including the 2 essential lifesaving drugs maternal/reproductive health medicines, 62% of the facilities offered at least seven including the two essential drugs, while 38% did not offered at least seven including the two essential drugs as shows in Table 11 above. In terms of the level of facility, 90% of Tertiary level SDPs, 84% of secondary and 56% of primary SDPs offered at least seven including the two essential drugs. Most regions had over half of the SDPs offering at least seven including the two essential drugs, for example, western (88%), southwestern (83%), west Nile (77%) and Central 2 (71%), Central (68%), Eastern (53%), and Karamoja (53%). In terms of the rural-urban divide, 54% of SDPs in the urban and 65% of SDPs located in the rural areas offered at least seven including the two lifesaving drugs. In terms of ownership, 67% of government, 52% of NGO and 44% privately owned SDPs offered the seven lifesaving drugs including the two essential drugs.
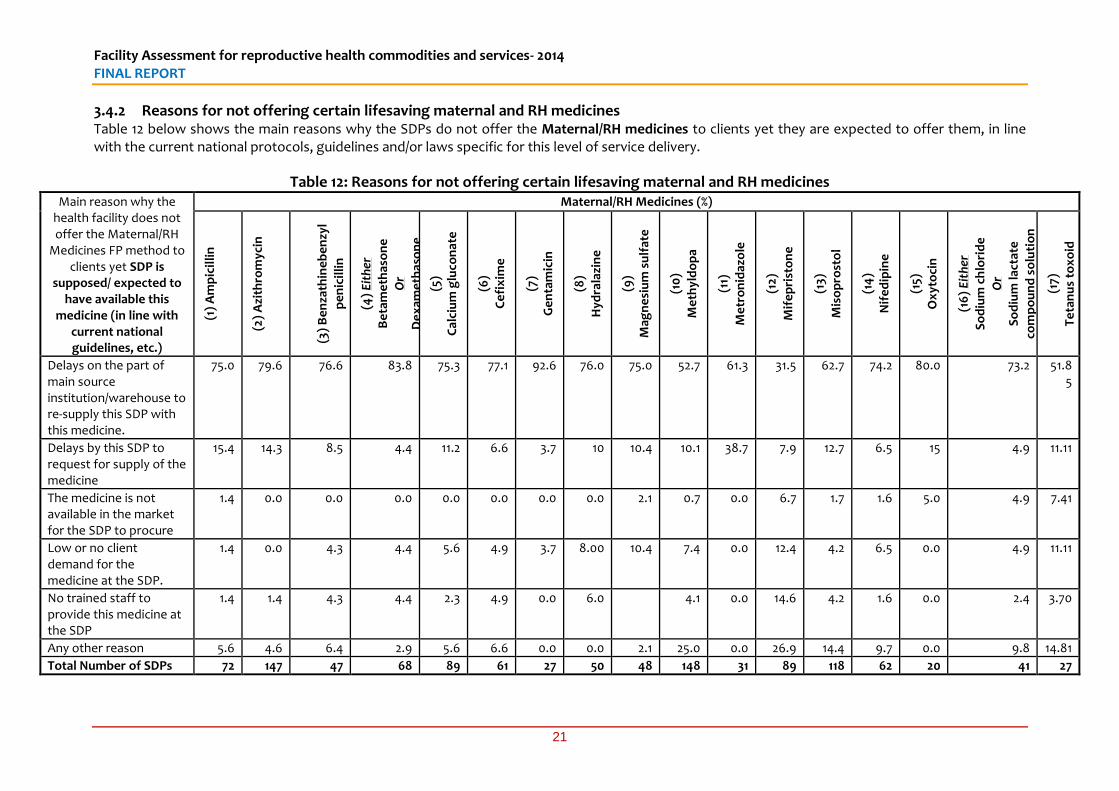
Facility Assessment for reproductive health commodities and services- 2014 FINAL REPORT
21
3.4.2 Reasons for not offering certain lifesaving maternal and RH medicines Table 12 below shows the main reasons why the SDPs do not offer the Maternal/RH medicines to clients yet they are expected to offer them, in line with the current national protocols, guidelines and/or laws specific for this level of service delivery.
Table 12: Reasons for not offering certain lifesaving maternal and RH medicines
Main reason why the health facility does not offer the Maternal/RH
Medicines FP method to clients yet SDP is
supposed/ expected to have available this
medicine (in line with current national guidelines, etc.)
Maternal/RH Medicines (%) (1
) A
mp
icil
lin
(2)
Azi
thro
myc
in
(3)
Be
nza
thin
eb
en
zyl
pe
nic
illi
n
(4)
Eit
her
Be
tam
eth
aso
ne
Or
De
xam
eth
aso
ne
(5)
Cal
ciu
m g
luco
nat
e
(6)
Ce
fix
ime
(7)
Ge
nta
mic
in
(8)
Hyd
rala
zin
e
(9)
Mag
ne
siu
m s
ulf
ate
(10
)
Me
thyl
do
pa
(11)
Me
tro
nid
azo
le
(12)
Mif
ep
rist
on
e
(13)
Mis
op
rost
ol
(14
)
Nif
ed
ipin
e
(15)
Ox
yto
cin
(16
) E
ith
er
So
diu
m c
hlo
rid
e
Or
So
diu
m la
ctat
e
com
po
un
d s
olu
tio
n
(17)
Te
tan
us
tox
oid
Delays on the part of main source institution/warehouse to re-supply this SDP with this medicine.
75.0 79.6 76.6 83.8 75.3 77.1 92.6 76.0 75.0 52.7 61.3 31.5 62.7 74.2 80.0 73.2 51.85
Delays by this SDP to request for supply of the medicine
15.4 14.3 8.5 4.4 11.2 6.6 3.7 10 10.4 10.1 38.7 7.9 12.7 6.5 15 4.9 11.11
The medicine is not available in the market for the SDP to procure
1.4 0.0 0.0 0.0 0.0 0.0 0.0 0.0 2.1 0.7 0.0 6.7 1.7 1.6 5.0 4.9 7.41
Low or no client demand for the medicine at the SDP.
1.4 0.0 4.3 4.4 5.6 4.9 3.7 8.00 10.4 7.4 0.0 12.4 4.2 6.5 0.0 4.9 11.11
No trained staff to provide this medicine at the SDP
1.4 1.4 4.3 4.4 2.3 4.9 0.0 6.0 4.1 0.0 14.6 4.2 1.6 0.0 2.4 3.70
Any other reason 5.6 4.6 6.4 2.9 5.6 6.6 0.0 0.0 2.1 25.0 0.0 26.9 14.4 9.7 0.0 9.8 14.81
Total Number of SDPs 72 147 47 68 89 61 27 50 48 148 31 89 118 62 20 41 27
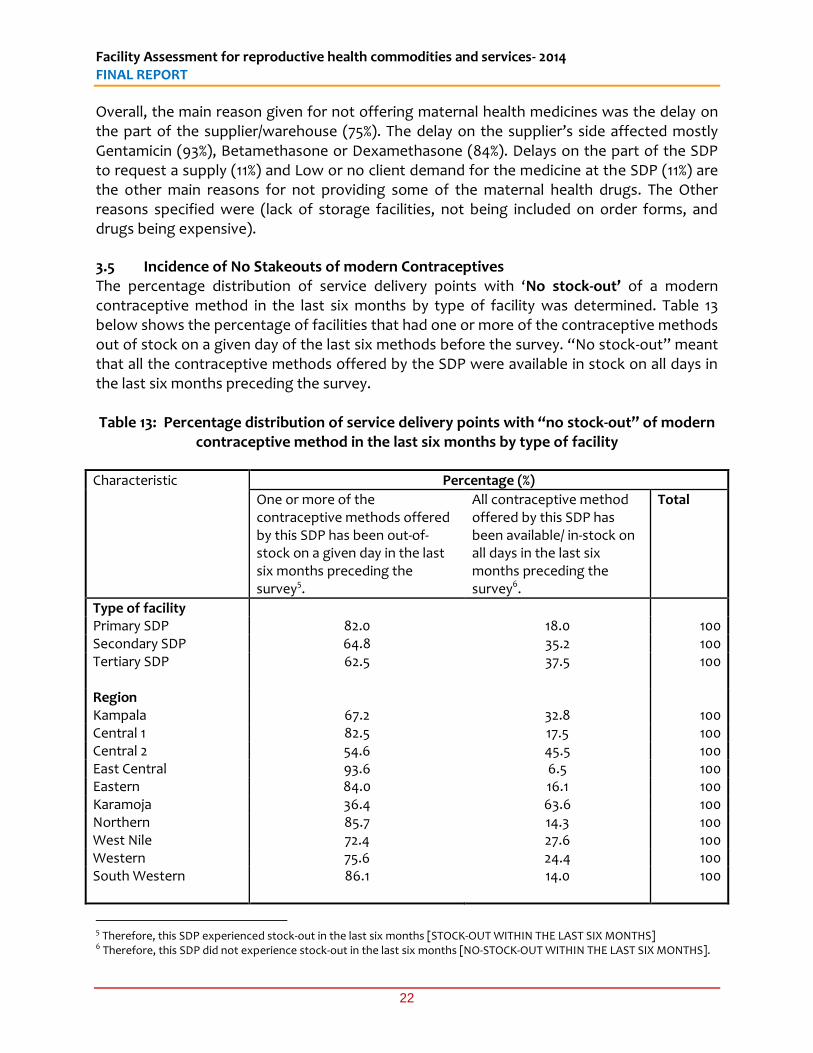
Facility Assessment for reproductive health commodities and services- 2014 FINAL REPORT
22
Overall, the main reason given for not offering maternal health medicines was the delay on the part of the supplier/warehouse (75%). The delay on the supplier’s side affected mostly Gentamicin (93%), Betamethasone or Dexamethasone (84%). Delays on the part of the SDP to request a supply (11%) and Low or no client demand for the medicine at the SDP (11%) are the other main reasons for not providing some of the maternal health drugs. The Other reasons specified were (lack of storage facilities, not being included on order forms, and drugs being expensive).
3.5 Incidence of No Stakeouts of modern Contraceptives The percentage distribution of service delivery points with ‘No stock-out’ of a modern contraceptive method in the last six months by type of facility was determined. Table 13 below shows the percentage of facilities that had one or more of the contraceptive methods out of stock on a given day of the last six methods before the survey. “No stock-out” meant that all the contraceptive methods offered by the SDP were available in stock on all days in the last six months preceding the survey. Table 13: Percentage distribution of service delivery points with “no stock-out” of modern
contraceptive method in the last six months by type of facility
Characteristic
Percentage (%)
One or more of the contraceptive methods offered by this SDP has been out-of- stock on a given day in the last six months preceding the survey5.
All contraceptive method offered by this SDP has been available/ in-stock on all days in the last six months preceding the survey6.
Total
Type of facility Primary SDP 82.0 18.0 100 Secondary SDP 64.8 35.2 100 Tertiary SDP
62.5 37.5 100
Region Kampala 67.2 32.8 100 Central 1 82.5 17.5 100 Central 2 54.6 45.5 100 East Central 93.6 6.5 100 Eastern 84.0 16.1 100 Karamoja 36.4 63.6 100 Northern 85.7 14.3 100 West Nile 72.4 27.6 100 Western 75.6 24.4 100 South Western
86.1 14.0 100
5 Therefore, this SDP experienced stock-out in the last six months [STOCK-OUT WITHIN THE LAST SIX MONTHS] 6 Therefore, this SDP did not experience stock-out in the last six months [NO-STOCK-OUT WITHIN THE LAST SIX MONTHS].
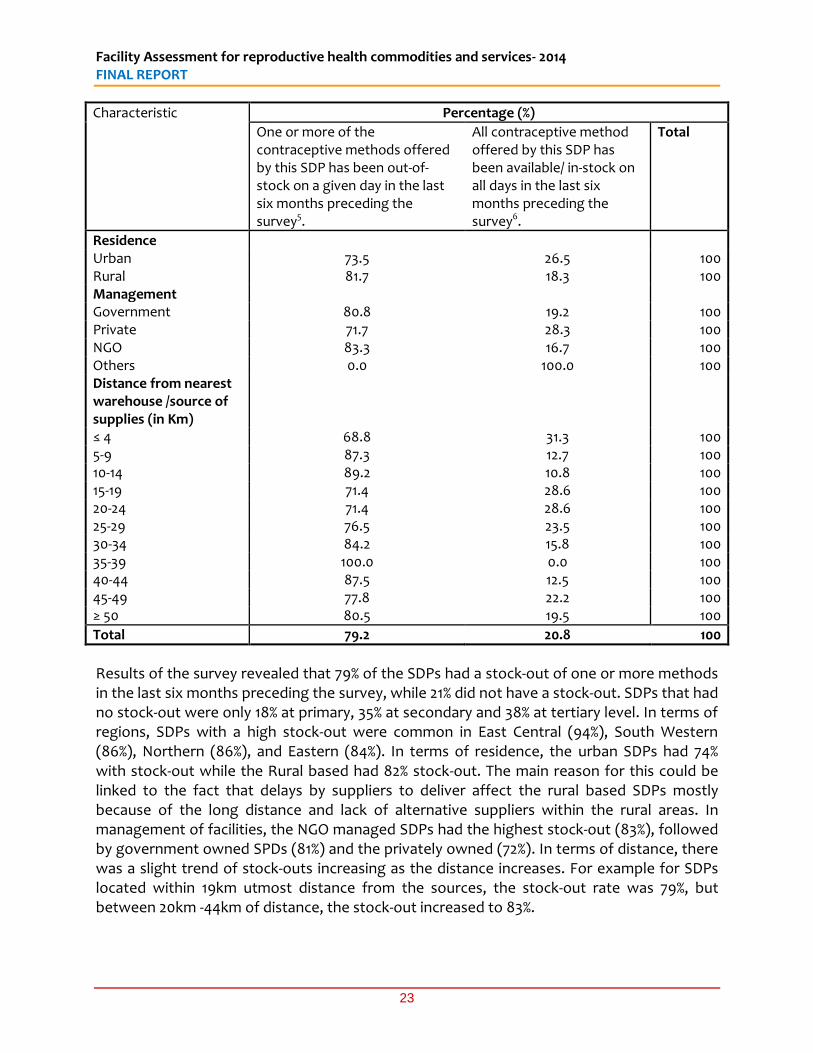
Facility Assessment for reproductive health commodities and services- 2014 FINAL REPORT
23
Characteristic
Percentage (%)
One or more of the contraceptive methods offered by this SDP has been out-of- stock on a given day in the last six months preceding the survey5.
All contraceptive method offered by this SDP has been available/ in-stock on all days in the last six months preceding the survey6.
Total
Residence Urban 73.5 26.5 100 Rural 81.7 18.3 100 Management Government 80.8 19.2 100 Private 71.7 28.3 100 NGO 83.3 16.7 100 Others 0.0 100.0 100 Distance from nearest warehouse /source of supplies (in Km)
≤ 4 68.8 31.3 100 5-9 87.3 12.7 100 10-14 89.2 10.8 100 15-19 71.4 28.6 100 20-24 71.4 28.6 100 25-29 76.5 23.5 100 30-34 84.2 15.8 100 35-39 100.0 0.0 100 40-44 87.5 12.5 100 45-49 77.8 22.2 100 ≥ 50 80.5 19.5 100
Total 79.2 20.8 100
Results of the survey revealed that 79% of the SDPs had a stock-out of one or more methods in the last six months preceding the survey, while 21% did not have a stock-out. SDPs that had no stock-out were only 18% at primary, 35% at secondary and 38% at tertiary level. In terms of regions, SDPs with a high stock-out were common in East Central (94%), South Western (86%), Northern (86%), and Eastern (84%). In terms of residence, the urban SDPs had 74% with stock-out while the Rural based had 82% stock-out. The main reason for this could be linked to the fact that delays by suppliers to deliver affect the rural based SDPs mostly because of the long distance and lack of alternative suppliers within the rural areas. In management of facilities, the NGO managed SDPs had the highest stock-out (83%), followed by government owned SPDs (81%) and the privately owned (72%). In terms of distance, there was a slight trend of stock-outs increasing as the distance increases. For example for SDPs located within 19km utmost distance from the sources, the stock-out rate was 79%, but between 20km -44km of distance, the stock-out increased to 83%.
Facility Assessment for reproductive health commodities and services- 2014 FINAL REPORT
24
3.6 Supply Chain, including cold chain The National Drug Policy, operationalised through the Uganda Pharmaceutical Sector Strategic Plan, aims at ensuring the availability and accessibility at all times of adequate quantities of affordable efficacious, safe and good quality essential medicines and health supplies to all who need them. This is a basic requirement for the delivery of the Uganda National Minimum Health Care Package (UNMHCP). Public sector national medicines procurement is mainly through National Medical Stores (NMS), a parastatal organization. NMS statute no. 12 of 1993 mandates NMS to procure and distribute essential medicines nationwide. NMS handles about 50 percent of the volume of essential medicines and health supplies for the public sector (MoH 2010); various other organizations and MoH programs also store and distribute medicines for the public sector. Examples are the Malaria Control Program, which distributes mosquito nets from the Global Fund; UNEPI, which continues to manage vaccines; and Medical Access (U) Ltd, which play a significant role in the supply chain of contraceptives and Joint Medical Store (JMS) which distributes for the PNFP sector. In this section we show the results of the survey regarding the process of supply chain management, including who determines supplies or who quantifies, who transports and whether cold chain facilities are in place and how they are powered.
3.6.1 Responsibility for ordering of supplies The national distribution system channels both contraceptives, and other RH Commodities alongside other drug supplies, through National Medical Stores. The ‘pull’ based ordering system used by some facilities aimed to reduce wastage and relies heavily on the capacity in facilities to manage orders and logistics. Table 14 below presents the persons responsible for ordering medical supplies disaggregated by characteristic (i.e level of facility, region, residence, management of SDPs).
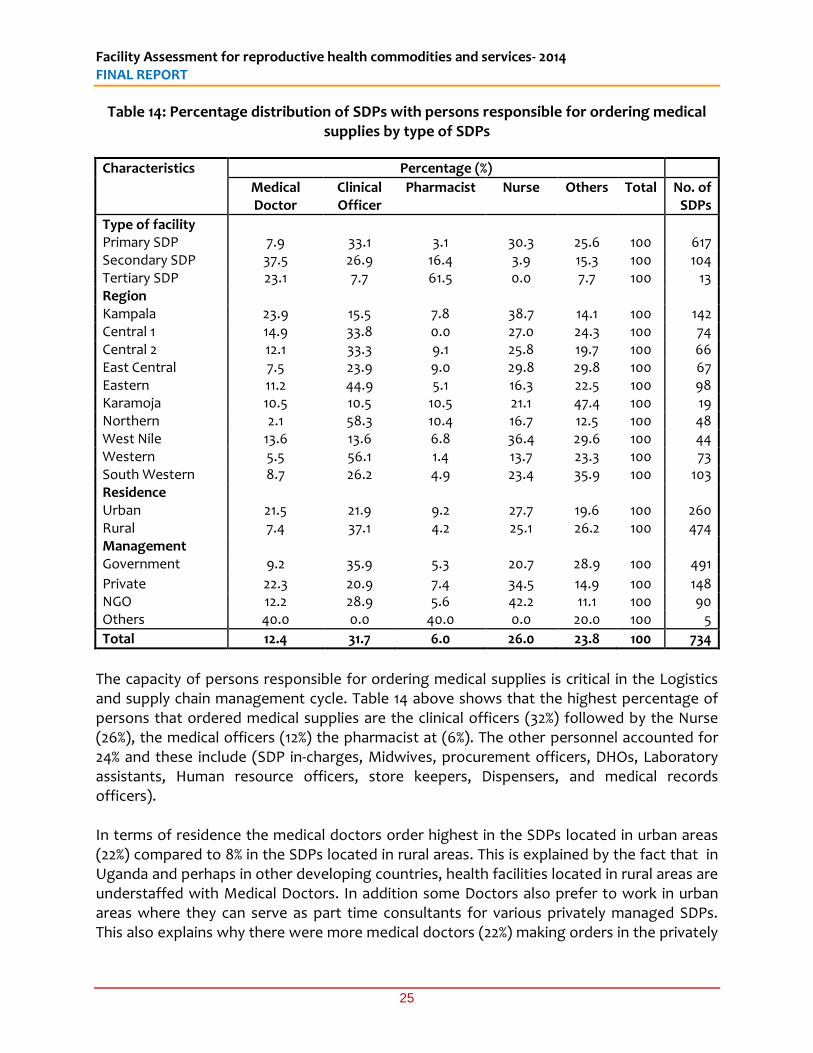
Facility Assessment for reproductive health commodities and services- 2014 FINAL REPORT
25
Table 14: Percentage distribution of SDPs with persons responsible for ordering medical supplies by type of SDPs
Characteristics Percentage (%)
Medical Doctor
Clinical Officer
Pharmacist Nurse Others Total No. of SDPs
Type of facility Primary SDP 7.9 33.1 3.1 30.3 25.6 100 617 Secondary SDP 37.5 26.9 16.4 3.9 15.3 100 104 Tertiary SDP 23.1 7.7 61.5 0.0 7.7 100 13 Region Kampala 23.9 15.5 7.8 38.7 14.1 100 142 Central 1 14.9 33.8 0.0 27.0 24.3 100 74 Central 2 12.1 33.3 9.1 25.8 19.7 100 66 East Central 7.5 23.9 9.0 29.8 29.8 100 67 Eastern 11.2 44.9 5.1 16.3 22.5 100 98 Karamoja 10.5 10.5 10.5 21.1 47.4 100 19 Northern 2.1 58.3 10.4 16.7 12.5 100 48 West Nile 13.6 13.6 6.8 36.4 29.6 100 44 Western 5.5 56.1 1.4 13.7 23.3 100 73 South Western 8.7 26.2 4.9 23.4 35.9 100 103 Residence Urban 21.5 21.9 9.2 27.7 19.6 100 260 Rural 7.4 37.1 4.2 25.1 26.2 100 474 Management Government 9.2 35.9 5.3 20.7 28.9 100 491
Private 22.3 20.9 7.4 34.5 14.9 100 148 NGO 12.2 28.9 5.6 42.2 11.1 100 90 Others 40.0 0.0 40.0 0.0 20.0 100 5
Total 12.4 31.7 6.0 26.0 23.8 100 734
The capacity of persons responsible for ordering medical supplies is critical in the Logistics and supply chain management cycle. Table 14 above shows that the highest percentage of persons that ordered medical supplies are the clinical officers (32%) followed by the Nurse (26%), the medical officers (12%) the pharmacist at (6%). The other personnel accounted for 24% and these include (SDP in-charges, Midwives, procurement officers, DHOs, Laboratory assistants, Human resource officers, store keepers, Dispensers, and medical records officers). In terms of residence the medical doctors order highest in the SDPs located in urban areas (22%) compared to 8% in the SDPs located in rural areas. This is explained by the fact that in Uganda and perhaps in other developing countries, health facilities located in rural areas are understaffed with Medical Doctors. In addition some Doctors also prefer to work in urban areas where they can serve as part time consultants for various privately managed SDPs. This also explains why there were more medical doctors (22%) making orders in the privately
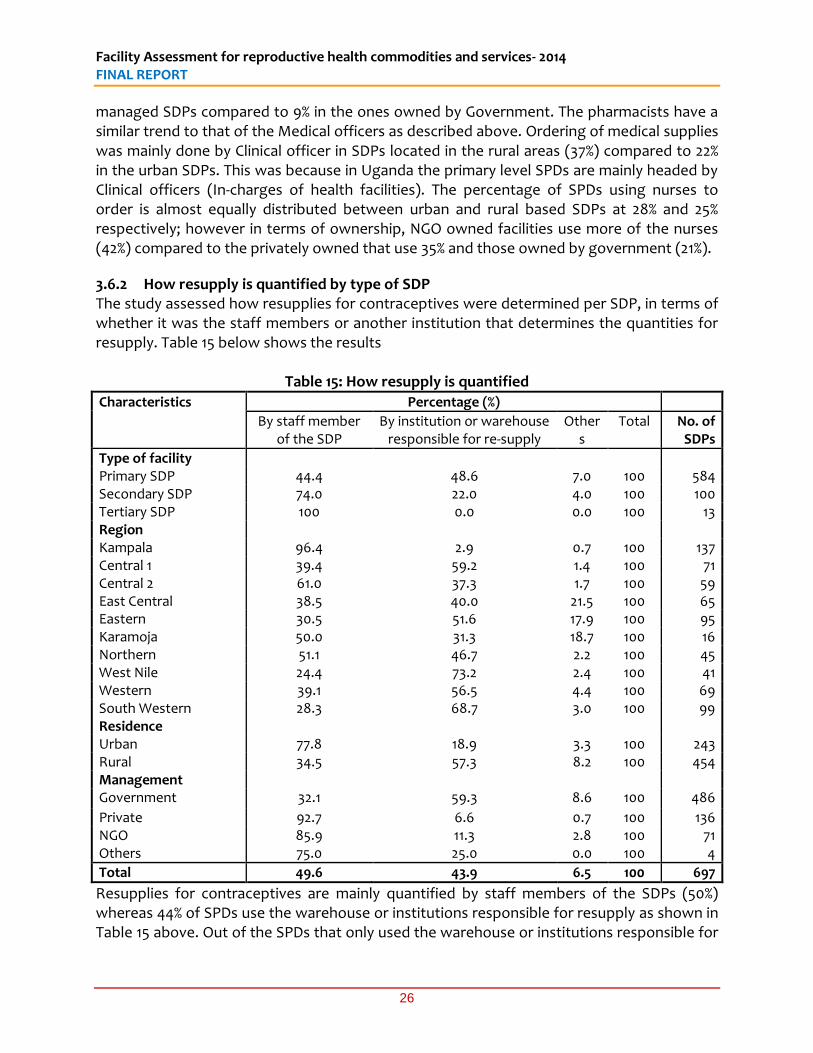
Facility Assessment for reproductive health commodities and services- 2014 FINAL REPORT
26
managed SDPs compared to 9% in the ones owned by Government. The pharmacists have a similar trend to that of the Medical officers as described above. Ordering of medical supplies was mainly done by Clinical officer in SDPs located in the rural areas (37%) compared to 22% in the urban SDPs. This was because in Uganda the primary level SPDs are mainly headed by Clinical officers (In-charges of health facilities). The percentage of SPDs using nurses to order is almost equally distributed between urban and rural based SDPs at 28% and 25% respectively; however in terms of ownership, NGO owned facilities use more of the nurses (42%) compared to the privately owned that use 35% and those owned by government (21%).
3.6.2 How resupply is quantified by type of SDP The study assessed how resupplies for contraceptives were determined per SDP, in terms of whether it was the staff members or another institution that determines the quantities for resupply. Table 15 below shows the results
Table 15: How resupply is quantified
Characteristics Percentage (%)
By staff member of the SDP
By institution or warehouse responsible for re-supply
Others
Total No. of SDPs
Type of facility Primary SDP 44.4 48.6 7.0 100 584 Secondary SDP 74.0 22.0 4.0 100 100 Tertiary SDP 100 0.0 0.0 100 13 Region Kampala 96.4 2.9 0.7 100 137 Central 1 39.4 59.2 1.4 100 71 Central 2 61.0 37.3 1.7 100 59 East Central 38.5 40.0 21.5 100 65 Eastern 30.5 51.6 17.9 100 95 Karamoja 50.0 31.3 18.7 100 16 Northern 51.1 46.7 2.2 100 45 West Nile 24.4 73.2 2.4 100 41 Western 39.1 56.5 4.4 100 69 South Western 28.3 68.7 3.0 100 99 Residence Urban 77.8 18.9 3.3 100 243 Rural 34.5 57.3 8.2 100 454 Management Government 32.1 59.3 8.6 100 486
Private 92.7 6.6 0.7 100 136 NGO 85.9 11.3 2.8 100 71 Others 75.0 25.0 0.0 100 4
Total 49.6 43.9 6.5 100 697
Resupplies for contraceptives are mainly quantified by staff members of the SDPs (50%) whereas 44% of SPDs use the warehouse or institutions responsible for resupply as shown in Table 15 above. Out of the SPDs that only used the warehouse or institutions responsible for
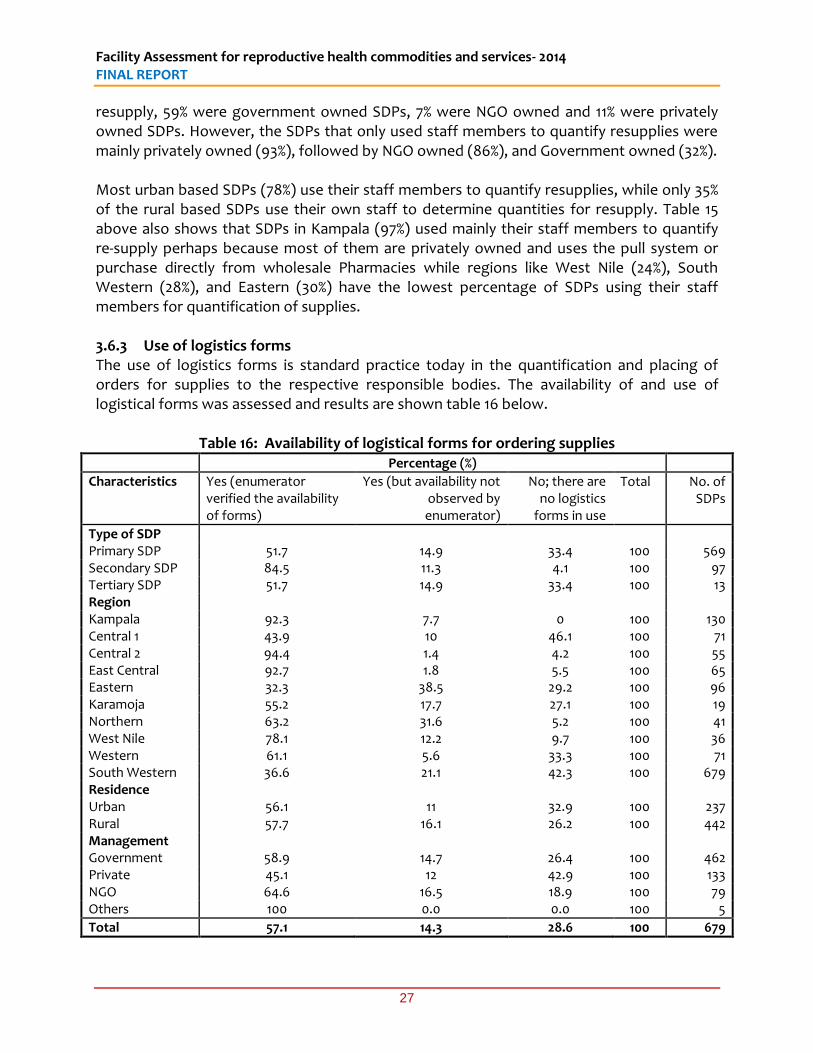
Facility Assessment for reproductive health commodities and services- 2014 FINAL REPORT
27
resupply, 59% were government owned SDPs, 7% were NGO owned and 11% were privately owned SDPs. However, the SDPs that only used staff members to quantify resupplies were mainly privately owned (93%), followed by NGO owned (86%), and Government owned (32%). Most urban based SDPs (78%) use their staff members to quantify resupplies, while only 35% of the rural based SDPs use their own staff to determine quantities for resupply. Table 15 above also shows that SDPs in Kampala (97%) used mainly their staff members to quantify re-supply perhaps because most of them are privately owned and uses the pull system or purchase directly from wholesale Pharmacies while regions like West Nile (24%), South Western (28%), and Eastern (30%) have the lowest percentage of SDPs using their staff members for quantification of supplies. 3.6.3 Use of logistics forms The use of logistics forms is standard practice today in the quantification and placing of orders for supplies to the respective responsible bodies. The availability of and use of logistical forms was assessed and results are shown table 16 below.
Table 16: Availability of logistical forms for ordering supplies Percentage (%)
Characteristics Yes (enumerator verified the availability of forms)
Yes (but availability not observed by enumerator)
No; there are no logistics
forms in use
Total No. of SDPs
Type of SDP Primary SDP 51.7 14.9 33.4 100 569 Secondary SDP 84.5 11.3 4.1 100 97 Tertiary SDP 51.7 14.9 33.4 100 13 Region Kampala 92.3 7.7 0 100 130 Central 1 43.9 10 46.1 100 71 Central 2 94.4 1.4 4.2 100 55 East Central 92.7 1.8 5.5 100 65 Eastern 32.3 38.5 29.2 100 96 Karamoja 55.2 17.7 27.1 100 19 Northern 63.2 31.6 5.2 100 41 West Nile 78.1 12.2 9.7 100 36 Western 61.1 5.6 33.3 100 71 South Western 36.6 21.1 42.3 100 679 Residence Urban 56.1 11 32.9 100 237 Rural 57.7 16.1 26.2 100 442 Management Government 58.9 14.7 26.4 100 462 Private 45.1 12 42.9 100 133 NGO 64.6 16.5 18.9 100 79 Others 100 0.0 0.0 100 5
Total 57.1 14.3 28.6 100 679
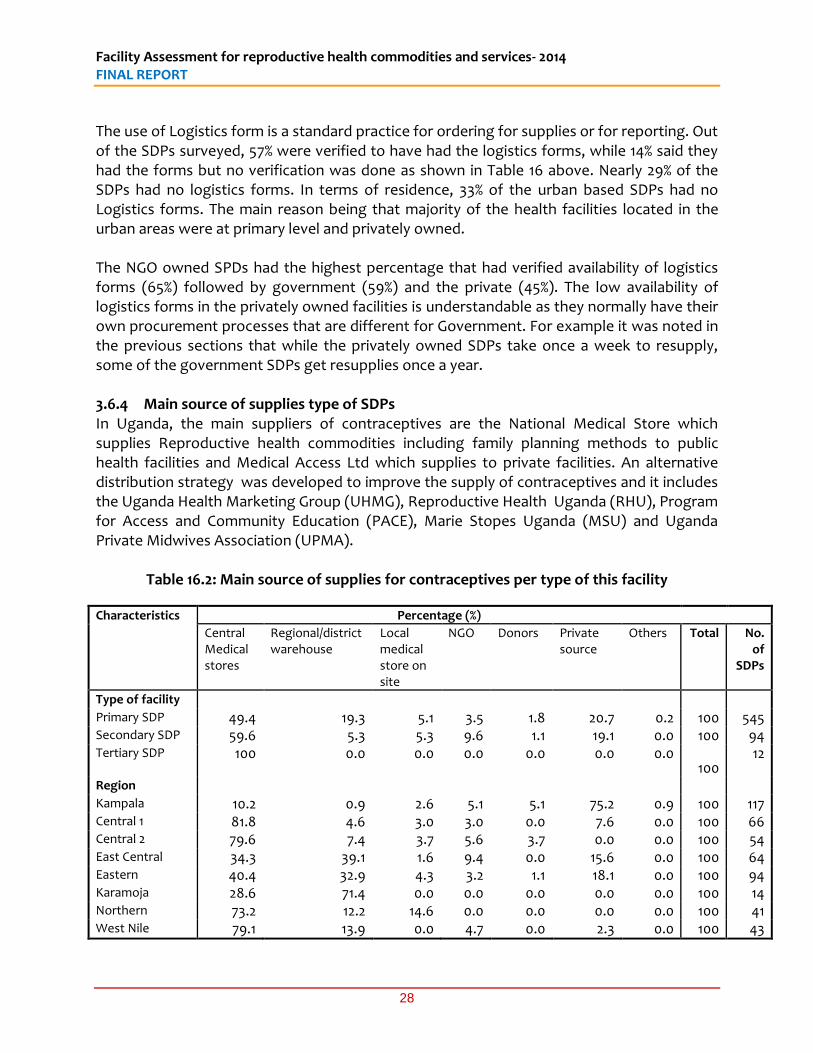
Facility Assessment for reproductive health commodities and services- 2014 FINAL REPORT
28
The use of Logistics form is a standard practice for ordering for supplies or for reporting. Out of the SDPs surveyed, 57% were verified to have had the logistics forms, while 14% said they had the forms but no verification was done as shown in Table 16 above. Nearly 29% of the SDPs had no logistics forms. In terms of residence, 33% of the urban based SDPs had no Logistics forms. The main reason being that majority of the health facilities located in the urban areas were at primary level and privately owned. The NGO owned SPDs had the highest percentage that had verified availability of logistics forms (65%) followed by government (59%) and the private (45%). The low availability of logistics forms in the privately owned facilities is understandable as they normally have their own procurement processes that are different for Government. For example it was noted in the previous sections that while the privately owned SDPs take once a week to resupply, some of the government SDPs get resupplies once a year. 3.6.4 Main source of supplies type of SDPs In Uganda, the main suppliers of contraceptives are the National Medical Store which supplies Reproductive health commodities including family planning methods to public health facilities and Medical Access Ltd which supplies to private facilities. An alternative distribution strategy was developed to improve the supply of contraceptives and it includes the Uganda Health Marketing Group (UHMG), Reproductive Health Uganda (RHU), Program for Access and Community Education (PACE), Marie Stopes Uganda (MSU) and Uganda Private Midwives Association (UPMA).
Table 16.2: Main source of supplies for contraceptives per type of this facility
Characteristics Percentage (%)
Central Medical stores
Regional/district warehouse
Local medical store on site
NGO Donors Private source
Others Total No. of
SDPs
Type of facility Primary SDP 49.4 19.3 5.1 3.5 1.8 20.7 0.2 100 545 Secondary SDP 59.6 5.3 5.3 9.6 1.1 19.1 0.0 100 94 Tertiary SDP
100 0.0 0.0 0.0 0.0 0.0 0.0 100
12
Region Kampala 10.2 0.9 2.6 5.1 5.1 75.2 0.9 100 117 Central 1 81.8 4.6 3.0 3.0 0.0 7.6 0.0 100 66 Central 2 79.6 7.4 3.7 5.6 3.7 0.0 0.0 100 54 East Central 34.3 39.1 1.6 9.4 0.0 15.6 0.0 100 64 Eastern 40.4 32.9 4.3 3.2 1.1 18.1 0.0 100 94 Karamoja 28.6 71.4 0.0 0.0 0.0 0.0 0.0 100 14 Northern 73.2 12.2 14.6 0.0 0.0 0.0 0.0 100 41 West Nile 79.1 13.9 0.0 4.7 0.0 2.3 0.0 100 43
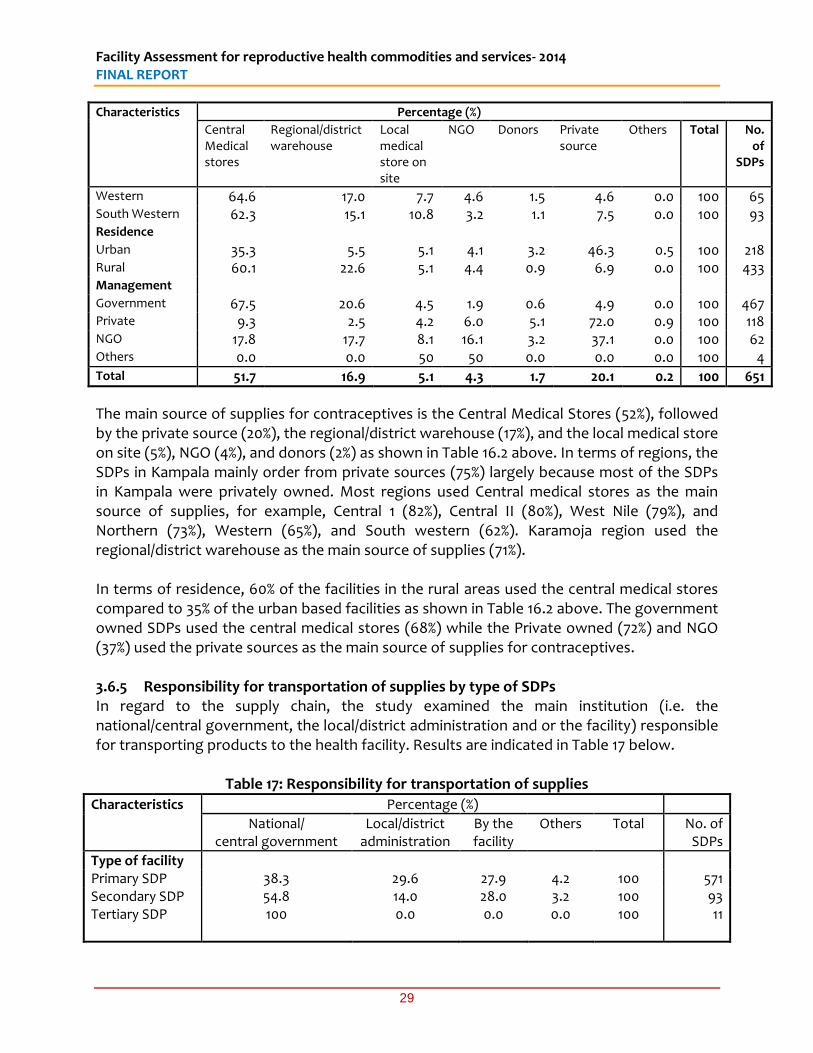
Facility Assessment for reproductive health commodities and services- 2014 FINAL REPORT
29
Characteristics Percentage (%)
Central Medical stores
Regional/district warehouse
Local medical store on site
NGO Donors Private source
Others Total No. of
SDPs
Western 64.6 17.0 7.7 4.6 1.5 4.6 0.0 100 65 South Western 62.3 15.1 10.8 3.2 1.1 7.5 0.0 100 93 Residence Urban 35.3 5.5 5.1 4.1 3.2 46.3 0.5 100 218 Rural 60.1 22.6 5.1 4.4 0.9 6.9 0.0 100 433 Management Government 67.5 20.6 4.5 1.9 0.6 4.9 0.0 100 467 Private 9.3 2.5 4.2 6.0 5.1 72.0 0.9 100 118 NGO 17.8 17.7 8.1 16.1 3.2 37.1 0.0 100 62 Others 0.0 0.0 50 50 0.0 0.0 0.0 100 4 Total 51.7 16.9 5.1 4.3 1.7 20.1 0.2 100 651
The main source of supplies for contraceptives is the Central Medical Stores (52%), followed by the private source (20%), the regional/district warehouse (17%), and the local medical store on site (5%), NGO (4%), and donors (2%) as shown in Table 16.2 above. In terms of regions, the SDPs in Kampala mainly order from private sources (75%) largely because most of the SDPs in Kampala were privately owned. Most regions used Central medical stores as the main source of supplies, for example, Central 1 (82%), Central II (80%), West Nile (79%), and Northern (73%), Western (65%), and South western (62%). Karamoja region used the regional/district warehouse as the main source of supplies (71%). In terms of residence, 60% of the facilities in the rural areas used the central medical stores compared to 35% of the urban based facilities as shown in Table 16.2 above. The government owned SDPs used the central medical stores (68%) while the Private owned (72%) and NGO (37%) used the private sources as the main source of supplies for contraceptives. 3.6.5 Responsibility for transportation of supplies by type of SDPs In regard to the supply chain, the study examined the main institution (i.e. the national/central government, the local/district administration and or the facility) responsible for transporting products to the health facility. Results are indicated in Table 17 below.
Table 17: Responsibility for transportation of supplies
Characteristics Percentage (%)
National/ central government
Local/district administration
By the facility
Others Total No. of SDPs
Type of facility Primary SDP 38.3 29.6 27.9 4.2 100 571 Secondary SDP 54.8 14.0 28.0 3.2 100 93 Tertiary SDP
100 0.0 0.0 0.0 100 11
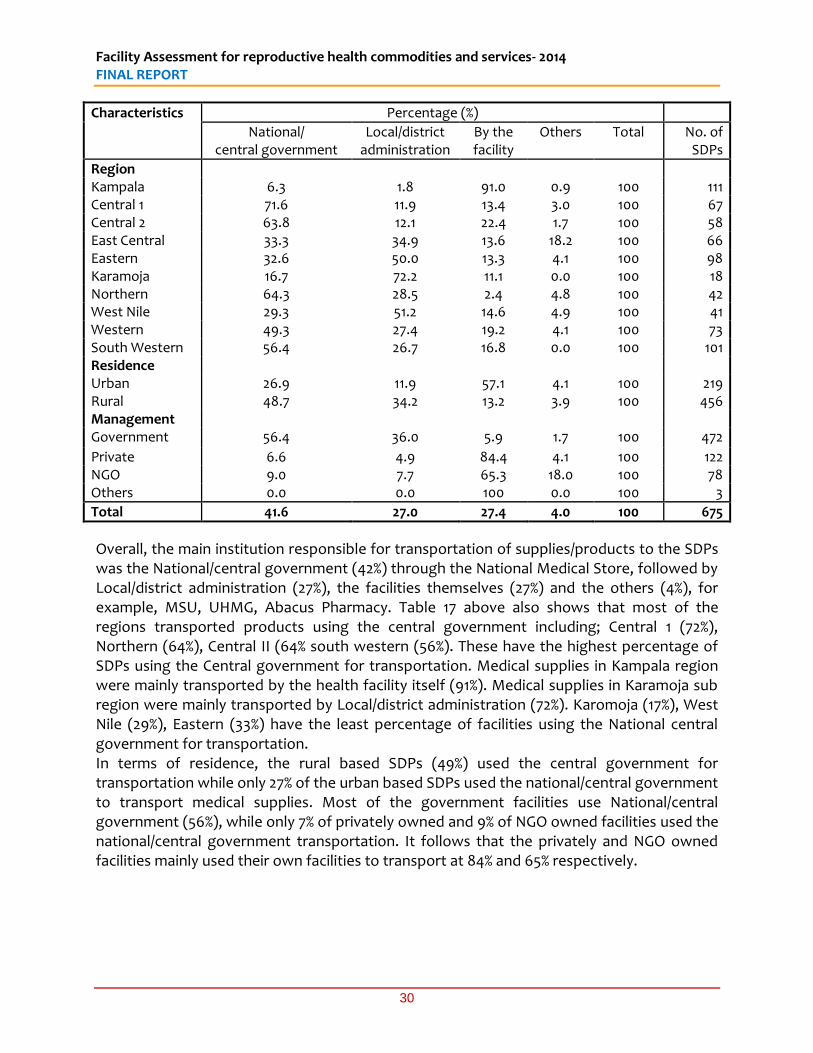
Facility Assessment for reproductive health commodities and services- 2014 FINAL REPORT
30
Characteristics Percentage (%)
National/ central government
Local/district administration
By the facility
Others Total No. of SDPs
Region Kampala 6.3 1.8 91.0 0.9 100 111 Central 1 71.6 11.9 13.4 3.0 100 67 Central 2 63.8 12.1 22.4 1.7 100 58 East Central 33.3 34.9 13.6 18.2 100 66 Eastern 32.6 50.0 13.3 4.1 100 98 Karamoja 16.7 72.2 11.1 0.0 100 18 Northern 64.3 28.5 2.4 4.8 100 42 West Nile 29.3 51.2 14.6 4.9 100 41 Western 49.3 27.4 19.2 4.1 100 73 South Western 56.4 26.7 16.8 0.0 100 101 Residence Urban 26.9 11.9 57.1 4.1 100 219 Rural 48.7 34.2 13.2 3.9 100 456 Management Government 56.4 36.0 5.9 1.7 100 472
Private 6.6 4.9 84.4 4.1 100 122 NGO 9.0 7.7 65.3 18.0 100 78 Others 0.0 0.0 100 0.0 100 3
Total 41.6 27.0 27.4 4.0 100 675
Overall, the main institution responsible for transportation of supplies/products to the SDPs was the National/central government (42%) through the National Medical Store, followed by Local/district administration (27%), the facilities themselves (27%) and the others (4%), for example, MSU, UHMG, Abacus Pharmacy. Table 17 above also shows that most of the regions transported products using the central government including; Central 1 (72%), Northern (64%), Central II (64% south western (56%). These have the highest percentage of SDPs using the Central government for transportation. Medical supplies in Kampala region were mainly transported by the health facility itself (91%). Medical supplies in Karamoja sub region were mainly transported by Local/district administration (72%). Karomoja (17%), West Nile (29%), Eastern (33%) have the least percentage of facilities using the National central government for transportation. In terms of residence, the rural based SDPs (49%) used the central government for transportation while only 27% of the urban based SDPs used the national/central government to transport medical supplies. Most of the government facilities use National/central government (56%), while only 7% of privately owned and 9% of NGO owned facilities used the national/central government transportation. It follows that the privately and NGO owned facilities mainly used their own facilities to transport at 84% and 65% respectively.
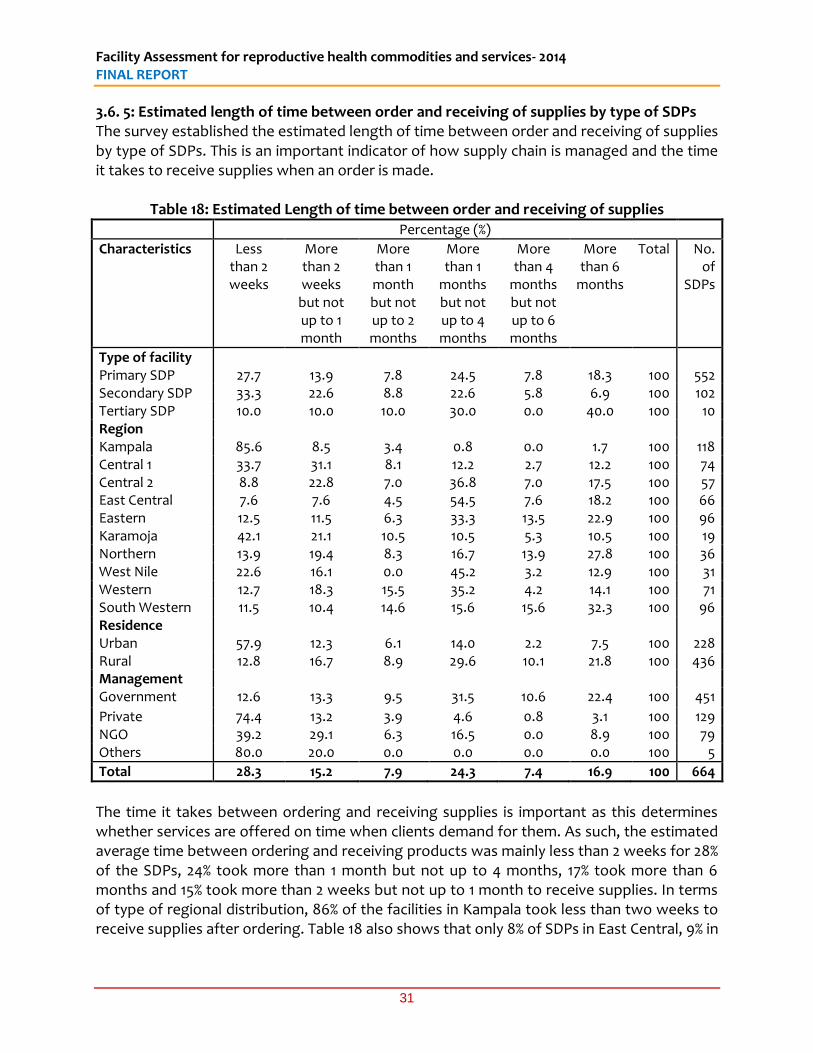
Facility Assessment for reproductive health commodities and services- 2014 FINAL REPORT
31
3.6. 5: Estimated length of time between order and receiving of supplies by type of SDPs The survey established the estimated length of time between order and receiving of supplies by type of SDPs. This is an important indicator of how supply chain is managed and the time it takes to receive supplies when an order is made.
Table 18: Estimated Length of time between order and receiving of supplies Percentage (%)
Characteristics Less than 2 weeks
More than 2 weeks
but not up to 1 month
More than 1 month but not up to 2 months
More than 1
months but not up to 4 months
More than 4
months but not up to 6 months
More than 6
months
Total No. of
SDPs
Type of facility Primary SDP 27.7 13.9 7.8 24.5 7.8 18.3 100 552 Secondary SDP 33.3 22.6 8.8 22.6 5.8 6.9 100 102 Tertiary SDP 10.0 10.0 10.0 30.0 0.0 40.0 100 10 Region Kampala 85.6 8.5 3.4 0.8 0.0 1.7 100 118 Central 1 33.7 31.1 8.1 12.2 2.7 12.2 100 74 Central 2 8.8 22.8 7.0 36.8 7.0 17.5 100 57 East Central 7.6 7.6 4.5 54.5 7.6 18.2 100 66 Eastern 12.5 11.5 6.3 33.3 13.5 22.9 100 96 Karamoja 42.1 21.1 10.5 10.5 5.3 10.5 100 19 Northern 13.9 19.4 8.3 16.7 13.9 27.8 100 36 West Nile 22.6 16.1 0.0 45.2 3.2 12.9 100 31 Western 12.7 18.3 15.5 35.2 4.2 14.1 100 71 South Western 11.5 10.4 14.6 15.6 15.6 32.3 100 96 Residence Urban 57.9 12.3 6.1 14.0 2.2 7.5 100 228 Rural 12.8 16.7 8.9 29.6 10.1 21.8 100 436 Management Government 12.6 13.3 9.5 31.5 10.6 22.4 100 451
Private 74.4 13.2 3.9 4.6 0.8 3.1 100 129 NGO 39.2 29.1 6.3 16.5 0.0 8.9 100 79 Others 80.0 20.0 0.0 0.0 0.0 0.0 100 5
Total 28.3 15.2 7.9 24.3 7.4 16.9 100 664
The time it takes between ordering and receiving supplies is important as this determines whether services are offered on time when clients demand for them. As such, the estimated average time between ordering and receiving products was mainly less than 2 weeks for 28% of the SDPs, 24% took more than 1 month but not up to 4 months, 17% took more than 6 months and 15% took more than 2 weeks but not up to 1 month to receive supplies. In terms of type of regional distribution, 86% of the facilities in Kampala took less than two weeks to receive supplies after ordering. Table 18 also shows that only 8% of SDPs in East Central, 9% in

Facility Assessment for reproductive health commodities and services- 2014 FINAL REPORT
32
Central 2 and 13% in Western regions received supplies within two weeks after an order was placed. The argument is that privately owned facilities that dominate in Kampala, take a shorter time to receive their orders because it is privately done. Additionally, 31% and 22% of government owned facilities reported to receiving supplies between one and four months and more than six months respectively. The reason for delays to receive supplies at government hospitals is attributed to the many orders received by the Central medical stores and the processing time. In terms of Urban and rural divide, 58% of the urban SDPs receive orders within two weeks while those from the rural areas that receive orders in one week are 13%. This is because most of the rural SDPs are government owned and these take a longer time to receive supplies as already mentioned. 3.6.6 Frequency of resupply by Administrative Unit How often resupplies are made was assessed and this was divided into five options from which the SDPs chose what mainly applied (Once every two weeks, once every month, once every three months, once every six months and once a year) as shown in the table 19 below.
Table 19: Frequency of resupply by type of SDPs Characteristics Percentage (%)
Once every two
weeks
Once every
month
Once every three
months
Once every six months
Once a year
Total No. of SDPs
Type of facility Primary SDP 12.3 5.2 11.1 11.1 60.3 100 522 Secondary SDP 14.6 10.4 17.7 8.3 49.0 100 96 Tertiary SDP 0.0 0.0 11.1 0.0 88.9 100 9 Region Kampala 57.5 19.2 14.9 2.1 6.3 100 94 Central 1 1.5 2.9 14.5 15.9 65.2 100 69 Central 2 8.0 6.0 10.0 20.0 56.0 100 50 East Central 2.9 0.0 9.0 6.0 82.1 100 67 Eastern 3.2 4.2 14.7 8.4 69.5 100 95 Karamoja 15.8 15.8 21.1 10.5 36.8 100 19 Northern 9.4 3.1 15.6 21.9 50.0 100 32 West Nile 2.8 2.9 5.7 2.9 85.7 100 35 Western 7.4 4.4 7.4 5.8 75.0 100 68 South Western 2.0 2.0 11.2 17.4 67.4 100 98 Urban Rural Urban 32.5 11.0 15.0 5.5 36.0 100 200 Rural 3.0 3.5 10.8 12.9 69.8 100 427 Management Government 4.8 2.9 9.1 11.3 71.9 100 442
Private 47.6 15.5 18.4 4.9 13.6 100 103 NGO 9.1 10.4 18.2 12.9 49.4 100 77 Others 20.0 0.0 60.0 20.0 0.0 100 5
Total 12.4 5.9 12.1 10.5 59.0 100 627
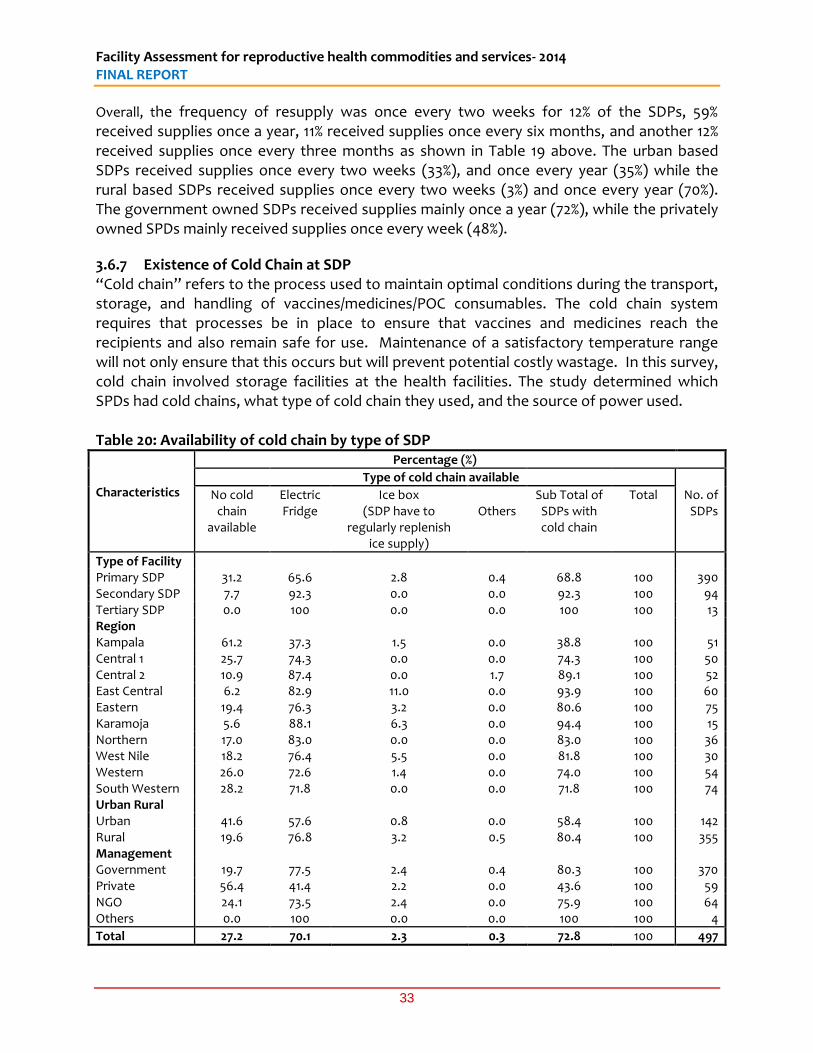
Facility Assessment for reproductive health commodities and services- 2014 FINAL REPORT
33
Overall, the frequency of resupply was once every two weeks for 12% of the SDPs, 59% received supplies once a year, 11% received supplies once every six months, and another 12% received supplies once every three months as shown in Table 19 above. The urban based SDPs received supplies once every two weeks (33%), and once every year (35%) while the rural based SDPs received supplies once every two weeks (3%) and once every year (70%). The government owned SDPs received supplies mainly once a year (72%), while the privately owned SPDs mainly received supplies once every week (48%).
3.6.7 Existence of Cold Chain at SDP “Cold chain” refers to the process used to maintain optimal conditions during the transport, storage, and handling of vaccines/medicines/POC consumables. The cold chain system requires that processes be in place to ensure that vaccines and medicines reach the recipients and also remain safe for use. Maintenance of a satisfactory temperature range will not only ensure that this occurs but will prevent potential costly wastage. In this survey, cold chain involved storage facilities at the health facilities. The study determined which SPDs had cold chains, what type of cold chain they used, and the source of power used. Table 20: Availability of cold chain by type of SDP
Characteristics
Percentage (%)
Type of cold chain available
No cold chain
available
Electric Fridge
Ice box (SDP have to
regularly replenish ice supply)
Others
Sub Total of SDPs with cold chain
Total No. of SDPs
Type of Facility Primary SDP 31.2 65.6 2.8 0.4 68.8 100 390 Secondary SDP 7.7 92.3 0.0 0.0 92.3 100 94 Tertiary SDP 0.0 100 0.0 0.0 100 100 13 Region Kampala 61.2 37.3 1.5 0.0 38.8 100 51 Central 1 25.7 74.3 0.0 0.0 74.3 100 50 Central 2 10.9 87.4 0.0 1.7 89.1 100 52 East Central 6.2 82.9 11.0 0.0 93.9 100 60 Eastern 19.4 76.3 3.2 0.0 80.6 100 75 Karamoja 5.6 88.1 6.3 0.0 94.4 100 15 Northern 17.0 83.0 0.0 0.0 83.0 100 36 West Nile 18.2 76.4 5.5 0.0 81.8 100 30 Western 26.0 72.6 1.4 0.0 74.0 100 54 South Western 28.2 71.8 0.0 0.0 71.8 100 74 Urban Rural Urban 41.6 57.6 0.8 0.0 58.4 100 142 Rural 19.6 76.8 3.2 0.5 80.4 100 355 Management Government 19.7 77.5 2.4 0.4 80.3 100 370 Private 56.4 41.4 2.2 0.0 43.6 100 59 NGO 24.1 73.5 2.4 0.0 75.9 100 64 Others 0.0 100 0.0 0.0 100 100 4
Total 27.2 70.1 2.3 0.3 72.8 100 497
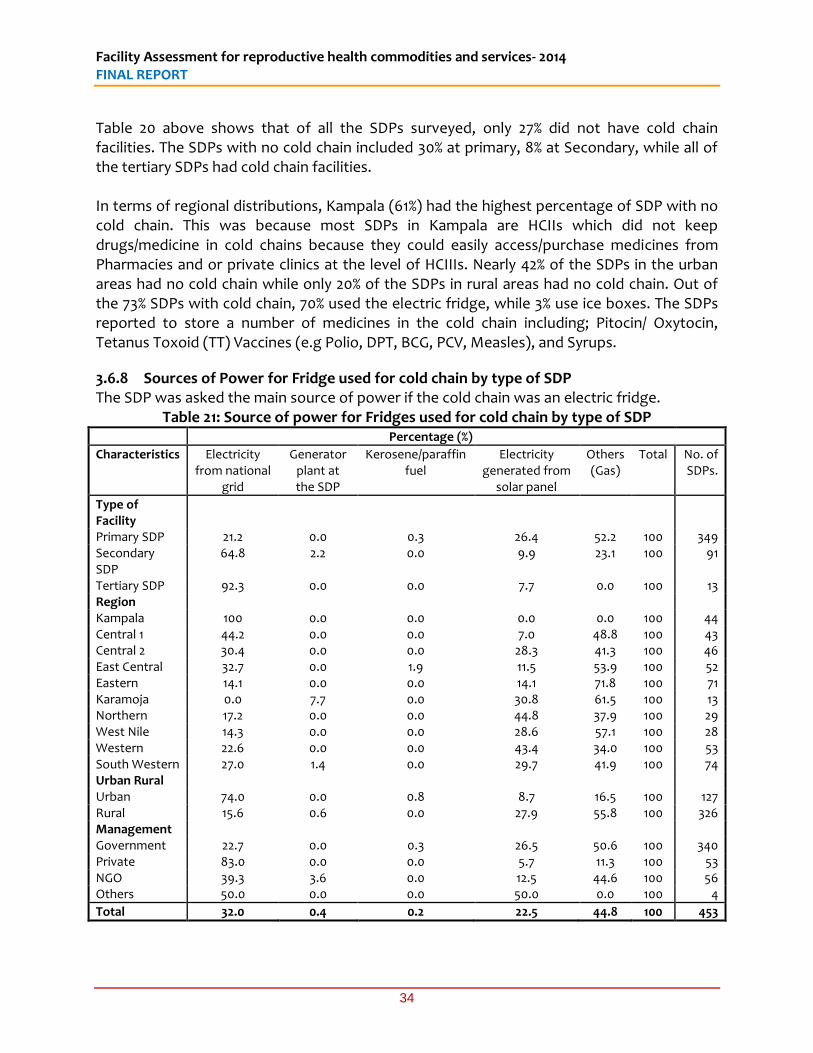
Facility Assessment for reproductive health commodities and services- 2014 FINAL REPORT
34
Table 20 above shows that of all the SDPs surveyed, only 27% did not have cold chain facilities. The SDPs with no cold chain included 30% at primary, 8% at Secondary, while all of the tertiary SDPs had cold chain facilities. In terms of regional distributions, Kampala (61%) had the highest percentage of SDP with no cold chain. This was because most SDPs in Kampala are HCIIs which did not keep drugs/medicine in cold chains because they could easily access/purchase medicines from Pharmacies and or private clinics at the level of HCIIIs. Nearly 42% of the SDPs in the urban areas had no cold chain while only 20% of the SDPs in rural areas had no cold chain. Out of the 73% SDPs with cold chain, 70% used the electric fridge, while 3% use ice boxes. The SDPs reported to store a number of medicines in the cold chain including; Pitocin/ Oxytocin, Tetanus Toxoid (TT) Vaccines (e.g Polio, DPT, BCG, PCV, Measles), and Syrups.
3.6.8 Sources of Power for Fridge used for cold chain by type of SDP The SDP was asked the main source of power if the cold chain was an electric fridge.
Table 21: Source of power for Fridges used for cold chain by type of SDP Percentage (%)
Characteristics Electricity from national
grid
Generator plant at the SDP
Kerosene/paraffin fuel
Electricity generated from
solar panel
Others (Gas)
Total No. of SDPs.
Type of Facility
Primary SDP 21.2 0.0 0.3 26.4 52.2 100 349 Secondary SDP
64.8 2.2 0.0 9.9 23.1 100 91
Tertiary SDP 92.3 0.0 0.0 7.7 0.0 100 13 Region Kampala 100 0.0 0.0 0.0 0.0 100 44 Central 1 44.2 0.0 0.0 7.0 48.8 100 43 Central 2 30.4 0.0 0.0 28.3 41.3 100 46 East Central 32.7 0.0 1.9 11.5 53.9 100 52 Eastern 14.1 0.0 0.0 14.1 71.8 100 71 Karamoja 0.0 7.7 0.0 30.8 61.5 100 13 Northern 17.2 0.0 0.0 44.8 37.9 100 29 West Nile 14.3 0.0 0.0 28.6 57.1 100 28 Western 22.6 0.0 0.0 43.4 34.0 100 53 South Western 27.0 1.4 0.0 29.7 41.9 100 74 Urban Rural Urban 74.0 0.0 0.8 8.7 16.5 100 127 Rural 15.6 0.6 0.0 27.9 55.8 100 326 Management Government 22.7 0.0 0.3 26.5 50.6 100 340 Private 83.0 0.0 0.0 5.7 11.3 100 53 NGO 39.3 3.6 0.0 12.5 44.6 100 56 Others 50.0 0.0 0.0 50.0 0.0 100 4
Total 32.0 0.4 0.2 22.5 44.8 100 453
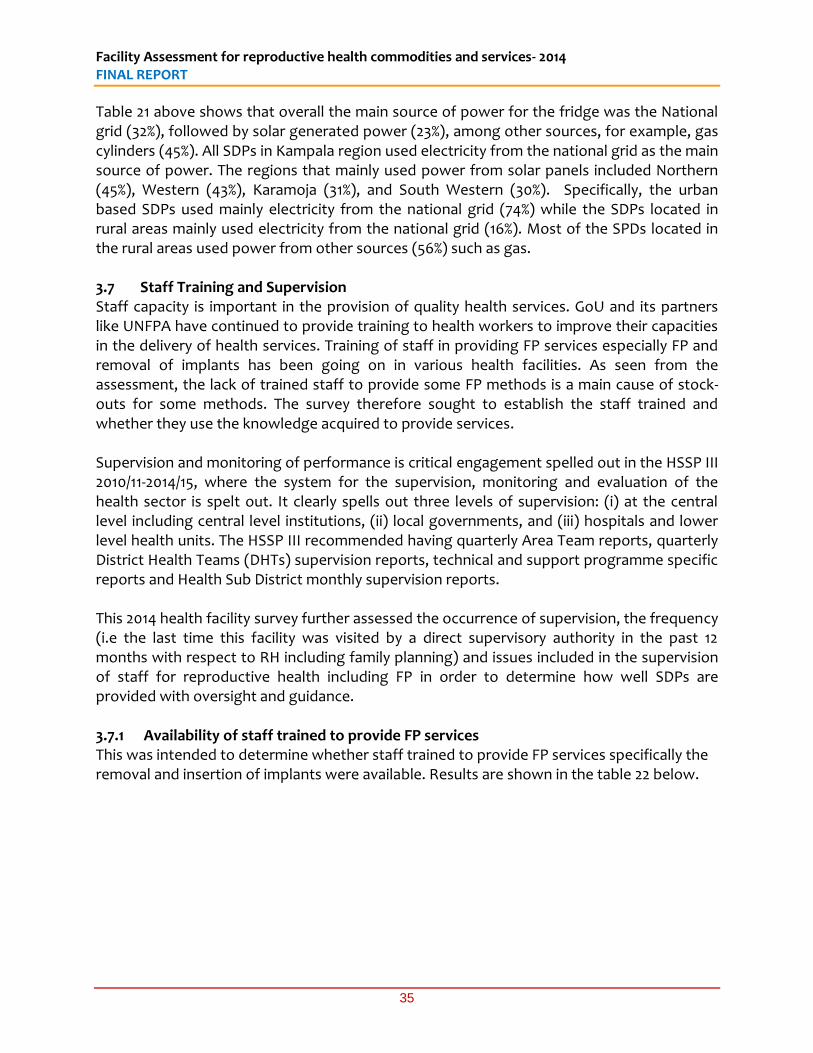
Facility Assessment for reproductive health commodities and services- 2014 FINAL REPORT
35
Table 21 above shows that overall the main source of power for the fridge was the National grid (32%), followed by solar generated power (23%), among other sources, for example, gas cylinders (45%). All SDPs in Kampala region used electricity from the national grid as the main source of power. The regions that mainly used power from solar panels included Northern (45%), Western (43%), Karamoja (31%), and South Western (30%). Specifically, the urban based SDPs used mainly electricity from the national grid (74%) while the SDPs located in rural areas mainly used electricity from the national grid (16%). Most of the SPDs located in the rural areas used power from other sources (56%) such as gas. 3.7 Staff Training and Supervision Staff capacity is important in the provision of quality health services. GoU and its partners like UNFPA have continued to provide training to health workers to improve their capacities in the delivery of health services. Training of staff in providing FP services especially FP and removal of implants has been going on in various health facilities. As seen from the assessment, the lack of trained staff to provide some FP methods is a main cause of stock-outs for some methods. The survey therefore sought to establish the staff trained and whether they use the knowledge acquired to provide services. Supervision and monitoring of performance is critical engagement spelled out in the HSSP III 2010/11-2014/15, where the system for the supervision, monitoring and evaluation of the health sector is spelt out. It clearly spells out three levels of supervision: (i) at the central level including central level institutions, (ii) local governments, and (iii) hospitals and lower level health units. The HSSP III recommended having quarterly Area Team reports, quarterly District Health Teams (DHTs) supervision reports, technical and support programme specific reports and Health Sub District monthly supervision reports. This 2014 health facility survey further assessed the occurrence of supervision, the frequency (i.e the last time this facility was visited by a direct supervisory authority in the past 12 months with respect to RH including family planning) and issues included in the supervision of staff for reproductive health including FP in order to determine how well SDPs are provided with oversight and guidance. 3.7.1 Availability of staff trained to provide FP services This was intended to determine whether staff trained to provide FP services specifically the removal and insertion of implants were available. Results are shown in the table 22 below.

Facility Assessment for reproductive health commodities and services- 2014 FINAL REPORT
36
Table 22: Percentage of SDPs with staff trained to provide FP services including insertion and removal of Implants
Percentage of SDPs with staff trained
Number of SDPs
Characteristic To provide
FP services
For the insertion and removal of
Implants
With staff trained to provide FP
services
With staff members trained for the insertion and removal of implants
Facility type
Primary SDP 78.9 49.8 470 389
Secondary SDP 94.1 83.2 95 92
Tertiary SDP 100 100 13 13
Region Kampala 71.3 69.1 97 94
Central 1 84.9 84.9 62 62
Central 2 91.7 91.7 55 55
East Central 89.4 62.1 59 41
Eastern 88.5 57.3 85 55
Karamoja 83.3 83.3 15 15
Northern 87.0 86.7 40 40
West Nile 83.3 83.3 35 35
Western 72.9 60.0 51 42
South Western 77.5 53.9 79 55
Residence Urban 78.1 72.9 193 180
Rural 83.3 68.1 385 314
Management Government 85.6 71.8 416 348
Private 67.6 64.0 94 89
NGO 82.3 69.6 65 55
Others 60.0 40.0 3 2
Total 81.5 69.8 578 494
Table 22 above shows that overall, out of the total 578 SDPs (82%) which had staff trained to provide family planning services, a total of 494 SDPs (70%) had staff trained for the insertion and removal of implants. All the tertiary level facilities had staff trained in provision of FP services and insertion and removal of implants. At the primary level, out of the nearly 79 percent staff trained to provide FP services, 50% were trained to insert and remove implants.. In all regions, most facilities (over 50%) had staff trained to provide FP services including insertion and removal of implants. In the Eastern region, the difference between percentage of staff trained to provide FP services (89%), and insertion and removal of implants (57%) was highest (31%), followed by East Central (27%) and South West (24%).
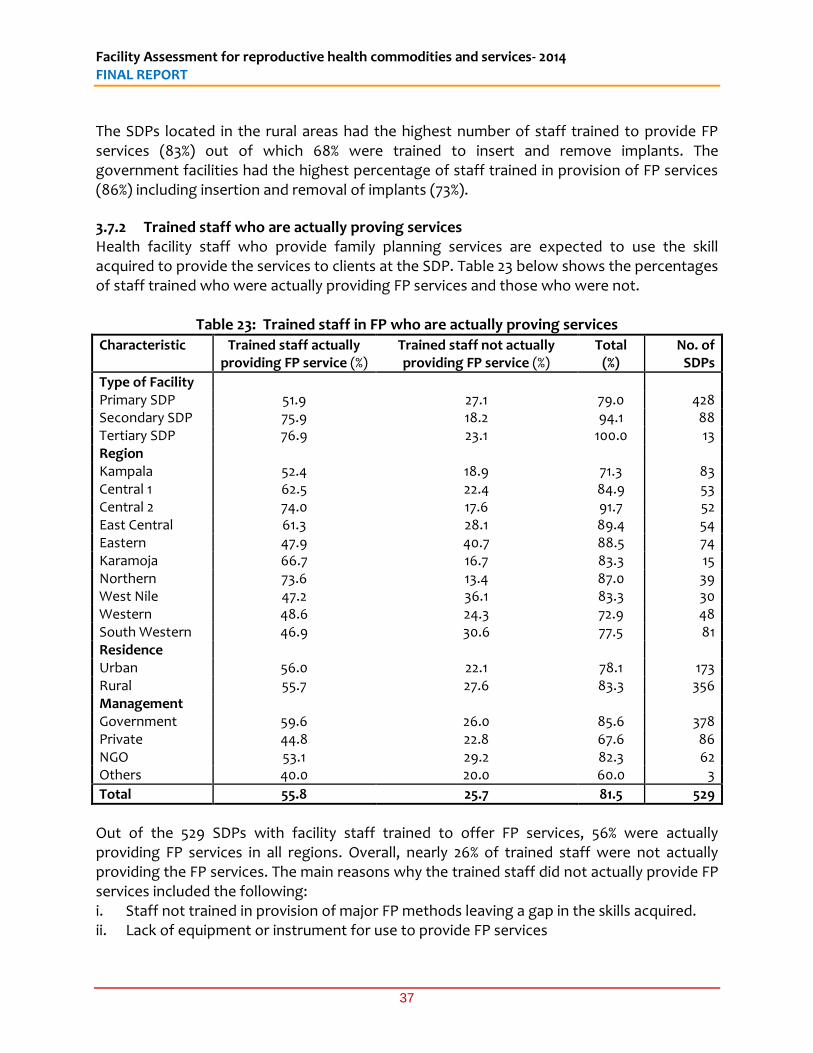
Facility Assessment for reproductive health commodities and services- 2014 FINAL REPORT
37
The SDPs located in the rural areas had the highest number of staff trained to provide FP services (83%) out of which 68% were trained to insert and remove implants. The government facilities had the highest percentage of staff trained in provision of FP services (86%) including insertion and removal of implants (73%).
3.7.2 Trained staff who are actually proving services Health facility staff who provide family planning services are expected to use the skill acquired to provide the services to clients at the SDP. Table 23 below shows the percentages of staff trained who were actually providing FP services and those who were not.
Table 23: Trained staff in FP who are actually proving services
Characteristic Trained staff actually providing FP service (%)
Trained staff not actually providing FP service (%)
Total (%)
No. of SDPs
Type of Facility Primary SDP 51.9 27.1 79.0 428 Secondary SDP 75.9 18.2 94.1 88 Tertiary SDP 76.9 23.1 100.0 13 Region Kampala 52.4 18.9 71.3 83 Central 1 62.5 22.4 84.9 53 Central 2 74.0 17.6 91.7 52 East Central 61.3 28.1 89.4 54 Eastern 47.9 40.7 88.5 74 Karamoja 66.7 16.7 83.3 15 Northern 73.6 13.4 87.0 39 West Nile 47.2 36.1 83.3 30 Western 48.6 24.3 72.9 48 South Western 46.9 30.6 77.5 81 Residence Urban 56.0 22.1 78.1 173 Rural 55.7 27.6 83.3 356 Management Government 59.6 26.0 85.6 378 Private 44.8 22.8 67.6 86 NGO 53.1 29.2 82.3 62 Others 40.0 20.0 60.0 3
Total 55.8 25.7 81.5 529
Out of the 529 SDPs with facility staff trained to offer FP services, 56% were actually providing FP services in all regions. Overall, nearly 26% of trained staff were not actually providing the FP services. The main reasons why the trained staff did not actually provide FP services included the following: i. Staff not trained in provision of major FP methods leaving a gap in the skills acquired. ii. Lack of equipment or instrument for use to provide FP services
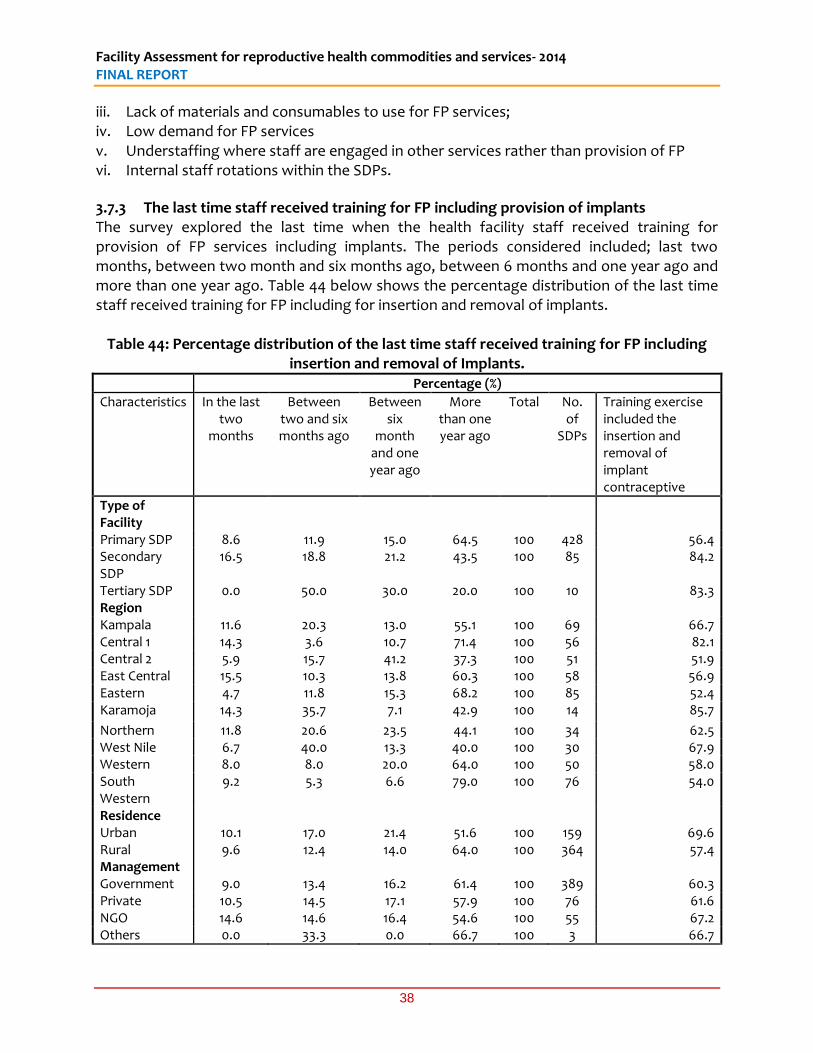
Facility Assessment for reproductive health commodities and services- 2014 FINAL REPORT
38
iii. Lack of materials and consumables to use for FP services; iv. Low demand for FP services v. Understaffing where staff are engaged in other services rather than provision of FP vi. Internal staff rotations within the SDPs.
3.7.3 The last time staff received training for FP including provision of implants The survey explored the last time when the health facility staff received training for provision of FP services including implants. The periods considered included; last two months, between two month and six months ago, between 6 months and one year ago and more than one year ago. Table 44 below shows the percentage distribution of the last time staff received training for FP including for insertion and removal of implants.
Table 44: Percentage distribution of the last time staff received training for FP including insertion and removal of Implants.
Percentage (%)
Characteristics In the last two
months
Between two and six months ago
Between six
month and one year ago
More than one year ago
Total No. of
SDPs
Training exercise included the insertion and removal of implant contraceptive
Type of Facility
Primary SDP 8.6 11.9 15.0 64.5 100 428 56.4 Secondary SDP
16.5 18.8 21.2 43.5 100 85 84.2
Tertiary SDP 0.0 50.0 30.0 20.0 100 10 83.3 Region Kampala 11.6 20.3 13.0 55.1 100 69 66.7 Central 1 14.3 3.6 10.7 71.4 100 56 82.1 Central 2 5.9 15.7 41.2 37.3 100 51 51.9 East Central 15.5 10.3 13.8 60.3 100 58 56.9 Eastern 4.7 11.8 15.3 68.2 100 85 52.4 Karamoja 14.3 35.7 7.1 42.9 100 14 85.7
Northern 11.8 20.6 23.5 44.1 100 34 62.5 West Nile 6.7 40.0 13.3 40.0 100 30 67.9 Western 8.0 8.0 20.0 64.0 100 50 58.0 South Western
9.2 5.3 6.6 79.0 100 76 54.0
Residence Urban 10.1 17.0 21.4 51.6 100 159 69.6 Rural 9.6 12.4 14.0 64.0 100 364 57.4 Management Government 9.0 13.4 16.2 61.4 100 389 60.3 Private 10.5 14.5 17.1 57.9 100 76 61.6 NGO 14.6 14.6 16.4 54.6 100 55 67.2 Others 0.0 33.3 0.0 66.7 100 3 66.7
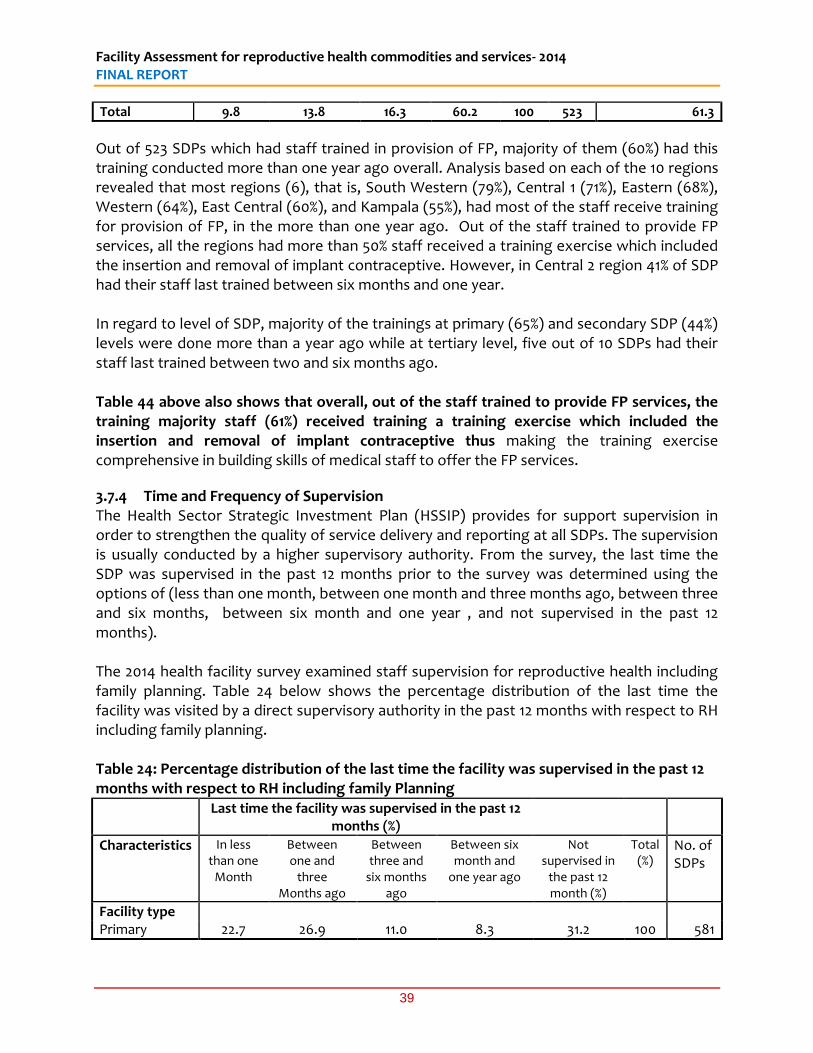
Facility Assessment for reproductive health commodities and services- 2014 FINAL REPORT
39
Total 9.8 13.8 16.3 60.2 100 523 61.3
Out of 523 SDPs which had staff trained in provision of FP, majority of them (60%) had this training conducted more than one year ago overall. Analysis based on each of the 10 regions revealed that most regions (6), that is, South Western (79%), Central 1 (71%), Eastern (68%), Western (64%), East Central (60%), and Kampala (55%), had most of the staff receive training for provision of FP, in the more than one year ago. Out of the staff trained to provide FP services, all the regions had more than 50% staff received a training exercise which included the insertion and removal of implant contraceptive. However, in Central 2 region 41% of SDP had their staff last trained between six months and one year. In regard to level of SDP, majority of the trainings at primary (65%) and secondary SDP (44%) levels were done more than a year ago while at tertiary level, five out of 10 SDPs had their staff last trained between two and six months ago. Table 44 above also shows that overall, out of the staff trained to provide FP services, the training majority staff (61%) received training a training exercise which included the insertion and removal of implant contraceptive thus making the training exercise comprehensive in building skills of medical staff to offer the FP services.
3.7.4 Time and Frequency of Supervision The Health Sector Strategic Investment Plan (HSSIP) provides for support supervision in order to strengthen the quality of service delivery and reporting at all SDPs. The supervision is usually conducted by a higher supervisory authority. From the survey, the last time the SDP was supervised in the past 12 months prior to the survey was determined using the options of (less than one month, between one month and three months ago, between three and six months, between six month and one year , and not supervised in the past 12 months). The 2014 health facility survey examined staff supervision for reproductive health including family planning. Table 24 below shows the percentage distribution of the last time the facility was visited by a direct supervisory authority in the past 12 months with respect to RH including family planning. Table 24: Percentage distribution of the last time the facility was supervised in the past 12 months with respect to RH including family Planning Last time the facility was supervised in the past 12
months (%)
Characteristics In less than one
Month
Between one and
three Months ago
Between three and
six months ago
Between six month and
one year ago
Not supervised in
the past 12 month (%)
Total (%)
No. of SDPs
Facility type Primary 22.7 26.9 11.0 8.3 31.2 100 581
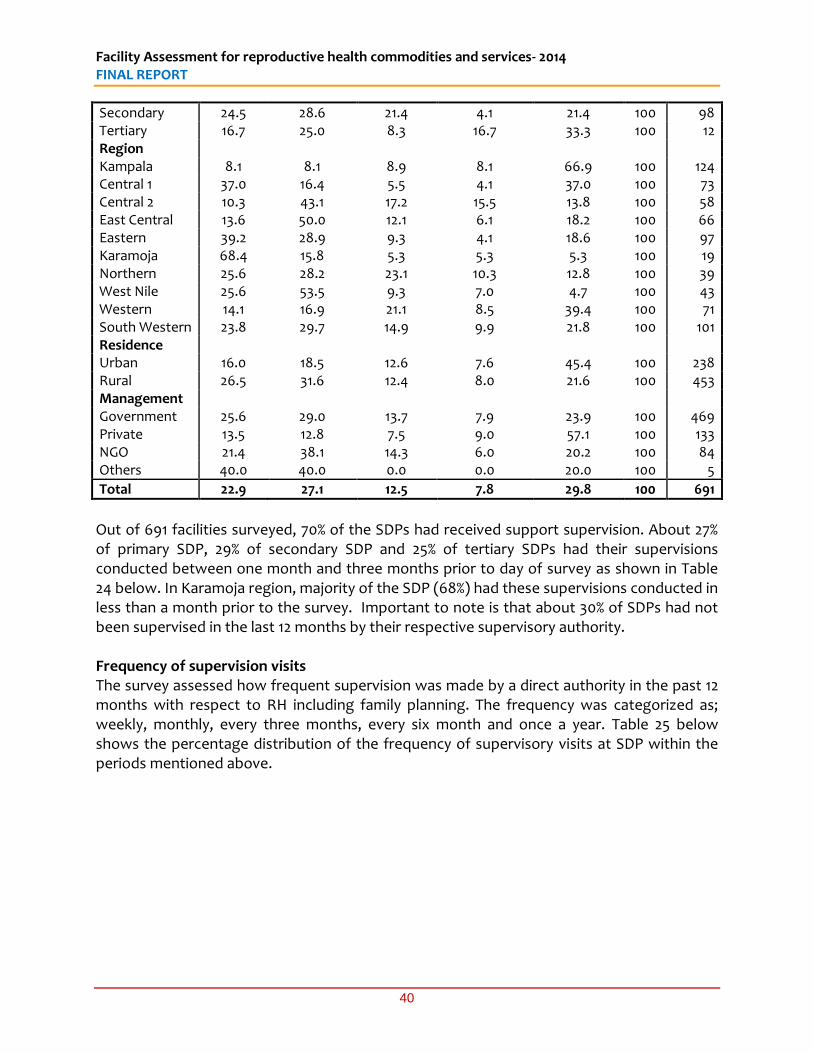
Facility Assessment for reproductive health commodities and services- 2014 FINAL REPORT
40
Secondary 24.5 28.6 21.4 4.1 21.4 100 98 Tertiary 16.7 25.0 8.3 16.7 33.3 100 12 Region Kampala 8.1 8.1 8.9 8.1 66.9 100 124 Central 1 37.0 16.4 5.5 4.1 37.0 100 73 Central 2 10.3 43.1 17.2 15.5 13.8 100 58 East Central 13.6 50.0 12.1 6.1 18.2 100 66 Eastern 39.2 28.9 9.3 4.1 18.6 100 97 Karamoja 68.4 15.8 5.3 5.3 5.3 100 19 Northern 25.6 28.2 23.1 10.3 12.8 100 39 West Nile 25.6 53.5 9.3 7.0 4.7 100 43 Western 14.1 16.9 21.1 8.5 39.4 100 71 South Western 23.8 29.7 14.9 9.9 21.8 100 101 Residence Urban 16.0 18.5 12.6 7.6 45.4 100 238 Rural 26.5 31.6 12.4 8.0 21.6 100 453 Management Government 25.6 29.0 13.7 7.9 23.9 100 469 Private 13.5 12.8 7.5 9.0 57.1 100 133 NGO 21.4 38.1 14.3 6.0 20.2 100 84 Others 40.0 40.0 0.0 0.0 20.0 100 5
Total 22.9 27.1 12.5 7.8 29.8 100 691
Out of 691 facilities surveyed, 70% of the SDPs had received support supervision. About 27% of primary SDP, 29% of secondary SDP and 25% of tertiary SDPs had their supervisions conducted between one month and three months prior to day of survey as shown in Table 24 below. In Karamoja region, majority of the SDP (68%) had these supervisions conducted in less than a month prior to the survey. Important to note is that about 30% of SDPs had not been supervised in the last 12 months by their respective supervisory authority. Frequency of supervision visits The survey assessed how frequent supervision was made by a direct authority in the past 12 months with respect to RH including family planning. The frequency was categorized as; weekly, monthly, every three months, every six month and once a year. Table 25 below shows the percentage distribution of the frequency of supervisory visits at SDP within the periods mentioned above.
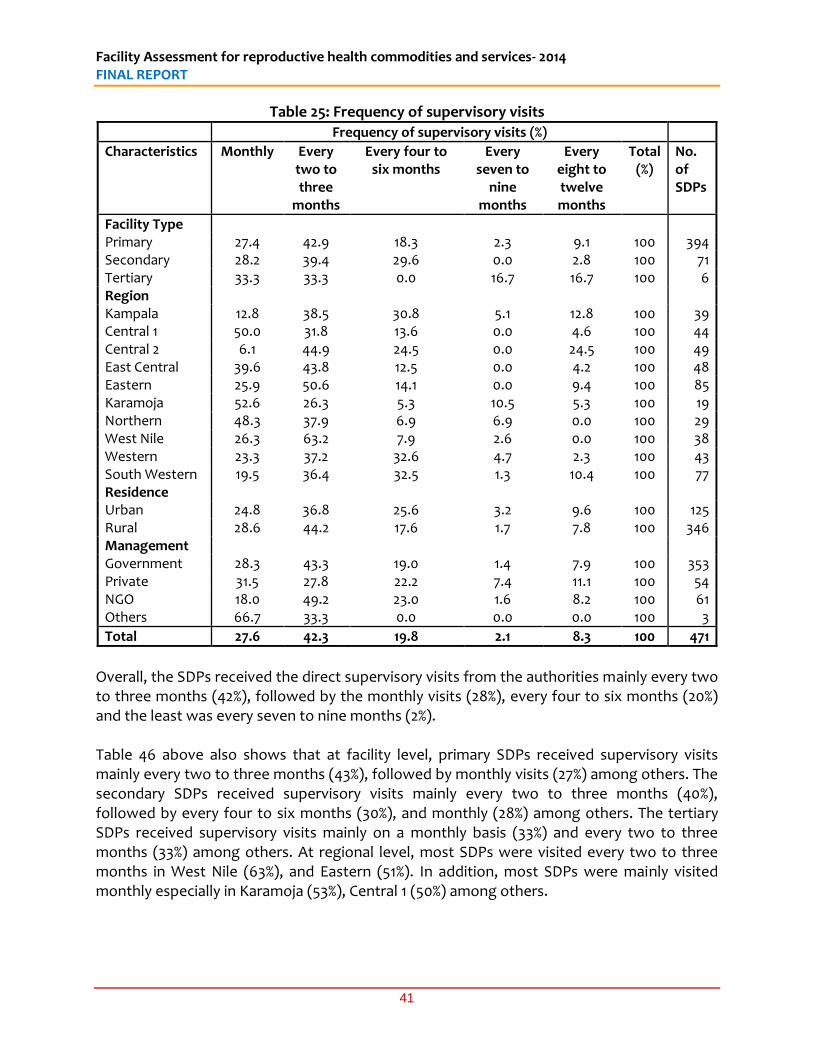
Facility Assessment for reproductive health commodities and services- 2014 FINAL REPORT
41
Table 25: Frequency of supervisory visits
Frequency of supervisory visits (%)
Characteristics Monthly Every two to three
months
Every four to six months
Every seven to
nine months
Every eight to twelve months
Total (%)
No. of SDPs
Facility Type Primary 27.4 42.9 18.3 2.3 9.1 100 394 Secondary 28.2 39.4 29.6 0.0 2.8 100 71 Tertiary 33.3 33.3 0.0 16.7 16.7 100 6 Region Kampala 12.8 38.5 30.8 5.1 12.8 100 39 Central 1 50.0 31.8 13.6 0.0 4.6 100 44 Central 2 6.1 44.9 24.5 0.0 24.5 100 49 East Central 39.6 43.8 12.5 0.0 4.2 100 48 Eastern 25.9 50.6 14.1 0.0 9.4 100 85 Karamoja 52.6 26.3 5.3 10.5 5.3 100 19 Northern 48.3 37.9 6.9 6.9 0.0 100 29 West Nile 26.3 63.2 7.9 2.6 0.0 100 38 Western 23.3 37.2 32.6 4.7 2.3 100 43 South Western 19.5 36.4 32.5 1.3 10.4 100 77 Residence Urban 24.8 36.8 25.6 3.2 9.6 100 125 Rural 28.6 44.2 17.6 1.7 7.8 100 346 Management Government 28.3 43.3 19.0 1.4 7.9 100 353 Private 31.5 27.8 22.2 7.4 11.1 100 54 NGO 18.0 49.2 23.0 1.6 8.2 100 61 Others 66.7 33.3 0.0 0.0 0.0 100 3
Total 27.6 42.3 19.8 2.1 8.3 100 471
Overall, the SDPs received the direct supervisory visits from the authorities mainly every two to three months (42%), followed by the monthly visits (28%), every four to six months (20%) and the least was every seven to nine months (2%). Table 46 above also shows that at facility level, primary SDPs received supervisory visits mainly every two to three months (43%), followed by monthly visits (27%) among others. The secondary SDPs received supervisory visits mainly every two to three months (40%), followed by every four to six months (30%), and monthly (28%) among others. The tertiary SDPs received supervisory visits mainly on a monthly basis (33%) and every two to three months (33%) among others. At regional level, most SDPs were visited every two to three months in West Nile (63%), and Eastern (51%). In addition, most SDPs were mainly visited monthly especially in Karamoja (53%), Central 1 (50%) among others.
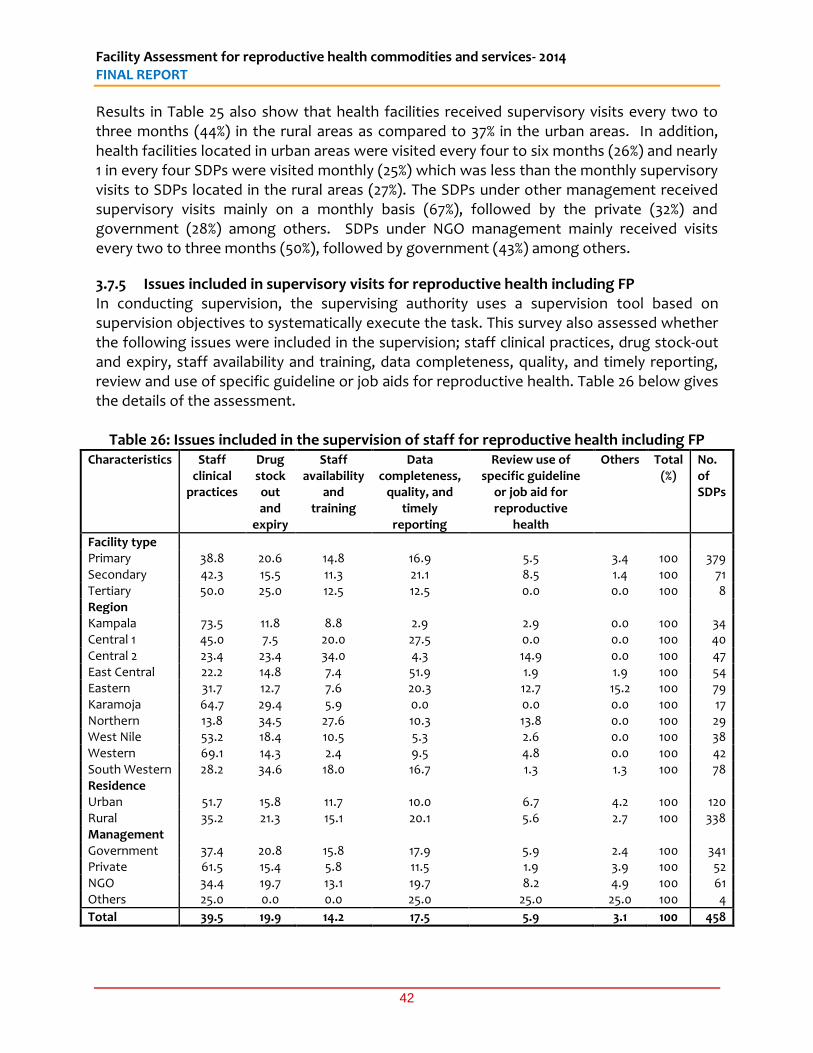
Facility Assessment for reproductive health commodities and services- 2014 FINAL REPORT
42
Results in Table 25 also show that health facilities received supervisory visits every two to three months (44%) in the rural areas as compared to 37% in the urban areas. In addition, health facilities located in urban areas were visited every four to six months (26%) and nearly 1 in every four SDPs were visited monthly (25%) which was less than the monthly supervisory visits to SDPs located in the rural areas (27%). The SDPs under other management received supervisory visits mainly on a monthly basis (67%), followed by the private (32%) and government (28%) among others. SDPs under NGO management mainly received visits every two to three months (50%), followed by government (43%) among others.
3.7.5 Issues included in supervisory visits for reproductive health including FP In conducting supervision, the supervising authority uses a supervision tool based on supervision objectives to systematically execute the task. This survey also assessed whether the following issues were included in the supervision; staff clinical practices, drug stock-out and expiry, staff availability and training, data completeness, quality, and timely reporting, review and use of specific guideline or job aids for reproductive health. Table 26 below gives the details of the assessment.
Table 26: Issues included in the supervision of staff for reproductive health including FP Characteristics Staff
clinical practices
Drug stock out and
expiry
Staff availability
and training
Data completeness,
quality, and timely
reporting
Review use of specific guideline
or job aid for reproductive
health
Others Total (%)
No. of SDPs
Facility type Primary 38.8 20.6 14.8 16.9 5.5 3.4 100 379 Secondary 42.3 15.5 11.3 21.1 8.5 1.4 100 71 Tertiary 50.0 25.0 12.5 12.5 0.0 0.0 100 8 Region Kampala 73.5 11.8 8.8 2.9 2.9 0.0 100 34 Central 1 45.0 7.5 20.0 27.5 0.0 0.0 100 40 Central 2 23.4 23.4 34.0 4.3 14.9 0.0 100 47 East Central 22.2 14.8 7.4 51.9 1.9 1.9 100 54 Eastern 31.7 12.7 7.6 20.3 12.7 15.2 100 79 Karamoja 64.7 29.4 5.9 0.0 0.0 0.0 100 17 Northern 13.8 34.5 27.6 10.3 13.8 0.0 100 29 West Nile 53.2 18.4 10.5 5.3 2.6 0.0 100 38 Western 69.1 14.3 2.4 9.5 4.8 0.0 100 42 South Western 28.2 34.6 18.0 16.7 1.3 1.3 100 78 Residence Urban 51.7 15.8 11.7 10.0 6.7 4.2 100 120 Rural 35.2 21.3 15.1 20.1 5.6 2.7 100 338 Management Government 37.4 20.8 15.8 17.9 5.9 2.4 100 341 Private 61.5 15.4 5.8 11.5 1.9 3.9 100 52 NGO 34.4 19.7 13.1 19.7 8.2 4.9 100 61 Others 25.0 0.0 0.0 25.0 25.0 25.0 100 4
Total 39.5 19.9 14.2 17.5 5.9 3.1 100 458
Facility Assessment for reproductive health commodities and services- 2014 FINAL REPORT
43
From this survey, the most frequent issues included in the supervision were staff clinical practice (39%) followed by drug stock-out and expiry (20%), data completeness quality and timely reporting (17%) and staff availability and training (15%) across all types of SDPs, region and location and management. About 34% SDPs in Northern and 35% SDP in South Western regions had drug stock-out and expiry more frequently included in support supervision while in Central 2 staff availability and training occurred more frequently included in support supervision. Staff clinical practice issues were more common (52%) in the urban based SDPs as compared to the rural based SDPs (35%), while drug stock-out issues were more common in the rural based SDPs (21%) as compared to the urban based SDPs (16%).
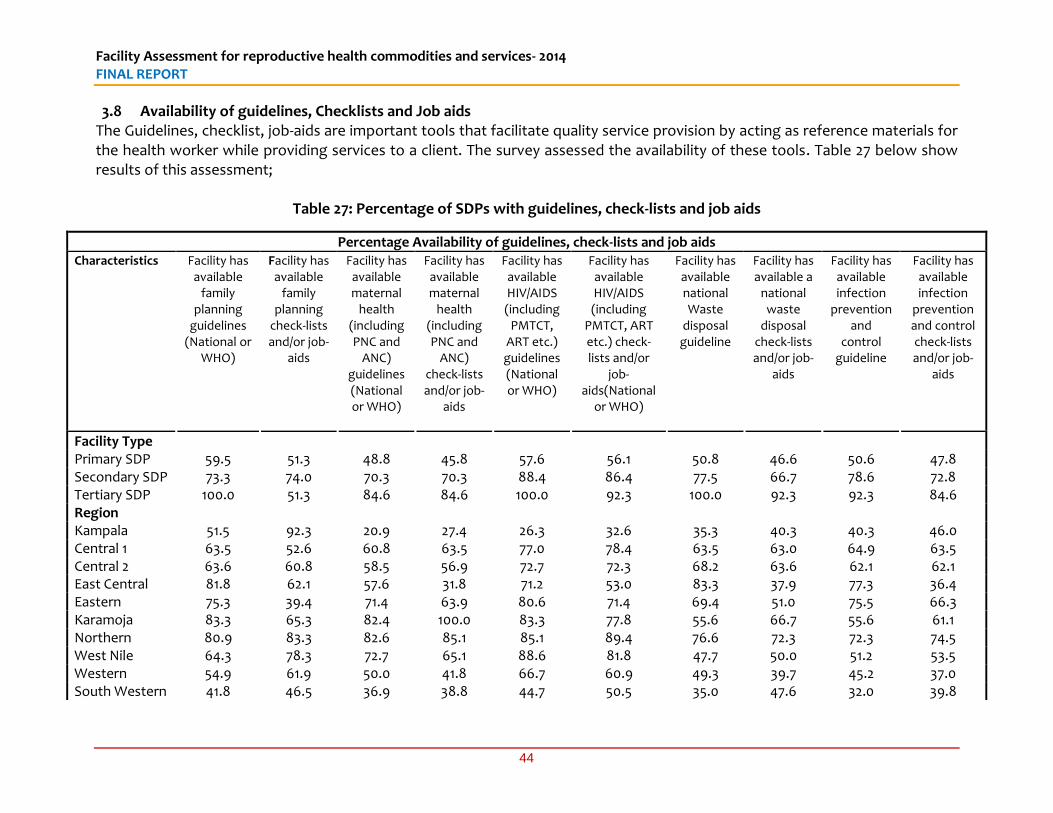
Facility Assessment for reproductive health commodities and services- 2014 FINAL REPORT
44
3.8 Availability of guidelines, Checklists and Job aids The Guidelines, checklist, job-aids are important tools that facilitate quality service provision by acting as reference materials for the health worker while providing services to a client. The survey assessed the availability of these tools. Table 27 below show results of this assessment;
Table 27: Percentage of SDPs with guidelines, check-lists and job aids
Percentage Availability of guidelines, check-lists and job aids Characteristics Facility has
available family
planning guidelines
(National or WHO)
Facility has available
family planning
check-lists and/or job-
aids
Facility has available maternal
health (including PNC and
ANC) guidelines (National or WHO)
Facility has available maternal
health (including PNC and
ANC) check-lists and/or job-
aids
Facility has available HIV/AIDS (including
PMTCT, ART etc.) guidelines (National or WHO)
Facility has available HIV/AIDS (including
PMTCT, ART etc.) check-lists and/or
job-aids(National
or WHO)
Facility has available national Waste
disposal guideline
Facility has available a
national waste
disposal check-lists and/or job-
aids
Facility has available infection
prevention and
control guideline
Facility has available infection
prevention and control check-lists and/or job-
aids
Facility Type Primary SDP 59.5 51.3 48.8 45.8 57.6 56.1 50.8 46.6 50.6 47.8 Secondary SDP 73.3 74.0 70.3 70.3 88.4 86.4 77.5 66.7 78.6 72.8 Tertiary SDP 100.0 51.3 84.6 84.6 100.0 92.3 100.0 92.3 92.3 84.6 Region Kampala 51.5 92.3 20.9 27.4 26.3 32.6 35.3 40.3 40.3 46.0 Central 1 63.5 52.6 60.8 63.5 77.0 78.4 63.5 63.0 64.9 63.5 Central 2 63.6 60.8 58.5 56.9 72.7 72.3 68.2 63.6 62.1 62.1 East Central 81.8 62.1 57.6 31.8 71.2 53.0 83.3 37.9 77.3 36.4 Eastern 75.3 39.4 71.4 63.9 80.6 71.4 69.4 51.0 75.5 66.3 Karamoja 83.3 65.3 82.4 100.0 83.3 77.8 55.6 66.7 55.6 61.1 Northern 80.9 83.3 82.6 85.1 85.1 89.4 76.6 72.3 72.3 74.5 West Nile 64.3 78.3 72.7 65.1 88.6 81.8 47.7 50.0 51.2 53.5 Western 54.9 61.9 50.0 41.8 66.7 60.9 49.3 39.7 45.2 37.0 South Western 41.8 46.5 36.9 38.8 44.7 50.5 35.0 47.6 32.0 39.8
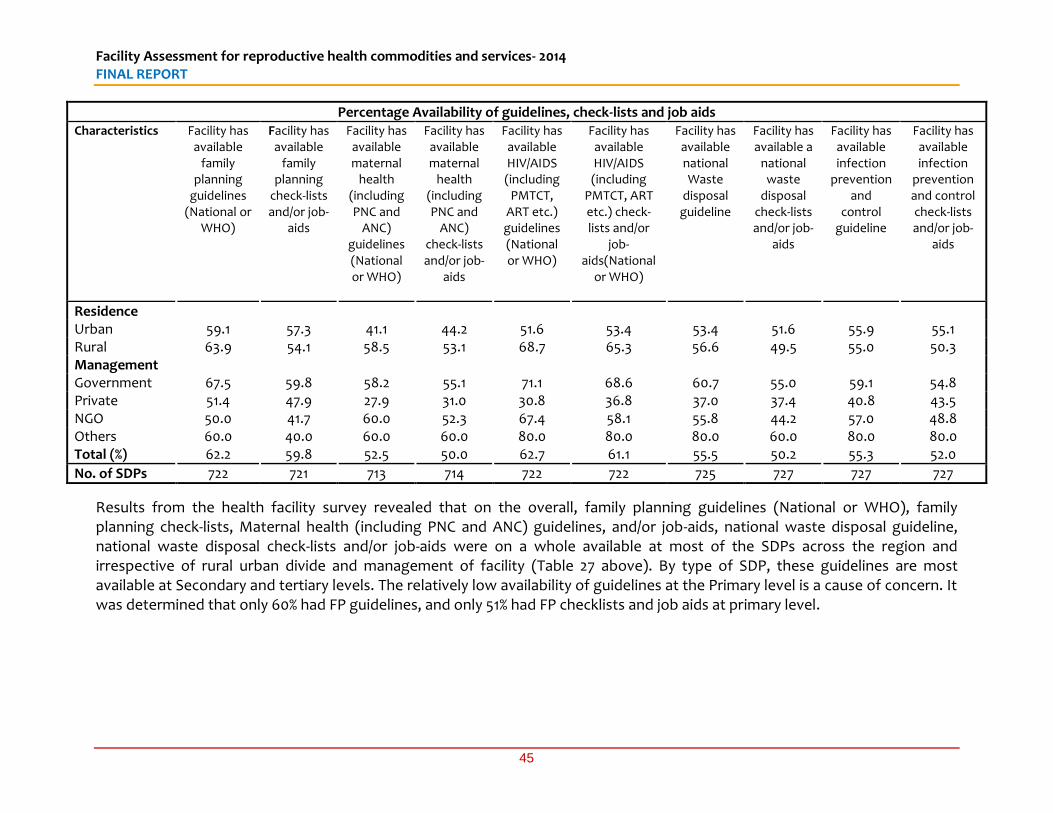
Facility Assessment for reproductive health commodities and services- 2014 FINAL REPORT
45
Percentage Availability of guidelines, check-lists and job aids Characteristics Facility has
available family
planning guidelines
(National or WHO)
Facility has available
family planning
check-lists and/or job-
aids
Facility has available maternal
health (including PNC and
ANC) guidelines (National or WHO)
Facility has available maternal
health (including PNC and
ANC) check-lists and/or job-
aids
Facility has available HIV/AIDS (including
PMTCT, ART etc.) guidelines (National or WHO)
Facility has available HIV/AIDS (including
PMTCT, ART etc.) check-lists and/or
job-aids(National
or WHO)
Facility has available national Waste
disposal guideline
Facility has available a
national waste
disposal check-lists and/or job-
aids
Facility has available infection
prevention and
control guideline
Facility has available infection
prevention and control check-lists and/or job-
aids
Residence Urban 59.1 57.3 41.1 44.2 51.6 53.4 53.4 51.6 55.9 55.1 Rural 63.9 54.1 58.5 53.1 68.7 65.3 56.6 49.5 55.0 50.3 Management Government 67.5 59.8 58.2 55.1 71.1 68.6 60.7 55.0 59.1 54.8 Private 51.4 47.9 27.9 31.0 30.8 36.8 37.0 37.4 40.8 43.5 NGO 50.0 41.7 60.0 52.3 67.4 58.1 55.8 44.2 57.0 48.8 Others 60.0 40.0 60.0 60.0 80.0 80.0 80.0 60.0 80.0 80.0 Total (%) 62.2 59.8 52.5 50.0 62.7 61.1 55.5 50.2 55.3 52.0
No. of SDPs 722 721 713 714 722 722 725 727 727 727
Results from the health facility survey revealed that on the overall, family planning guidelines (National or WHO), family planning check-lists, Maternal health (including PNC and ANC) guidelines, and/or job-aids, national waste disposal guideline, national waste disposal check-lists and/or job-aids were on a whole available at most of the SDPs across the region and irrespective of rural urban divide and management of facility (Table 27 above). By type of SDP, these guidelines are most available at Secondary and tertiary levels. The relatively low availability of guidelines at the Primary level is a cause of concern. It was determined that only 60% had FP guidelines, and only 51% had FP checklists and job aids at primary level.
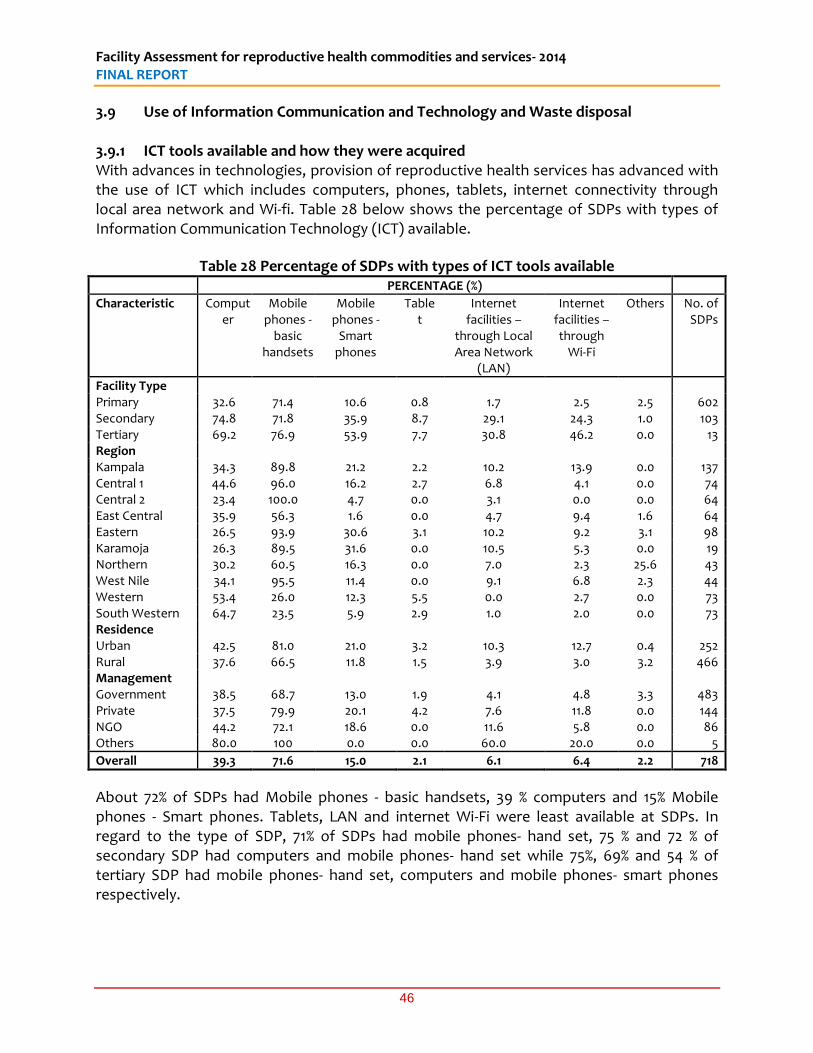
Facility Assessment for reproductive health commodities and services- 2014 FINAL REPORT
46
3.9 Use of Information Communication and Technology and Waste disposal 3.9.1 ICT tools available and how they were acquired With advances in technologies, provision of reproductive health services has advanced with the use of ICT which includes computers, phones, tablets, internet connectivity through local area network and Wi-fi. Table 28 below shows the percentage of SDPs with types of Information Communication Technology (ICT) available.
Table 28 Percentage of SDPs with types of ICT tools available PERCENTAGE (%)
Characteristic Computer
Mobile phones -
basic handsets
Mobile phones -
Smart phones
Tablet
Internet facilities –
through Local Area Network
(LAN)
Internet facilities – through
Wi-Fi
Others No. of SDPs
Facility Type Primary 32.6 71.4 10.6 0.8 1.7 2.5 2.5 602 Secondary 74.8 71.8 35.9 8.7 29.1 24.3 1.0 103 Tertiary 69.2 76.9 53.9 7.7 30.8 46.2 0.0 13 Region Kampala 34.3 89.8 21.2 2.2 10.2 13.9 0.0 137 Central 1 44.6 96.0 16.2 2.7 6.8 4.1 0.0 74 Central 2 23.4 100.0 4.7 0.0 3.1 0.0 0.0 64 East Central 35.9 56.3 1.6 0.0 4.7 9.4 1.6 64 Eastern 26.5 93.9 30.6 3.1 10.2 9.2 3.1 98 Karamoja 26.3 89.5 31.6 0.0 10.5 5.3 0.0 19 Northern 30.2 60.5 16.3 0.0 7.0 2.3 25.6 43 West Nile 34.1 95.5 11.4 0.0 9.1 6.8 2.3 44 Western 53.4 26.0 12.3 5.5 0.0 2.7 0.0 73 South Western 64.7 23.5 5.9 2.9 1.0 2.0 0.0 73 Residence Urban 42.5 81.0 21.0 3.2 10.3 12.7 0.4 252 Rural 37.6 66.5 11.8 1.5 3.9 3.0 3.2 466 Management Government 38.5 68.7 13.0 1.9 4.1 4.8 3.3 483 Private 37.5 79.9 20.1 4.2 7.6 11.8 0.0 144 NGO 44.2 72.1 18.6 0.0 11.6 5.8 0.0 86 Others 80.0 100 0.0 0.0 60.0 20.0 0.0 5
Overall 39.3 71.6 15.0 2.1 6.1 6.4 2.2 718
About 72% of SDPs had Mobile phones - basic handsets, 39 % computers and 15% Mobile phones - Smart phones. Tablets, LAN and internet Wi-Fi were least available at SDPs. In regard to the type of SDP, 71% of SDPs had mobile phones- hand set, 75 % and 72 % of secondary SDP had computers and mobile phones- hand set while 75%, 69% and 54 % of tertiary SDP had mobile phones- hand set, computers and mobile phones- smart phones respectively.
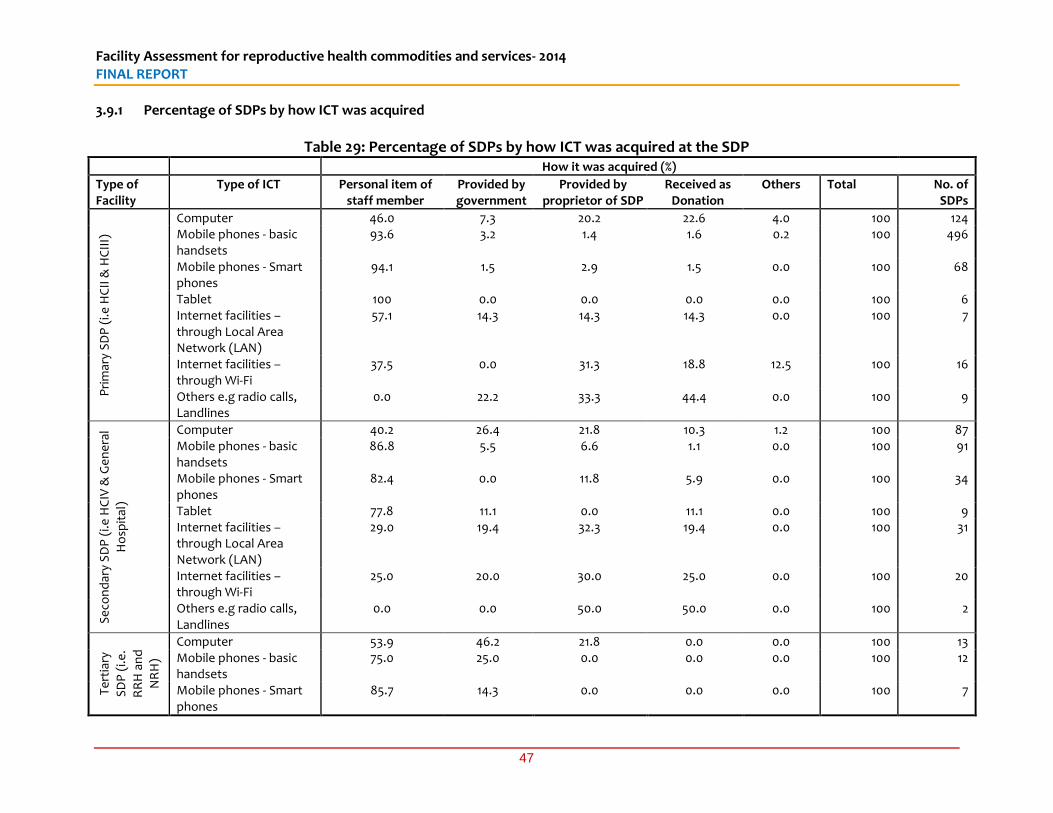
Facility Assessment for reproductive health commodities and services- 2014 FINAL REPORT
47
3.9.1 Percentage of SDPs by how ICT was acquired
Table 29: Percentage of SDPs by how ICT was acquired at the SDP
How it was acquired (%)
Type of Facility
Type of ICT Personal item of staff member
Provided by government
Provided by proprietor of SDP
Received as Donation
Others Total No. of SDPs
Pri
mar
y S
DP
(i.e
HC
II &
HC
III)
Computer 46.0 7.3 20.2 22.6 4.0 100 124 Mobile phones - basic handsets
93.6 3.2 1.4 1.6 0.2 100 496
Mobile phones - Smart phones
94.1 1.5 2.9 1.5 0.0 100 68
Tablet 100 0.0 0.0 0.0 0.0 100 6 Internet facilities – through Local Area Network (LAN)
57.1 14.3 14.3 14.3 0.0 100 7
Internet facilities – through Wi-Fi
37.5 0.0 31.3 18.8 12.5 100 16
Others e.g radio calls, Landlines
0.0 22.2 33.3 44.4 0.0 100 9
Se
con
dar
y S
DP
(i.e
HC
IV &
Ge
ne
ral
Ho
spit
al)
Computer 40.2 26.4 21.8 10.3 1.2 100 87 Mobile phones - basic handsets
86.8 5.5 6.6 1.1 0.0 100 91
Mobile phones - Smart phones
82.4 0.0 11.8 5.9 0.0 100 34
Tablet 77.8 11.1 0.0 11.1 0.0 100 9 Internet facilities – through Local Area Network (LAN)
29.0 19.4 32.3 19.4 0.0 100 31
Internet facilities – through Wi-Fi
25.0 20.0 30.0 25.0 0.0 100 20
Others e.g radio calls, Landlines
0.0 0.0 50.0 50.0 0.0 100 2
Te
rtia
ry
SD
P (
i.e.
RR
H a
nd
NR
H)
Computer 53.9 46.2 21.8 0.0 0.0 100 13 Mobile phones - basic handsets
75.0 25.0 0.0 0.0 0.0 100 12
Mobile phones - Smart phones
85.7 14.3 0.0 0.0 0.0 100 7
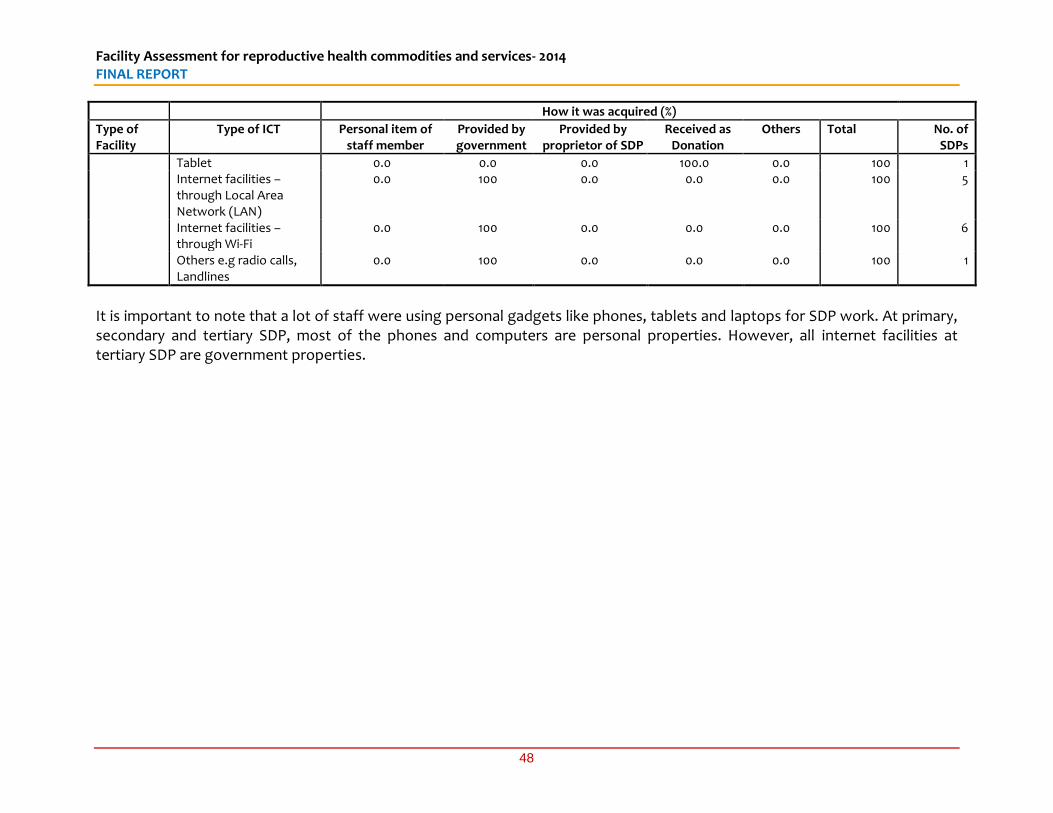
Facility Assessment for reproductive health commodities and services- 2014 FINAL REPORT
48
How it was acquired (%)
Type of Facility
Type of ICT Personal item of staff member
Provided by government
Provided by proprietor of SDP
Received as Donation
Others Total No. of SDPs
Tablet 0.0 0.0 0.0 100.0 0.0 100 1 Internet facilities – through Local Area Network (LAN)
0.0 100 0.0 0.0 0.0 100 5
Internet facilities – through Wi-Fi
0.0 100 0.0 0.0 0.0 100 6
Others e.g radio calls, Landlines
0.0 100 0.0 0.0 0.0 100 1
It is important to note that a lot of staff were using personal gadgets like phones, tablets and laptops for SDP work. At primary, secondary and tertiary SDP, most of the phones and computers are personal properties. However, all internet facilities at tertiary SDP are government properties.
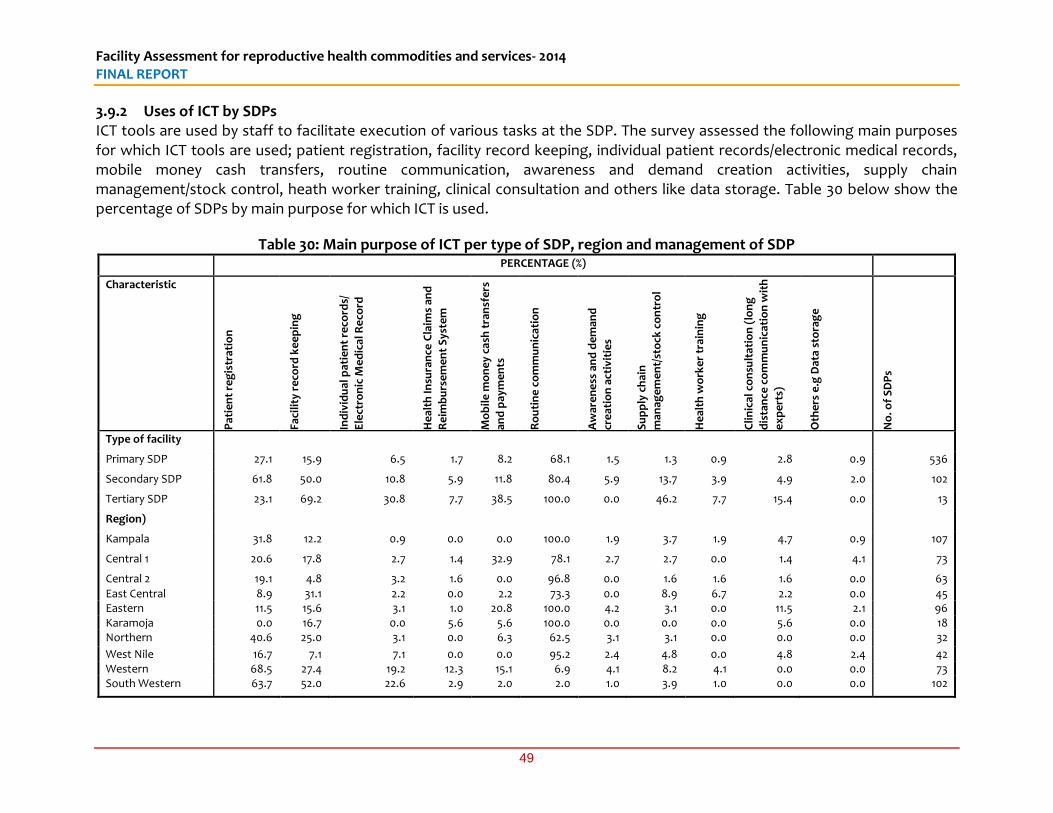
Facility Assessment for reproductive health commodities and services- 2014 FINAL REPORT
49
3.9.2 Uses of ICT by SDPs ICT tools are used by staff to facilitate execution of various tasks at the SDP. The survey assessed the following main purposes for which ICT tools are used; patient registration, facility record keeping, individual patient records/electronic medical records, mobile money cash transfers, routine communication, awareness and demand creation activities, supply chain management/stock control, heath worker training, clinical consultation and others like data storage. Table 30 below show the percentage of SDPs by main purpose for which ICT is used.
Table 30: Main purpose of ICT per type of SDP, region and management of SDP
PERCENTAGE (%)
Characteristic
Pat
ien
t re
gis
trat
ion
Faci
lity
re
cord
ke
ep
ing
Ind
ivid
ual
pat
ien
t re
cord
s/
Ele
ctro
nic
Me
dic
al R
eco
rd
He
alth
Insu
ran
ce C
laim
s an
d
Re
imb
urs
em
en
t S
yste
m
Mo
bil
e m
on
ey
cash
tra
nsf
ers
and
pay
me
nts
Ro
uti
ne
co
mm
un
icat
ion
Aw
are
ne
ss a
nd
de
man
d
cre
atio
n a
ctiv
itie
s
Su
pp
ly c
hai
n
man
age
me
nt/
sto
ck c
on
tro
l
He
alth
wo
rke
r tr
ain
ing
Cli
nic
al c
on
sult
atio
n (
lon
g
dis
tan
ce c
om
mu
nic
atio
n w
ith
ex
pe
rts)
Oth
ers
e.g
Dat
a st
ora
ge
No
. of
SD
Ps
Type of facility
Primary SDP 27.1 15.9 6.5 1.7 8.2 68.1 1.5 1.3 0.9 2.8 0.9 536
Secondary SDP 61.8 50.0 10.8 5.9 11.8 80.4 5.9 13.7 3.9 4.9 2.0 102
Tertiary SDP 23.1 69.2 30.8 7.7 38.5 100.0 0.0 46.2 7.7 15.4 0.0 13
Region)
Kampala 31.8 12.2 0.9 0.0 0.0 100.0 1.9 3.7 1.9 4.7 0.9 107
Central 1 20.6 17.8 2.7 1.4 32.9 78.1 2.7 2.7 0.0 1.4 4.1 73
Central 2 19.1 4.8 3.2 1.6 0.0 96.8 0.0 1.6 1.6 1.6 0.0 63
East Central 8.9 31.1 2.2 0.0 2.2 73.3 0.0 8.9 6.7 2.2 0.0 45 Eastern 11.5 15.6 3.1 1.0 20.8 100.0 4.2 3.1 0.0 11.5 2.1 96 Karamoja 0.0 16.7 0.0 5.6 5.6 100.0 0.0 0.0 0.0 5.6 0.0 18 Northern 40.6 25.0 3.1 0.0 6.3 62.5 3.1 3.1 0.0 0.0 0.0 32
West Nile 16.7 7.1 7.1 0.0 0.0 95.2 2.4 4.8 0.0 4.8 2.4 42 Western 68.5 27.4 19.2 12.3 15.1 6.9 4.1 8.2 4.1 0.0 0.0 73 South Western 63.7 52.0 22.6 2.9 2.0 2.0 1.0 3.9 1.0 0.0 0.0 102
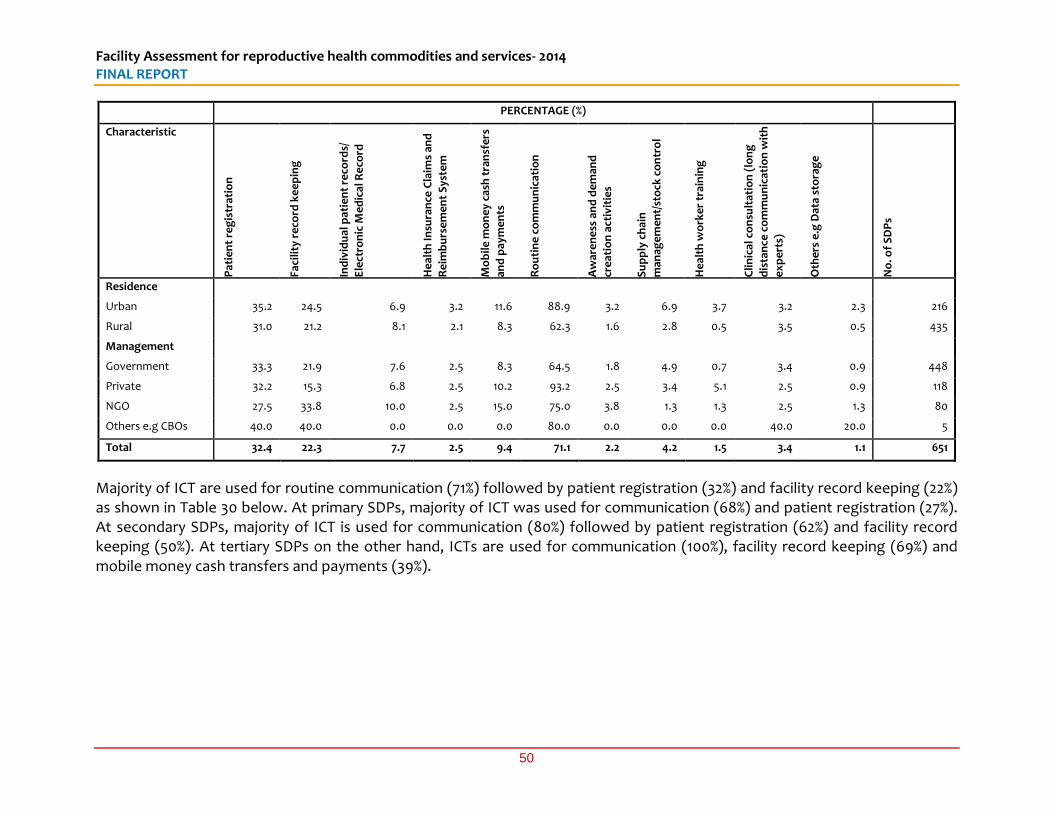
Facility Assessment for reproductive health commodities and services- 2014 FINAL REPORT
50
PERCENTAGE (%)
Characteristic
Pat
ien
t re
gis
trat
ion
Faci
lity
re
cord
ke
ep
ing
Ind
ivid
ual
pat
ien
t re
cord
s/
Ele
ctro
nic
Me
dic
al R
eco
rd
He
alth
Insu
ran
ce C
laim
s an
d
Re
imb
urs
em
en
t S
yste
m
Mo
bil
e m
on
ey
cash
tra
nsf
ers
and
pay
me
nts
Ro
uti
ne
co
mm
un
icat
ion
Aw
are
ne
ss a
nd
de
man
d
cre
atio
n a
ctiv
itie
s
Su
pp
ly c
hai
n
man
age
me
nt/
sto
ck c
on
tro
l
He
alth
wo
rke
r tr
ain
ing
Cli
nic
al c
on
sult
atio
n (
lon
g
dis
tan
ce c
om
mu
nic
atio
n w
ith
ex
pe
rts)
Oth
ers
e.g
Dat
a st
ora
ge
No
. of
SD
Ps
Residence
Urban 35.2 24.5 6.9 3.2 11.6 88.9 3.2 6.9 3.7 3.2 2.3 216
Rural 31.0 21.2 8.1 2.1 8.3 62.3 1.6 2.8 0.5 3.5 0.5 435
Management
Government 33.3 21.9 7.6 2.5 8.3 64.5 1.8 4.9 0.7 3.4 0.9 448
Private 32.2 15.3 6.8 2.5 10.2 93.2 2.5 3.4 5.1 2.5 0.9 118
NGO 27.5 33.8 10.0 2.5 15.0 75.0 3.8 1.3 1.3 2.5 1.3 80
Others e.g CBOs 40.0 40.0 0.0 0.0 0.0 80.0 0.0 0.0 0.0 40.0 20.0 5
Total 32.4 22.3 7.7 2.5 9.4 71.1 2.2 4.2 1.5 3.4 1.1 651
Majority of ICT are used for routine communication (71%) followed by patient registration (32%) and facility record keeping (22%) as shown in Table 30 below. At primary SDPs, majority of ICT was used for communication (68%) and patient registration (27%). At secondary SDPs, majority of ICT is used for communication (80%) followed by patient registration (62%) and facility record keeping (50%). At tertiary SDPs on the other hand, ICTs are used for communication (100%), facility record keeping (69%) and mobile money cash transfers and payments (39%).
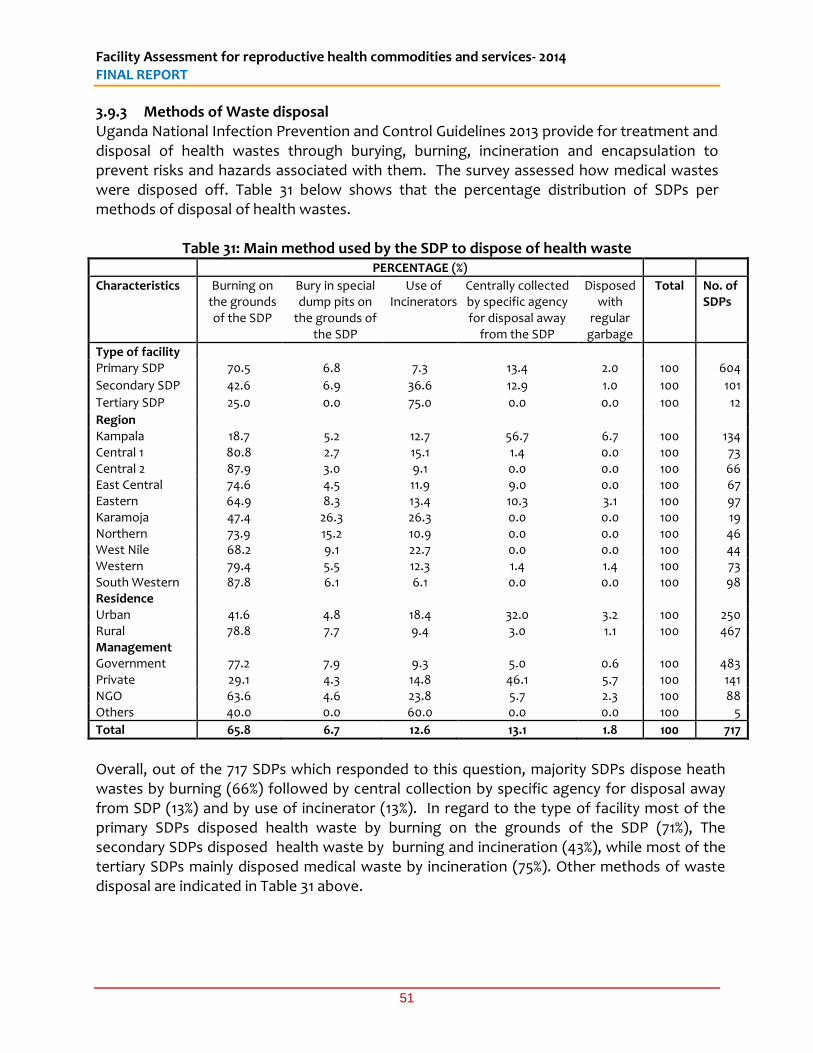
Facility Assessment for reproductive health commodities and services- 2014 FINAL REPORT
51
3.9.3 Methods of Waste disposal Uganda National Infection Prevention and Control Guidelines 2013 provide for treatment and disposal of health wastes through burying, burning, incineration and encapsulation to prevent risks and hazards associated with them. The survey assessed how medical wastes were disposed off. Table 31 below shows that the percentage distribution of SDPs per methods of disposal of health wastes.
Table 31: Main method used by the SDP to dispose of health waste PERCENTAGE (%)
Characteristics Burning on the grounds of the SDP
Bury in special dump pits on
the grounds of the SDP
Use of Incinerators
Centrally collected by specific agency for disposal away
from the SDP
Disposed with
regular garbage
Total No. of SDPs
Type of facility Primary SDP 70.5 6.8 7.3 13.4 2.0 100 604
Secondary SDP 42.6 6.9 36.6 12.9 1.0 100 101
Tertiary SDP 25.0 0.0 75.0 0.0 0.0 100 12
Region Kampala 18.7 5.2 12.7 56.7 6.7 100 134 Central 1 80.8 2.7 15.1 1.4 0.0 100 73 Central 2 87.9 3.0 9.1 0.0 0.0 100 66 East Central 74.6 4.5 11.9 9.0 0.0 100 67 Eastern 64.9 8.3 13.4 10.3 3.1 100 97 Karamoja 47.4 26.3 26.3 0.0 0.0 100 19 Northern 73.9 15.2 10.9 0.0 0.0 100 46 West Nile 68.2 9.1 22.7 0.0 0.0 100 44 Western 79.4 5.5 12.3 1.4 1.4 100 73 South Western 87.8 6.1 6.1 0.0 0.0 100 98 Residence Urban 41.6 4.8 18.4 32.0 3.2 100 250 Rural 78.8 7.7 9.4 3.0 1.1 100 467 Management Government 77.2 7.9 9.3 5.0 0.6 100 483 Private 29.1 4.3 14.8 46.1 5.7 100 141 NGO 63.6 4.6 23.8 5.7 2.3 100 88 Others 40.0 0.0 60.0 0.0 0.0 100 5
Total 65.8 6.7 12.6 13.1 1.8 100 717
Overall, out of the 717 SDPs which responded to this question, majority SDPs dispose heath wastes by burning (66%) followed by central collection by specific agency for disposal away from SDP (13%) and by use of incinerator (13%). In regard to the type of facility most of the primary SDPs disposed health waste by burning on the grounds of the SDP (71%), The secondary SDPs disposed health waste by burning and incineration (43%), while most of the tertiary SDPs mainly disposed medical waste by incineration (75%). Other methods of waste disposal are indicated in Table 31 above.
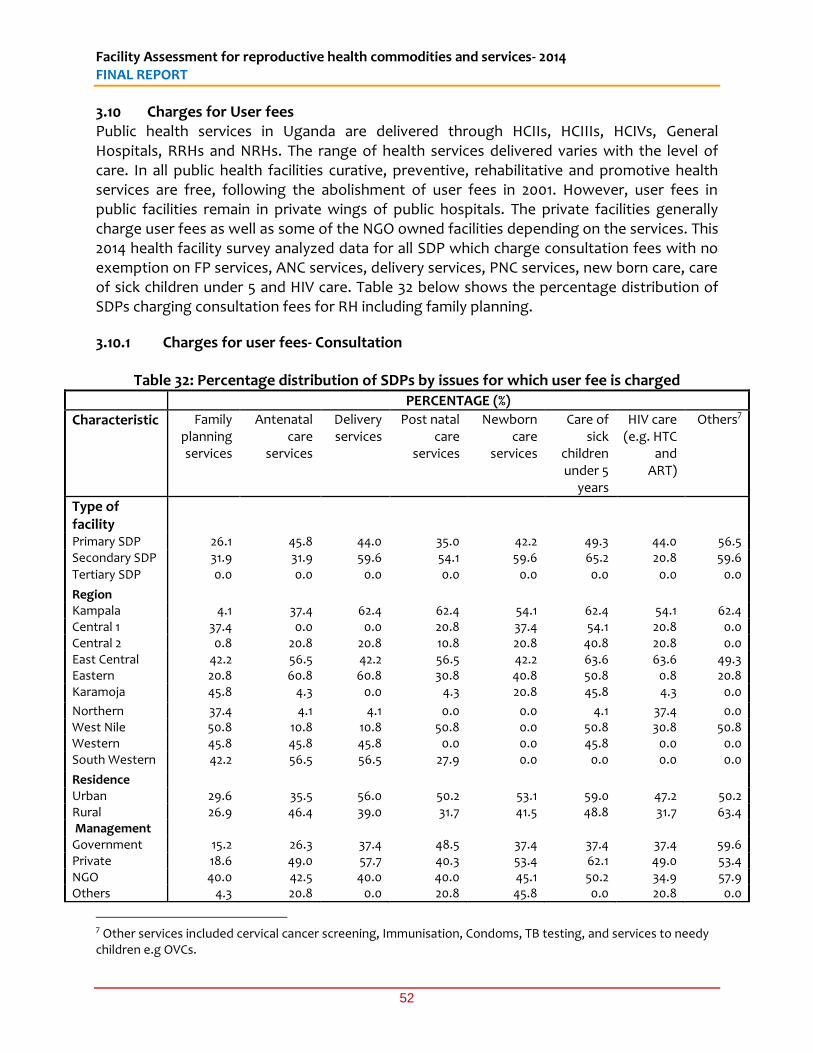
Facility Assessment for reproductive health commodities and services- 2014 FINAL REPORT
52
3.10 Charges for User fees Public health services in Uganda are delivered through HCIIs, HCIIIs, HCIVs, General Hospitals, RRHs and NRHs. The range of health services delivered varies with the level of care. In all public health facilities curative, preventive, rehabilitative and promotive health services are free, following the abolishment of user fees in 2001. However, user fees in public facilities remain in private wings of public hospitals. The private facilities generally charge user fees as well as some of the NGO owned facilities depending on the services. This 2014 health facility survey analyzed data for all SDP which charge consultation fees with no exemption on FP services, ANC services, delivery services, PNC services, new born care, care of sick children under 5 and HIV care. Table 32 below shows the percentage distribution of SDPs charging consultation fees for RH including family planning.
3.10.1 Charges for user fees- Consultation
Table 32: Percentage distribution of SDPs by issues for which user fee is charged
PERCENTAGE (%)
Characteristic Family planning services
Antenatal care
services
Delivery services
Post natal care
services
Newborn care
services
Care of sick
children under 5
years
HIV care (e.g. HTC
and ART)
Others7
Type of facility
Primary SDP 26.1 45.8 44.0 35.0 42.2 49.3 44.0 56.5 Secondary SDP 31.9 31.9 59.6 54.1 59.6 65.2 20.8 59.6 Tertiary SDP 0.0 0.0 0.0 0.0 0.0 0.0 0.0 0.0 Region Kampala 4.1 37.4 62.4 62.4 54.1 62.4 54.1 62.4 Central 1 37.4 0.0 0.0 20.8 37.4 54.1 20.8 0.0 Central 2 0.8 20.8 20.8 10.8 20.8 40.8 20.8 0.0 East Central 42.2 56.5 42.2 56.5 42.2 63.6 63.6 49.3 Eastern 20.8 60.8 60.8 30.8 40.8 50.8 0.8 20.8 Karamoja 45.8 4.3 0.0 4.3 20.8 45.8 4.3 0.0 Northern 37.4 4.1 4.1 0.0 0.0 4.1 37.4 0.0 West Nile 50.8 10.8 10.8 50.8 0.0 50.8 30.8 50.8 Western 45.8 45.8 45.8 0.0 0.0 45.8 0.0 0.0 South Western 42.2 56.5 56.5 27.9 0.0 0.0 0.0 0.0 Residence Urban 29.6 35.5 56.0 50.2 53.1 59.0 47.2 50.2 Rural 26.9 46.4 39.0 31.7 41.5 48.8 31.7 63.4 Management Government 15.2 26.3 37.4 48.5 37.4 37.4 37.4 59.6 Private 18.6 49.0 57.7 40.3 53.4 62.1 49.0 53.4 NGO 40.0 42.5 40.0 40.0 45.1 50.2 34.9 57.9 Others 4.3 20.8 0.0 20.8 45.8 0.0 20.8 0.0
7 Other services included cervical cancer screening, Immunisation, Condoms, TB testing, and services to needy children e.g OVCs.
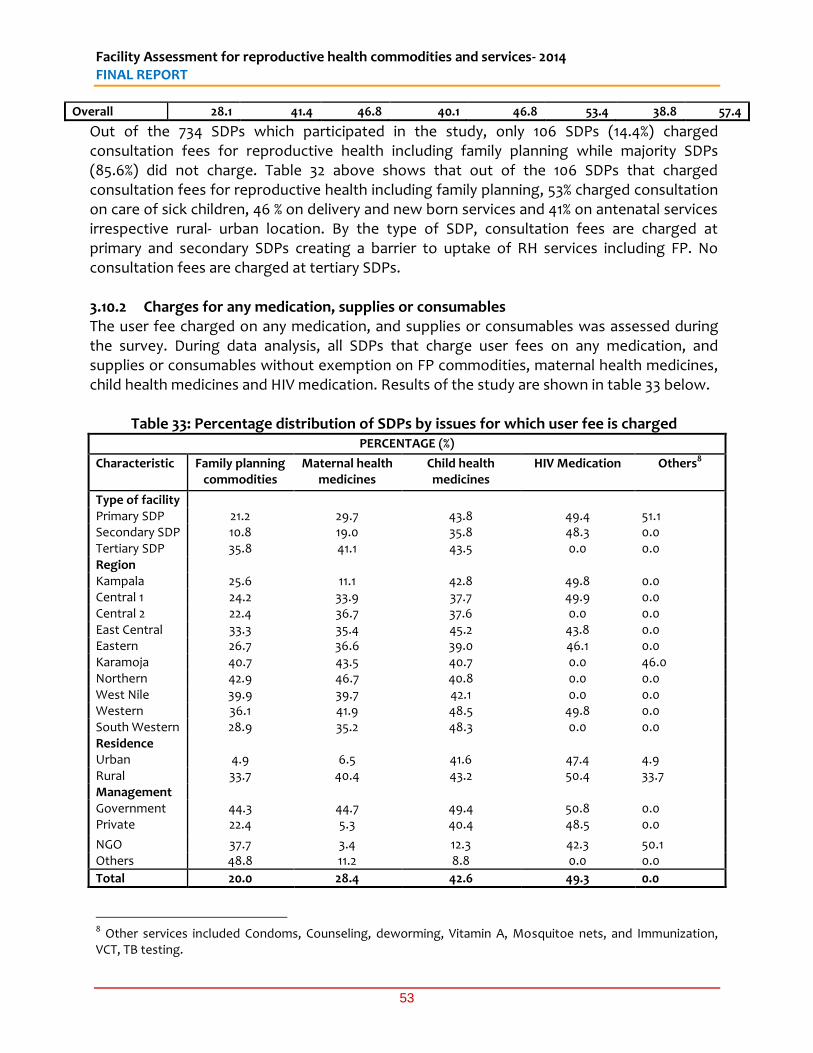
Facility Assessment for reproductive health commodities and services- 2014 FINAL REPORT
53
Overall 28.1 41.4 46.8 40.1 46.8 53.4 38.8 57.4
Out of the 734 SDPs which participated in the study, only 106 SDPs (14.4%) charged consultation fees for reproductive health including family planning while majority SDPs (85.6%) did not charge. Table 32 above shows that out of the 106 SDPs that charged consultation fees for reproductive health including family planning, 53% charged consultation on care of sick children, 46 % on delivery and new born services and 41% on antenatal services irrespective rural- urban location. By the type of SDP, consultation fees are charged at primary and secondary SDPs creating a barrier to uptake of RH services including FP. No consultation fees are charged at tertiary SDPs. 3.10.2 Charges for any medication, supplies or consumables The user fee charged on any medication, and supplies or consumables was assessed during the survey. During data analysis, all SDPs that charge user fees on any medication, and supplies or consumables without exemption on FP commodities, maternal health medicines, child health medicines and HIV medication. Results of the study are shown in table 33 below.
Table 33: Percentage distribution of SDPs by issues for which user fee is charged
PERCENTAGE (%)
Characteristic Family planning commodities
Maternal health medicines
Child health medicines
HIV Medication Others8
Type of facility Primary SDP 21.2 29.7 43.8 49.4 51.1 Secondary SDP 10.8 19.0 35.8 48.3 0.0 Tertiary SDP 35.8 41.1 43.5 0.0 0.0 Region Kampala 25.6 11.1 42.8 49.8 0.0 Central 1 24.2 33.9 37.7 49.9 0.0 Central 2 22.4 36.7 37.6 0.0 0.0 East Central 33.3 35.4 45.2 43.8 0.0 Eastern 26.7 36.6 39.0 46.1 0.0 Karamoja 40.7 43.5 40.7 0.0 46.0 Northern 42.9 46.7 40.8 0.0 0.0 West Nile 39.9 39.7 42.1 0.0 0.0 Western 36.1 41.9 48.5 49.8 0.0 South Western 28.9 35.2 48.3 0.0 0.0 Residence Urban 4.9 6.5 41.6 47.4 4.9 Rural 33.7 40.4 43.2 50.4 33.7 Management Government 44.3 44.7 49.4 50.8 0.0 Private 22.4 5.3 40.4 48.5 0.0
NGO 37.7 3.4 12.3 42.3 50.1 Others 48.8 11.2 8.8 0.0 0.0
Total 20.0 28.4 42.6 49.3 0.0
8 Other services included Condoms, Counseling, deworming, Vitamin A, Mosquitoe nets, and Immunization, VCT, TB testing.
Facility Assessment for reproductive health commodities and services- 2014 FINAL REPORT
54
Table 33 shows that all SDPs charged user fee on HIV medication (49%), 43% on child health medicines (43%), maternal health medicines (28%) and family planning commodities (20%). There were no user charges for HIV medicines at tertiary SDPs. User fees were mainly charged by facilities located in rural areas, for example, user charges were mainly charged for HIV medication (50%), child health medicines (43%), maternal health medicines (40%) and family planning commodities (34%). 3.10.3 Charges for user fees- Services provided by a qualified health care provider SDPs that charge user fees on services provided by a qualified health care provider and which are not exempted at the SDP were included in table 34 below. Family planning services, Antenatal care services, Delivery services, Post natal care services, Newborn care services, HIV care, and Caesarean Section as shown in table 34 below:
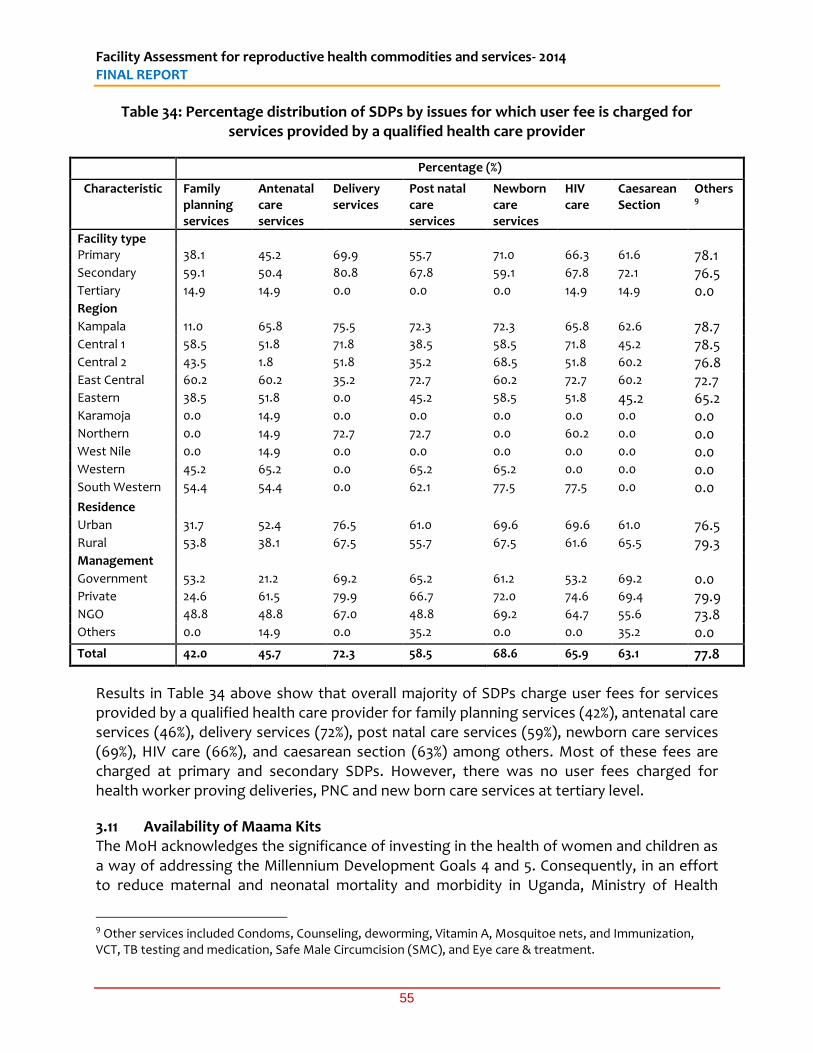
Facility Assessment for reproductive health commodities and services- 2014 FINAL REPORT
55
Table 34: Percentage distribution of SDPs by issues for which user fee is charged for services provided by a qualified health care provider
Percentage (%)
Characteristic Family planning services
Antenatal care services
Delivery services
Post natal care services
Newborn care services
HIV care
Caesarean Section
Others9
Facility type Primary 38.1 45.2 69.9 55.7 71.0 66.3 61.6 78.1
Secondary 59.1 50.4 80.8 67.8 59.1 67.8 72.1 76.5
Tertiary 14.9 14.9 0.0 0.0 0.0 14.9 14.9 0.0
Region Kampala 11.0 65.8 75.5 72.3 72.3 65.8 62.6 78.7
Central 1 58.5 51.8 71.8 38.5 58.5 71.8 45.2 78.5
Central 2 43.5 1.8 51.8 35.2 68.5 51.8 60.2 76.8
East Central 60.2 60.2 35.2 72.7 60.2 72.7 60.2 72.7
Eastern 38.5 51.8 0.0 45.2 58.5 51.8 45.2 65.2
Karamoja 0.0 14.9 0.0 0.0 0.0 0.0 0.0 0.0
Northern 0.0 14.9 72.7 72.7 0.0 60.2 0.0 0.0
West Nile 0.0 14.9 0.0 0.0 0.0 0.0 0.0 0.0
Western 45.2 65.2 0.0 65.2 65.2 0.0 0.0 0.0
South Western 54.4 54.4 0.0 62.1 77.5 77.5 0.0 0.0
Residence Urban 31.7 52.4 76.5 61.0 69.6 69.6 61.0 76.5
Rural 53.8 38.1 67.5 55.7 67.5 61.6 65.5 79.3
Management Government 53.2 21.2 69.2 65.2 61.2 53.2 69.2 0.0
Private 24.6 61.5 79.9 66.7 72.0 74.6 69.4 79.9
NGO 48.8 48.8 67.0 48.8 69.2 64.7 55.6 73.8
Others 0.0 14.9 0.0 35.2 0.0 0.0 35.2 0.0
Total 42.0 45.7 72.3 58.5 68.6 65.9 63.1 77.8
Results in Table 34 above show that overall majority of SDPs charge user fees for services provided by a qualified health care provider for family planning services (42%), antenatal care services (46%), delivery services (72%), post natal care services (59%), newborn care services (69%), HIV care (66%), and caesarean section (63%) among others. Most of these fees are charged at primary and secondary SDPs. However, there was no user fees charged for health worker proving deliveries, PNC and new born care services at tertiary level.
3.11 Availability of Maama Kits The MoH acknowledges the significance of investing in the health of women and children as a way of addressing the Millennium Development Goals 4 and 5. Consequently, in an effort to reduce maternal and neonatal mortality and morbidity in Uganda, Ministry of Health
9 Other services included Condoms, Counseling, deworming, Vitamin A, Mosquitoe nets, and Immunization, VCT, TB testing and medication, Safe Male Circumcision (SMC), and Eye care & treatment.
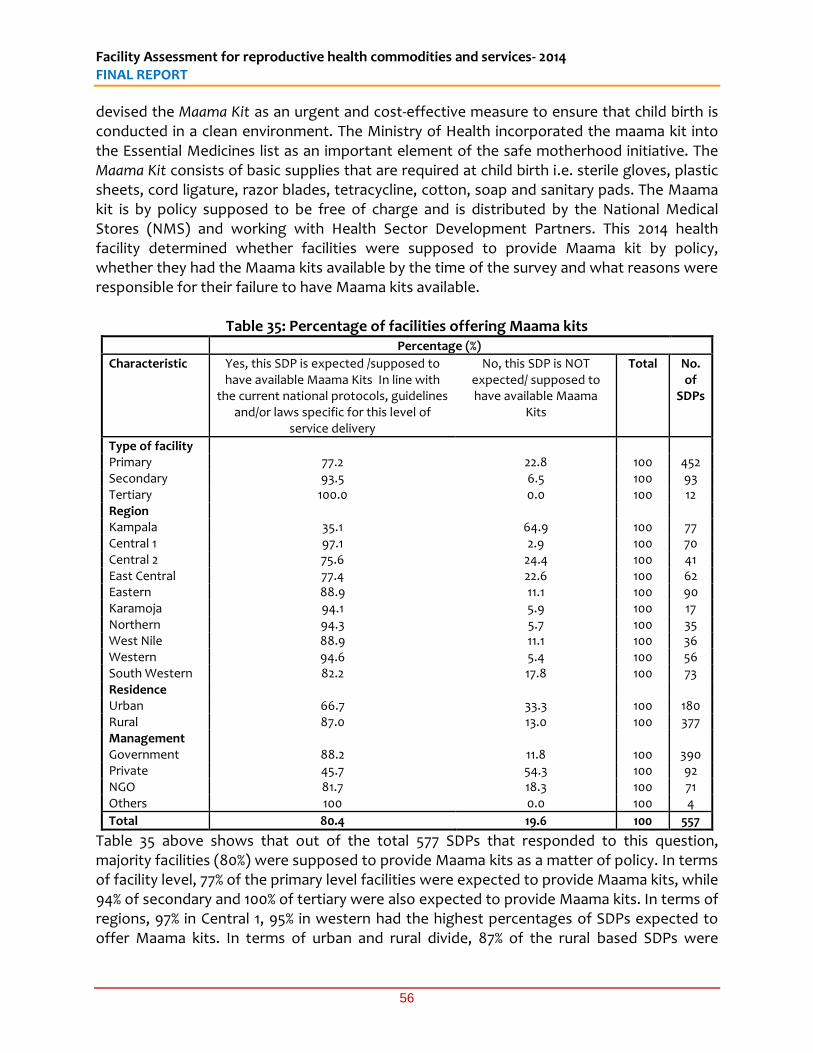
Facility Assessment for reproductive health commodities and services- 2014 FINAL REPORT
56
devised the Maama Kit as an urgent and cost-effective measure to ensure that child birth is conducted in a clean environment. The Ministry of Health incorporated the maama kit into the Essential Medicines list as an important element of the safe motherhood initiative. The Maama Kit consists of basic supplies that are required at child birth i.e. sterile gloves, plastic sheets, cord ligature, razor blades, tetracycline, cotton, soap and sanitary pads. The Maama kit is by policy supposed to be free of charge and is distributed by the National Medical Stores (NMS) and working with Health Sector Development Partners. This 2014 health facility determined whether facilities were supposed to provide Maama kit by policy, whether they had the Maama kits available by the time of the survey and what reasons were responsible for their failure to have Maama kits available.
Table 35: Percentage of facilities offering Maama kits Percentage (%)
Characteristic Yes, this SDP is expected /supposed to have available Maama Kits In line with
the current national protocols, guidelines and/or laws specific for this level of
service delivery
No, this SDP is NOT expected/ supposed to have available Maama
Kits
Total No. of
SDPs
Type of facility Primary 77.2 22.8 100 452 Secondary 93.5 6.5 100 93 Tertiary 100.0 0.0 100 12 Region Kampala 35.1 64.9 100 77 Central 1 97.1 2.9 100 70 Central 2 75.6 24.4 100 41 East Central 77.4 22.6 100 62 Eastern 88.9 11.1 100 90 Karamoja 94.1 5.9 100 17 Northern 94.3 5.7 100 35 West Nile 88.9 11.1 100 36 Western 94.6 5.4 100 56 South Western 82.2 17.8 100 73 Residence Urban 66.7 33.3 100 180 Rural 87.0 13.0 100 377 Management Government 88.2 11.8 100 390 Private 45.7 54.3 100 92 NGO 81.7 18.3 100 71 Others 100 0.0 100 4
Total 80.4 19.6 100 557
Table 35 above shows that out of the total 577 SDPs that responded to this question, majority facilities (80%) were supposed to provide Maama kits as a matter of policy. In terms of facility level, 77% of the primary level facilities were expected to provide Maama kits, while 94% of secondary and 100% of tertiary were also expected to provide Maama kits. In terms of regions, 97% in Central 1, 95% in western had the highest percentages of SDPs expected to offer Maama kits. In terms of urban and rural divide, 87% of the rural based SDPs were
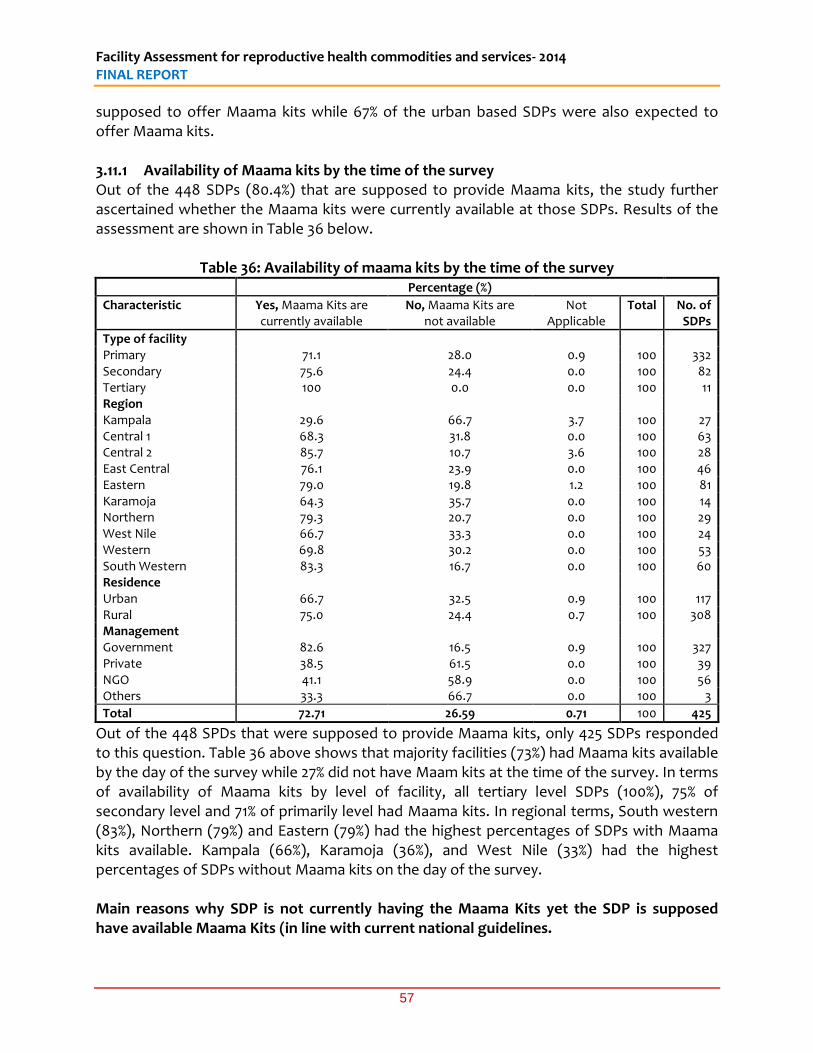
Facility Assessment for reproductive health commodities and services- 2014 FINAL REPORT
57
supposed to offer Maama kits while 67% of the urban based SDPs were also expected to offer Maama kits. 3.11.1 Availability of Maama kits by the time of the survey Out of the 448 SDPs (80.4%) that are supposed to provide Maama kits, the study further ascertained whether the Maama kits were currently available at those SDPs. Results of the assessment are shown in Table 36 below.
Table 36: Availability of maama kits by the time of the survey Percentage (%)
Characteristic Yes, Maama Kits are currently available
No, Maama Kits are not available
Not Applicable
Total No. of SDPs
Type of facility Primary 71.1 28.0 0.9 100 332 Secondary 75.6 24.4 0.0 100 82 Tertiary 100 0.0 0.0 100 11 Region Kampala 29.6 66.7 3.7 100 27 Central 1 68.3 31.8 0.0 100 63 Central 2 85.7 10.7 3.6 100 28 East Central 76.1 23.9 0.0 100 46 Eastern 79.0 19.8 1.2 100 81 Karamoja 64.3 35.7 0.0 100 14 Northern 79.3 20.7 0.0 100 29 West Nile 66.7 33.3 0.0 100 24 Western 69.8 30.2 0.0 100 53 South Western 83.3 16.7 0.0 100 60 Residence Urban 66.7 32.5 0.9 100 117 Rural 75.0 24.4 0.7 100 308 Management Government 82.6 16.5 0.9 100 327 Private 38.5 61.5 0.0 100 39 NGO 41.1 58.9 0.0 100 56 Others 33.3 66.7 0.0 100 3
Total 72.71 26.59 0.71 100 425
Out of the 448 SPDs that were supposed to provide Maama kits, only 425 SDPs responded to this question. Table 36 above shows that majority facilities (73%) had Maama kits available by the day of the survey while 27% did not have Maam kits at the time of the survey. In terms of availability of Maama kits by level of facility, all tertiary level SDPs (100%), 75% of secondary level and 71% of primarily level had Maama kits. In regional terms, South western (83%), Northern (79%) and Eastern (79%) had the highest percentages of SDPs with Maama kits available. Kampala (66%), Karamoja (36%), and West Nile (33%) had the highest percentages of SDPs without Maama kits on the day of the survey. Main reasons why SDP is not currently having the Maama Kits yet the SDP is supposed have available Maama Kits (in line with current national guidelines.
Facility Assessment for reproductive health commodities and services- 2014 FINAL REPORT
58
Reasons given for not having Maama kits available were varied and are indicated in table 37 below. The main reason for not having Maama kits was the delay on the part of the main source institution to supply Maama kits on time (58%), followed by the delay by SDPs in placing orders for the Maama kit (18%), and low or no demand/need for the Maama kit at this SDP (9%) as shown in Table 37 below. Other reasons accounted for nearly 13% and those included the following;
Hospital used to get supplies from PREFA but stopped
Maama kits are expensive;
Maternity wing not yet operational
Mothers buy from the pharmacy
SDP was not supplied with Maama Kit
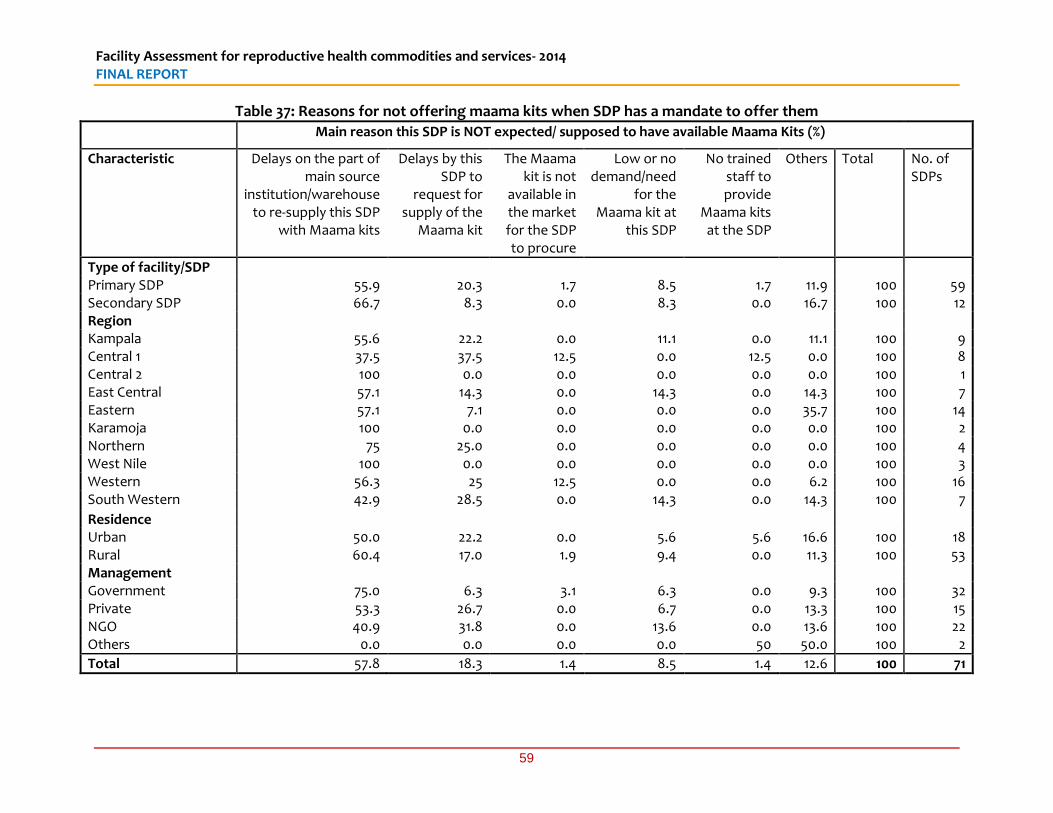
Facility Assessment for reproductive health commodities and services- 2014 FINAL REPORT
59
Table 37: Reasons for not offering maama kits when SDP has a mandate to offer them
Main reason this SDP is NOT expected/ supposed to have available Maama Kits (%)
Characteristic Delays on the part of main source
institution/warehouse to re-supply this SDP
with Maama kits
Delays by this SDP to
request for supply of the
Maama kit
The Maama kit is not
available in the market for the SDP to procure
Low or no demand/need
for the Maama kit at
this SDP
No trained staff to provide
Maama kits at the SDP
Others Total No. of SDPs
Type of facility/SDP Primary SDP 55.9 20.3 1.7 8.5 1.7 11.9 100 59 Secondary SDP 66.7 8.3 0.0 8.3 0.0 16.7 100 12 Region Kampala 55.6 22.2 0.0 11.1 0.0 11.1 100 9 Central 1 37.5 37.5 12.5 0.0 12.5 0.0 100 8 Central 2 100 0.0 0.0 0.0 0.0 0.0 100 1 East Central 57.1 14.3 0.0 14.3 0.0 14.3 100 7 Eastern 57.1 7.1 0.0 0.0 0.0 35.7 100 14 Karamoja 100 0.0 0.0 0.0 0.0 0.0 100 2 Northern 75 25.0 0.0 0.0 0.0 0.0 100 4 West Nile 100 0.0 0.0 0.0 0.0 0.0 100 3 Western 56.3 25 12.5 0.0 0.0 6.2 100 16 South Western 42.9 28.5 0.0 14.3 0.0 14.3 100 7
Residence Urban 50.0 22.2 0.0 5.6 5.6 16.6 100 18 Rural 60.4 17.0 1.9 9.4 0.0 11.3 100 53 Management Government 75.0 6.3 3.1 6.3 0.0 9.3 100 32 Private 53.3 26.7 0.0 6.7 0.0 13.3 100 15 NGO 40.9 31.8 0.0 13.6 0.0 13.6 100 22 Others 0.0 0.0 0.0 0.0 50 50.0 100 2
Total 57.8 18.3 1.4 8.5 1.4 12.6 100 71
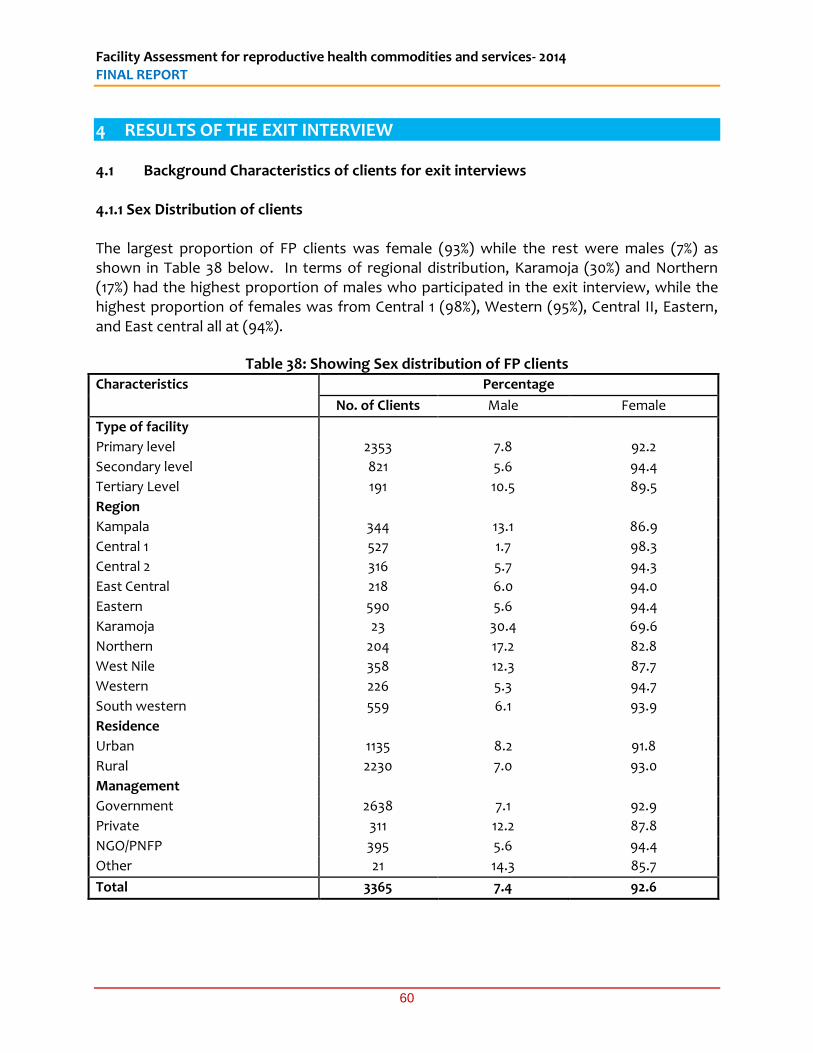
Facility Assessment for reproductive health commodities and services- 2014 FINAL REPORT
60
4 RESULTS OF THE EXIT INTERVIEW 4.1 Background Characteristics of clients for exit interviews 4.1.1 Sex Distribution of clients The largest proportion of FP clients was female (93%) while the rest were males (7%) as shown in Table 38 below. In terms of regional distribution, Karamoja (30%) and Northern (17%) had the highest proportion of males who participated in the exit interview, while the highest proportion of females was from Central 1 (98%), Western (95%), Central II, Eastern, and East central all at (94%).
Table 38: Showing Sex distribution of FP clients Characteristics Percentage
No. of Clients Male Female
Type of facility
Primary level 2353 7.8 92.2
Secondary level 821 5.6 94.4
Tertiary Level 191 10.5 89.5
Region
Kampala 344 13.1 86.9
Central 1 527 1.7 98.3
Central 2 316 5.7 94.3
East Central 218 6.0 94.0
Eastern 590 5.6 94.4
Karamoja 23 30.4 69.6
Northern 204 17.2 82.8
West Nile 358 12.3 87.7
Western 226 5.3 94.7
South western 559 6.1 93.9
Residence
Urban 1135 8.2 91.8
Rural 2230 7.0 93.0
Management
Government 2638 7.1 92.9
Private 311 12.2 87.8
NGO/PNFP 395 5.6 94.4
Other 21 14.3 85.7
Total 3365 7.4 92.6
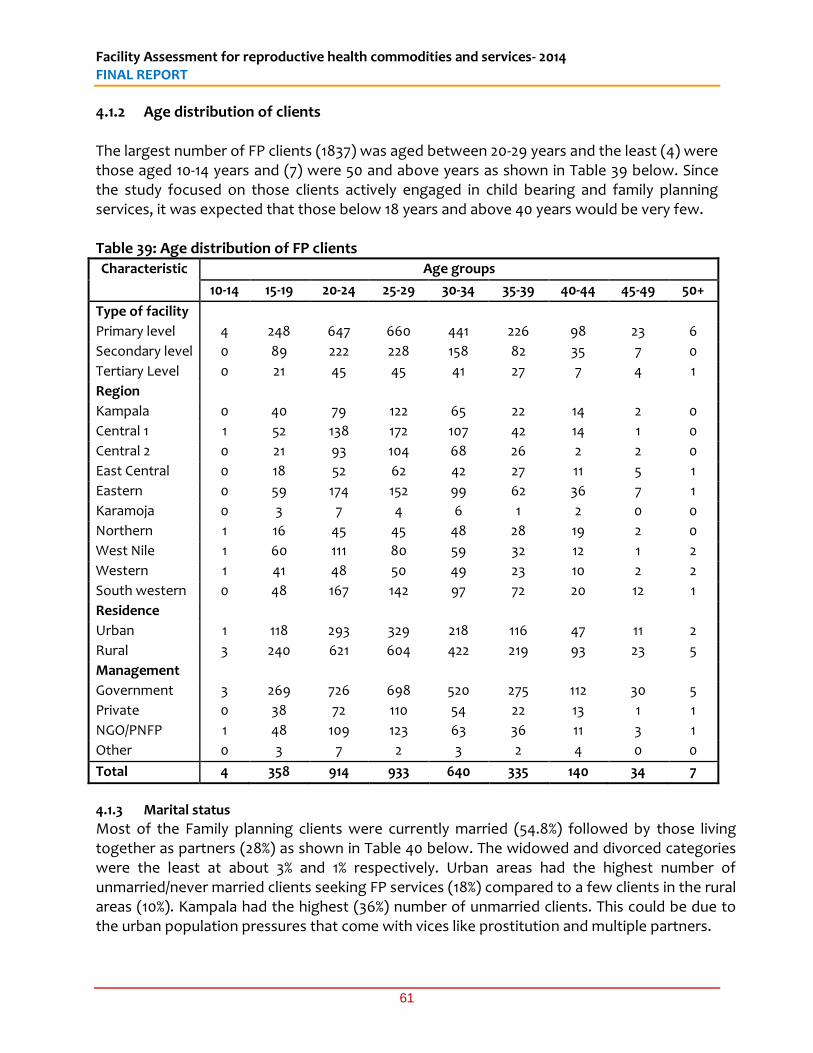
Facility Assessment for reproductive health commodities and services- 2014 FINAL REPORT
61
4.1.2 Age distribution of clients The largest number of FP clients (1837) was aged between 20-29 years and the least (4) were those aged 10-14 years and (7) were 50 and above years as shown in Table 39 below. Since the study focused on those clients actively engaged in child bearing and family planning services, it was expected that those below 18 years and above 40 years would be very few. Table 39: Age distribution of FP clients Characteristic Age groups
10-14 15-19 20-24 25-29 30-34 35-39 40-44 45-49 50+
Type of facility
Primary level 4 248 647 660 441 226 98 23 6
Secondary level 0 89 222 228 158 82 35 7 0
Tertiary Level 0 21 45 45 41 27 7 4 1
Region
Kampala 0 40 79 122 65 22 14 2 0
Central 1 1 52 138 172 107 42 14 1 0
Central 2 0 21 93 104 68 26 2 2 0
East Central 0 18 52 62 42 27 11 5 1
Eastern 0 59 174 152 99 62 36 7 1
Karamoja 0 3 7 4 6 1 2 0 0
Northern 1 16 45 45 48 28 19 2 0
West Nile 1 60 111 80 59 32 12 1 2
Western 1 41 48 50 49 23 10 2 2
South western 0 48 167 142 97 72 20 12 1
Residence
Urban 1 118 293 329 218 116 47 11 2
Rural 3 240 621 604 422 219 93 23 5
Management
Government 3 269 726 698 520 275 112 30 5
Private 0 38 72 110 54 22 13 1 1
NGO/PNFP 1 48 109 123 63 36 11 3 1
Other 0 3 7 2 3 2 4 0 0
Total 4 358 914 933 640 335 140 34 7
4.1.3 Marital status
Most of the Family planning clients were currently married (54.8%) followed by those living together as partners (28%) as shown in Table 40 below. The widowed and divorced categories were the least at about 3% and 1% respectively. Urban areas had the highest number of unmarried/never married clients seeking FP services (18%) compared to a few clients in the rural areas (10%). Kampala had the highest (36%) number of unmarried clients. This could be due to the urban population pressures that come with vices like prostitution and multiple partners.
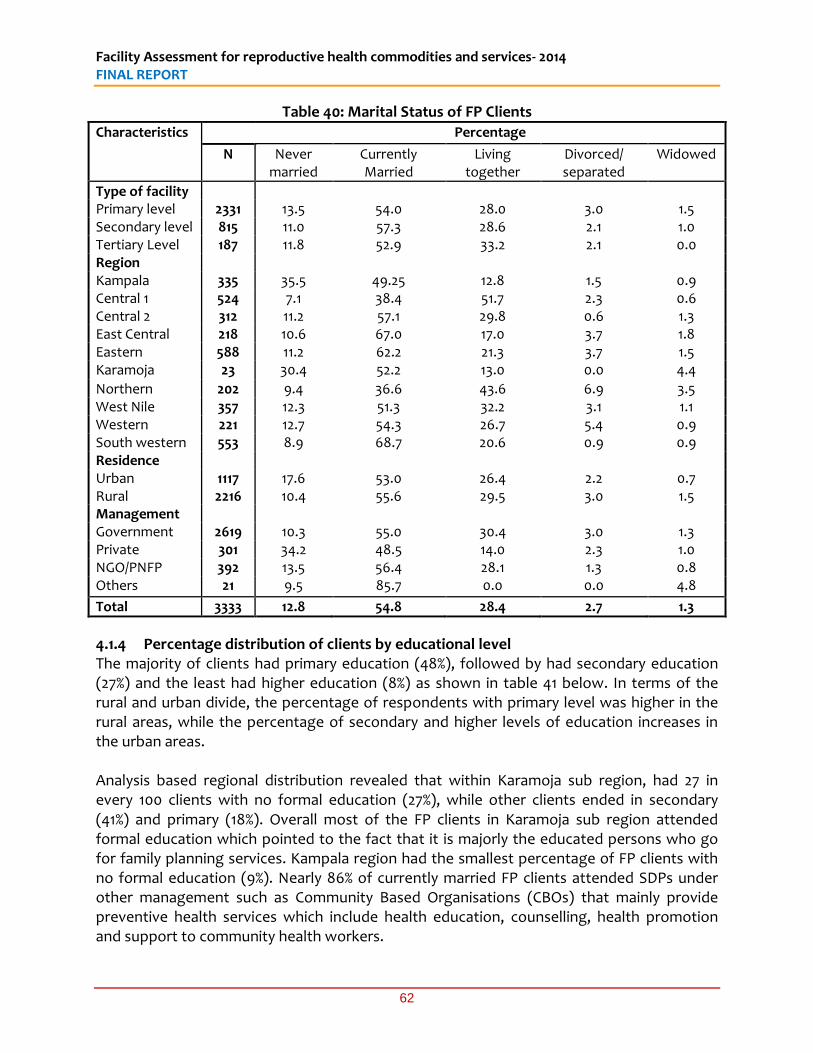
Facility Assessment for reproductive health commodities and services- 2014 FINAL REPORT
62
Table 40: Marital Status of FP Clients
Characteristics Percentage
N Never married
Currently Married
Living together
Divorced/ separated
Widowed
Type of facility Primary level 2331 13.5 54.0 28.0 3.0 1.5 Secondary level 815 11.0 57.3 28.6 2.1 1.0 Tertiary Level 187 11.8 52.9 33.2 2.1 0.0 Region Kampala 335 35.5 49.25 12.8 1.5 0.9 Central 1 524 7.1 38.4 51.7 2.3 0.6 Central 2 312 11.2 57.1 29.8 0.6 1.3 East Central 218 10.6 67.0 17.0 3.7 1.8 Eastern 588 11.2 62.2 21.3 3.7 1.5 Karamoja 23 30.4 52.2 13.0 0.0 4.4
Northern 202 9.4 36.6 43.6 6.9 3.5 West Nile 357 12.3 51.3 32.2 3.1 1.1 Western 221 12.7 54.3 26.7 5.4 0.9 South western 553 8.9 68.7 20.6 0.9 0.9 Residence Urban 1117 17.6 53.0 26.4 2.2 0.7 Rural 2216 10.4 55.6 29.5 3.0 1.5 Management Government 2619 10.3 55.0 30.4 3.0 1.3 Private 301 34.2 48.5 14.0 2.3 1.0 NGO/PNFP 392 13.5 56.4 28.1 1.3 0.8 Others 21 9.5 85.7 0.0 0.0 4.8
Total 3333 12.8 54.8 28.4 2.7 1.3
4.1.4 Percentage distribution of clients by educational level The majority of clients had primary education (48%), followed by had secondary education (27%) and the least had higher education (8%) as shown in table 41 below. In terms of the rural and urban divide, the percentage of respondents with primary level was higher in the rural areas, while the percentage of secondary and higher levels of education increases in the urban areas. Analysis based regional distribution revealed that within Karamoja sub region, had 27 in every 100 clients with no formal education (27%), while other clients ended in secondary (41%) and primary (18%). Overall most of the FP clients in Karamoja sub region attended formal education which pointed to the fact that it is majorly the educated persons who go for family planning services. Kampala region had the smallest percentage of FP clients with no formal education (9%). Nearly 86% of currently married FP clients attended SDPs under other management such as Community Based Organisations (CBOs) that mainly provide preventive health services which include health education, counselling, health promotion and support to community health workers.
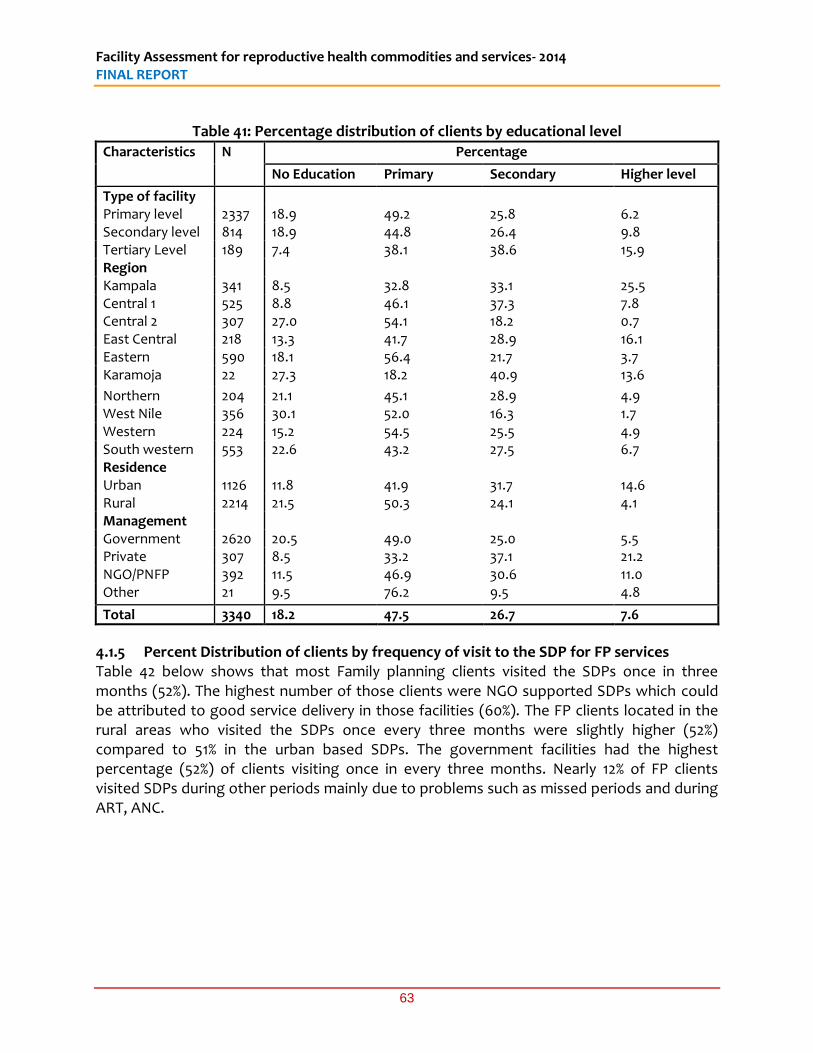
Facility Assessment for reproductive health commodities and services- 2014 FINAL REPORT
63
Table 41: Percentage distribution of clients by educational level
Characteristics N Percentage
No Education Primary Secondary Higher level
Type of facility Primary level 2337 18.9 49.2 25.8 6.2 Secondary level 814 18.9 44.8 26.4 9.8 Tertiary Level 189 7.4 38.1 38.6 15.9 Region Kampala 341 8.5 32.8 33.1 25.5 Central 1 525 8.8 46.1 37.3 7.8 Central 2 307 27.0 54.1 18.2 0.7 East Central 218 13.3 41.7 28.9 16.1 Eastern 590 18.1 56.4 21.7 3.7 Karamoja 22 27.3 18.2 40.9 13.6
Northern 204 21.1 45.1 28.9 4.9 West Nile 356 30.1 52.0 16.3 1.7 Western 224 15.2 54.5 25.5 4.9 South western 553 22.6 43.2 27.5 6.7 Residence Urban 1126 11.8 41.9 31.7 14.6 Rural 2214 21.5 50.3 24.1 4.1 Management Government 2620 20.5 49.0 25.0 5.5 Private 307 8.5 33.2 37.1 21.2 NGO/PNFP 392 11.5 46.9 30.6 11.0 Other 21 9.5 76.2 9.5 4.8
Total 3340 18.2 47.5 26.7 7.6
4.1.5 Percent Distribution of clients by frequency of visit to the SDP for FP services Table 42 below shows that most Family planning clients visited the SDPs once in three months (52%). The highest number of those clients were NGO supported SDPs which could be attributed to good service delivery in those facilities (60%). The FP clients located in the rural areas who visited the SDPs once every three months were slightly higher (52%) compared to 51% in the urban based SDPs. The government facilities had the highest percentage (52%) of clients visiting once in every three months. Nearly 12% of FP clients visited SDPs during other periods mainly due to problems such as missed periods and during ART, ANC.
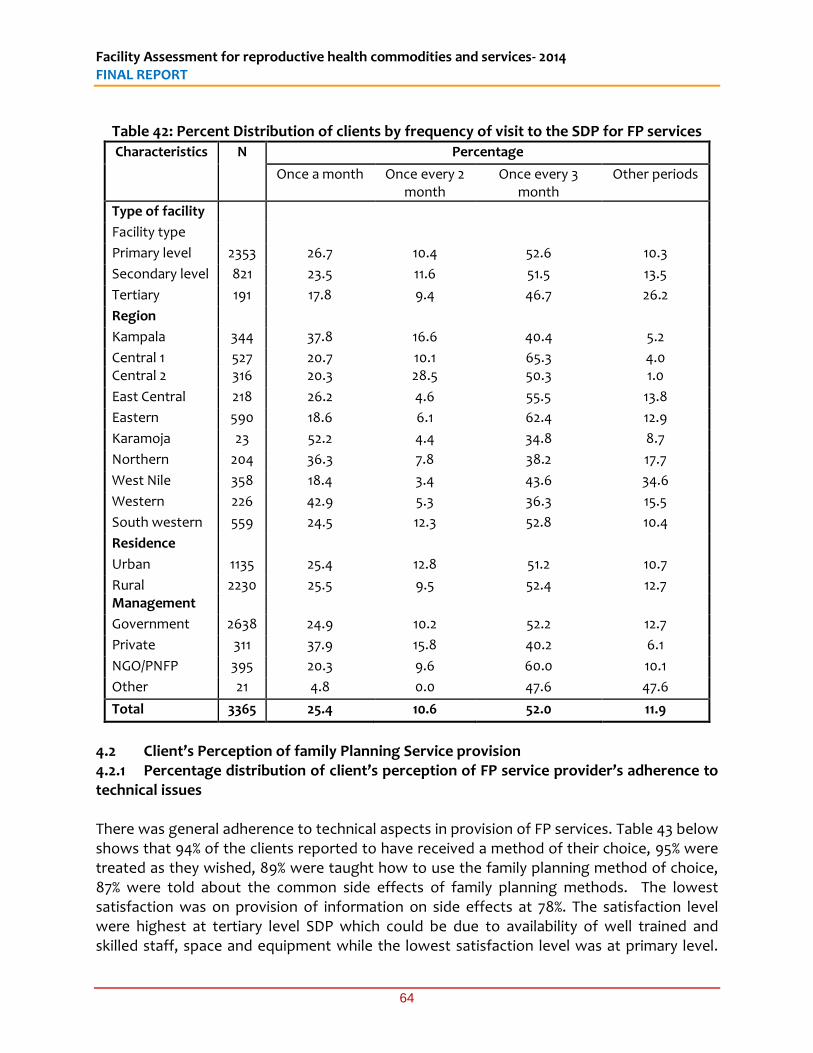
Facility Assessment for reproductive health commodities and services- 2014 FINAL REPORT
64
Table 42: Percent Distribution of clients by frequency of visit to the SDP for FP services
Characteristics N Percentage
Once a month Once every 2 month
Once every 3 month
Other periods
Type of facility
Facility type
Primary level 2353 26.7 10.4 52.6 10.3
Secondary level 821 23.5 11.6 51.5 13.5
Tertiary 191 17.8 9.4 46.7 26.2
Region
Kampala 344 37.8 16.6 40.4 5.2
Central 1 527 20.7 10.1 65.3 4.0 Central 2 316 20.3 28.5 50.3 1.0
East Central 218 26.2 4.6 55.5 13.8
Eastern 590 18.6 6.1 62.4 12.9
Karamoja 23 52.2 4.4 34.8 8.7
Northern 204 36.3 7.8 38.2 17.7
West Nile 358 18.4 3.4 43.6 34.6
Western 226 42.9 5.3 36.3 15.5
South western 559 24.5 12.3 52.8 10.4
Residence
Urban 1135 25.4 12.8 51.2 10.7
Rural 2230 25.5 9.5 52.4 12.7 Management
Government 2638 24.9 10.2 52.2 12.7
Private 311 37.9 15.8 40.2 6.1
NGO/PNFP 395 20.3 9.6 60.0 10.1
Other 21 4.8 0.0 47.6 47.6
Total 3365 25.4 10.6 52.0 11.9
4.2 Client’s Perception of family Planning Service provision 4.2.1 Percentage distribution of client’s perception of FP service provider’s adherence to technical issues There was general adherence to technical aspects in provision of FP services. Table 43 below shows that 94% of the clients reported to have received a method of their choice, 95% were treated as they wished, 89% were taught how to use the family planning method of choice, 87% were told about the common side effects of family planning methods. The lowest satisfaction was on provision of information on side effects at 78%. The satisfaction level were highest at tertiary level SDP which could be due to availability of well trained and skilled staff, space and equipment while the lowest satisfaction level was at primary level.
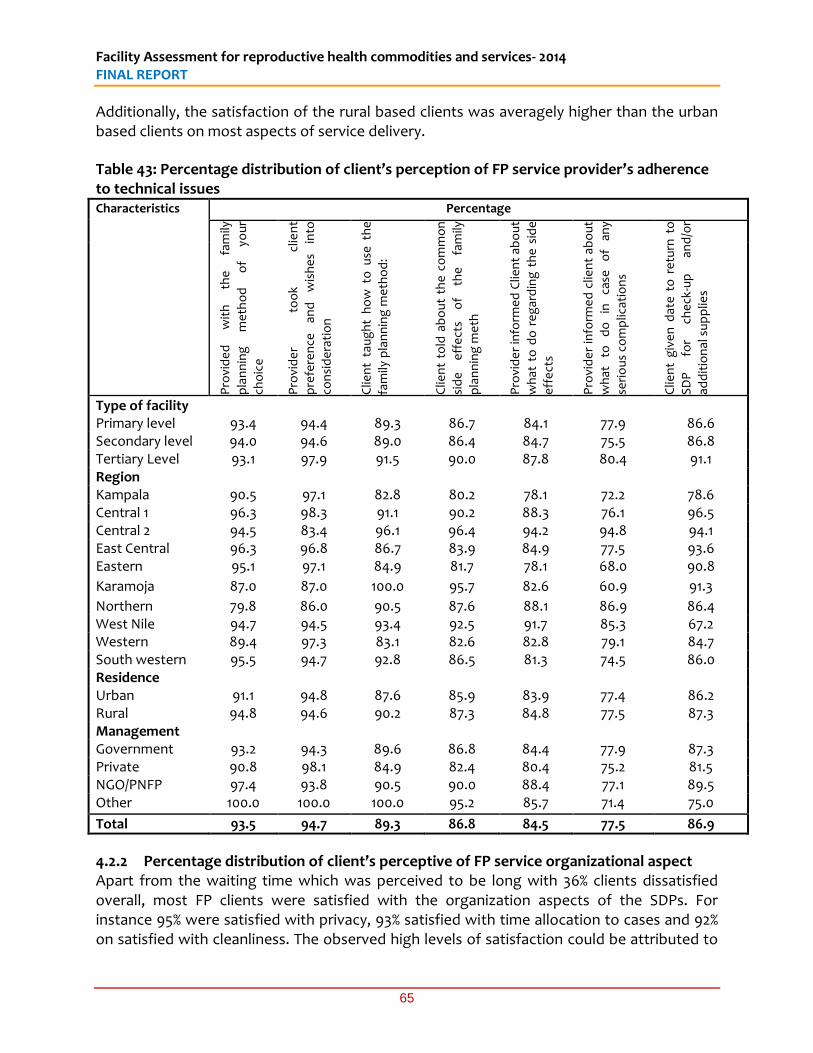
Facility Assessment for reproductive health commodities and services- 2014 FINAL REPORT
65
Additionally, the satisfaction of the rural based clients was averagely higher than the urban based clients on most aspects of service delivery.
Table 43: Percentage distribution of client’s perception of FP service provider’s adherence to technical issues Characteristics Percentage
Pro
vid
ed
w
ith
th
e
fam
ily
pla
nn
ing
m
eth
od
o
f yo
ur
cho
ice
Pro
vid
er
too
k cl
ien
t
pre
fere
nce
an
d
wis
he
s in
to
con
sid
era
tio
n
Clie
nt
tau
gh
t h
ow
to
use
th
e
fam
ily p
lan
nin
g m
eth
od
:
Clie
nt
told
ab
ou
t th
e c
om
mo
n
sid
e
eff
ect
s o
f th
e
fam
ily
pla
nn
ing
me
th
Pro
vid
er
info
rme
d C
lien
t ab
ou
t
wh
at t
o d
o r
eg
ard
ing
th
e s
ide
eff
ect
s
Pro
vid
er
info
rme
d c
lien
t ab
ou
t
wh
at
to
do
in
ca
se
of
any
seri
ou
s co
mp
licat
ion
s
Clie
nt
giv
en
dat
e t
o r
etu
rn t
o
SD
P
for
che
ck-u
p
and
/or
add
itio
nal
su
pp
lies
Type of facility Primary level 93.4 94.4 89.3 86.7 84.1 77.9 86.6 Secondary level 94.0 94.6 89.0 86.4 84.7 75.5 86.8 Tertiary Level 93.1 97.9 91.5 90.0 87.8 80.4 91.1 Region Kampala 90.5 97.1 82.8 80.2 78.1 72.2 78.6 Central 1 96.3 98.3 91.1 90.2 88.3 76.1 96.5 Central 2 94.5 83.4 96.1 96.4 94.2 94.8 94.1 East Central 96.3 96.8 86.7 83.9 84.9 77.5 93.6 Eastern 95.1 97.1 84.9 81.7 78.1 68.0 90.8
Karamoja 87.0 87.0 100.0 95.7 82.6 60.9 91.3
Northern 79.8 86.0 90.5 87.6 88.1 86.9 86.4 West Nile 94.7 94.5 93.4 92.5 91.7 85.3 67.2 Western 89.4 97.3 83.1 82.6 82.8 79.1 84.7 South western 95.5 94.7 92.8 86.5 81.3 74.5 86.0 Residence Urban 91.1 94.8 87.6 85.9 83.9 77.4 86.2 Rural 94.8 94.6 90.2 87.3 84.8 77.5 87.3 Management Government 93.2 94.3 89.6 86.8 84.4 77.9 87.3 Private 90.8 98.1 84.9 82.4 80.4 75.2 81.5 NGO/PNFP 97.4 93.8 90.5 90.0 88.4 77.1 89.5 Other 100.0 100.0 100.0 95.2 85.7 71.4 75.0
Total 93.5 94.7 89.3 86.8 84.5 77.5 86.9
4.2.2 Percentage distribution of client’s perceptive of FP service organizational aspect Apart from the waiting time which was perceived to be long with 36% clients dissatisfied overall, most FP clients were satisfied with the organization aspects of the SDPs. For instance 95% were satisfied with privacy, 93% satisfied with time allocation to cases and 92% on satisfied with cleanliness. The observed high levels of satisfaction could be attributed to
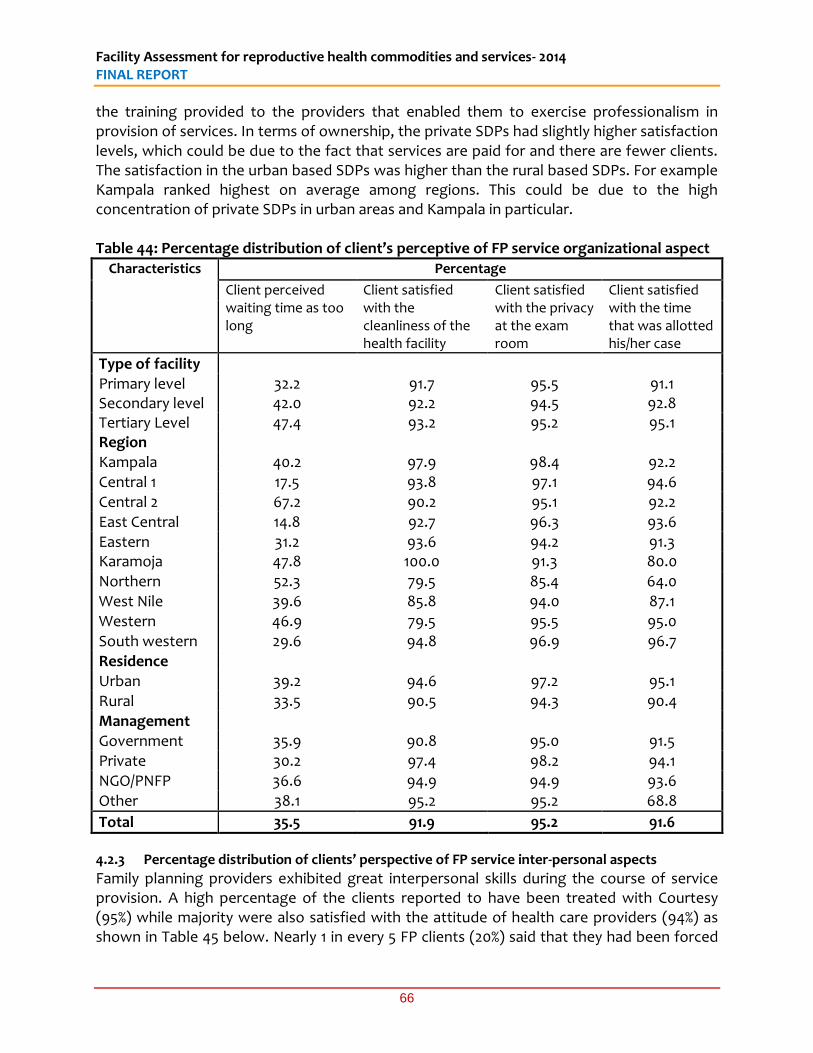
Facility Assessment for reproductive health commodities and services- 2014 FINAL REPORT
66
the training provided to the providers that enabled them to exercise professionalism in provision of services. In terms of ownership, the private SDPs had slightly higher satisfaction levels, which could be due to the fact that services are paid for and there are fewer clients. The satisfaction in the urban based SDPs was higher than the rural based SDPs. For example Kampala ranked highest on average among regions. This could be due to the high concentration of private SDPs in urban areas and Kampala in particular. Table 44: Percentage distribution of client’s perceptive of FP service organizational aspect
Characteristics Percentage
Client perceived waiting time as too long
Client satisfied with the cleanliness of the health facility
Client satisfied with the privacy at the exam room
Client satisfied with the time that was allotted his/her case
Type of facility Primary level 32.2 91.7 95.5 91.1 Secondary level 42.0 92.2 94.5 92.8 Tertiary Level 47.4 93.2 95.2 95.1 Region Kampala 40.2 97.9 98.4 92.2 Central 1 17.5 93.8 97.1 94.6 Central 2 67.2 90.2 95.1 92.2 East Central 14.8 92.7 96.3 93.6 Eastern 31.2 93.6 94.2 91.3 Karamoja 47.8 100.0 91.3 80.0
Northern 52.3 79.5 85.4 64.0 West Nile 39.6 85.8 94.0 87.1 Western 46.9 79.5 95.5 95.0 South western 29.6 94.8 96.9 96.7 Residence Urban 39.2 94.6 97.2 95.1 Rural 33.5 90.5 94.3 90.4 Management Government 35.9 90.8 95.0 91.5 Private 30.2 97.4 98.2 94.1 NGO/PNFP 36.6 94.9 94.9 93.6
Other 38.1 95.2 95.2 68.8
Total 35.5 91.9 95.2 91.6
4.2.3 Percentage distribution of clients’ perspective of FP service inter-personal aspects
Family planning providers exhibited great interpersonal skills during the course of service provision. A high percentage of the clients reported to have been treated with Courtesy (95%) while majority were also satisfied with the attitude of health care providers (94%) as shown in Table 45 below. Nearly 1 in every 5 FP clients (20%) said that they had been forced
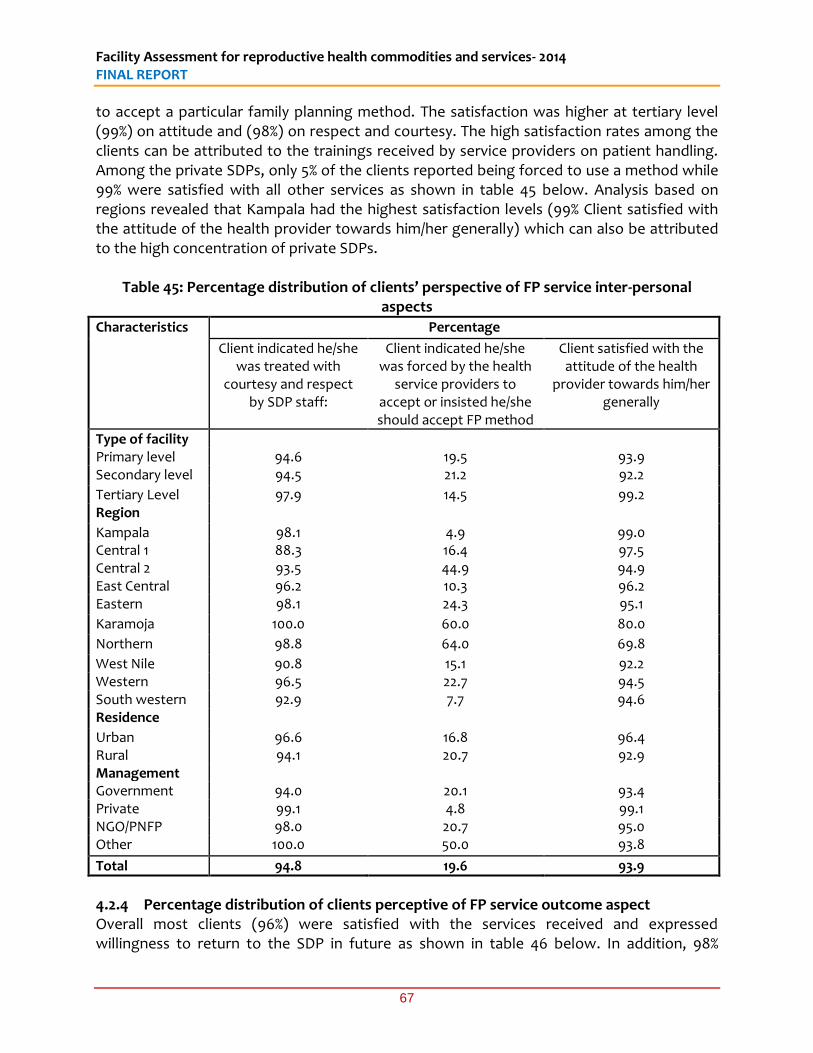
Facility Assessment for reproductive health commodities and services- 2014 FINAL REPORT
67
to accept a particular family planning method. The satisfaction was higher at tertiary level (99%) on attitude and (98%) on respect and courtesy. The high satisfaction rates among the clients can be attributed to the trainings received by service providers on patient handling. Among the private SDPs, only 5% of the clients reported being forced to use a method while 99% were satisfied with all other services as shown in table 45 below. Analysis based on regions revealed that Kampala had the highest satisfaction levels (99% Client satisfied with the attitude of the health provider towards him/her generally) which can also be attributed to the high concentration of private SDPs.
Table 45: Percentage distribution of clients’ perspective of FP service inter-personal aspects
Characteristics Percentage
Client indicated he/she was treated with
courtesy and respect by SDP staff:
Client indicated he/she was forced by the health
service providers to accept or insisted he/she should accept FP method
Client satisfied with the attitude of the health
provider towards him/her generally
Type of facility Primary level 94.6 19.5 93.9 Secondary level 94.5 21.2 92.2
Tertiary Level 97.9 14.5 99.2 Region
Kampala 98.1 4.9 99.0 Central 1 88.3 16.4 97.5 Central 2 93.5 44.9 94.9 East Central 96.2 10.3 96.2 Eastern 98.1 24.3 95.1
Karamoja 100.0 60.0 80.0
Northern 98.8 64.0 69.8
West Nile 90.8 15.1 92.2 Western 96.5 22.7 94.5 South western 92.9 7.7 94.6 Residence
Urban 96.6 16.8 96.4 Rural 94.1 20.7 92.9 Management Government 94.0 20.1 93.4 Private 99.1 4.8 99.1 NGO/PNFP 98.0 20.7 95.0 Other 100.0 50.0 93.8
Total 94.8 19.6 93.9
4.2.4 Percentage distribution of clients perceptive of FP service outcome aspect Overall most clients (96%) were satisfied with the services received and expressed willingness to return to the SDP in future as shown in table 46 below. In addition, 98%
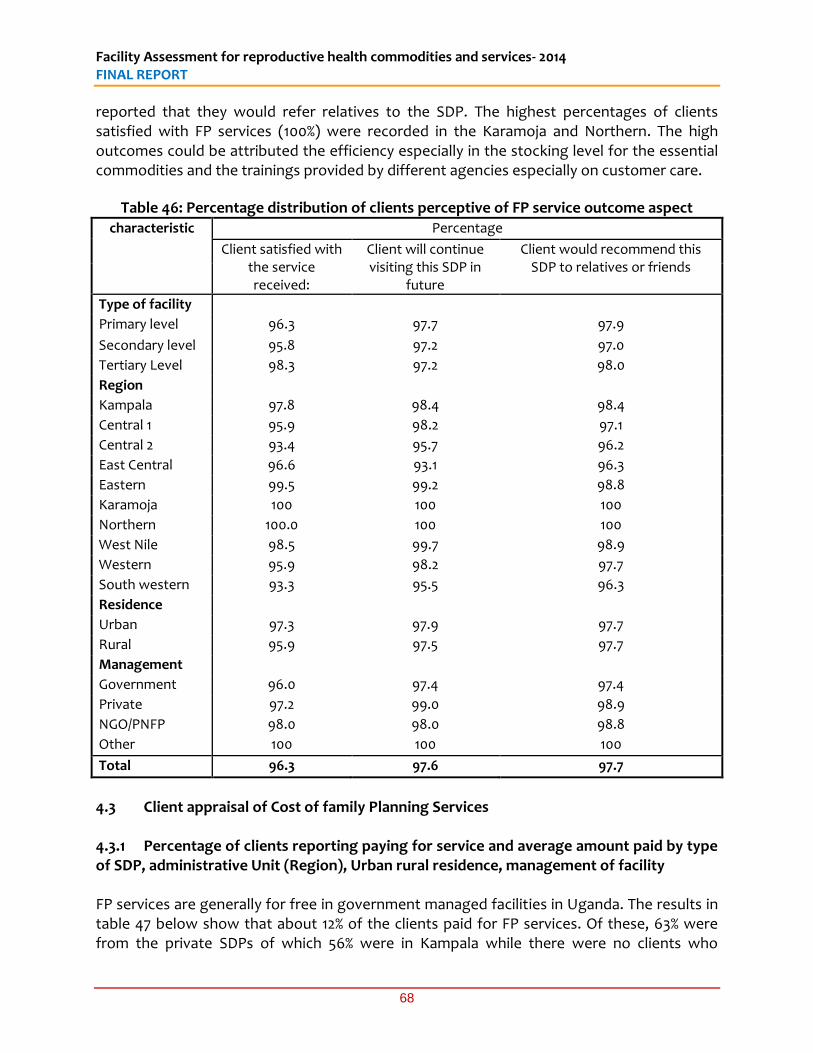
Facility Assessment for reproductive health commodities and services- 2014 FINAL REPORT
68
reported that they would refer relatives to the SDP. The highest percentages of clients satisfied with FP services (100%) were recorded in the Karamoja and Northern. The high outcomes could be attributed the efficiency especially in the stocking level for the essential commodities and the trainings provided by different agencies especially on customer care.
Table 46: Percentage distribution of clients perceptive of FP service outcome aspect
characteristic Percentage
Client satisfied with the service received:
Client will continue visiting this SDP in
future
Client would recommend this SDP to relatives or friends
Type of facility
Primary level 96.3 97.7 97.9
Secondary level 95.8 97.2 97.0
Tertiary Level 98.3 97.2 98.0
Region
Kampala 97.8 98.4 98.4
Central 1 95.9 98.2 97.1
Central 2 93.4 95.7 96.2
East Central 96.6 93.1 96.3
Eastern 99.5 99.2 98.8
Karamoja 100 100 100
Northern 100.0 100 100
West Nile 98.5 99.7 98.9
Western 95.9 98.2 97.7
South western 93.3 95.5 96.3
Residence
Urban 97.3 97.9 97.7
Rural 95.9 97.5 97.7
Management
Government 96.0 97.4 97.4
Private 97.2 99.0 98.9
NGO/PNFP 98.0 98.0 98.8
Other 100 100 100
Total 96.3 97.6 97.7
4.3 Client appraisal of Cost of family Planning Services 4.3.1 Percentage of clients reporting paying for service and average amount paid by type of SDP, administrative Unit (Region), Urban rural residence, management of facility FP services are generally for free in government managed facilities in Uganda. The results in table 47 below show that about 12% of the clients paid for FP services. Of these, 63% were from the private SDPs of which 56% were in Kampala while there were no clients who

Facility Assessment for reproductive health commodities and services- 2014 FINAL REPORT
69
reported to have paid for FP services in the Karamoja region. The charging of high fees for FP services in Kampala is attributed to the high number of private SDPs. On average Contraceptives from service provider (Provider dependent such as BTL, IUD, Implants) were more expensive (UGX 7000) compared to those purchased from pharmacy (Provider independent such as Condom or pills). Consultation fees were UGX 10,000 on average and were highest in Kampala (UGX 31,000), while Laboratory/X-ray cost UGX 6,200 on average. FP services were generally more expensive in urban areas compared to rural areas. On average, those that reported to have paid for FP services, paid UGX 4,200 in government facilities, UGX 5, 400 in private facilities and 6,000 in NGO based facilities.
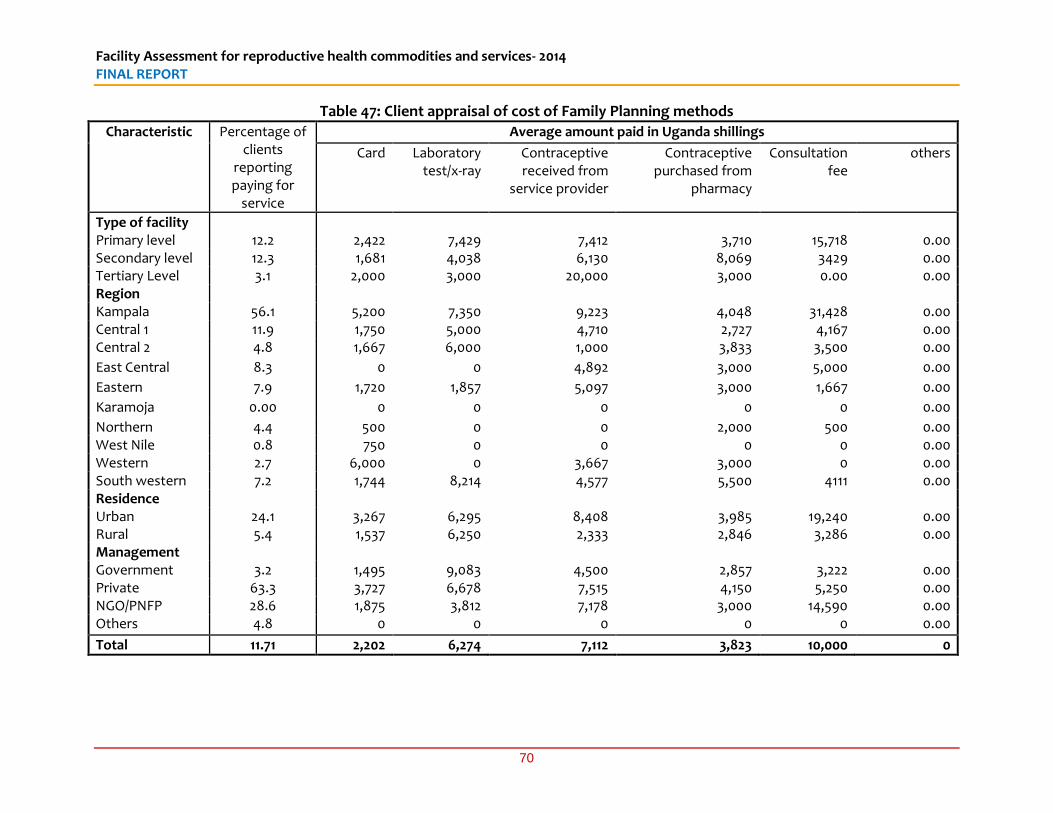
Facility Assessment for reproductive health commodities and services- 2014 FINAL REPORT
70
Table 47: Client appraisal of cost of Family Planning methods
Characteristic Percentage of clients
reporting paying for
service
Average amount paid in Uganda shillings
Card Laboratory test/x-ray
Contraceptive received from
service provider
Contraceptive purchased from
pharmacy
Consultation fee
others
Type of facility Primary level 12.2 2,422 7,429 7,412 3,710 15,718 0.00 Secondary level 12.3 1,681 4,038 6,130 8,069 3429 0.00 Tertiary Level 3.1 2,000 3,000 20,000 3,000 0.00 0.00 Region Kampala 56.1 5,200 7,350 9,223 4,048 31,428 0.00 Central 1 11.9 1,750 5,000 4,710 2,727 4,167 0.00 Central 2 4.8 1,667 6,000 1,000 3,833 3,500 0.00
East Central 8.3 0 0 4,892 3,000 5,000 0.00
Eastern 7.9 1,720 1,857 5,097 3,000 1,667 0.00
Karamoja 0.00 0 0 0 0 0 0.00
Northern 4.4 500 0 0 2,000 500 0.00 West Nile 0.8 750 0 0 0 0 0.00 Western 2.7 6,000 0 3,667 3,000 0 0.00 South western 7.2 1,744 8,214 4,577 5,500 4111 0.00 Residence Urban 24.1 3,267 6,295 8,408 3,985 19,240 0.00 Rural 5.4 1,537 6,250 2,333 2,846 3,286 0.00 Management Government 3.2 1,495 9,083 4,500 2,857 3,222 0.00 Private 63.3 3,727 6,678 7,515 4,150 5,250 0.00 NGO/PNFP 28.6 1,875 3,812 7,178 3,000 14,590 0.00 Others 4.8 0 0 0 0 0 0.00
Total 11.71 2,202 6,274 7,112 3,823 10,000 0
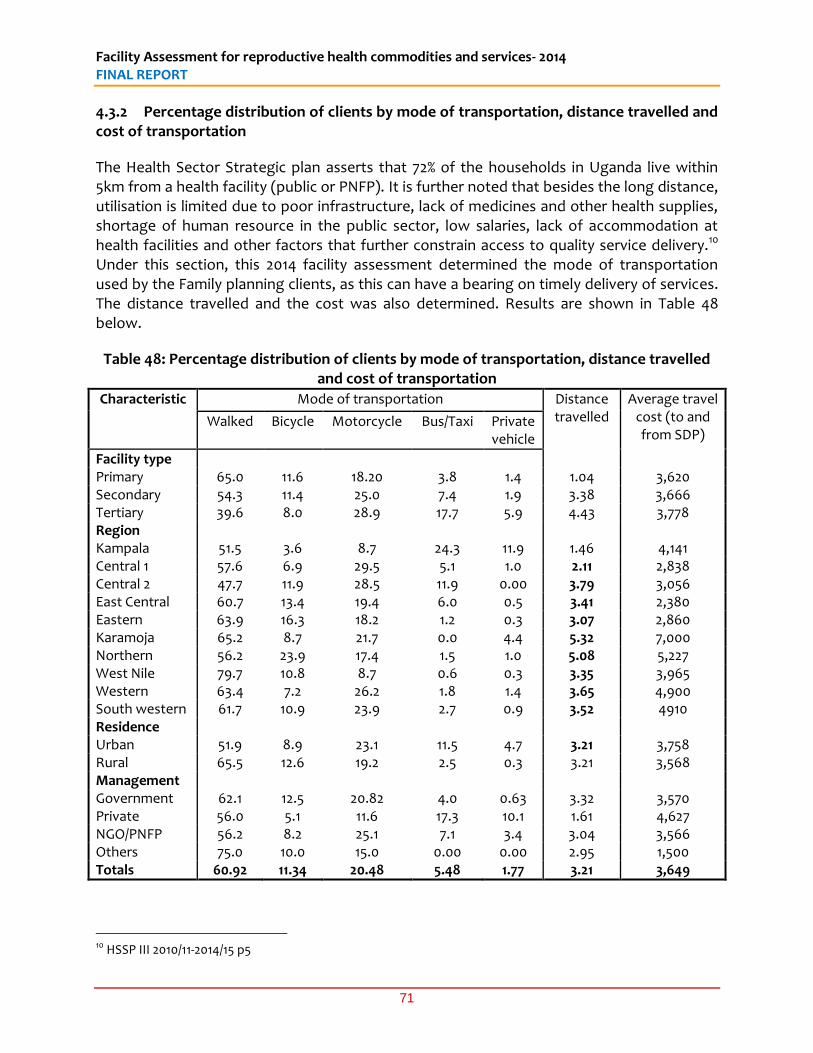
Facility Assessment for reproductive health commodities and services- 2014 FINAL REPORT
71
4.3.2 Percentage distribution of clients by mode of transportation, distance travelled and cost of transportation
The Health Sector Strategic plan asserts that 72% of the households in Uganda live within 5km from a health facility (public or PNFP). It is further noted that besides the long distance, utilisation is limited due to poor infrastructure, lack of medicines and other health supplies, shortage of human resource in the public sector, low salaries, lack of accommodation at health facilities and other factors that further constrain access to quality service delivery.10 Under this section, this 2014 facility assessment determined the mode of transportation used by the Family planning clients, as this can have a bearing on timely delivery of services. The distance travelled and the cost was also determined. Results are shown in Table 48 below.
Table 48: Percentage distribution of clients by mode of transportation, distance travelled and cost of transportation
Characteristic Mode of transportation Distance travelled
Average travel cost (to and from SDP)
Walked
Bicycle
Motorcycle
Bus/Taxi
Private vehicle
Facility type Primary 65.0 11.6 18.20 3.8 1.4 1.04 3,620 Secondary 54.3 11.4 25.0 7.4 1.9 3.38 3,666 Tertiary 39.6 8.0 28.9 17.7 5.9 4.43 3,778 Region Kampala 51.5 3.6 8.7 24.3 11.9 1.46 4,141 Central 1 57.6 6.9 29.5 5.1 1.0 2.11 2,838 Central 2 47.7 11.9 28.5 11.9 0.00 3.79 3,056 East Central 60.7 13.4 19.4 6.0 0.5 3.41 2,380 Eastern 63.9 16.3 18.2 1.2 0.3 3.07 2,860 Karamoja 65.2 8.7 21.7 0.0 4.4 5.32 7,000 Northern 56.2 23.9 17.4 1.5 1.0 5.08 5,227 West Nile 79.7 10.8 8.7 0.6 0.3 3.35 3,965 Western 63.4 7.2 26.2 1.8 1.4 3.65 4,900 South western 61.7 10.9 23.9 2.7 0.9 3.52 4910 Residence Urban 51.9 8.9 23.1 11.5 4.7 3.21 3,758 Rural 65.5 12.6 19.2 2.5 0.3 3.21 3,568 Management Government 62.1 12.5 20.82 4.0 0.63 3.32 3,570 Private 56.0 5.1 11.6 17.3 10.1 1.61 4,627 NGO/PNFP 56.2 8.2 25.1 7.1 3.4 3.04 3,566 Others 75.0 10.0 15.0 0.00 0.00 2.95 1,500 Totals 60.92 11.34 20.48 5.48 1.77 3.21 3,649
10 HSSP III 2010/11-2014/15 p5
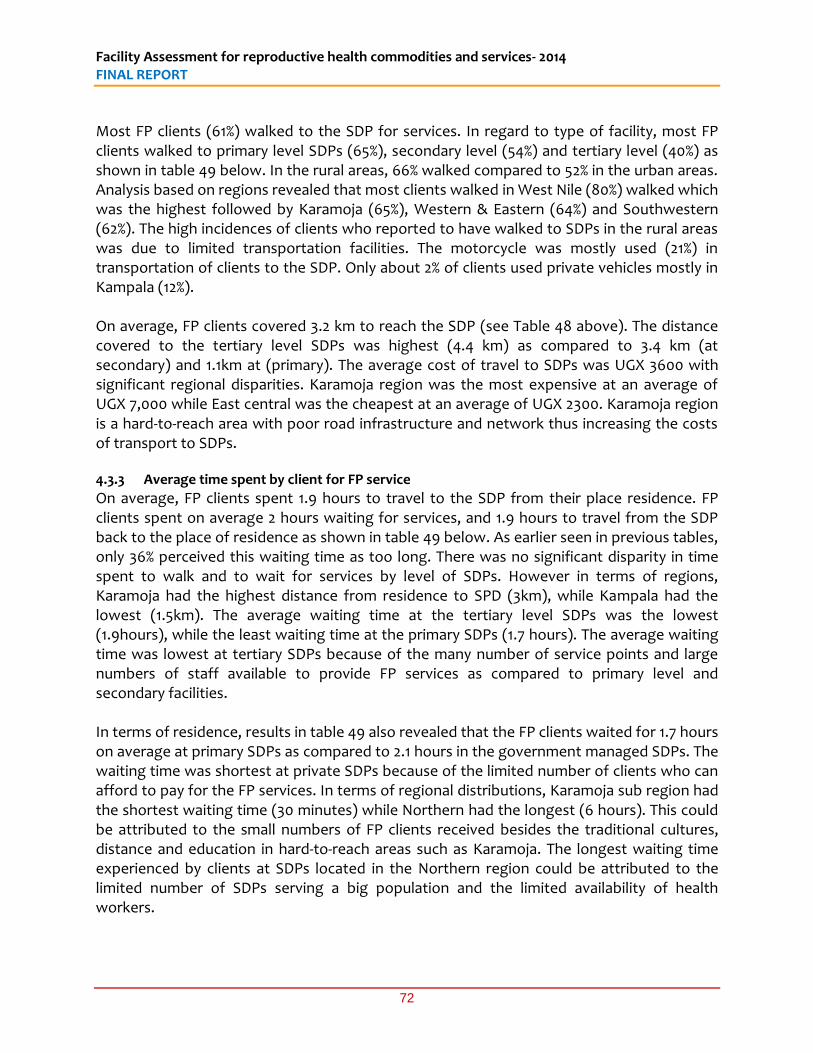
Facility Assessment for reproductive health commodities and services- 2014 FINAL REPORT
72
Most FP clients (61%) walked to the SDP for services. In regard to type of facility, most FP clients walked to primary level SDPs (65%), secondary level (54%) and tertiary level (40%) as shown in table 49 below. In the rural areas, 66% walked compared to 52% in the urban areas. Analysis based on regions revealed that most clients walked in West Nile (80%) walked which was the highest followed by Karamoja (65%), Western & Eastern (64%) and Southwestern (62%). The high incidences of clients who reported to have walked to SDPs in the rural areas was due to limited transportation facilities. The motorcycle was mostly used (21%) in transportation of clients to the SDP. Only about 2% of clients used private vehicles mostly in Kampala (12%). On average, FP clients covered 3.2 km to reach the SDP (see Table 48 above). The distance covered to the tertiary level SDPs was highest (4.4 km) as compared to 3.4 km (at secondary) and 1.1km at (primary). The average cost of travel to SDPs was UGX 3600 with significant regional disparities. Karamoja region was the most expensive at an average of UGX 7,000 while East central was the cheapest at an average of UGX 2300. Karamoja region is a hard-to-reach area with poor road infrastructure and network thus increasing the costs of transport to SDPs. 4.3.3 Average time spent by client for FP service
On average, FP clients spent 1.9 hours to travel to the SDP from their place residence. FP clients spent on average 2 hours waiting for services, and 1.9 hours to travel from the SDP back to the place of residence as shown in table 49 below. As earlier seen in previous tables, only 36% perceived this waiting time as too long. There was no significant disparity in time spent to walk and to wait for services by level of SDPs. However in terms of regions, Karamoja had the highest distance from residence to SPD (3km), while Kampala had the lowest (1.5km). The average waiting time at the tertiary level SDPs was the lowest (1.9hours), while the least waiting time at the primary SDPs (1.7 hours). The average waiting time was lowest at tertiary SDPs because of the many number of service points and large numbers of staff available to provide FP services as compared to primary level and secondary facilities. In terms of residence, results in table 49 also revealed that the FP clients waited for 1.7 hours on average at primary SDPs as compared to 2.1 hours in the government managed SDPs. The waiting time was shortest at private SDPs because of the limited number of clients who can afford to pay for the FP services. In terms of regional distributions, Karamoja sub region had the shortest waiting time (30 minutes) while Northern had the longest (6 hours). This could be attributed to the small numbers of FP clients received besides the traditional cultures, distance and education in hard-to-reach areas such as Karamoja. The longest waiting time experienced by clients at SDPs located in the Northern region could be attributed to the limited number of SDPs serving a big population and the limited availability of health workers.
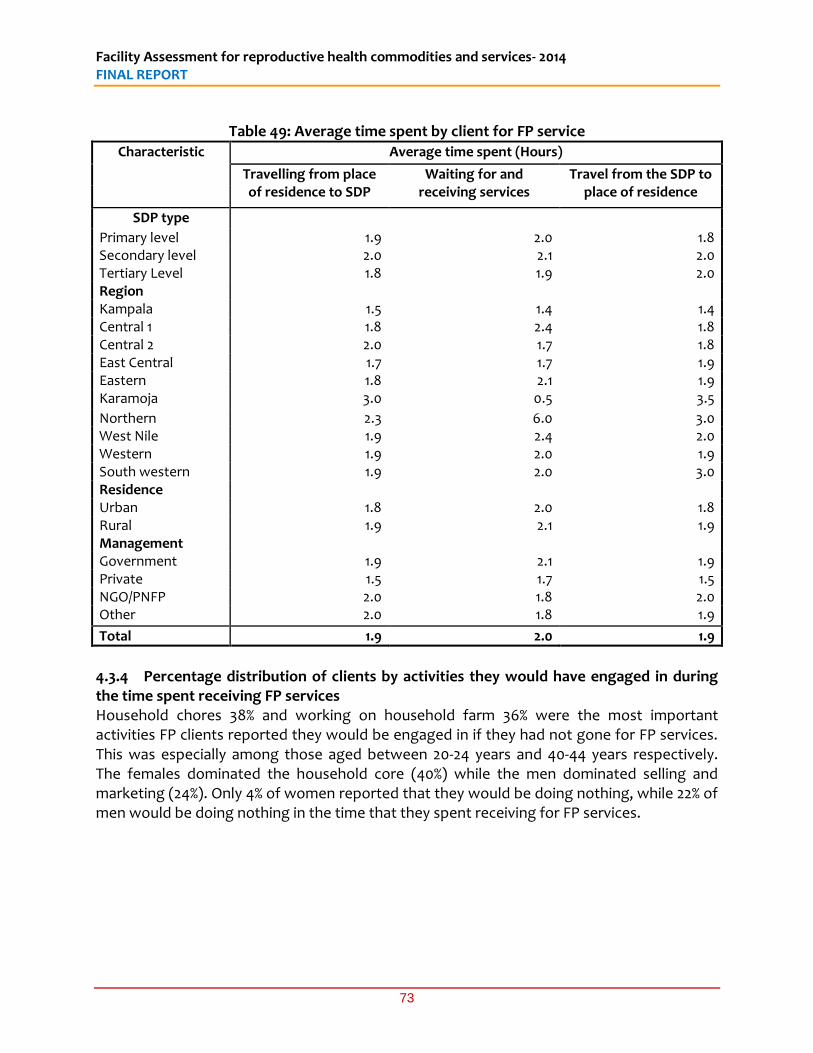
Facility Assessment for reproductive health commodities and services- 2014 FINAL REPORT
73
Table 49: Average time spent by client for FP service
Characteristic Average time spent (Hours)
Travelling from place of residence to SDP
Waiting for and receiving services
Travel from the SDP to place of residence
SDP type
Primary level 1.9 2.0 1.8 Secondary level 2.0 2.1 2.0 Tertiary Level 1.8 1.9 2.0 Region Kampala 1.5 1.4 1.4 Central 1 1.8 2.4 1.8 Central 2 2.0 1.7 1.8 East Central 1.7 1.7 1.9 Eastern 1.8 2.1 1.9 Karamoja 3.0 0.5 3.5
Northern 2.3 6.0 3.0 West Nile 1.9 2.4 2.0 Western 1.9 2.0 1.9 South western 1.9 2.0 3.0 Residence Urban 1.8 2.0 1.8 Rural 1.9 2.1 1.9 Management Government 1.9 2.1 1.9 Private 1.5 1.7 1.5 NGO/PNFP 2.0 1.8 2.0 Other 2.0 1.8 1.9
Total 1.9 2.0 1.9
4.3.4 Percentage distribution of clients by activities they would have engaged in during the time spent receiving FP services Household chores 38% and working on household farm 36% were the most important activities FP clients reported they would be engaged in if they had not gone for FP services. This was especially among those aged between 20-24 years and 40-44 years respectively. The females dominated the household core (40%) while the men dominated selling and marketing (24%). Only 4% of women reported that they would be doing nothing, while 22% of men would be doing nothing in the time that they spent receiving for FP services.
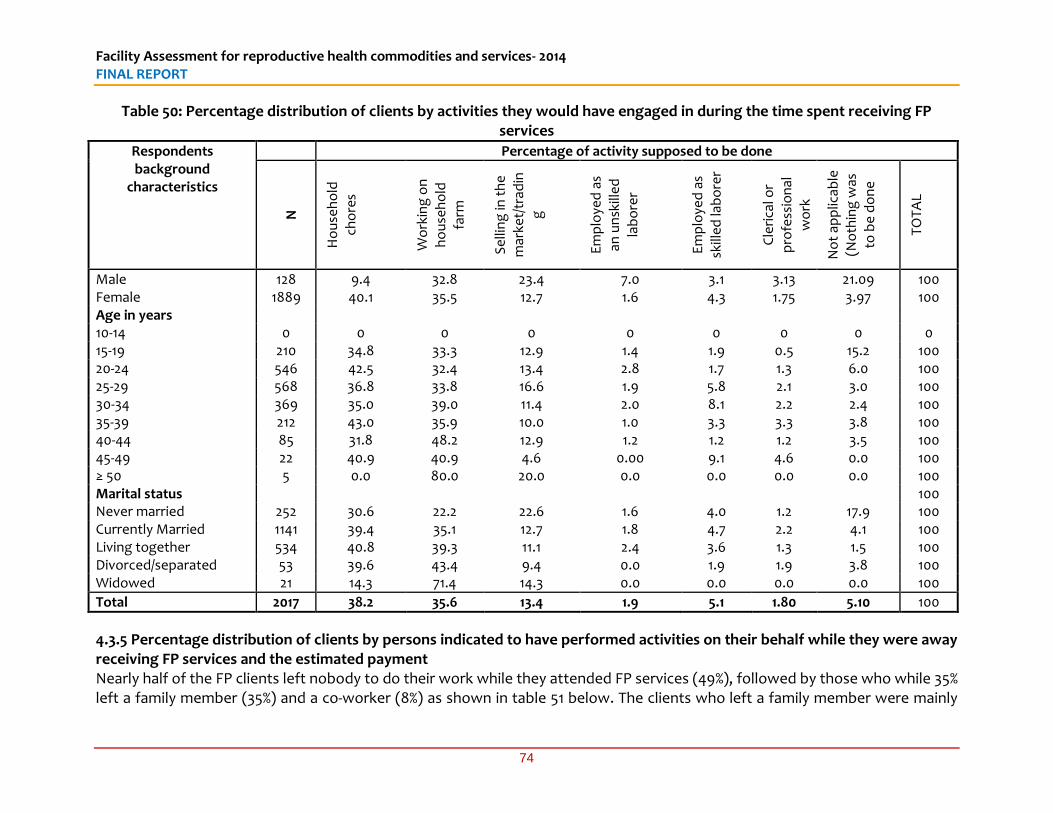
Facility Assessment for reproductive health commodities and services- 2014 FINAL REPORT
74
Table 50: Percentage distribution of clients by activities they would have engaged in during the time spent receiving FP services
Respondents background
characteristics
Percentage of activity supposed to be done
N
Ho
use
ho
ld
cho
res
Wo
rkin
g o
n
ho
use
ho
ld
farm
Se
llin
g in
th
e
mar
ket/
trad
ing
Em
plo
yed
as
an u
nsk
ille
d
lab
ore
r
Em
plo
yed
as
skill
ed
lab
ore
r
Cle
rica
l or
pro
fess
ion
al
wo
rk
No
t ap
plic
able
(N
oth
ing
was
to
be
do
ne
TO
TAL
Male 128 9.4 32.8 23.4 7.0 3.1 3.13 21.09 100 Female 1889 40.1 35.5 12.7 1.6 4.3 1.75 3.97 100 Age in years 10-14 0 0 0 0 0 0 0 0 0 15-19 210 34.8 33.3 12.9 1.4 1.9 0.5 15.2 100 20-24 546 42.5 32.4 13.4 2.8 1.7 1.3 6.0 100 25-29 568 36.8 33.8 16.6 1.9 5.8 2.1 3.0 100 30-34 369 35.0 39.0 11.4 2.0 8.1 2.2 2.4 100 35-39 212 43.0 35.9 10.0 1.0 3.3 3.3 3.8 100 40-44 85 31.8 48.2 12.9 1.2 1.2 1.2 3.5 100 45-49 22 40.9 40.9 4.6 0.00 9.1 4.6 0.0 100 ≥ 50 5 0.0 80.0 20.0 0.0 0.0 0.0 0.0 100 Marital status 100 Never married 252 30.6 22.2 22.6 1.6 4.0 1.2 17.9 100 Currently Married 1141 39.4 35.1 12.7 1.8 4.7 2.2 4.1 100 Living together 534 40.8 39.3 11.1 2.4 3.6 1.3 1.5 100 Divorced/separated 53 39.6 43.4 9.4 0.0 1.9 1.9 3.8 100 Widowed 21 14.3 71.4 14.3 0.0 0.0 0.0 0.0 100
Total 2017 38.2 35.6 13.4 1.9 5.1 1.80 5.10 100
4.3.5 Percentage distribution of clients by persons indicated to have performed activities on their behalf while they were away receiving FP services and the estimated payment Nearly half of the FP clients left nobody to do their work while they attended FP services (49%), followed by those who while 35% left a family member (35%) and a co-worker (8%) as shown in table 51 below. The clients who left a family member were mainly
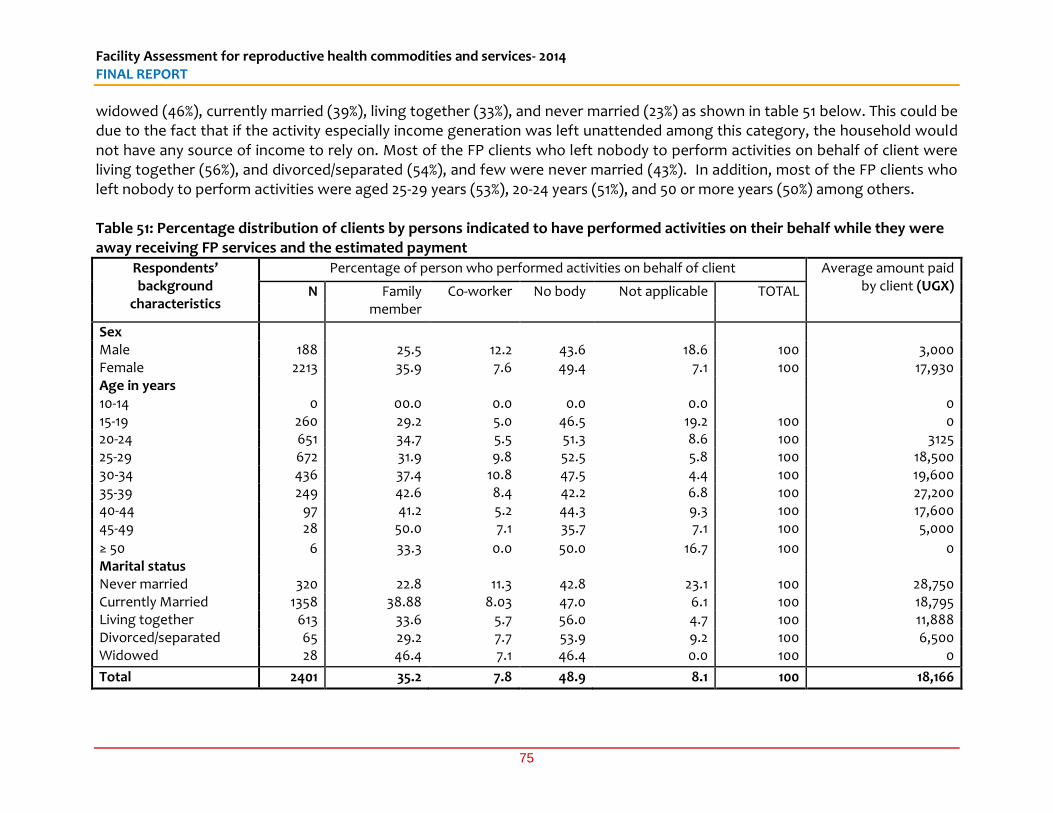
Facility Assessment for reproductive health commodities and services- 2014 FINAL REPORT
75
widowed (46%), currently married (39%), living together (33%), and never married (23%) as shown in table 51 below. This could be due to the fact that if the activity especially income generation was left unattended among this category, the household would not have any source of income to rely on. Most of the FP clients who left nobody to perform activities on behalf of client were living together (56%), and divorced/separated (54%), and few were never married (43%). In addition, most of the FP clients who left nobody to perform activities were aged 25-29 years (53%), 20-24 years (51%), and 50 or more years (50%) among others. Table 51: Percentage distribution of clients by persons indicated to have performed activities on their behalf while they were away receiving FP services and the estimated payment
Respondents’ background
characteristics
Percentage of person who performed activities on behalf of client Average amount paid by client (UGX) N Family
member Co-worker No body Not applicable TOTAL
Sex Male 188 25.5 12.2 43.6 18.6 100 3,000 Female 2213 35.9 7.6 49.4 7.1 100 17,930 Age in years 10-14 0 00.0 0.0 0.0 0.0 0 15-19 260 29.2 5.0 46.5 19.2 100 0 20-24 651 34.7 5.5 51.3 8.6 100 3125 25-29 672 31.9 9.8 52.5 5.8 100 18,500 30-34 436 37.4 10.8 47.5 4.4 100 19,600 35-39 249 42.6 8.4 42.2 6.8 100 27,200 40-44 97 41.2 5.2 44.3 9.3 100 17,600 45-49 28 50.0 7.1 35.7 7.1 100 5,000
≥ 50 6 33.3 0.0 50.0 16.7 100 0 Marital status Never married 320 22.8 11.3 42.8 23.1 100 28,750 Currently Married 1358 38.88 8.03 47.0 6.1 100 18,795 Living together 613 33.6 5.7 56.0 4.7 100 11,888 Divorced/separated 65 29.2 7.7 53.9 9.2 100 6,500 Widowed 28 46.4 7.1 46.4 0.0 100 0
Total 2401 35.2 7.8 48.9 8.1 100 18,166
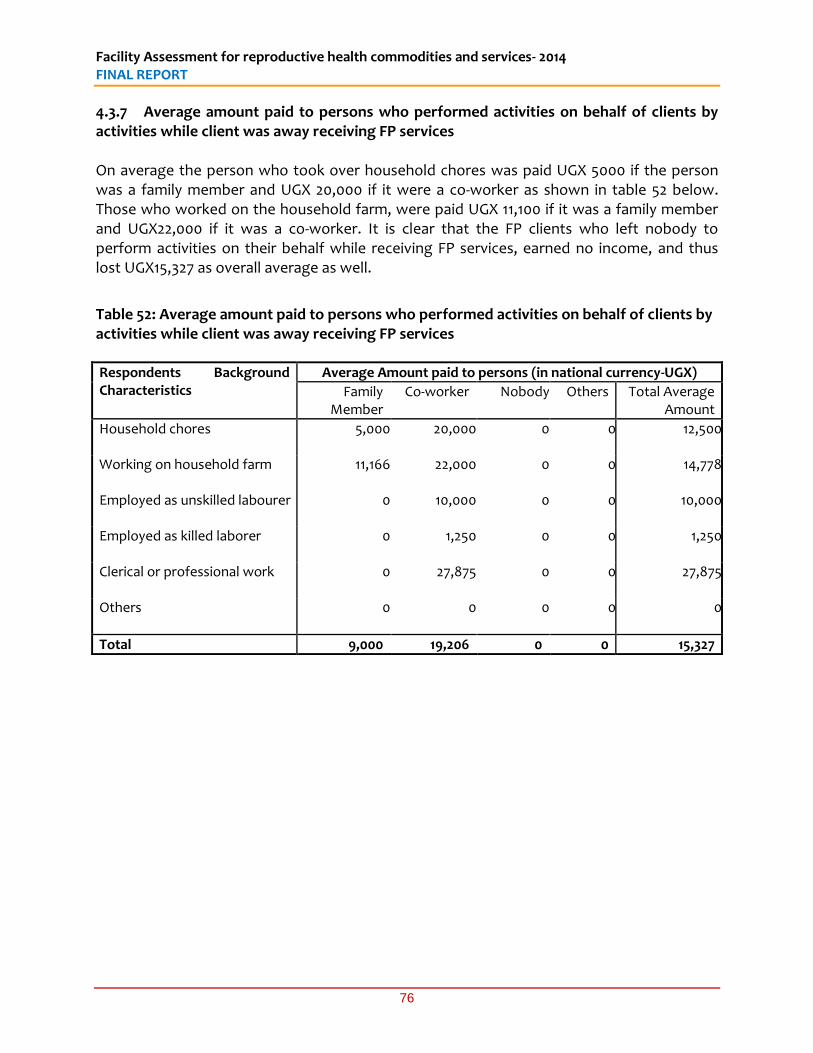
Facility Assessment for reproductive health commodities and services- 2014 FINAL REPORT
76
4.3.7 Average amount paid to persons who performed activities on behalf of clients by activities while client was away receiving FP services On average the person who took over household chores was paid UGX 5000 if the person was a family member and UGX 20,000 if it were a co-worker as shown in table 52 below. Those who worked on the household farm, were paid UGX 11,100 if it was a family member and UGX22,000 if it was a co-worker. It is clear that the FP clients who left nobody to perform activities on their behalf while receiving FP services, earned no income, and thus lost UGX15,327 as overall average as well.
Table 52: Average amount paid to persons who performed activities on behalf of clients by activities while client was away receiving FP services
Respondents Background Characteristics
Average Amount paid to persons (in national currency-UGX)
Family Member
Co-worker Nobody Others Total Average Amount
Household chores
5,000 20,000 0 0 12,500
Working on household farm
11,166 22,000 0 0 14,778
Employed as unskilled labourer
0 10,000 0 0 10,000
Employed as killed laborer
0 1,250 0 0 1,250
Clerical or professional work
0 27,875 0 0 27,875
Others
0 0 0 0 0
Total 9,000 19,206 0 0 15,327
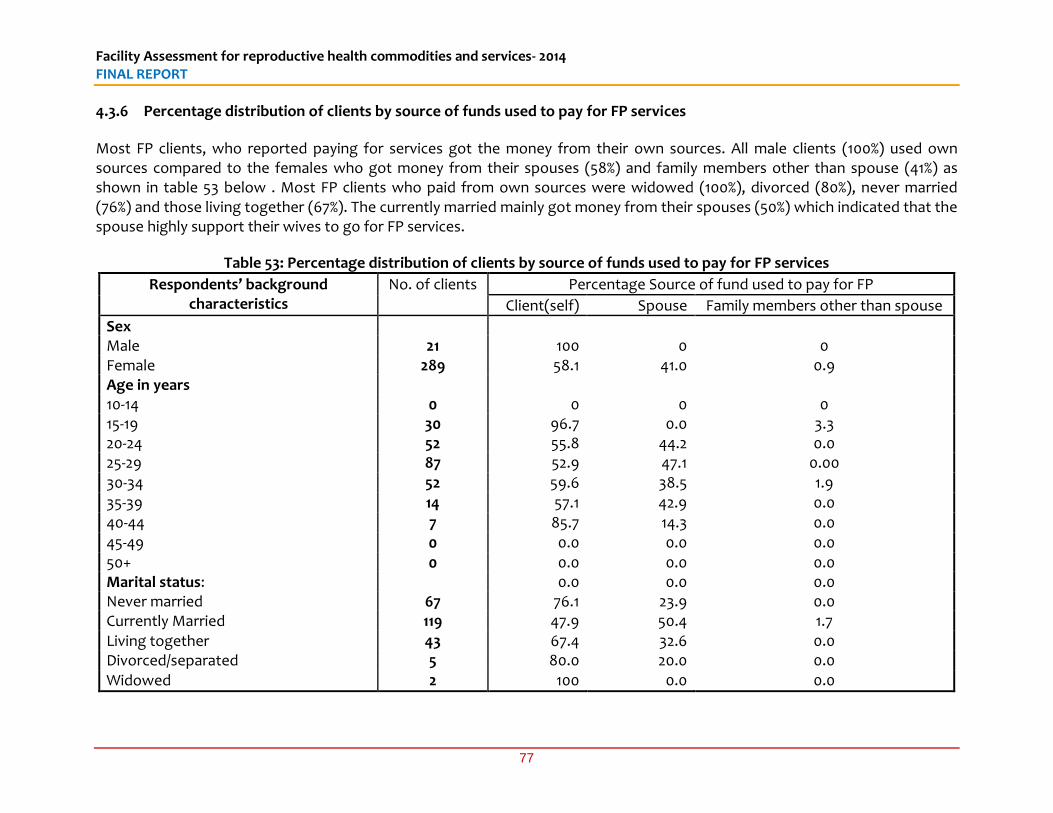
Facility Assessment for reproductive health commodities and services- 2014 FINAL REPORT
77
4.3.6 Percentage distribution of clients by source of funds used to pay for FP services
Most FP clients, who reported paying for services got the money from their own sources. All male clients (100%) used own sources compared to the females who got money from their spouses (58%) and family members other than spouse (41%) as shown in table 53 below . Most FP clients who paid from own sources were widowed (100%), divorced (80%), never married (76%) and those living together (67%). The currently married mainly got money from their spouses (50%) which indicated that the spouse highly support their wives to go for FP services.
Table 53: Percentage distribution of clients by source of funds used to pay for FP services
Respondents’ background characteristics
No. of clients Percentage Source of fund used to pay for FP
Client(self) Spouse Family members other than spouse
Sex Male 21 100 0 0 Female 289 58.1 41.0 0.9 Age in years 10-14 0 0 0 0 15-19 30 96.7 0.0 3.3 20-24 52 55.8 44.2 0.0 25-29 87 52.9 47.1 0.00 30-34 52 59.6 38.5 1.9 35-39 14 57.1 42.9 0.0 40-44 7 85.7 14.3 0.0 45-49 0 0.0 0.0 0.0 50+ 0 0.0 0.0 0.0 Marital status: 0.0 0.0 0.0 Never married 67 76.1 23.9 0.0 Currently Married 119 47.9 50.4 1.7 Living together 43 67.4 32.6 0.0 Divorced/separated 5 80.0 20.0 0.0 Widowed 2 100 0.0 0.0
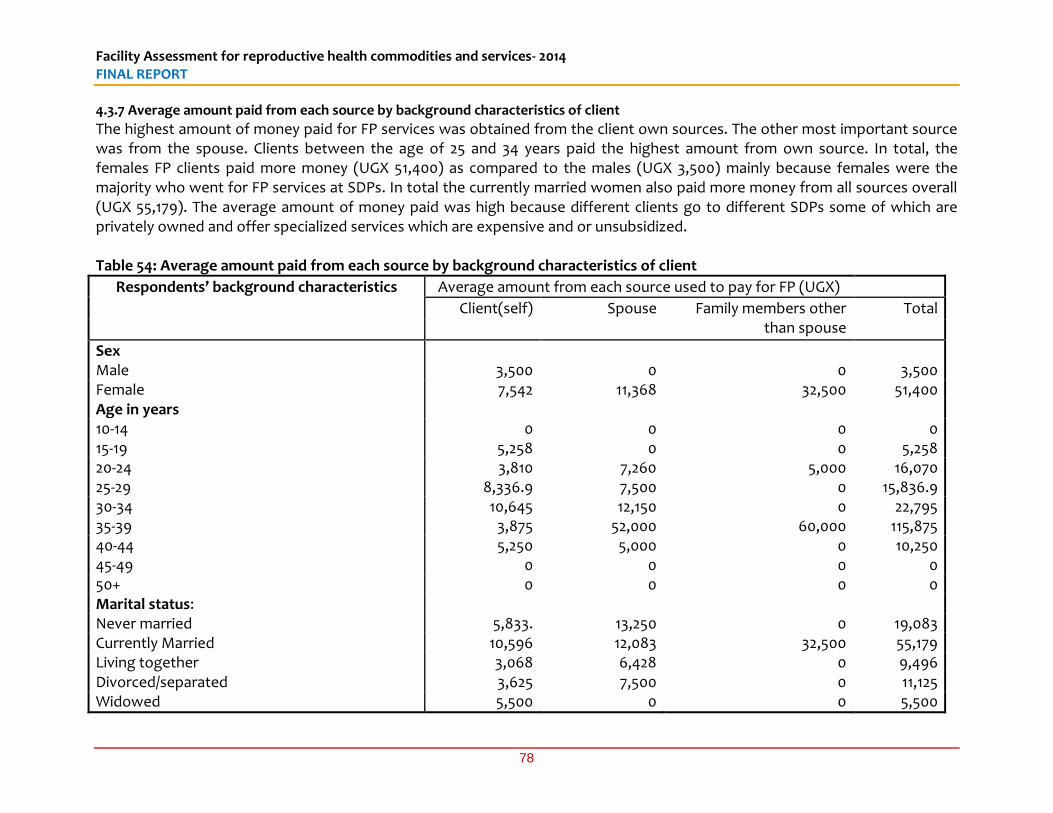
Facility Assessment for reproductive health commodities and services- 2014 FINAL REPORT
78
4.3.7 Average amount paid from each source by background characteristics of client
The highest amount of money paid for FP services was obtained from the client own sources. The other most important source was from the spouse. Clients between the age of 25 and 34 years paid the highest amount from own source. In total, the females FP clients paid more money (UGX 51,400) as compared to the males (UGX 3,500) mainly because females were the majority who went for FP services at SDPs. In total the currently married women also paid more money from all sources overall (UGX 55,179). The average amount of money paid was high because different clients go to different SDPs some of which are privately owned and offer specialized services which are expensive and or unsubsidized. Table 54: Average amount paid from each source by background characteristics of client
Respondents’ background characteristics Average amount from each source used to pay for FP (UGX)
Client(self) Spouse Family members other than spouse
Total
Sex Male 3,500 0 0 3,500 Female 7,542 11,368 32,500 51,400 Age in years 10-14 0 0 0 0 15-19 5,258 0 0 5,258 20-24 3,810 7,260 5,000 16,070 25-29 8,336.9 7,500 0 15,836.9 30-34 10,645 12,150 0 22,795 35-39 3,875 52,000 60,000 115,875 40-44 5,250 5,000 0 10,250 45-49 0 0 0 0 50+ 0 0 0 0 Marital status: Never married 5,833. 13,250 0 19,083 Currently Married 10,596 12,083 32,500 55,179 Living together 3,068 6,428 0 9,496 Divorced/separated 3,625 7,500 0 11,125 Widowed 5,500 0 0 5,500
Facility Assessment for reproductive health commodities and services- 2014 FINAL REPORT
79
5 CONCLUSIONS AND RECOMMENDATIONS 5.1 Availability of Modern Contraceptive methods: There was a gap in availability of modern contraceptive methods. The finding that 17% of the primary SDPs did not offer a minimum of three contraceptive methods presents potential missed opportunities for delivery of FP as the range of products may not be sufficient to meet specific demands in some facilities. The reasons given for this included mainly the delay from the suppliers to deliver the supplies after an order has been placed. Another major reason was related to lack of trained staff to provide particular methods like insertion and removal of implants. Some methods like the female condom had low or no demand. 5.2 Not all staff trained on insertion and removal of implants were providing FP services: It was determined that while 70% of SDPs providing family planning services had received training in insertion and removal of implants, over 25% of the trained staff were not actually providing FP services. This sometimes was due to staff being transferred to other departments that are not involved in FP service provision especially in the referral level facilities, lack of equipment or staff leaving the SDPs. Also important to note is that out of the 523 SPDs who had staff trained in provision of FP, majority of these (60%) had this training provided beyond one year ago. 5.3 Lack of Guidelines and job aids for FP: It was determined that guidelines for FP services were available in 60% of facilities, implying that two in five SDPs lacked these guidelines. Checklists and job aids for FP were available in only 51% of the facilities at the Primary level. This is a challenge since facilities are supposed to use the guidelines for reference purposes while job aides are critical in proper execution of duties. 5.4 Charging of user fees for family planning services: In the majority of health facilities, Family Planning services are generally provided free-of-charge in accordance with the Ministry of Health guidelines. However 11% of the SDPs were charging user fees. While the private wings in Public facilities charge for services, the 15% of government owned facilities that charge consultation fees on FP was a cause for concern. The high fees paid by clients of private facilities for FP also needs to be checked before some clients are discourage. For example an FP client in Kampala pays consultation fees of up to UGX 31,000. 5.5 High transportation costs for FP clients: The low uptake of contraceptives in Karamoja region is well documented and sometimes blamed on cultural and traditional beliefs. However, the survey points us to the fact that on average, a client seeking FP services in Karamoja would spend about UGX 7,000 on transportation alone per visit. This is quite high for a region where general income is low compared to other parts of the country. 5.6 Long waiting time for FP services by clients in Karamoja: The average waiting time for FP clients in Karamoja and Northern Uganda was six hours compared to the regional
Facility Assessment for reproductive health commodities and services- 2014 FINAL REPORT
80
average of two hours for the Eastern Region. This is partly attributed to the limited availability of health workers in these two regions categorized as hard-to-reach. 5.7 High levels of satisfaction with services by FP clients: Findings from the exit interviews show that there is high level of satisfaction with FP services among the FP clients. For example, 93% expressed satisfaction with the services offered while 98% would continue visiting the SDP for services in future, and 98% would recommend the services to other people. However, 20% of FP clients reported to have been forced to accept a method of FP, and this was mainly in government facilities. It implies that one in five clients feel they were coerced into a method that they were not comfortable with. 5.8 Un-availability of essential lifesaving maternal and RH medicines: The 38% of SDPs that did not meet the minimum indicative standard for availability of essential and life-saving maternal and RH Medicines (i.e. at least seven indicator medicines including the two essential lifesaving maternal and RH medicines). This included 26% of the secondary level facilities. This was a cause of concern as it showed gaps in emergency RH care. The main reason given for not having certain maternal health medicines was the delay on the part of the supplier/warehouse (75% of respondents). 5.9 Support supervision had some gaps: About 30% of SDPs had not been supervised in the last 12 months by their respective supervisory authority. However, of those who were supervised in the past 12 months, 42 % were supervised monthly, a positive indication of monitoring and support for quality RH service delivery. The MoH notes that supervision is affected by limited budgets and untimely release of funds. It is important that supervision is given priority and release of funds is done in time, to enable support supervision which is a critical component of health services provision. 5.10 Stock-outs of Maama kits: We established that 30% of facilities that are supposed to provide maama kits had stock-outs on the day of the survey, the main reason being the delay on the part of the suppliers. There seems to be major delays for most supplies. In addition, the private facilities do not routinely provide maama kits. 5.11 Long time taken between ordering and receiving of supplies: The average time it takes between ordering and receiving of supplies was six months and above for 17% of the SDPs. This when further analysed included 22% of facilities that are government owned. This is a long period that can potentially lead to disastrous events in the affected facilities; the rural based facilities (21%) also take more than six months to receive supplies. 5.12 Waste disposal methods: Majority of the primary and secondary SDPs dispose heath wastes by burning on their grounds while tertiary SDPs dispose their wasted by incineration. At these levels, the methods used are in conformity with the Uganda National Infection
Facility Assessment for reproductive health commodities and services- 2014 FINAL REPORT
81
Prevention and Control Guidelines 2013 and there is no specific recommendation arising from this finding. 5.13 Recommendations: Regarding availability of modern contraceptive methods, the Ministry of health together with its partners and NMS should review the supply chain management process and ensure that supplies do not take long to get to the facilities. A business process re-engineering of the supply chain management system is recommended to ensure delays and unnecessary process are eliminated to reduce time it takes to supply from when orders are placed. Continuous training for the insertion and removal of implants is encouraged to cater for the gap of lack of trained service providers, a major reason for the stock-out of two methods including Implants (33%) and IUDs (8%). This would ensure that even when staff leave a facility or are transferred to another department, there is continuity in provision of FP services. Sensitization is recommended to increase the demand for some contraceptives like the female condom which was mainly out of stock due to lack of demand. Government and its partners should further sensitize on the use of condoms (male and female) in particular regions like Karamoja and northern Uganda where demand was low. It is also recommended for staff that makes supply orders to be trained in supply chain and stock management including the filling in of order forms in the respective formats. Also important is to ensure that more than one staff has the ability to make the orders to cater for periods when another staff is either on leave, sick or when they leave the facility. The Facility in-charges especially at the primary level have to manage exquisitely the supplies unit and to continually monitor its performance to ensure internal processes do no lead to drug stock-outs.
Regarding the finding that not all staff trained on insertion and removal of implants were providing FP services; this may be a desirable situation as it implies that there is sufficient capacity to fill gaps that may arise due to staff attrition, provided that available excess trained staff within units are deployed in a way that ensures continuity of services. It is important that staff are continuously trained as already noted, and that training is followed up with provision of essential equipment or supplies that ensure that a method is complete and ready for provision at specific SDPs. Also, the health in- charges should be trained and guided on how to utilize internal staff capacity without necessary hampering the provision of services that are specialized. Regarding the availability of guidelines and job aids for FP, it is recommended that the MoH and its partners intensify the distribution and use of the guidelines and job aids in the different facilities where they were missing. The MoH and its partners should ensure that all
Facility Assessment for reproductive health commodities and services- 2014 FINAL REPORT
82
SDPs at all levels have the requisite job-aids in all departments that deliver FP services, and in a form that is easily usable as reference material by health workers. Regarding payment for FP services, it is recommended that further investigation be done on the issue of user fees payment in facilities where FP services are supposed to be provided for free. Government should provide guidance to private wings in tertiary level health facilities where user-fees are permitted to differentiate between chargeable and non-chargeable services. Government should further intensify the sensitization drive to the public in regards to FP services being free. Government and other actors in RH service delivery should also where possible incentivize provision of free FP services in private-for-profit health facilities where such partnerships are possible Regarding transport costs hindering access to FP services in Karamoja, it is recommended that government and its partners consider taking FP services closer to the people in Karamoja, or incentivize transportation on particular days to cater for those that cannot afford the cost of transport to attend FP. SDPs in such hard-to-reach areas should be supported to conduct supplemental integrated outreaches to reach the areas farther from health facilities. Regarding the long waiting times for FP services in Karamoja region and Northern Uganda, it is recommended that further efforts to have more health workers in these regions be considered through incentivization and better pay, for as long as it brings medical services to these regions up to standard. Regarding the high levels of satisfaction of FP clients with the services provided, appropriate positive feed-back loops should be initiated by government and stakeholders who support FP services to enhance the best practices in health facilities. Very often, the positive aspects of health service delivery are not reinforced by commending health workers where performance is good. The findings of this study should therefore be used to provide positive feed-back to health workers providing FP services regarding the community’s general satisfaction with the care they give. On the other hand, forcing clients to take FP methods is ethically inappropriate. It is recommended that the training and technical support supervision given to the FP providers should include modules on ethical codes of conduct and issues to do with respect to the individual choices and autonomy over methods of FP. Regarding the glaring gap in availability of essential life-saving maternal and RH medicines, the recommendation to improve supply chain management has already been made and cannot be overstated. In particular, since most facilities (especially the government facilities) cited that the gap was on the side of the suppliers, it is important that the recurrent problem of central stores constraining service delivery be dealt with through persistent leadership actions targeting these stores. This recommendation is also pertinent to the finding that about one in six health facilities (one in five government health facilities) receive their
Facility Assessment for reproductive health commodities and services- 2014 FINAL REPORT
83
supplies on average six months from the time they are ordered. It indicates clearly that the central level plays a key role in propagating stock-outs of RH commodities. Regarding support supervision, Ministry of Health in collaboration with the District Health Office and implementing partners should design a schedule for support supervision for SDPs to ensure continued quality RH services including family planning. This schedule should include the MOH Regional Performance Monitoring Team (RPMT), a structure that is currently in all regions of Uganda. Regarding availability of mama kits, it is recommended as already stated that supplies systems be reviewed to eliminate the irregularities and delays, but also importantly provision of maama kits by private providers should be promoted where such public-private partnerships are possible.
Facility Assessment for reproductive health commodities and services- 2014 FINAL REPORT
84
Regarding the availability of guidelines and job aids for FP: It is recommended that the MoH and its partners strengthen and intensify the distribution and use of the guidelines and job aids in the different facilities where they were missing. The MoH and its partners should ensure that all SDPs at all levels have the requisite job-aids in all departments that deliver FP services, and in a form that is easily usable as reference material by health workers. Regarding payment for FP services It is recommended that further investigation be done on the issue of payment of user fees in facilities where FP services are supposed to be provided for free. Government should provide guidance to private wings in tertiary level health facilities where user-fees are permitted to differentiate between chargeable and non-chargeable services. Government should further intensify the sensitization drive to the public in regards to FP services being free. Government and other actors in RH service delivery should also where possible incentivize provision of free FP services in private-for-profit health facilities where such partnerships are possible. Regarding transport costs hindering access to FP services in Karamoja, it is recommend that government and its partners consider taking FP services closer to the people especially in hard-to-reach such as Karamoja region and in rural areas, or incentivize transportation on particular days to cater for those that cannot afford the cost of transport to attend FP. SDPs in such hard-to-reach areas should be supported to conduct supplemental integrated outreaches to reach the areas farther from health facilities. Regarding the long waiting times for FP services in Karamoja region and Northern Uganda, it is recommended that further efforts to have more health workers in these regions be considered through staff motivation, providing incentives and better pay, for as long as it brings medical services to these regions up to standard. Regarding the high levels of satisfaction of FP clients with the services provided, appropriate positive feed-back loops should be initiated by government and stakeholders who support FP services to enhance the best practices in health facilities. Very often, the positive aspects of health service delivery are not reinforced by commending health workers where performance is good. The findings of this study should therefore be used to provide positive feed-back to health workers providing FP services regarding the community’s general satisfaction with the care they give. On the other hand, forcing clients to take FP methods is ethically inappropriate. It is recommended that the training and technical support supervision given to the FP providers should include modules on ethical codes of conduct and issues to do with respect to the individual choices and autonomy over methods of FP. Regarding the glaring gap in availability of essential life-saving maternal and RH medicines, the recommendation to improve supply chain management has already been made and cannot be exaggerated. In particular, since most facilities (especially the government
Facility Assessment for reproductive health commodities and services- 2014 FINAL REPORT
85
facilities) cited that the gap was on the side of the suppliers, it is important that the recurrent problem of central stores constraining service delivery should be dealt with through persistent leadership actions targeting these stores. This recommendation is also pertinent to the finding that about one in six health facilities (one in five government health facilities) receive their supplies on average six months from the time they are ordered. It indicates clearly that the central level plays a key role in propagating stock-outs of RH commodities. Regarding support supervision, Ministry of Health in collaboration with the District Health Office and implementing partners should design a schedule for support supervision for SDPs to ensure continued quality RH services including family planning. This schedule should include the MOH Regional Performance Monitoring Team (RPMT), a structure that is currently in all regions of Uganda. Regarding availability of Maama kits, it recommended as already stated that supplies systems be reviewed to eliminate the irregularities and delays, but also importantly provision of maama kits by private providers should be promoted where such public-private partnerships are possible.
Facility Assessment for reproductive health commodities and services- 2014 FINAL REPORT
86
6. REFERENCEs HSSIP4. MOH (2010): Health Sector Strategic and investment Plan 2010/11-2014/15. Promoting
peoples health to enhance socio-economic development. Ministry of Health (MoH). July 2010.
MoH (2006): The National Policy Guidelines and Service Standards for Reproductive Health Services. In: Reproductive Health Division, C. H. D. (ed.). Uganda: Ministry of Health.
MoOH (2008): Uganda Reproductive Health Commodity Security Strategic Plan 2010 - 2014 In: Ministry of Health (ed.). Kampala, Uganda.
MoOH (2009: Reproductive Health Commodity Security Strategic Plan 2009/10-2013/15. Ministry of Health
MoOH (2012): National Policy Guidelines and Service Standards for Sexual and Reproductive Health and Right. Health Planning Division. Ministry of Health
NAHPMOH (2004): National Adolescent Health Policy for Uganda. In: Reproductive Health Division, Ministry of Health. Republic of Uganda. 2004
NDP (2010/2015): National Development Plan 2010/11- 2014/15. Republic of Uganda. NHP. MOH (2010): The Second National Health Policy. Promoting peoples health to enhance
socio-economic development. Ministry of Health (MoH). July 2010. STATA 100 (2009). Statistics/Data analysis. StataCorp 1984-2009, Texas, USA.
http://www.stata.com UBOS (2006a): 2002 Uganda Population and Housing Census: Analytical Report, Abridged
Version. Kampala, Uganda: Uganda Bureau of Statistics UBOS. UDHS (2011): Uganda Demographic Health Survey. Uganda Bureau of Statistics Kampala
Uganda.