extreme extra-tropical cyclone climatology - home - fsu coaps
TRANSCRIPT

Extreme Extra-tropical Cyclone Climatology
Joseph M. SienkiewiczNOAA/NWS Ocean Prediction Center
Khalil Ahmad, Gregory McFadden, Zorana Jelenak, Paul Chang, Michael Brennan, Joan Von Ahn
12009 Scatterometer and Climate Meeting, Arlington, VA Aug 19-21

1979 – President’s Day Blizzard
2009 Scatterometer and Climate Meeting, Arlington, VA Aug 19-21
2
-Poorly predicted in Washington, DC
-Rapid intensification as exited coast
-Highlighted limitations of NWP

1979: “Freak storm hits yacht race”…BBC News
2009 Scatterometer and Climate Meeting, Arlington, VA Aug 19-21
3
1979 Fastnet Race…15 deadLargest peace time rescue effort
Focus on Maritime Extra-tropical Cyclones
“The race was hit by a violent Force 10 storm that swept across the North Atlantic and into the southern Irish Sea, catching forecasters almost completely unawares”.

Sanders and Gyakum, 1980Synoptic-Dynamic Climatology of the “Bomb”
42009 Scatterometer and Climate Meeting, Arlington, VA Aug 19-21
Triggered two field campaigns – Genesis of Atlantic Lows Experiment (GALE)- Experiment on Rapidly Intensifying Cyclones over the Atlantic (ERICA)
Linked SST gradient to rapid cyclogenesis

• Rapid intensification– Climatology– Role of latent heat release– Fluxes– Jet streaks– Predictability
GALE and ERICA focus
– Predictability– Inadequacies of NWP models
• Evolution of cyclone structure• Unable to focus on:
– evolution of conditions (winds)
2009 Scatterometer and Climate Meeting, Arlington, VA Aug 19-21
5

QuikSCAT era• Wide swath
– reveals much of cyclone wind field • (complete coverage 2x’s/day poleward of 49 degrees)
• Large retrievable wind speed range – (well into hurricane force)
• Limitations - resolution and rain – not as significant in extra-tropical cyclones as opposed to
tropical cyclones– Highest winds typically in area of minimal rain and over large
area
• Allows focus on conditions, not just central pressure• Coverage and capability supports warning function!
2009 Scatterometer and Climate Meeting, Arlington, VA Aug 19-21
6

37
64
51
39
494550
60
70
C Atlantic
Hurricane Force Extra-tropical Cyclones -Detection and Warning Trend using QuikSCAT
2000-2009
•Hurricane Force Warning Initiated Dec 2000 •Detection increased with:
-Forecaster familiarity-Data availability-Improved resolution -Improved algorithm
12.5 km QuikSCATavailable May 04
Improved wind algorithm and rain flag Oct 06
11 9
23
14
24 23
15
22
3733
3134 34
0
10
20
30
40Cyclones
1998-99 1999-00 2000-01 2001-02 2002-03 2003-04 2004-05 2005-06 2006-07 2007-08 2008-09
Atlantic
Pacific
72009 Scatterometer and Climate Meeting, Arlington, VA Aug 19-21
QuikSCAT Launch Jun 99
Hurricane Force Wind WarningInitiated Dec 00
25 km QuikSCATAvailable in N-AWIPS
Oct 01
TotalsA-289P-269558

8yr Average Monthly Distribution
5
6
7
8
9
10
Ave
rage
num
ber
of H
F c
yclo
nes
(8yr
s) Atlantic
Pacific
Monthly Distribution 2001-2009
0
1
2
3
4
5
Sept Oct Nov Dec Jan Feb Mar Apr May
Month
Ave
rage
num
ber
of H
F c
yclo
nes
(8yr
s)
Pacific
82009 Scatterometer and Climate Meeting, Arlington, VA Aug 19-21

Onset of HF Winds 2001-2009
92009 Scatterometer and Climate Meeting, Arlington, VA Aug 19-21

Frequency of Maximum Deepening Rate 2001-2009
102009 Scatterometer and Climate Meeting, Arlington, VA Aug 19-21

Geographic Distribution 2001-2008
2009 Scatterometer and Climate Meeting, Arlington, VA Aug 19-21
11

Storm Force Wind Frequency
QuikSCATHurricane Force Wind Frequency
WRF Simulation Pacific Feb 2008 cyclone
Gale Force Wind Frequency
122009 Scatterometer and Climate Meeting, Arlington, VA Aug 19-21

Forecast skill96 hr Warning Category Probability of Detection
5 yr Oct-Mar 2003-2008
0
0.1
0.2
0.3
0.4
0.5
0.6
0.7
0.8
POD
ALL_ATL
ALL_PAC
HF_ATL
HF_PAC
STORM_ATL
STORM_PAC
GALE_ATL
GALE_PAC
• Track error comparable with TC’s• Can predict cyclone in advance• Limited skill forecasting HF conditions
• timing, intensity (PMSL, Winds) • More skill in Atlantic vs Pacific
2009 Scatterometer and Climate Meeting, Arlington, VA Aug 19-21
13
Pacific Cyclone Pressure Error (mb) Oct - Mar 2003-08
-13.00-12.00-11.00-10.00-9.00-8.00-7.00-6.00-5.00-4.00-3.00-2.00-1.000.001.002.00
0 12 24 36 48 60 72 84 96 108
120
Forecast hour
Err
or (
nm) All
HF
STORM
GALE31.6229.8229.1733.1329.13

October
November
January
February
December March
Storm relative Storm relative -- Monthly Monthly Hurricane Force Wind FrequencyHurricane Force Wind Frequency

0-6h
6-12h
12-18h
18-24h
>24h

Hurricane Force Extra-tropical CyclonesGaining a grasp on behavior
Geographic distributionMonthly frequency Wind field distributionHF winds onset during rapid intensificationThermal structures requiredQuantified short-term predictability
Unknowns:
2009 Scatterometer and Climate Meeting, Arlington, VA Aug 19-21
16
Unknowns:Trend over timeInterannual variabilityDevelopment and relationship to larger scaleContribution to earth system
- Momentum transfer- Heat and moisture fluxes/transport- Wave generation, coastal erosion- Salt spray particles (production of CCN?)

Cyclone activity
2009 Scatterometer and Climate Meeting, Arlington, VA Aug 19-21
17
Climatology and Changes of Extratropical Cyclone Ac tivity: Comparison of ERA-40 with NCEP–NCAR Reanalysis for 1958–2001
Xiaolan L. Wang, Val R. Swail, and Francis W. Zwiers
In terms of historical trend, the most notable changes in cyclone activity were found to be associated with strong-cyclone activity. Over the boreal extratropics, consistently, both ERA-40 and NNR show a significant increasing trend in winter (JFM) strong-cyclone activity over the high-latitude North Atlantic and over the midlatitude North Pacific, with a significant decreasing trend over the midlatitude North Atlantic and a small increasing trend over northern Europe. The winter changes over the North Atlantic are associated with the mean position of the storm track shifting about 181 km northward.

Contribution of ocean cyclone wind forcing to ocean circulation
2009 Scatterometer and Climate Meeting, Arlington, VA Aug 19-21
18
Pickart et al. 2009…The curl pattern arises because of the tendency of cyclones to deepen in two distinct regions over the course of the storm season. While we suspect that the collocation of the cyclonic wind stress curl signal and the two ocean gyres is not a coincidence, it still needsto be demonstrated how such a seasonal input of vorticity can drive a mean double-gyre circulation.

Moore and Renfrew, 2005Deep ocean convection occurs in both the Labrador and Irminger Seas, with high wind speeds
Contribution of ocean cyclone wind forcing to ocean circulation
Tip jet Reverse tip jet Barrier jet Denmark Straitbarrier jet
2009 Scatterometer and Climate Meeting, Arlington, VA Aug 19-21
19
Deep ocean convection occurs in both the Labrador and Irminger Seas, with high wind speeds being crucial for the large air–sea heat and moisture exchanges that densify the surface waters and drive convection (Lab Sea Group 1998; Bacon et al. 2003; Pickart et al. 2003a,b).

Extreme winds and salt spray
2009 Scatterometer and Climate Meeting, Arlington, VA Aug 19-21
20
Reid et al., 2007 (NRL Report)
• High winds, long fetch, in non-precipitating conditions result in high concentrations of sea salt particles •Giant mode salt spray particles in worst conditions probably to ~1.5 km
“extremely high sea salt particle concentrations are a previouslyunconsidered phenomenon in the scientific community”

Summary
2009 Scatterometer and Climate Meeting, Arlington, VA Aug 19-21
21

Probability of 925 mb windsto reach hurricane force in anunstable atmosphere
kts
222009 Scatterometer and Climate Meeting, Arlington, VA Aug 19-21

Latitudinal Distribution
8
10
12
14
Fre
quen
cy
0
2
4
6
8
31 33 35 37 39 41 43 45 47 49 51 53 55 57 59 61 63 65 67 69 M ore
Latitude
Fre
quen
cy
Atlantic
Pacif ic
232009 Scatterometer and Climate Meeting, Arlington, VA Aug 19-21

Longevity Distribution
15
20
25
8yr
Fre
quen
cy D
istri
butio
n
Atlantic
0
5
10
1 2 3 4 5 6 7 8 9 10 11 12 13 More
#6 hr increments at HF Intensity
8yr
Fre
quen
cy D
istri
butio
n
Pacific
242009 Scatterometer and Climate Meeting, Arlington, VA Aug 19-21

Distribution of Minimum Central Pressure
25
8yr
Fre
quen
cy D
istri
butio
n
0
5
10
15
20
920 930 940 950 960 970 980 990 1000 M ore
Central Pressure (hPa)
8yr
Fre
quen
cy D
istri
butio
n
Atlant ic
Pacif ic
252009 Scatterometer and Climate Meeting, Arlington, VA Aug 19-21
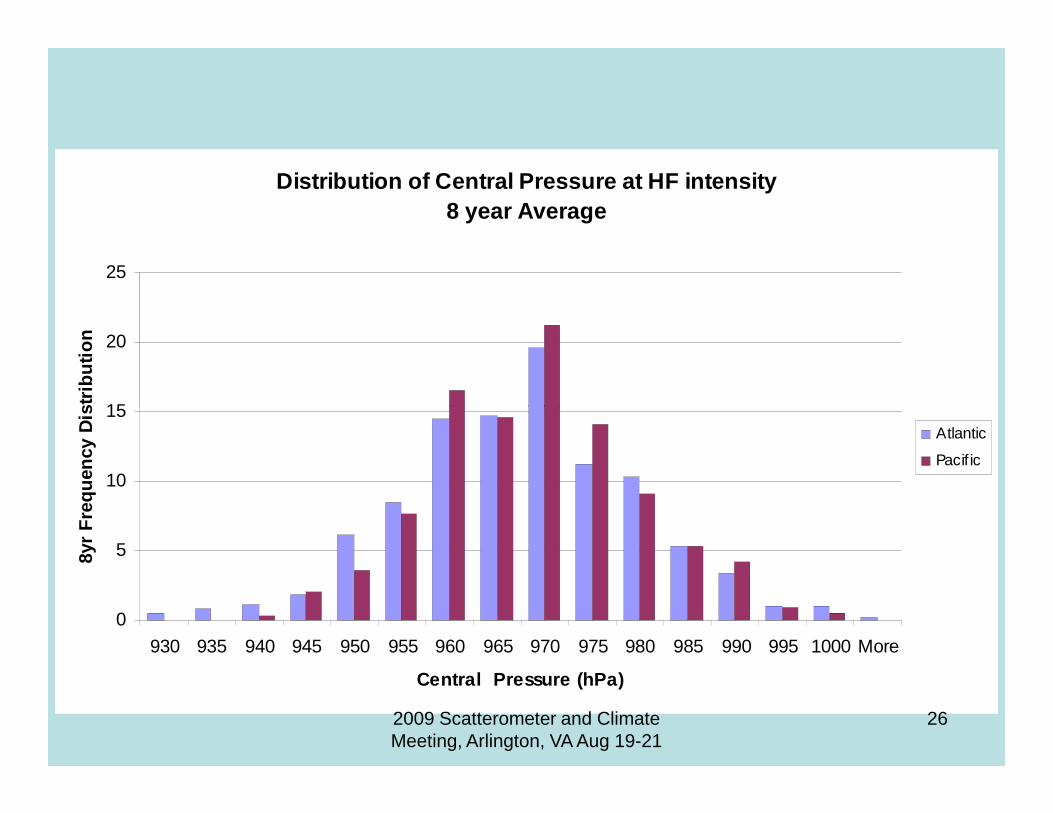
Distribution of Central Pressure at HF intensity8 year Average
15
20
25
8yr
Fre
quen
cy D
istri
butio
n
0
5
10
15
930 935 940 945 950 955 960 965 970 975 980 985 990 995 1000 More
Central Pressure (hPa)
8yr
Fre
quen
cy D
istri
butio
n
Atlantic
Pacif ic
262009 Scatterometer and Climate Meeting, Arlington, VA Aug 19-21
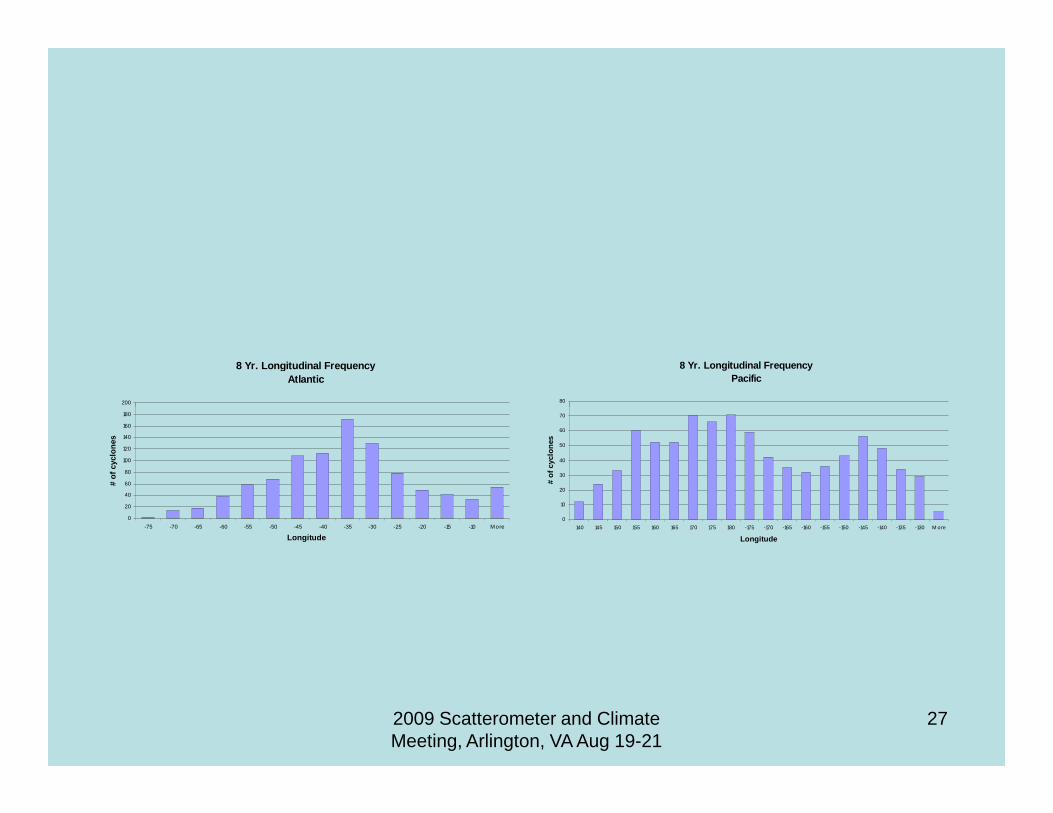
8 Yr. Longitudinal Frequency Atlantic
200
8 Yr. Longitudinal Frequency Pacific
80
0
20
40
60
80
100
120
140
160
180
-75 -70 -65 -60 -55 -50 -45 -40 -35 -30 -25 -20 -15 -10 M ore
Longitude
# of
cyc
lone
s
0
10
20
30
40
50
60
70
140 145 150 155 160 165 170 175 180 -175 -170 -165 -160 -155 -150 -145 -140 -135 -130 M ore
Longitude
# of
cyc
lone
s
272009 Scatterometer and Climate Meeting, Arlington, VA Aug 19-21

Cross-sections theta-e (dashed), theta-e gradient (filled colored contours),
isotachs (solid lines, knots)0000 UTC 9 Feb 2007 0300 UTC 12 Feb 2008
University of Washington, Atmos Sciences Nov 18, 2008
2300 UTC 9 MAR 2008 2000 UTC 9 Feb 2007