exploring the link between the conceptual model of
TRANSCRIPT

Exploring the link between the Conceptual Model of
Avalanche Hazard and the North American Public
Avalanche Danger Scale
by
Taylor Clark
B.A., (Geography), University of British Columbia, 2014
Project Submitted in Partial Fulfillment of the
Requirements for the Degree of
Master of Resource Management
in the
School of Resource and Environmental Management
Faculty of Environment
© Taylor Clark 2019
SIMON FRASER UNIVERSITY
Spring 2019
Copyright in this work rests with the author. Please ensure that any reproduction or re-use is done in accordance with the relevant national copyright legislation.
ii
Approval
Name: Taylor Clark
Degree:
Project Number:
Master of Resource Management
721
Title: Exploring the link between the Conceptual Model of Avalanche Hazard and the North American Public Avalanche Danger Scale
Examining Committee: Chair: Brendan Wakefield MRM Candidate
Pascal Haegeli Senior Supervisor Assistant Professor
_____________________________
Anoop Sarkar Supervisor Professor School of Computer Science
_____________________________
Date Defended/Approved: January 11, 2019
iii
Abstract
In 2010, Statham, Haegeli, et al. (2018) introduced the Conceptual Model of Avalanche
Hazard (CMAH) to improve transparency and consistency of avalanche bulletin
production in North America. However, since the CMAH has no explicit link to the
avalanche danger scale, forecasters must rely on their own judgment to assign danger
ratings, which can lead to inconsistencies in public avalanche risk communication. My
research aims to address this missing link by exploring the relationship between
avalanche hazard assessments and danger rating assignments in public avalanche
bulletins. Using conditional inference trees, key decision rules and components of the
CMAH influencing danger rating assignments are extracted. While the analysis offers
insights into the assignment rules, it also highlights substantial variability that cannot be
explained by components of the CMAH. The results from this study offer a foundation for
critically reviewing existing forecasting practices and developing evidence-based
decision aids to increase danger rating consistency.
Keywords: Danger Rating; Avalanche Hazard, Forecasting, Decision Trees

iv
Acknowledgements
I would first like to thank Avalanche Canada, the Avalanche Canada Foundation
and the Mitacs Accelerate Program for their financial support. I would also like to thank
Avalanche Canada and Parks Canada for the use of their datasets, which provided the
foundation of my research.
Numerous professors have been fundamental to my academic career. I would
specifically like to thank Fes de Scally for influencing and fostering my interest in
avalanches through academics and his inspiring mountain stories.
Thank you to the SARP team for the incredible help, support, laughs and the
abundant puns. It was such a pleasure to work and experience the mountains with an
amazing crew and I am thankful I could be a part of it. I have learned valuable lessons
from each and every one of them. To Patrick Mair, thank you for your support and
guidance through the statistical analysis. I will remember permutation framework tests
forever!
Thank you to Pascal Haegeli and Anoop Sarkar for their supervision. I would like
specifically to thank and acknowledge the support of Pascal Haegeli. This project and
the places it has taken me would not have been possible without his incredible guidance,
wisdom, encouragement and patience.
To my family and friends, thank you for the continuous encouragement, support
and believing in me throughout my studies. Each and every one of you has played a
fundamental and valuable role in this project and its completion.

v
Table of Contents
Approval .......................................................................................................................... ii Abstract .......................................................................................................................... iii Acknowledgements ........................................................................................................ iv Table of Contents ............................................................................................................ v List of Tables ................................................................................................................. vii List of Figures................................................................................................................ viii List of Acronyms ............................................................................................................ xii
Chapter 1. Introduction .............................................................................................. 1
Chapter 2. Background .............................................................................................. 8 2.1. Conceptual Model of Avalanche Hazard ............................................................... 8 2.2. Existing statistical models for avalanche hazard assessment ............................. 14
Chapter 3. Methodology ........................................................................................... 18 3.1. Study area and dataset ....................................................................................... 18 3.2. Dataset content and structure ............................................................................. 19 3.3. Decision tree approach ....................................................................................... 21
3.3.1. Why decision trees? .................................................................................... 21 3.3.2. Conditional inference trees .......................................................................... 21
3.4. Analysis steps..................................................................................................... 23 3.4.1. Dataset overview ......................................................................................... 23 3.4.2. Splitting the dataset ..................................................................................... 23 3.4.3. Hazard assessments with single avalanche problems ................................. 23 3.4.4. Visualization, decision rule extraction and model interpretation ................... 26
3.5. Hazard assessments with avalanche problem combinations .............................. 27
Chapter 4. Results .................................................................................................... 28 4.1. Dataset overview ................................................................................................ 28 4.2. Analysis of hazard situations with a single avalanche problem ........................... 29
4.2.1. Dataset overview ......................................................................................... 29 4.2.2. Representation of likelihood of avalanche and destructive size ................... 33 4.2.3. Overall CIT model ........................................................................................ 34
General structure of classification tree ................................................................... 34 Hazard chart visualizations .................................................................................... 36 Influence of elevation band .................................................................................... 40 Influence of other variables .................................................................................... 41
4.2.4. Detailed look at specific individual avalanche problems ............................... 42 Storm slab avalanche problems ............................................................................. 43 Persistent slab avalanche problems ....................................................................... 47 Wind slab avalanche problems............................................................................... 51
4.3. Analysis of hazard situations with multiple avalanche problems.......................... 56 4.3.1. Dataset overview ......................................................................................... 56
vi
4.3.2. Persistent slab and storm slab avalanche problem hazard situations .......... 59 General structure of classification tree ................................................................... 59 Hazard chart visualizations .................................................................................... 62
4.3.3. Persistent slab and wind slab avalanche problem hazard situations ............ 71 General structure of classification tree ................................................................... 73 Hazard chart visualizations .................................................................................... 75
Chapter 5. Discussion .............................................................................................. 86 5.1. General patterns of decision rules based on the core components of the CMAH 86 5.2. Influence of additional parameters on the avalanche danger rating .................... 88 5.3. Model performance ............................................................................................. 89 5.4. Operational insights and potential for decision aid development for avalanche forecasting .................................................................................................................... 91 5.5. Limitations .......................................................................................................... 92
Chapter 6. Conclusion ............................................................................................. 94
References ................................................................................................................... 97
Appendix A. Bavarian Matrix ................................................................................... 101
Appendix B. Single Avalanche Problem Decision Trees ....................................... 102

vii
List of Tables
Table 2.1 The nine avalanche problem types encountered within avalanche terrain along with a short description of the problem and risk mitigation strategies (after Haegeli et al., 2010; Statham, Haegeli, et al., 2018)...................... 10
Table 2.2: Canadian Avalanche Size Classification (Canadian Avalanche Association, 2014) ...................................................................................................... 12
Table 4.1 Frequency of single avalanche problem types from the single avalanche problem dataset. .................................................................................... 29
Table 4.2 Frequency of single avalanche problems within mountain ranges of British Columbia and western Alberta. .............................................................. 30
Table 4.3 Frequency of single avalanche problems within the single avalanche problem dataset based on occurrence at each elevation band. .............. 30
Table 4.4: Danger rating distributions and overall ranking for each avalanche problem type within the single avalanche problem dataset. .................................. 33
Table 4.5 Performance indicators of CIT models to assess which variable to represent the hazard assessment within the final CIT model for the single avalanche problem dataset. .................................................................................... 34
Table 4.6 Frequency of hazard situations with two avalanche problems with the percentage of the dataset the combination contributed. ......................... 57
Table 4.7 Frequency of hazard situations with three avalanche problems with the percentage of the dataset the combination contributed. ......................... 58
Table 4.8 Avalanche problem combination frequency according to elevation band with percentage of assessments at each elevation band. .............................. 58
Table 4.9 Avalanche problem combination frequent according to mountain range with percentage of assessments within each mountain range ....................... 59
Table 5.1 Performance indicators for CIT models ...................................................... 89

viii
List of Figures
Figure 1.1 Public avalanche bulletin for the South Coast Inland forecast region on January 18th, 2019 describing the danger ratings for three elevation bands (Panel A) and a description of the avalanche problems (Panel B) including where the problem is located as well as the expected size and chances of avalanches, and detailed background on weather, snowpack and avalanche conditions (Panel C). ........................................................ 2
Figure 1.2 The North American Public Avalanche Danger Scale describing the danger rating, travel advice for each level along with the likelihood of avalanches, destructive size and distribution (Statham et al., 2010). ........ 5
Figure 2.1: The workflow process of the conceptual model outlining the avalanche problem type, its location, likelihood of avalanche(s) and destructive size (Statham, Haegeli et al., 2018). ................................................................ 9
Figure 2.2 Matrix describing the likelihood of an avalanche as a function of its spatial distribution and sensitivity to triggers (Statham, Haegeli, et al., 2018) .... 12
Figure 2.3 Example of the CMAH hazard chart output for the Sea-to-Sky forecast region for March 10th, 2017. The yellow rectangle represents a Storm slab avalanche problem while the yellow rectangle represents a Persistent slab avalanche problem. The point in the middle describes the typical value of the size and likelihood of the problem avalanching while the outer edges represent the maximum and minimum values. .............. 13
Figure 3.1 Public avalanche bulletin regions of western Canada, 2018. Blue areas represent Avalanche Canada forecast regions while green areas show Parks Canada regions. ........................................................................... 18
Figure 4.1 Avalanche problem observations for both Avalanche Canada and Parks Canada assessments based on typical likelihood of avalanches and destructive size for each avalanche problem type with the exception of the omitted Cornice and Wet slab avalanche problem types. The pie chart denotes the danger rating distribution at the combination of typical likelihood of avalanches and destructive size while the number on the upper right shows the number of observations at that point. ................... 31
Figure 4.2 Results of the single avalanche problem CIT model with only typical likelihood of avalanches and typical destructive size projected on the hazard chart. Decision rules are outlined in black while the pie chart denotes the danger rating distribution of the terminal node based on the CIT model. The numbers above the pie charts correspond to the identifier of the respective terminal nodes. ............................................................ 37
Figure 4.3 Results of single avalanche problem CIT model with only avalanche problem type, typical likelihood of avalanches and typical destructive size projected on the hazard chart for each avalanche problem type seperately. Same presentation as Figure 4.2. ........................................ 38
Figure 4.4 Hazard assessment decision rules and danger rating distributions for each elevation band according to observed typical likelihood of avalanches and typical destructive size. Same presentation as Figure 4.2. ............................................................................................................... 41
ix
Figure 4.5 Hazard assessment decision rules and danger rating distributions for Wet loose avalanche problems based on the problem being on less than eight aspects and the problem being on eight aspects according to observed typical likelihood of avalanches and typical destructive size. Same presentation as Figure 4.2. ..................................................................... 42
Figure 4.6 Storm slab avalanche problem section of the single avalanche problem CIT describing the decision rules and corresponding terminal nodes based on the most common danger rating assigned based on those rules. ............................................................................................................... 44
Figure 4.7 Hazard assessment decision rules and danger rating distributions for Storm slab avalanche problems at each elevation band according to observed typical likelihood of avalanches and typical destructive size. Same presentation as Figure 4.2. .......................................................... 46
Figure 4.8 Hazard assessment decision rules and danger rating distributions for
Storm slab avalanche problems in each mountain range according to observed typical likelihood of avalanches and typical destructive size. Same presentation as Figure 4.2. .......................................................... 47
Figure 4.9 Persistent slab avalanche problem section of the single avalanche problem CIT describing the decision rules and corresponding terminal nodes based on the most common danger rating assigned based on those rules. Red outlined terminal nodes are shared between Persistent slab, Deep persistent slab and Wind slab avalanche problems, blue dashed outlined terminal nodes are shared between Persistent and Deep persistent slab problems, orange outlined terminal nodes are shared between Persistent and Wind slab avalanche problems, and black outlined terminal nodes are unique to Persisient slab avalanche problems. ............................................................................................... 49
Figure 4.10 Hazard assessment decision rules and danger rating distributions for Persistent slab avalanche problems at each elevation band according to observed typical likelihood of avalanches and typical destructive size. Same presenation as Figure 4.2. ........................................................... 50
Figure 4.11 Hazard assessment decision rules and danger rating distributions for Persistent slab avalanche problems in each mountain range according to observed typical likelihood of avalanches and typical destructive size. Same presentation as Figure 4.2. .......................................................... 51
Figure 4.12 Wind slab avalanche problem section of the single avalanche problem CIT describing the decision rules and corresponding terminal nodes based on the most common danger rating assigned based on those rules. Red outlined terminal nodes are shared between Persistent slab, Deep persistent slab and Wind slab avalanche problems, purple dashed outlined terminal nodes are shared between Wind and Deep persistent slab problems, orange dashed outlined terminal nodes are shared between Persistent and Wind slab avalanche problems, and black outlined terminal nodes are unique to Wind slab avalanche problems. ... 53
Figure 4.13 Hazard assessment decision rules and danger rating distributions for Wind slab avalanche problems based on each elevation band according to observed typical likelihood of avalanches and typical destructive size. Same presentation as in Figure 4.2. ....................................................... 54

x
Figure 4.14 Hazard assessment decision rules and danger rating distributions for Wind slab avalanche problems in each mountain range according to observed typical likelihood of avalanches and typical destructive size. Same presentation as Figure 4.2. .......................................................... 55
Figure 4.15 Persistent and Storm slab avalanche problem combination decision tree describing the decision rules and corresponding terminal nodes based on the most common danger rating assigned based on those rules. Nodes indicated with a P are characteristics of the Persistent slab avalanche problem while those indicated with an S are characteristics of the Storm
slab avalanche problem. ........................................................................ 60
Figure 4.16 Combinations of observed typical likelihood of avalanches and destructive sizes of Persistent slab and Storm slab avalanche problems contrasting hazard situations when the problems were present alone versus when they were both present at the same time. Same presentation as Figure 4.1. ......................................................................................................... 61
Figure 4.17 Hazard chart for Storm slab avalanche problems along and in combination with a Persistent slab avalanche problem at a likelihood of avalanches of Possible-Likely and various destructive sizes. Same presentation as Figure 4.2. .............................................................................................. 64
Figure 4.18 Hazard chart for Storm slab avalanche problem alone and in combination with a Persistent slab avalanche problem at various likelihoods of avalanches and a constant destructive size of 2. Same presentation as Figure 4.2. .............................................................................................. 66
Figure 4.19 Hazard chart for Persistent slab avalanche problem alone and in combination with a Storm slab avalanche problem at a likelihood of avalanches of Possible-Likely and various destructive sizes. Same presentation as Figure 4.2. ..................................................................... 68
Figure 4.20 Hazard chart for Persistent slab avalanche problem alone and in combination with a Persistent slab avalanche problem at various likelihoods of avalanches and a destructive size of 2. Same presenation as Figure 4.2 .......................................................................................... 70
Figure 4.21 Combinations of observed typical likelihood of avalanches and destructive sizes of Persistent slab and Wind slab avalanche problems contrasting hazard situations when the problems were present alone versus when they were both present at the same time. Same presentation as Figure 4.1. ......................................................................................................... 72
Figure 4.22 Persistent and Wind slab avalanche problem combination decision tree describing the decision rules and corresponding terminal nodes based on the most common danger rating assigned based on those rules. Nodes indicated with a P are characteristics of the Persistent slab problem while those indicated with a W are characteristic of the Wind slab avalanche
problem. ................................................................................................. 74
Figure 4.23 Hazard charts for Wind slab avalanche problem alone and in combination with a Persistent slab avalanche problem at various destructive sizes and a likelihood of avalanches of Possible-Likely. Same presentation as Figure 4.2. .............................................................................................. 77
Figure 4.24 Hazard charts for a Wind slab avalanche problem alone and in combination with a Persistent slab avalanche problem at various

xi
likelihoods of avalanches and a constant destructive size of 2. Same presentation as Figure 4.2. ..................................................................... 79
Figure 4.25 Hazard charts for Persistent slab avalanche problem alone and in combination with a Wind slab avalanche problem at various destructive sizes and a constant likelihood of avalanches at Possible-Likely. Same presentation as Figure 4.2. ..................................................................... 81
Figure 4.26 Hazard charts for Persistent slab avalanche problem alone and in combination with a Wind slab avalanche problem at various likelihoods of avalanches and a constant destructive size of 2. Same presentation as Figure 4.2. .............................................................................................. 83
xii
List of Acronyms
AC
AUC
BM
CART
CIT
L
P
POLR
ROC
UL
VL
Likelihood of avalanches rating: Almost Certain
Area Under the receiver operator characteristic Curve
Bavarian Matrix
Classification and Regression Tree
Conditional Inference Tree
Likelihood of avalanches rating: Likely
Likelihood of avalanches rating: Possible
Proportional Odds Logistic Regression
Receiver Operator characteristic Curve
Likelihood of avalanches rating: Unlikely
Likelihood of avalanches rating: Very Likely

1
Chapter 1. Introduction
Backcountry skiers, mountain snowmobilers, out-of-bound skiers, ice climbers
and snowshoers from all over the world are drawn to Western Canada because of its
world-renowned mountains and powder snow. However, enjoying the backcountry in the
winter time is not without risk as these activities are associated with the exposure to
natural hazards, such as snow avalanches, tree wells, cliffs or crevasses, that can lead
to accidental injury or death. On average, avalanches claim the lives of approximately 14
recreationists in Canada every winter (Avalanche Canada, 2017). The majority of these
fatalities involve non-guided backcountry recreationalists who are responsible for their
own decisions while traveling in avalanche terrain (Jamieson, Haegeli, & Gauthier,
2010).
In comparison to skiers in ski resorts or guests at mechanized skiing operations,
where the risk from avalanches is managed by ski patrollers and professional mountain
guides, non-guided backcountry recreationalists are responsible for their own risk
management decisions (Statham, 2008). Since avalanche hazard cannot be physically
controlled in the backcountry (e.g., through the use of explosives), the primary risk
mitigation method of recreationists is their decision of when and where to expose
themselves to the existing hazard (Statham, 2008; Statham, Haegeli, et al., 2018).These
decisions are made at various stages before and during a backcountry trip (Haegeli &
Strong-Cvetich, in press). First, recreationists need to decide whether to go on a
backcountry trip at all or not. If the decision is made to go, they need to find an
appropriate destination under the given conditions. Once at the trailhead or staging area,
they have to choose an appropriate route, which is subsequently continuously adjusted
in response to the local avalanche hazard conditions.
For most recreationists, public avalanche bulletins (Figure 1.1) are the first and
primary place for getting information about avalanche hazard when planning a trip into
avalanche terrain. In Canada, Avalanche Canada and Parks Canada produce daily
avalanche bulletins for regions in key mountain regions throughout British Columbia (BC)
and Western Alberta from mid-November until the end of April.

2
Panel A)
Figure 1.1 Public avalanche bulletin for the South Coast Inland forecast region on January 18th, 2019 describing the danger ratings for three elevation bands (Panel A) and a description of the avalanche problems (Panel B) including where the problem is located as well as the expected size and chances of avalanches, and detailed background on weather, snowpack and avalanche conditions (Panel C).

3
Panel B)
Figure 1.1 Continued
Canadian avalanche bulletins are structured according to an information pyramid,
which presents avalanche hazard information from the most succinct to the most
detailed. At the top of the pyramid, danger ratings at three elevation bands (alpine,
treeline, below treeline) describe conditions using the North American Public Avalanche
Danger Scale (Statham et al., 2010) (Figure 1.1 – Panel A). The scale consists of five
ordinal levels, colour coded from green (Low) to black (Extreme) illustrating overall
avalanche danger (Figure 1.2). A similar five level scale exists in Europe, called the
European Avalanche Danger Scale, but definitions of individual levels differ slightly
(Statham et al., 2010). The middle of the information pyramid describes the nature of the
existing avalanche hazard in more detail using the concept of avalanche problems
(Statham, Haegeli et al., 2018). Each avalanche problem is characterized in terms of

4
Panel C)
Figure 1.1 Continued
avalanche problem type, location of where the problem is likely found (elevation bands
and aspects), likelihood of triggering and the expected destructive size (Figure 1.1 –
Panel B). This provides users with specific characteristics of the avalanche problem(s)
that will likely be encountered while in avalanche terrain. At the very bottom of the
information pyramid is more detailed information about past avalanche conditions, critical
snowpack features and relevant information from the weather forecast (Figure 1.1 –
Panel C). While the information provided in avalanche bulletins gives backcountry users
pivotal information for planning a trip into avalanche terrain, this information needs to be
verified and supplemented with direct field observations once out in the field.

5
Figure 1.2 The North American Public Avalanche Danger Scale describing the danger rating, travel advice for each level along with the likelihood of avalanches, destructive size and distribution (Statham et al., 2010).
The foundation of Canadian avalanche bulletins is the Conceptual Model of
Avalanche Hazard (CMAH) (Statham, Haegeli, et al., 2018) which organizes the
avalanche forecasting process around four sequential questions:
1) What type of avalanche problem(s) exist?
2) Where are these problems located in the terrain?
3) How likely is it that avalanches will occur?
4) How big will these avalanches be?
In 2011, Parks Canada developed the avalanche forecasting software AvalX
(Statham, Campbell and Klassen, 2012) to integrate the CMAH into the workflow of
public avalanche forecasters in Canada. AvalX provided the first standardized
forecasting method and delivered a consistent format for the presentation of avalanche
safety information in Canada (Statham, Haegeli, et al., 2018).
While the CMAH standardized and streamlined the avalanche hazard
assessment process, it does not provide explicit guidance on what levels on the North
American Avalanche Danger Scale are associated with what type of avalanche hazard
conditions. This missing link leaves danger rating assignments up to forecaster

6
judgement, which can lead to inconsistencies in published danger ratings. This is a
problem as Murphy (1993) expresses that consistency is one of three characteristics that
contribute to the overall goodness of a forecast, allowing users to attain maximum
benefit and inform the decision making (risk mitigation) process. The same point was
previously made by Mileti and Sorensen (1990), who also stress consistency as a key
attribute for effective risk communication products.
To highlight the inconsistency challenge, Lazar et al. (2016) conducted a survey
where avalanche forecasters were asked to assign danger ratings from the North
American Public Avalanche Danger Scale to ten different snowpack and weather
scenarios. The study found that although there was much consensus at the extreme
ends of the danger rating scale (Low and Extreme), substantial differences in judgment
were observed when the danger rating was in the middle of the danger scale (i.e.,
moderate or considerable).
A first attempt to provide a quantitative link between the CMAH and the danger
rating scale was conducted by Haegeli, Falk, and Klassen (2012), who used two years of
CMAH-based hazard assessment data from Avalanche Canada that was collected with a
precursor system of AvalX. Their analysis showed that maximum likelihood of triggering
and maximum destructive size had the strongest influence on danger ratings. Their
analysis also showed considerable variation in danger rating assessments among
forecasters.
The operational use of the AvalX software by both Avalanche Canada and Parks
Canada since 2012 has produced a rich, CMAH-based hazard assessment dataset,
which provides a unique opportunity for examining the relationship between the North
American Public Avalanche Danger Scale and hazard assessments in more detail. The
objective of my research is to explore this connection and identify the assessment rules
used by avalanche forecasters in Canada. More specifically, my research is driven by
the following research questions:
How are the core components of the CMAH used to describe the nature
of avalanche hazard—likelihood of avalanches and destructive size—
linked to avalanche danger ratings?
Are avalanche danger rating assignments influenced by other factors?

7
The intent is that the results from my research will provide the foundation for establishing
a formal decision aid to address the issue of inconsistent danger rating assignments in
public avalanche bulletins. In comparison to the European Bavarian Matrix1 (European
Avalanche Warning Services, n.d.) (Appendix A), which was designed by a small group
of experts, the decision aid based on my results would represent the assessment
expertise of the entire Canadian public avalanche forecasting community.
1 The Bavarian Matrix is a danger rating assessment aid used by public avalanche forecasters in Europe.

8
Chapter 2. Background
2.1. Conceptual Model of Avalanche Hazard
When assessing threats from avalanches, it is important to clearly distinguish
between hazard and risk. Statham (2008) defines avalanche hazard as “The potential for
an avalanche(s) to cause damage to something of value”, which represents the condition
of the natural system is independent of any elements at risk. In the same paper, risk is
defined as ”The probability or chance of harm resulting from interactions between
avalanche hazard and a specific element at risk” (e.g., building, infrastructure, person)
(Statham, 2008). Hence, risk combines hazard with exposure and vulnerability, which
are both properties of the element at risk. In the case of backcountry travel, the risk from
avalanches is kept at an acceptable level by constantly adjusting exposure in response
to the local hazard.
In 2010, a group of avalanche professionals developed the Conceptual Model of
Avalanche Hazard (CMAH) to provide a streamlined, generic and consistent workflow for
assessing avalanche hazard (Figure 2.1). The conceptual model is based around four
key questions regarding the avalanche hazard:
1) What type of avalanche problem(s) exists?
2) Where are these problems located within the terrain?
3) How likely is it that an avalanche will occur?
4) How big will the avalanche be?
Together, the components of the conceptual model describing the hazard are combined
in a way that structures and focuses the hazard assessment process to inform risk
management decisions. Avalanche forecasters use the details provided to determine the
avalanche danger rating while providing backcountry users with interpretable information
to help manage their own risk.

9
Figure 2.1: The workflow process of the conceptual model outlining the avalanche problem type, its location, likelihood of avalanche(s) and destructive size (Statham, Haegeli et al., 2018).
The CMAH framework starts by identifying the type of avalanche problems
present based on current weather, snowpack and avalanche observations. An
avalanche problem type represents a repeatable avalanche hazard situation that
develops under distinct conditions and requires specific avalanche risk management
approaches (Haegeli, et al. 2010). Statham, Haegeli, et al. (2018) describe nine different
avalanche problem types that are encountered in avalanche terrain (Table 2.1). A Storm
slab avalanche problem, for example, forms when new snow is deposited onto an old
surface where bonding has yet to occur resulting in a slab that is relatively easy to trigger
and size depending on the amount new snow. An appropriate risk mitigation strategy for
this avalanche problem type is to avoid avalanche terrain all together for a period of time
allowing the storm snow to stabilize (Haegeli, et al., 2010). In contrast, Persistent slab
avalanche problems form as a result of snow metamorphism changing the structure of
snow crystals creating a weak layer that can fracture when stressed. Managing this
problem type requires avoiding specific areas, slopes or elevation bands. Multiple
avalanche problem types can coexist at any given time, and the CMAH accounts for this
by prioritizing and assessing each individually through the framework.

10
Table 2.1 The nine avalanche problem types encountered within avalanche terrain along with a short description of the problem and risk mitigation strategies (after Haegeli et al., 2010; Statham, Haegeli, et al., 2018).
Avalanche Problem Description of problem Risk mitigation strategies
Cornice Overhanging deposit of snow formed on leeward slopes overtop of cliff or steep drop.
Limit exposure where cornices are present and use caution on ridges.
Deep persistent slab avalanche problem
Thick cohesive slab overlying an early season persistent weak layer in the lower existing snowpack.
Approach new terrain cautiously and be conservative with terrain choices.
Dry loose avalanche problem Dry, powdery surface snow released from specific point.
Avoid steep slopes and terrain traps.
Glide avalanche problem Snowpack destabilizes at the ground causing cracks to form potentially releasing entire snowpack.
Avoid areas where glide cracks are visible.
Persistent slab avalanche problem
Consolidated slab of snow overtop of poorly bonded persistent weak layer in the existing snowpack.
Avoid specific locations (elevation bands, aspects) where weak layers are present.
Storm slab avalanche problem Unconsolidated soft slab formed by newly fallen snow.
Avoid avalanche terrain during and for up to a day after the storm.
Wet loose avalanche problem Wet surface snow released from a specific point.
Avoid terrain traps, avalanche paths and start zones.
Wet slab avalanche problem Consolidated slab of wet snow. Avoid start zones and avalanche paths especially during daytime heating.
Wind slab avalanche problem Consolidated slab of wind deposited snow.
Avoid areas where wind drifted snow is deposited, most commonly on leeward slopes.
After the types of the existing avalanche problem(s) are identified, forecasters
describe the location where the problem(s) can be found in the terrain. Terrain
characteristics such as slope angle, slope shape, orientation to the sun and wind, as well
as elevation band influence the development of avalanche problems. In public avalanche
bulletins, the location of an avalanche problem is expressed with respect to elevation
bands and sides of the mountain (aspect) since the information is synoptic in nature and

11
provided at a regional scale. Elevation band describes elevation in three distinct bands,
from highest to lowest being alpine, treeline and below treeline. The alpine elevation
band contains little to no vegetation where multiple avalanche paths exist over open
slopes and ridges compared to the below treeline elevation band where vegetation is
dense towards valley bottoms (Avalanche Canada, 2019). The treeline elevation band is
a transition zone between below treeline and alpine where vegetation begins to become
sparse leading into the alpine and is relatively narrow compared to the two other bands
(Avalanche Canada, 2019). Aspect has a direct influence on weather factors such as
wind and temperature (McClung & Schaerer, 2006). These factors create different
avalanche problems based on the difference in air temperature between solar and non-
solar aspects while wind created problems are more present on leeward slopes. For
example, Wet slab avalanche problems and Wet loose avalanche problems are more
present on solar aspects due to increased temperatures, melting the surface snow on
sunny days whereas Wind slab avalanche problems and Cornices are problems most
likely found on leeward aspects due to the prevailing wind direction. Identification of the
problem location is crucial in making decisions about risk mitigation strategies.
Once the location of avalanche problem is identified, forecasters describe the
likelihood of avalanches, which represents the probability or chance that avalanches of
the particular type will release (Statham, 2008), in a qualitative way. Likelihood of
avalanches is a function of the spatial distribution of the problem and its sensitivity to
triggering. The spatial distribution refers to the spatial density of the avalanche problem
and the presence of related evidence (e.g., relevant snowpack observations, associated
avalanche activity) within the location of the avalanche problem previously specified in
terms of elevation band and aspect. The distribution of the problem is expressed in
qualitative terms ranging from widespread (the problem is in many locations and terrain
features) to isolated (certain locations and specific terrain features) on a three-level
ordinal scale. Sensitivity to triggers describes the instability of the problem based on its
ease of triggering naturally or by humans. The terms used to express sensitivity range
from touchy (almost certain human triggered and numerous natural avalanches) to
unreactive (no human or naturally triggered avalanches). Forecasters then combine their
spatial distribution and sensitivity rating into a single, qualitative rating for likelihood of
avalanches, which is described using a five-level ordinal scale ranging from Unlikely to
Almost Certain (Figure 2.2). Half steps can be used to be more specific. For example, an
12
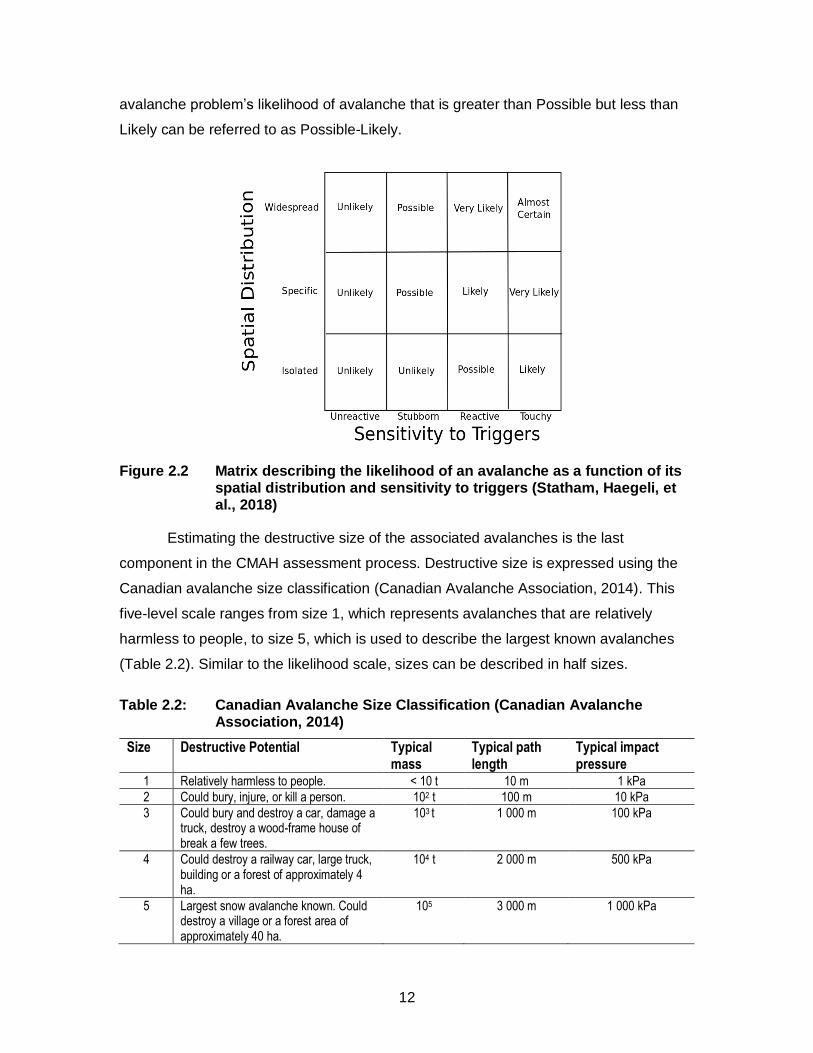
avalanche problem’s likelihood of avalanche that is greater than Possible but less than
Likely can be referred to as Possible-Likely.
Figure 2.2 Matrix describing the likelihood of an avalanche as a function of its spatial distribution and sensitivity to triggers (Statham, Haegeli, et al., 2018)
Estimating the destructive size of the associated avalanches is the last
component in the CMAH assessment process. Destructive size is expressed using the
Canadian avalanche size classification (Canadian Avalanche Association, 2014). This
five-level scale ranges from size 1, which represents avalanches that are relatively
harmless to people, to size 5, which is used to describe the largest known avalanches
(Table 2.2). Similar to the likelihood scale, sizes can be described in half sizes.
Table 2.2: Canadian Avalanche Size Classification (Canadian Avalanche Association, 2014)
Size Destructive Potential Typical mass
Typical path length
Typical impact pressure
1 Relatively harmless to people. < 10 t 10 m 1 kPa
2 Could bury, injure, or kill a person. 102 t 100 m 10 kPa
3 Could bury and destroy a car, damage a truck, destroy a wood-frame house of break a few trees.
103 t 1 000 m 100 kPa
4 Could destroy a railway car, large truck, building or a forest of approximately 4 ha.
104 t 2 000 m 500 kPa
5 Largest snow avalanche known. Could destroy a village or a forest area of approximately 40 ha.
105 3 000 m 1 000 kPa

13
After the likelihood of avalanches and destructive size are specified for all
avalanche problems, the overall hazard assessment is summarized by visualizing the
described avalanche problem(s) on a hazard chart (Figure 2.3). To represent uncertainty
from spatial and temporal variability as well as lack of forecaster knowledge, both
likelihood of avalanches and destructive size are expressed through a value triplet that
consists of the maximum, typical and minimum values (Statham, Haegeli et al., 2018).
The center of the plotted square represents the typical estimated likelihood and size of
the avalanche problem(s), whereas the upper left and lower right corners outline the
maximum and minimum values.
Figure 2.3 Example of the CMAH hazard chart output for the Sea-to-Sky forecast region for March 10th, 2017. The yellow rectangle represents a Storm slab avalanche problem while the yellow rectangle represents a Persistent slab avalanche problem. The point in the middle describes the typical value of the size and likelihood of the problem avalanching while the outer edges represent the maximum and minimum values.
Since the CMAH was designed as a generic framework for avalanche hazard
assessment, it does not specify the nature of the subsequent risk management actions.
In the case of public avalanche forecasting, avalanche forecasters publish avalanche
danger ratings in public avalanche bulletins, which recreationists then use to make their
own avalanche risk management decisions. Ski guides, on the other hand, use the

14
information from the hazard assessment directly to make terrain choices in the
backcountry. Avalanche professionals responsible for the safety of a transportation
corridor use the information from the hazard assessment to decide whether to close the
road or leave it open and/or whether to use explosives to manage the existing hazard.
2.2. Existing statistical models for avalanche hazard assessment
There have been several studies that have modeled avalanche hazard. These
studies differ from each other with respect of a) the type of input parameters, b) how the
dependent variable of avalanche hazard is operationalized in the model, and c) what
method is employed to describe the relationship between the predictor and dependent
variables.
Discriminant analysis was used as one of the earlier methods to identify the most
powerful parameter for distinguishing between avalanche and non-avalanche days along
a highway corridor or within a ski area (Floyer & McClung, 2003; McClung & Tweedy,
1994; Obled & Good, 1980). Floyer and McClung (2003) used a one way analysis of
variance and canonical discriminant analysis to determine important physical variables
related to avalanche prediction based on manually recorded snowpack and weather data
from four sections of Bear Pass, British Columbia. Using these two methods, important
variables were extracted that distinguished between avalanche and non-avalanche days
such as amount of new precipitation, temperature and snowpack depth. The models
were able to classify 73% of avalanche days and 72% of non-avalanche days.
The nearest neighbour approach emerged as a successful approach for
modelling avalanche hazard in several different operational contexts. The approach was
first introduced by Obled and Good (1980), who used it to estimate the probability of
avalanches within the Parsenn ski area in Davos, Switzerland, based on how similar the
current conditions are to observed conditions in the past. Building on their success,
Brabec and Meister (2001) used the method to develop a nearest neighbour model for
assessing regional avalanche danger. Given observations on slope stability, elevation,
slope aspect, avalanche activity and weather data, the NXD-2000 assessed regional
avalanche danger in terms of the European Public Avalanche Danger Scale.

15
Schirmer, Lehning, and Schweizer (2009) used a variety of different statistical
methods—classification trees, the nearest neighbour approach, artificial neural networks,
support machine vectors and hidden Markov models—to predict regional avalanche
danger ratings based on simulated snowpack observations. The study used a variety of
measures to assess prediction accuracy to determine which method worked best.
Overall the nearest neighbour approach proved to be the most reliable model, predicting
danger rating correctly 73% of the time. The classification tree analysis showed the
lowest performance of all models but was able to predict changes in the danger rating
reasonably well.
Pozdnoukhov et al. (2011) used a support vector machine approach to predict
avalanche danger ratings for a small forecast region in Scotland based on 39
parameters including local weather observations, modeled snowpack parameters and
avalanche observations. The system was applied to a grid with 10 m resolution to
produce avalanche forecasts at a high resolution. Although this approach showed the
ability to model avalanche hazard at a high spatial resolution using support vector
machines, the hazard ratings used as the target variable were not based on a danger
scale. Rather the model assumed the probability of an avalanche occurring within the
grid space from unlikely (0) to certain (1) given local conditions.
Bellaire and Jamieson (2013) used classification trees to derive danger ratings
from simulated snowpack conditions in Rogers Pass, Canada. Snowpack simulations
were done on a single grid point location closest to a well-known study plot at Mt.
Fidelity. They used a multivariate classification analysis to determine the most important
variables, which where then used in a classification tree analysis to predict the danger
rating. Danger ratings were based on the North American Public Avalanche Danger
Scale and forecasted danger ratings from the 2012-2013 winter season for Glacier
National Park were used for validation. The classification model provided 77% of alpine,
76% of tree line, and 70% of below tree line danger rating classifications correctly.
Hendrikx, Murphy, and Onslow, (2014) used 28 years of weather, snowpack and
avalanche activity variables on the Seward Highway in Alaska to identify key
parameteters responsible for significant avalanche activity. They described an avalanche
day as one day or more where avalanches ran 90% of their path length where 100% of
the path length was the road itself. Using two different classification tree methods (one
16
with an equal, one with unequal misclassification rate), the proabability of detecting an
avalanche day was between 74% and 94% based on the number of input parameters
used to grow each tree model. Many of the variables that gave high probability of
detection were based on weather measurements such as the highest temperature in a
24 hour period. The trees developed for this study were then combined with forecasting
practices along the road to aid as an operational forecasting tool.
Most recently, Blattenberger and Fowles (2016) used Bayesian additive trees to
model whether avalanches would cross the road in the Little Cottonwood Canyon in
Utah using daily winter data from 1995 to 2011. The ensemble method provided a
flexible way of dealing with the abundance of variables with small bits of information
being gained over numerous model iteration to provide synthesized information of
whether or not to close the road. The model out performed many traditional approaches
as well as forecaster data provided by guard stations along the road. It proved to be an
effective method addressing avalanche prediction within this area and context.
While all of the mentioned studies aimed to model the physical pathways
between avalanche hazard and its contributing factors, an alternative approach is to
imitate the human forecasting process by processing data based on decision rules
determined by avalanche experts. This type of model is generally referred to as expert
systems. Météo France, for example, uses MÉPRA (Giraud, 1992) as part of their
operational avalanche forecasting model chain to interpret simulated snow profile data
and derive an avalanche hazard rating on a four-level scale. Schweizer and Föhn (1996)
created two expert system models using CYBERTEK-COGENSYS software to evaluate
the degree of avalanche hazard according to the altitude and aspect of dangerous
slopes based on weather, snowpack and snow cover data around Davos, Switzerland.
The study closest to the present research is Haegeli, Falk and Klassen (2012),
who examined public avalanche bulletin data captured through the CMAH framework
from two winters produced by Avalanche Canada and Parks Canada. Using a
proportional odds logistic regression model (POLR), a type of ordinal logistic regression
model, 3073 hazard assessments were used to predict danger rating based on
avalanche problems. The model predicted the correct danger rating 75% of the time.
Analysis found that the maximum values of likelihood of avalanches had the most
influence on danger rating, while maximum expected size and avalanche problem(s)

17
were respectively second and third most important. While the POLR model analysis by
Haegeli, Falk and Klassen (2012) offered valuable quantitative insights into the
relationship between the components of the CMAH and avalanche hazard ratings, their
model approach has some weaknesses that fundamentally inhibit its ability to accurately
represent forecaster expertise. The model assumed a linear relationship between
avalanche problem characteristics and danger rating and did not incorporate any
interaction terms between variables. In addition, the dataset at the time only included
two winter seasons of public avalanche bulletins, which only covers a limited range of
possible avalanche hazard conditions.
While all of the mentioned studies have contributed to our ability to predict
avalanche hazard, there are a number of shortcomings that might prevent these models
from achieving higher prediction accuracies for regional avalanche hazard. First, the
pathway from weather and snowpack observations to an avalanche hazard rating is
complex and involves many interactions that can be difficult to incorporate in statistical
models. Second, predicting regional avalanche hazard from weather and snowpack
observations at point locations might be challenged by scale issues (Haegeli & McClung,
2004) as there is a mismatch between the small-scale nature of observations (e.g.,
temperature observation, snowfall observation) and the regional-scale nature of danger
ratings. Third, large-scale operational avalanche forecasting datasets can be quite
messy as it is difficult to collect consistently complete observations over large areas. For
example, large-scale avalanche datasets are inherently incomplete as it is never
possible to comprehensively monitor large areas and limited visibility can temporarily
prevent observations completely.
The CMAH dataset offers a unique opportunity to potentially overcome these
challenges. By having human avalanche forecasters interpret the existing conditions and
distilling them into the key components of avalanche hazard addresses the complexity of
the pathway between observations and avalanche hazard as well as the incompleteness
of observations. Furthermore, the forecaster assessment process also overcomes the
scale issue as the hazard components are assessed at the same scale as the danger
rating. Hence, the CMAH has the potential to offer a much cleaner dataset for predicting
avalanche danger ratings than what was available to previous studies.

18
Chapter 3. Methodology
3.1. Study area and dataset
In Canada, Avalanche Canada and Parks Canada are the main agencies
responsible for providing public avalanche safety information. Together, these agencies
publish daily avalanche bulletins for 17 different forecast regions in western Canada
during the winter months (approx. mid-November to the end of April). While Parks
Canada produces bulletins for five forecast regions covering the mountain national parks
(Banff-Yoho-Kootenay, Little Yoho, Jasper, Glacier and Waterton), Avalanche Canada
produces daily forecasts for 12 regions in western Canada (Figure 3.1).
Figure 3.1 Public avalanche bulletin regions of western Canada, 2018. Blue areas represent Avalanche Canada forecast regions while green areas show Parks Canada regions.
The mountains regions in western Canada covered by avalanche bulletins can be
grouped into three main mountain ranges that include the Coast Mountains along the
Pacific coast, the Columbia Mountains in the interior and the Rocky Mountains along the
BC-Alberta border. Each of these mountain ranges has a distinct snow climate and is
known for particular avalanche hazard patterns (McClung & Schaerer, 2006; Shandro &

19
Haegeli, 2018). The Coast Mountains are characterized by a maritime snow climate as
winters consist of heavy snowfall, moderate temperatures and deep snowpacks. The
majority of avalanches in this area are typically storm slab avalanches that occur during
or following storms. The continental snow climate of the Rocky Mountains shows lower
snowfalls, colder temperatures and much thinner snowpacks that are often unstable due
to persistent structural weaknesses within the snowpack. Deep persistent slabs and wind
slabs are the dominant avalanche problems in this area. The Columbia Mountains
exhibit a transitional climate with characteristics of both continental and maritime, which
result in distinct problems due to surface hoar layers and crust-facet combinations
(Haegeli & McClung, 2007; Shandro & Haegeli, 2018). While these snow climate
classifications describe the general snow and avalanche characteristics of the main
mountain ranges in Western Canada, considerable variations can exist within these
regions and from year to year (Shandro & Haegeli, 2018).
3.2. Dataset content and structure
Forecasters at Avalanche Canada and Parks Canada use the software AvalX to
produce their daily avalanche forecasts during winter months (Statham, Campbell, &
Klassen, 2012). AvalX structures forecasters’ workflow process according to the CMAH
and gives them a convenient workspace to assimilate observations, develop public
avalanche bulletins and document their process in a structured way (Statham, Haegeli et
al., 2018). Prior to the implementation of AvalX at Avalanche Canada and Parks Canada
in 2012, Avalanche Canada used the avalanche hazard assessment website provided
by Avisualanche Consulting (http://avalanchehazard.avisualanche.ca/) for two winters to
document the production of their avalanche bulletins according to the CMAH framework,
This website was used to test the practical value of the CMAH for operational avalanche
forecasting and served as a prototype for the development of AvalX.
For the present analysis, I only used avalanche bulletins that were stored in
AvalX. To maximize consistency between forecast regions, I limited my analysis dataset
to only bulletins that were published between December 1st and April 15th. This resulted
in a complete analysis dataset of 14,265 bulletins that span all forecast regions within
western Canada during seven winters (2012 to 2018). The information stored for each
bulletin consists of three main components; metadata, characteristics of avalanche
problems and avalanche danger ratings. Bulletin metadata includes information on the

20
date of publication, which region and mountain range the bulletin was produced for, the
agency that produced the bulletin, and the initials of the forecaster authoring the bulletin.
Each avalanche problem included in a bulletin is characterized with its maximum, typical
and minimum values of likelihood of avalanches and destructive size, the location of the
problem according to elevation band (alpine, treeline and below treeline), aspects the
problem is present on, as well as sensitivity to triggering and spatial distribution. The
avalanche danger ratings included in an avalanche bulletin represent the overall
assessment of the hazard at each elevation band and are given for the day the bulletin is
released and forecasted three days into the future. Each of these three components are
stored in separate database tables in AvalX.
For the present analysis, I processed the dataset in the following manner. To
allow the linking of hazard ratings at individual elevation bands with relevant avalanche
problem characteristics, I first merged the AvalX bulletin database tables and converted
them into a single table of hazard assessments by splitting up each bulletin into its three
elevation bands. The resulting table consisted of 42,589 hazard assessments and had
columns for all of the metadata, avalanche problem characteristics and avalanche
danger ratings. The hazard assessment table had a wide table format as each of the
nine avalanche problem types was represented by a set of columns expressing the
problems characteristics assessed through the conceptual model. Sensitivity,
distribution, minimum, typical and maximum values of likelihood of avalanches and
destructive size of each problem type were represented with ordinal categories, whereas
the aspects the problem was present on were stored in eight binary columns, one for
each cardinal and intermediate directions.
Whereas this wide data format is efficient for the analysis of the dataset, it does
not support circumstances when the same avalanche problem type is listed multiple
times within the same assessment. However, these situations were rare, and I handled
them by only including the avalanche problem instance with the higher value for
likelihood of avalanches and/or destructive size. The assumption behind this approach is
that under these circumstances, the hazard assessment is likely dominated by the more
severe instance of the same avalanche problem type.

21
3.3. Decision tree approach
3.3.1. Why decision trees?
Modern machine learning methods offer powerful and flexible approaches for
modeling complex non-linear relationships (Bishop, 2006) and represent a promising
avenue for overcoming the limitations of the POLR model presented by Haegeli, Falk
and Klassen (2012). While many of today’s machine learning approaches, such as
support vector machines or other ensemble methods, focus on predictive performance
(Hothorn, Hornik, & Zeileis, 2006), the limited interpretability of the model prediction or
output is a substantial limitation of these methods for providing deeper insight (Russell &
Norvig, 2010). I chose decision trees, a supervised machine learning technique that
classifies attributes according to specified output values (Russell & Norvig, 2010), to be
the main modeling approach for my analysis as they combine the ability to model
complex non-linear relationships while offering tangible and easy to interpret insights into
the underlying decision rules. Furthermore, research in cognitive science postulates that
decision trees are closely linked to models of the human decision making process
(Martignon et al., 2012). Two main types of decision trees exist; classification trees for
modelling ordinal or nominal dependent variables, and regression trees for modelling
numeric dependent variables (Bishop, 2006). Since the avalanche danger rating is an
ordinal data type, my analysis requires a classification tree approach.
3.3.2. Conditional inference trees
Several avalanche research studies have used decision trees in the past such as
Schirmer, Schweizer and Lehning (2010), Bellaire and Jamieson (2013). All of these
studies used the well-established Classification and Regression Tree (CART) approach
by Breiman et al. (1998), which uses the Gini index as the splitting criteria to recursively
partition the dataset into increasingly homogeneous nodes (Kuhn & Johnson, 2013).
While the CART approach is well established, it has a number of weaknesses. First, it
can lead to overfitting as there are no stopping criteria in the CART approach (Hothorn,
Hornik & Zeileis, 2006). To overcome this issue, CART models require pruning based on
interpretation of performance indicators to establish effective models (Kuhn & Johnson,
2013). Furthermore, the CART approach can lead to biased splits when the response
variable is unevenly distributed (Hothorn, Hornik & Zeileis, 2006).
22
Conditional inference trees (CIT, Hothorn, Hornik & Zeileis, 2006) avoid the
issues of CART models by recursively splitting the dataset based on statistical
hypothesis testing (Hothorn et al., 2008). In a CIT analysis, the splitting process starts by
calculating a quadratic linear test statistic (Hothorn, Hornik & Zeileis, 2006) for the
differences in dependent variable distributions for all possible partitions in the dataset
(i.e., using all values of all the independent variables as possible splitting rules). Since
little information can be determined for the possible split based on the test statistic alone,
permutation framework tests are used to put the test statistic values into perspective.
Permutation tests shuffle a sample of the dataset numerous times and calculate
corresponding test statistics for each of these random splits. This creates a distribution
of a variables quadratic linear test statistics. The original test statistic is then compared
to the distribution to derive a p-value and assess the statistical significance of a
proposed split. The p-values for all possible splits are then ranked accordingly and the
dataset is split on the variable and value with the overall lowest p-value (i.e., highest
statistical significance). This splitting process is done recursively until no variables
remain that result in a statistically significant split. Once the splitting process is complete,
the terminal nodes at the end of each branch contain a distribution of the dependent
variable, which can then be used to make predictions. There are multiple ways to
convert the distributions of the dependent variable into categorical predictions. By
default, the CIT algorithm uses the mode of the distribution to predict a specific danger
rating, but the product-sum (i.e., weighted average) can be a meaningful alternative.
The CIT approach differs from the traditional CART methodology as splits are
based on a variable’s influence (statistical significance) on the dependent variable rather
than the node purity gained through each split. The CIT splitting criteria bypasses the
limitations of the CART approach by producing unbiased splits of the dataset and
avoiding performance indicator interpretation to achieve an adequate model (Hothorn et
al., 2006). This means that CIT models do not require any pruning.
Similar to the CART method, the results of a CIT analysis can be visualized in the
form of a decision tree diagram that offers an intuitive interpretation of how the model
partitioned the dataset. Splits that are shown higher on the tree diagram are found to be
more statistically significant than those found lower on the tree. Further, the tree
visualization allows decision rules to be interpreted and extracted while terminal nodes
describe the results of the decision rules that partitioned the dataset.
23
3.4. Analysis steps
3.4.1. Dataset overview
To begin the analysis, general descriptive statistics were calculated to provide
insight into the general nature of the dataset. Depending on the class of the variable, I
either used the Pearson’s Chi-squared test (nominal data), the Wilkoxon rank sum test
(comparing ordinal data of two groups) or Kruskal-Wallis test (comparing ordinal data of
more than two groups). I considered p-values < 5% to indicate statistically significant
differences. I paid particular attention to examining the distributions of each parameter I
intended to include in the CIT model with respect to avalanche problem type to
understand the specific characteristics of each avalanche problem type and their
differences. This information would provide critical information for guiding the analysis
and interpreting the results in a meaningful way.
3.4.2. Splitting the dataset
Because of the high dimensionality of the avalanche hazard assessment dataset
(311 parameters in total), applying a CIT analysis to the entire dataset would results in
an overwhelming and extremely difficult to interpret decision tree. To maximize my ability
to provide insight, I divided the dataset into three different types of situations according
to the number of avalanche problems present. Hazard assessments that contained no
avalanche problems were omitted from the analysis as they offer no information about
decision rules and their connection to the danger rating. Hazard assessments with only a
single avalanche problem were split into their own dataset. In these situations, the
avalanche danger rating is fully determined by the characteristics of that single problem.
The third and final split included the remaining hazard assessments with multiple
avalanche problems. AvalX allows public avalanche bulletins to contain up to three
avalanche problems and the resulting danger rating representing the combined hazard
of all included problems.
3.4.3. Hazard assessments with single avalanche problems
The main goal of analyzing single avalanche problems first was to extract
decision rules for individual avalanche problem types and compare them in a tangible

24
way. In addition to exploring the effect of avalanche problem characteristics on
avalanche danger ratings, I also used this analysis to explore how danger ratings are
affected by other input parameters such as elevation band, mountain range or the
agency that produced the assessment. The insight gained from this analysis would
provide the foundation for examining the combined effect of multiple avalanche problems
on avalanche danger ratings.
For this step in the analysis, the wide format data table was converted into long
format by stacking the avalanche problem columns of all avalanche problem types into a
single set. To maintain the information on the avalanche problem type, and additional
avalanche problem type column was added. This data table format allowed me to create
a single CIT model for all single avalanche problems combined. While the dataset of
single avalanche problems contains sufficiently large samples for most avalanche
problem types to allow meaningful analyses, avalanche problem types with particularly
low number of data points where eliminated from the analysis.
According to the conceptual model of avalanche hazard, likelihood of avalanche
and destructive size of an avalanche problem are the primary determinants of avalanche
hazard. In AvalX, forecasters are asked to assign minimum, typical and maximum values
for both of these parameters. The typical value is intended to represent the best possible
estimate for the existing conditions, while the minimum and maximum values aim to
describe the expected range of conditions based on a qualitative assessment of the
expected variability in space and time (i.e., natural uncertainty) as well as assessment
uncertainty (Canadian Avalanche Association, 2014). Since the likelihood and size value
triplets are internally highly correlated, including all six parameters in the analysis would
result in convoluted decision rules. A key decision for a meaningful analysis is how to
best represent likelihood of avalanches and destructive size in the CIT models.
To address this issue, I created three base decision trees that only included the
avalanche problem type and one of three possible parameter combinations representing
the avalanche problem:
a) typical values of likelihood and size only
b) maximum values of likelihood and size only
c) typical + (maximum – typical) values of likelihood and size

25
While the typical value combination represents the best possible assessment of the
hazard situation, the maximum value combination reflects a worst-case scenario as
represented by the upper right extent of the hazard rectangle on the hazard chart, and
the typical + (maximum – typical) combination represents a combination that
incorporates both the best possible estimate and the size of the upper right corner of the
hazard rectangle on the hazard chart.
To make an informed decision on how to best include likelihood of avalanches
and destructive size in my CIT analysis, the single avalanche problem dataset was
randomly split into training (75%) and testing (25%) sets. While the training set was used
to build baseline CIT models for each representation option, the testing set was
subsequently used to validate each model using hit rate and multi-class area under the
receiver operator characteristic curve (multi-class AUC) as performance measures. Hit
rate (also known as accuracy) refers to how often the model was able to correctly predict
the danger rating category given the testing set and is expressed as a percentage
(Wilks, 2006). It is a straightforward measure to understand but lacks a clear
understanding of how well the model is able to predict each category (Harrell, 2011).
Multi-class AUC was used to supplement the hit rate and assess how well the model is
able to predict a given danger rating category. Obtaining this performance indicator
required the calculation of a receiver operator characteristic curve (ROC), which explains
how well a model predicts one category over another (Fawcett, 2005). ROC curves are
calculated for each danger rating class compared to all others (e.g., low rating compared
to moderate, considerable, high/extreme) and the area under the curve (AUC) is simply
the area underneath the ROC curve (Fawcett, 2005). A diagonal line (0.5) represents the
model predicting classes similar to random chance while scores above the diagonal
show that the model can predict a given class better (Wilks, 2006). The multi-class AUC
score is the average of all AUC scores for each class prediction and gives a realistic
understanding of how well the model predicted each danger rating category (Hand & Till,
2001). In addition to performance indicators, public avalanche forecasters were asked to
explain how they use minimum, typical and maximum values in AvalX to describe the
existing conditions. I combined the results from the performance measure analysis with
the perspectives of the forecasters to determine the best input parameter representation
for the base CIT model.

26
Once the parameter representation for likelihood of avalanches and destructive
size was chosen, I created a single Master CIT model for all single avalanche problems
with agency, mountain range, elevation band and aspects of where the problem was
present as additional parameters. Since most avalanche problems in my dataset were
present on all (eight) aspects and only Wind slab and Wet loose avalanche problems
exhibited more distinct aspect distributions, I simplified aspect into a binary parameter
that depicts whether the problem was present on all aspects (1) or fewer (0). The
influence of the variables included in the CIT model was assessed based on whether the
variable was used to split the dataset. Additionally, simplified CIT models with fewer
input parameters were calculated to assist the interpretation of specific research
questions.
3.4.4. Visualization, decision rule extraction and model interpretation
Once the Master CIT model was created, I visualized the model using tree
diagrams to facilitate interpretation and extract decision rules found by the model. To
enhance interpretability, I extracted decision rules for each avalanche problem type from
the Master CIT model and presented them as individual decision trees. This approach
offered a straightforward comparison of relevant decision rules for each avalanche
problem scenario.
To present the results of the analysis in a way that is more familiar to avalanche
forecasters, I visualized the decision rules for specific scenarios (e.g., storm slab
avalanche problems in the alpine assessed by Avalanche Canada in the Columbia
Mountains) by drawing them onto the hazard chart. For these scenarios, the terminal
nodes were identified for each likelihood of avalanches and destructive size combination
where observations were present, and the danger rating distributions at each of these
combinations were plotted as pie charts on the hazard chart. Furthermore, I used the
predicted danger rating (mode of distribution) at each combination to colour in the
background. Comparisons between the scenarios were based on the differences in
terminal nodes found by the decision rules within the tree model. However, since the
Master CIT model includes a large number of input parameters, the scenarios required
for the hazard chart visualizations become too specific to highlight general patterns
found in the data. To overcome this issue, I calculated additional, simpler CIT models
(e.g., storm slab avalanche problems regardless of elevation band, agency and

27
mountain range) that target specific relationships and facilitate their visualization on the
hazard chart. Since these models are simplifications of the Master CIT model, the
decision nodes and danger rating distributions presented in these hazard chart
visualizations generally do not explicitly match with the decision nodes and danger rating
distributions included in the Master CIT model.
3.5. Hazard assessments with avalanche problem combinations
Using the insight gained from the single avalanche problem CIT model, the
analysis was then expanded to hazard situations that involved avalanche problem
combinations. The goal of this analysis was to assess how the presence of an additional
avalanche problem affects the decision rules and danger rating assignment of another
avalanche problem. Frequencies of all avalanche problem combinations were calculated
to identify the most common avalanche problem combinations. I then calculated
individual, avalanche problem combination specific CIT models for each of the most
common problem combinations using the same variable parameters as in the individual
avalanche problem trees.
Due to the increased complexity of the resulting models, the visualization, rule
extraction and interpretation was conducted differently than with the single avalanche
problems. The higher dimensionality of these models (i.e., at least four dimensions due
to two likelihoods of avalanches and two destructive sizes) also prevents their
visualization on single hazard charts. However, to illustrate the tree models in a similar
way to the single avalanche problem situations, I created a series of hazard charts. In
these visualizations, the decision rules, terminal nodes and predicted danger ratings are
plotted onto the hazard charts of one avalanche problem under a series of specific
combinations of likelihood of avalanches and destructive size of the second avalanche
problem. The resulting series of hazard charts allow the viewer to explore how the
decision rules and danger rating assignments change in the hazard chart space of the
first problem as a function of the nature of the second problem.

28
Chapter 4. Results
4.1. Dataset overview
The complete available dataset contains 42,589 elevation band specific
avalanche hazard assessments produced by Avalanche Canada and Parks Canada
from all 17 forecast regions within BC and western Alberta. The dataset was unevenly
split between Avalanche Canada (79%) and Parks Canada (21%), which is simply a
reflection of the different number of forecast areas covered by the two agencies. Out of
the available hazard assessments, 6,490 (15%) did not include any avalanche problems,
15,020 (35%) only included a single avalanche problem, and the remaining 21,079
(50%) represented hazard situations with multiple avalanche problems. These
proportions differed significantly between agencies (Pearson’s chi-squared test: p-value
< 0.01) with single avalanche problem situations being slightly more prevalent in
Avalanche Canada hazard assessments (36% versus 32%) and multiple avalanche
problem situations being more common in the Parks Canada dataset (52% versus 49%).
Proportions also differed significantly among mountain ranges (Pearson’s chi-squared
test: p-value < 0.01) with the Coast Mountains exhibiting both the highest proportion of
single avalanche problem situations (42%) and the lowest proportion of multiple
avalanche problem situations (42%). The proportion of hazard situations with no
avalanche problems was highest in the Rocky Mountains (18%), followed by the Coast
Mountains (16%) and the Columbia Mountains (12%). However, the most dramatic
differences in the proportions were identified with respect to elevation band (Kruskal-
Wallis test: p-value < 0.01). In general, hazard situations with fewer avalanche problems
were more common below treeline (39% of all below treeline assessments had no
avalanche problems), whereas hazard situations with multiple avalanche problems were
most common in the alpine (69% of all alpine assessments had multiple avalanche
problems). Of the 15,020 hazard situations with single avalanche problems, 30% were
alpine assessments, 31% were from treeline and 44% originated from below treeline. Of
the 21,079 hazard situations with multiple avalanche problems, 46% were from the
alpine, 43% were treeline assessments and 11% were below treeline assessments.

29
4.2. Analysis of hazard situations with a single avalanche problem
4.2.1. Dataset overview
The dataset of single avalanche problem hazard situations consisted of 15,020
hazard assessments, 81% originated from Avalanche Canada and 19% came from
Parks Canada. The split among the main mountain ranges was pretty even with 32% of
the assessments being from the Coast Mountains, 39% from the Columbia Mountains
and 29% from the Rocky Mountains.
There were considerable differences in the prevalence of avalanche problem
types in the single avalanche problem dataset (Table 4.1). Storm slab avalanche
problems were the most common avalanche problem type, closely followed by Wind slab
avalanche problems. Together, these two problems accounted for 59% of the single
problem dataset and 21% of the complete dataset. Cornice and Wet slab avalanche
problems occurring on their own accounted for less than 1% of hazard assessments.
Since these samples were too small for producing meaningful decision rules, I omitted
these two problems from the CIT analysis.
Table 4.1 Frequency of single avalanche problem types from the single avalanche problem dataset.
Avalanche problem Number of assessments
Storm slab 4467 30% Wind slab 4359 29% Persistent slab 2797 19% Wet loose avalanche 1771 12% Deep persistent slab 975 6% Dry loose avalanche 530 4%
Cornice* 66 <1% Wet slab* 55 <1%
Total 15020 100%
* omitted from CIT analysis

30
Table 4.2 Frequency of single avalanche problems within mountain ranges of British Columbia and western Alberta.
Avalanche problem Coast Mountains
Columbia Mountains
Rocky Mountains
Storm slab 1915 40% 1769 30% 783 18%
Wind slab 1623 34% 1496 25% 1240 28%
Persistent slab 465 10% 1526 26% 806 18%
Wet loose avalanche 535 11% 641 11% 595 11%
Deep persistent slab 118 2% 180 3% 677 15%
Dry loose avalanche 37 1% 216 4% 277 6%
Cornice* 30 1% 24 <1% 12 <1%
Wet slab* 21 <1% 19 <1% 15 <1%
Total 4744 100% 5871 100% 4405 100%
* omitted from CIT analysis
Avalanche problems were found to have differing frequencies for each mountain
range (Table 4.2), and elevation band (Table 4.3). The Coast and Columbia Mountains
were dominated by Storm slab avalanche problems, while Wind slab avalanche
problems were the most prominent single avalanche problem type in the Rocky
Mountains. An examination with respect to elevation bands showed that most hazard
assessments with single Wet loose avalanche problems and Persistent slab avalanche
problems came from below treeline. These problems became less prevalent at higher
elevation bands. In contrast, most of the assessments involving Wind slab avalanche
problems came from the alpine elevation band with a smaller proportion coming from
treeline and hardly any from below treeline. While the largest number of Storm slab
avalanche problem assessments came from below treeline, this avalanche problem was
the most evenly distributed among the elevation bands.
Table 4.3 Frequency of single avalanche problems within the single avalanche problem dataset based on occurrence at each elevation band.
Avalanche problem Below treeline Treeline Alpine
Storm slab 1889 30% 1260 29% 1309 30% Wind slab 176 3% 1846 42% 2337 54% Persistent slab 2009 32% 495 11% 293 7% Wet loose avalanche 1405 22% 311 7% 55 22% Deep persistent slab 429 7% 339 8% 207 7%
Dry loose avalanche 341 5% 143 3% 46 1%
Cornice* 1 <1% 2 <1% 63 1% Wet slab* 38 1% 14 <1% 3 <1%
Total 6297 100% 4410 100% 4313 100% * omitted from CIT analysis

31
Avalanche problem types also showed differences in the space they occupied on
the avalanche hazard chart (Figure 4.1). Overall, the typical values of likelihood of
avalanches covered close to the full range of the likelihood scale, whereas the typical
destructive size assessments primarily occupied the lower half of the scale. All problems
spanned the scale of the likelihood of avalanches from Unlikely to Very Likely. Storm
slab avalanche problems had the highest likelihoods out of all problems with some
observations rated Almost Certain. Typical destructive sizes showed less of a range and
varied from size 1 to size 3.5. Deep persistent slab avalanche problems were the only
problem that did not have any hazard assessments at typical destructive of sizes 1 and
had the largest number of observations at 3.5.
a) Storm slab avalanche problem b) Wind slab avalanche problem
Figure 4.1 Avalanche problem observations for both Avalanche Canada and Parks Canada assessments based on typical likelihood of avalanches and destructive size for each avalanche problem type with the exception of the omitted Cornice and Wet slab avalanche problem types. The pie chart denotes the danger rating distribution at the combination of typical likelihood of avalanches and destructive size while the number on the upper right shows the number of observations at that point.

32
c) Persistent slab avalanche problem d) Wet loose avalanche problem
e) Deep persistent slab avalanche problem
f) Dry loose avalanche problem
Figure 4.1 Continued.
Avalanche danger ratings associated with single avalanche problem hazard
situations were not evenly distributed and different problems were found to have
different danger rating distributions (Kruskal-Wallis test: p-value < 0.01; Table 4.4).
Overall, Storm slab avalanche problems were the most severe and Dry loose avalanche
problems the least severe avalanche problem. Pairwise Wilcoxon rank-sum tests with
Bonferroni correction revealed significant differences in danger rating distributions
between almost all avalanche problem comparisons except Cornices and Deep
persistent slab avalanche problems (p-value = 0.27), Cornices and Wet loose avalanche
problems, Persistent slab and Wet slab avalanche problems, and Storm slab and Wet

33
slab avalanche problems (all p-value = 1.00). All of these non-significant differences are
caused by the small sample sizes of either the Cornice or Wet slab avalanche problem.
Moderate was the most common rating for most avalanche problems except for Dry
loose avalanche and Wet loose avalanche problems where Low was the dominant
danger rating level. Considerable ratings were assigned second most frequent, with
Storm slab avalanche problems being assigned this rating the most. High/Extreme was
assigned the least during the study period with many problems having this rating in less
than 2% of their assessments. The main exceptions of this pattern are Storm slab and
Wet slab avalanche problems that received High/Extreme ratings 9% (407 of 4467) and
4% (2 of 55) of the time.
Table 4.4: Danger rating distributions and overall ranking for each avalanche problem type within the single avalanche problem dataset.
Avalanche problem Rank Low Moderate Considerable High/Extreme
Storm slab 1 507 11% 1839 41% 1714 38% 407 9%
Wind slab 4 890 20% 2732 63% 715 16% 22 1%
Persistent slab 3 493 18% 1543 55% 729 26% 32 1%
Wet loose avalanche 6 807 46% 755 43% 185 10% 24 1% Deep persistent slab 5 272 28% 582 60% 109 11% 12 1%
Dry loose avalanche 8 349 66% 167 32% 14 3% 0 0%
Cornice* 7 25 38% 40 61% 1 1% 0 0% Wet slab* 2 14 26% 18 33% 21 38% 2 4%
Total 3357 22.3% 7676 51% 3488 23% 499 3% * omitted from CIT analysis
4.2.2. Representation of likelihood of avalanche and destructive size
The three CIT models used to determine the best representation of likelihood of
avalanches and destructive size for single avalanche problems revealed similar
performances based on the randomly selected testing dataset (25% of single problem
dataset). Hit rates only varied within a percentage point and the multi-class AUC scores
only ranged within 0.06 (Table 4.5). These results indicate that each of these
representations is suitable to represent the avalanche problem adequately with the
Maximum model producing the best hit rate and the Typical + (Maximum – Typical)
model resulting in the highest multi-class AUC value. However, consultations with
avalanche forecasters at Avalanche Canada (S. Horton, personal communication) and
Parks Canada (G. Statham, personal information) indicated that the Typical values are
often used as a starting point for hazard assessments and there is the impression that

34
they are used more consistently among forecasters than Maximum values. To make my
analysis as relevant for operational forecasters as possible, I therefore chose the Typical
values of likelihood of avalanches and destructive size to represent avalanche problems
for my CIT analyses.
Table 4.5 Performance indicators of CIT models to assess which variable to represent the hazard assessment within the final CIT model for the single avalanche problem dataset.
Parameter representations Hit rate Multi-class AUC
Typical 57.8% 0.740 Maximum 58.2% 0.740 Typical + (Maximum – Typical) 58.0% 0.746
4.2.3. Overall CIT model
General structure of classification tree
The CIT analysis of the single avalanche problem situations found 124 decision
rules that split the dataset into 125 distinct terminal nodes. The performance indicators of
this model showed an overall hit rate of 63% and a multi-class AUC score of 0.805. The
importance of an individual parameter on the danger rating assessment is a combination
of both the position of where the splits occur within the decision tree and the total
number of splits. While decision rules located higher on the tree reflect the most
significant splits in the danger rating distributions, the decision rules further down are
responsible for fine-tuning.
The first, and therefore most significant split in the Master CIT model for single
avalanche problems was avalanche problem type separating Storm slab avalanche
problems from all other avalanche problem types included in the analysis (i.e., Deep
persistent slab, Persistent slab, Wind slab, Wet loose avalanche and Dry loose
avalanche problems). Following the Storm slab avalanche problem branch of the
decision tree, elevation band made the next split separating below treeline from treeline
and alpine hazard assessments, followed by a concurrent destructive size split (size 1.5)
for both elevation bands. For all other avalanche problem types, likelihood of avalanches
was found to be the next most statistically significant split, separating problems based on
likelihoods of Possible. This was followed by a second likelihood split based on Unlikely-
Possible for problems with likelihoods of less than Possible, while problems with greater

35
than Possible likelihoods showed an avalanche problem split separating Wet loose
avalanche and Dry loose avalanche problems from Deep persistent slab, Persistent slab
and Wind slab avalanche problems.
Overall, the results of the single avalanche problem CIT model confirmed that
typical likelihood of avalanches and destructive size are fundamental parameters linking
avalanche problems to avalanche danger ratings. Both typical likelihood of avalanches
and destructive size were found to be responsible for some of the largest number of
splits in the dataset. Likelihood of avalanches was responsible for a total of 24 (19%)
splits, while destructive size contributed 22 (18%) splits. For Deep persistent slab,
Persistent slab, Wind slab, Wet loose avalanche and Dry loose avalanche problems,
likelihood of avalanches was found to be the more significant contributor towards the
danger rating as it was used for splits higher in the decision tree. For these avalanche
problem types, destructive size was often used further down on the CIT model affecting
the distribution of danger ratings rather than the level of the predicted danger rating (i.e.,
mode of distribution). In contrast, destructive size was found to be more influential than
likelihood of avalanches for Storm slab avalanche problems as destructive size was
used to split the dataset much higher in the Storm slab avalanche problem branch of the
CIT model.
Avalanche problem type was the most statistically significant (i.e., first) split found
by the CIT model and was used for a total of 17 splits (14%) throughout the entire tree.
While some of the avalanche problem types shared considerable sections of CIT
branches, this result highlights that each avalanche problem type has a somewhat
unique set of decision rules for assigning avalanche danger ratings. Splits were mainly
focused around three main avalanche problem groups: a) Storm slab avalanche
problems, which were assigned their own branch in the CIT model, b) Deep persistent
slab, Persistent slab and Wind slab avalanche problems; and c) Wet loose avalanche
and Dry loose avalanche problems.
In addition to likelihood of avalanches and destructive size, elevation band
emerged as a significant contributor to danger rating assignment and was tied with
likelihood of avalanches for the greatest number of splits (24, 19% of all splits) in the
single avalanche problem CIT model. It was identified as one of the main determining
factors for the danger rating distributions of Storm slab avalanche problems as it was

36
responsible for some of the dominant splits in the upper part of that section of the
decision tree (Figure. 4.6). For all other avalanche problems, elevation band was
typically used further down on the tree, and the assessments from the below treeline
elevation band were often separated from the alpine and treeline hazard assessments,
which stayed together for longer.
The remaining parameters included in the model—agency, mountain range and
the binary aspect variable—were all found to be less significant contributors to the
danger rating for most avalanche problem types. Agency was used to split the dataset a
total of 13 (10%) times, while the mountain range and aspect were used 12 (10%) and
11 (9%) times respectively. Since most of these splits were found much further down on
the decision tree than the splits associated by the likelihood of avalanches, destructive
size or the elevation band, these partitions were used to fine tune the danger rating
distributions rather than highlighting big splits.
Hazard chart visualizations
These charts aim to assist the interpretation of the CIT model by visualizing the
effect of specific model parameters on danger rating assignments more
comprehensively. However, it is important to remember that the CIT models used for
these visualizations do not include all of the model parameters included in the Master
CIT model for single avalanche problems.
Influence of likelihood of avalanches and destructive size
Projecting a decision tree with only likelihood of avalanches and destructive size
(i.e., all avalanche problem types combined) onto a hazard chart showed that danger
rating assignments relate to these parameters as expected (Figure 4.2). The distribution
of danger ratings (visualized with pie charts) and its mode (background colour) shifted
towards higher levels in response to increases in both likelihood and size parameters. It
is important to note that the hazard chart presented in Figure 4.2 represents a simplified
CIT model that only includes likelihood of avalanches and destructive size. The detailed
patterns of the displayed decision rules (black lines) should therefore not be over
interpreted.

37
Figure 4.2 Results of the single avalanche problem CIT model with only typical likelihood of avalanches and typical destructive size projected on the hazard chart. Decision rules are outlined in black while the pie chart denotes the danger rating distribution of the terminal node based on the CIT model. The numbers above the pie charts correspond to the identifier of the respective terminal nodes.
Influence of avalanche problem type
The hazard chart visualizations for the different avalanche problem types (Figure
4.3) clearly reflected the role of the avalanche problem type parameter in the single
avalanche problem CIT model and the observed differences in avalanche danger rating
distributions between avalanche problem types (Table 4.2).
The hazard chart visualization for Storm slab avalanche problems (Panel a)
showed that this avalanche problem type occupied a more severe part of the hazard
chart than other problem types. In addition, the visualizations illustrated that the same
combinations of typical likelihood of avalanches and destructive size generally resulted
in higher danger ratings for Storm slab avalanche problems compared to other problem
types. These two observations together were responsible for Storm slab avalanche
problems to have the most severe danger rating distribution of all avalanche problem
types. The hazard chart visualization for Storm slab avalanche problems also illustrated
that the typical destructive size affects the danger rating more than the likelihood as only
few likelihood of avalanches decision rules existed and increases in the destructive size
increased the danger rating more dramatically.

38
a) Storm slab avalanche problem b) Wind slab avalanche problem
Figure 4.3 Results of single avalanche problem CIT model with only avalanche problem type, typical likelihood of avalanches and typical destructive size projected on the hazard chart for each avalanche problem type seperately. Same presentation as Figure 4.2.

39
c) Persistent slab avalanche problem d) Wet loose avalanche problem
e) Deep persistent slab avalanche problem
e) Dry loose avalanche problem
Figure 4.3 Continued.
The hazard chart visualizations also confirmed that the avalanche forecasters
treated Deep persistent slab, Persistent slab and Wind slab avalanche problems
distinctly different from Storm slab avalanche problems. Both of the persistent avalanche
problem types had decision rules in similar locations (Panel c and e), but there were
slight differences in the associated avalanche danger ratings as the likelihood of
avalanches approaches Possible-Likely. The danger rating for Persistent slab avalanche
problems increased slightly sooner in response to changes in likelihood of avalanches
than for Deep persistent slab avalanche problems. Furthermore, the danger rating of
Deep persistent slab avalanche problems was affected more strongly by likelihood of
40
avalanches decision rules as it had fewer destructive size decision rules than Persistent
slab avalanche problems.
Wind slab avalanche problems shared considerable similarities with Deep
persistent slab and particularly Persistent slab avalanche problems as this avalanche
problem type was split from the persistent slab avalanche problems in the lower portions
of the Master CIT model. The decision rules for Wind slab avalanche problems shown in
the hazard chart (Panel b) illustrated that both likelihood of avalanches and destructive
size influence the danger rating for this avalanche problem type. This was shown as
increases in likelihood of avalanches and destructive size result in comparable changes
in the danger rating.
In the Master CIT model, the two loose avalanche problems—Wet loose
avalanche problems and Dry loose avalanche problems—were separated from Deep
persistent slab, Persistent slab and Wind slab avalanche problems in a split at the third
level of the tree. The two loose avalanche problems then stayed together until they split
apart much further down on the decision tree and only for scenarios with likelihoods of
avalanches lower than Likely-Very Likely and destructive sizes smaller than 2. Hence,
the danger rating assignments for these two avalanche problems shared many
similarities and were distinct from the others, which is apparent in the hazard chart
visualizations (Panels d and e). For example, the charts showed that the danger rating
assessments for both loose avalanche problem types were more sensitive to the
destructive size than likelihood of avalanches. However, Wet loose avalanche problems
were generally assessed more seriously than Dry loose avalanche problems of the same
likelihood and size.
Influence of elevation band
Elevation band emerged as one of the key parameters in the Master CIT
model, especially for Storm slab avalanche problem assessments. The
visualization of the general relationship between elevation band and danger
rating on the hazard chart (Figure 4.4) highlights that while the general pattern of
danger rating distributions was similar in all elevation bands, forecasters
assessed the same combinations of likelihood of avalanches and destructive size
more seriously at higher elevation bands.

41
a) Below treeline b) Treeline
c) Alpine
Figure 4.4 Hazard assessment decision rules and danger rating distributions for each elevation band according to observed typical likelihood of avalanches and typical destructive size. Same presentation as Figure 4.2.
Influence of other variables
Although some splits in the Master CIT model were based on aspect, agency and
mountain range, these variables show a limited influence on assigned avalanche danger
ratings. Wind slab avalanche problems and Wet loose avalanche problems were the only
problem types that have substantial proportions of assessments where the problem did
not exist on all eight aspects (66% and 56% respectively). For all other avalanche
problem types, problems on fewer than eight aspects only occurred in less than 20% of

42
the assessments. While the CIT analysis did not detect any decision rules with respect to
aspect for Wind slab avalanche problems, Wet loose avalanche problems exhibited
significant differences in danger rating assignments with respect to this variable (Figure
4.5). Whereas the locations of many likelihood and size decision rules were similar
regardless of the number of aspects, Wet loose avalanche problems that existed on
fewer than eight aspects are generally assessed less seriously. Aspect was also found
to split the Storm slab avalanche problem section of the decision tree three times.
However, these splitting rules only apply to a small part of the dataset since Storm slab
avalanche problems were only identified on fewer than eight aspects on 143 of 4457
assessments (3%).
a) Wet loose avalanche problem Present on fewer than eight aspects
b) Wet loose avalanche problem Present on all eight aspects
Figure 4.5 Hazard assessment decision rules and danger rating distributions for Wet loose avalanche problems based on the problem being on less than eight aspects and the problem being on eight aspects according to observed typical likelihood of avalanches and typical destructive size. Same presentation as Figure 4.2.
Since the Master CIT model revealed that agency and mountain range only had
minor effects on avalanche danger rating assignments for single avalanche problem
situations, I did not further explore these relationships with hazard chart visualizations.
4.2.4. Detailed look at specific individual avalanche problems
To provide deeper insight into how the various parameters included in the Master
CIT model interact, I will now discuss the decision rules for the three most prevalent

43
single avalanche problem types—storm slab avalanche problems, persistent slab
avalanche problems and wind slab avalanche problems—in more detail. Decision trees
for the other avalanche problem types are presented in Appendix B.
Storm slab avalanche problems
The Storm slab avalanche problem branch of the decision tree consisted of 23
decision rules that divided the dataset into 24 terminal nodes (Figure 4.6). The first and
most important decision rule related to elevation band, which separated alpine and
treeline hazard assessments from below treeline. Next, destructive size was used to split
both elevation band branches on destructive sizes of 1.5. Likelihood of avalanches made
the most splits with ten (42%), elevation band making four (17%), and agency,
destructive size and aspect each making three splits (13%). Mountain range was only
responsible for a single split (4).

44
Figure 4.6 Storm slab avalanche problem section of the single avalanche problem CIT describing the decision rules
and corresponding terminal nodes based on the most common danger rating assigned based on those rules.
45
Since the influence of a parameter is reflected in both the position and the
number of associated splits, destructive size was found to influence the danger rating for
Storm slab avalanche problems substantially more than likelihood of avalanches. The
main contributing factor to danger rating assignments for Storm slab avalanche problems
was based on size of 1.5. This is shown through higher danger ratings when the Storm
slab avalanche problem was assessed higher than size 1.5 where the most common
danger ratings were Considerable, while less than 1.5 were commonly assigned
Moderate danger ratings (Figure 4.6). Since the splits associated with likelihood were
lower down on the tree, they affected the danger rating distributions to a lesser degree.
Elevation band being the first split of the dataset showed that alpine and treeline
hazard assessments were more similar than below treeline. The effect of elevation band
on Storm slab avalanche problems exhibited the same general pattern as discussed
previously with progressively increasing danger ratings from below treeline to alpine
(Figure. 4.7). The decision rule of size 1.5 appeared in all elevation bands, which
highlights the prominence of this rule for danger rating assignments of Storm slab
avalanche problems. While alpine and treeline did not display any further splits on
destructive size, below treeline exhibited another splitting rule at size 2 when likelihood
of avalanches was assessed greater than Possible-Likely (Figure 4.6). However, this
rule did not change the mode of the danger rating distribution. Below treeline showed
Moderate danger ratings as most common, while treeline and alpine were generally
assigned Considerable ratings. In the alpine, High/Extreme was predicted within the
upper right area of the hazard chart where the likelihood of avalanches was greater than
Likely and destructive size was greater than size 1.5. High/Extreme ratings were not a
common danger rating assignment at treeline or below, but they were part of the danger
rating distributions in higher likelihood of avalanches and destructive size scenarios.

46
a) Below treeline b) Treeline
c) Alpine
Figure 4.7 Hazard assessment decision rules and danger rating distributions for Storm slab avalanche problems at each elevation band according to observed typical likelihood of avalanches and typical destructive size. Same presentation as Figure 4.2.
Since the Storm slab avalanche problem branch of the Master CIT model only
included a single decision rule with respect to mountain range (Figure 4.6), the danger
rating assessments were found to be generally consistent between mountain ranges.
This consistency was also reflected in the mountain range specific hazard charts for
Storm slab avalanche problems (Figure 4.10).

47
a) Coast Mountains b) Columbia Mountains
c) Rocky Mountains
Figure 4.8 Hazard assessment decision rules and danger rating distributions for Storm slab avalanche problems in each mountain range according to observed typical likelihood of avalanches and typical destructive size. Same presentation as Figure 4.2.
Although aspect and agency were responsible for a few splits in the Storm slab
avalanche problem branch of the Master CIT tree (Figure 4.6), hazard chart
visualizations that focus on the effect of these parameters for Storm slab avalanche
problems did not further illustrate these differences.
Persistent slab avalanche problems
The Persistent slab avalanche problem section of the decision tree consisted of a
total of 41 decision rules and 42 terminal nodes (Figure 4.9). There was considerable

48
overlap in the decision tree sections among Deep persistent slab, Persistent slab and
Wind slab avalanche problem types. Twenty-two (55%) of the terminal nodes included in
the Persistent slab avalanche problem section of the Master CIT model were also part of
the Wind slab avalanche problem part of the tree indicated by terminal nodes outlined
with dashed orange lines.
Most splits in the Persistent slab avalanche problem part of the Master CIT model
were based on elevation band with a total of 11 (27%), followed by destructive size (10,
24%) and likelihood of avalanches (7, 17%). However, despite being responsible for
fewer splits, likelihood of avalanches was the more significant parameter for the
assessment of Persistent slab avalanche problems as it produced splits higher up on the
tree. The main decision rule for Persistent slab avalanche problems was based on
likelihood of avalanches at Possible separating higher danger ratings (Moderate and
Considerable) from lower ones (Low and Moderate). This split at the top of the tree was
also shared by Deep persistent slab, Wind slab, Wet loose avalanche and Dry loose
avalanche problem types.
The hazard chart visualization of Persistent slab avalanche problems by
elevation band (Figure 4.10) helps to illustrate the effect of elevation on the danger
rating assessments on this avalanche problem type. Similar to the elevation pattern
exhibited by Storm slab avalanche problems discussed in the previous section,
Persistent slab avalanche problems were also assessed consistently more seriously at
higher elevation bands. The danger rating was most different in the alpine as this
elevation band was consistently split off first (Figure 4.9). Even though the Persistent
slab avalanche problem branch of the CIT model only included four splits that separate
treeline from below treeline at the final level, two of these splits resulted in danger rating
distributions with different modes.

49
Figure 4.9 Persistent slab avalanche problem section of the single avalanche problem CIT describing the decision
rules and corresponding terminal nodes based on the most common danger rating assigned based on those rules. Red outlined terminal nodes are shared between Persistent slab, Deep persistent slab and Wind slab avalanche problems, blue dashed outlined terminal nodes are shared between Persistent and Deep persistent slab problems, orange outlined terminal nodes are shared between Persistent and Wind slab avalanche problems, and black outlined terminal nodes are unique to Persisient slab avalanche problems.

50
a) Below treeline b) Treeline
c) Alpine
Figure 4.10 Hazard assessment decision rules and danger rating distributions for Persistent slab avalanche problems at each elevation band according to observed typical likelihood of avalanches and typical destructive size. Same presenation as Figure 4.2.
Similar to the patterns observed for Storm slab avalanche problems, mountain
range, agency and aspect were responsible for few splits, which were located much
farther down on the Persistent slab avalanche problem section of the decision tree
(Figure 4.9). The hazard chart visualization of the effect of mountain range (Figure 4.11)
confirmed that the impact of this parameter is minimal. The effect of agency and aspect
were not further examined with hazard chart visualizations.
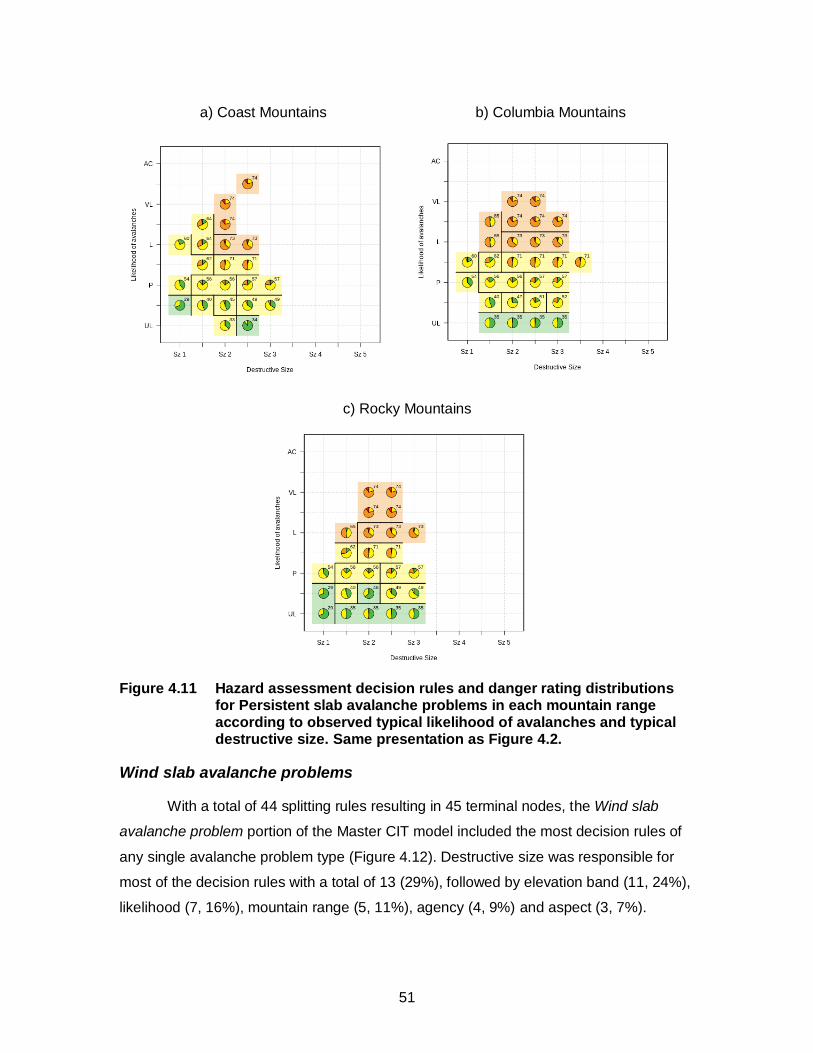
51
a) Coast Mountains b) Columbia Mountains
c) Rocky Mountains
Figure 4.11 Hazard assessment decision rules and danger rating distributions for Persistent slab avalanche problems in each mountain range according to observed typical likelihood of avalanches and typical destructive size. Same presentation as Figure 4.2.
Wind slab avalanche problems
With a total of 44 splitting rules resulting in 45 terminal nodes, the Wind slab
avalanche problem portion of the Master CIT model included the most decision rules of
any single avalanche problem type (Figure 4.12). Destructive size was responsible for
most of the decision rules with a total of 13 (29%), followed by elevation band (11, 24%),
likelihood (7, 16%), mountain range (5, 11%), agency (4, 9%) and aspect (3, 7%).

52
Substantial parts of the decision tree for Wind slab avalanche problems were
shared with Persistent slab avalanche problems, and the danger rating assignments for
these two avalanche problem types therefore exhibited many similarities. The top three
levels of the tree were completely the same for these two avalanche problem types
(Figures 4.9 and 4.12). Just like in the Persistent slab avalanche problem tree, likelihood
of avalanches assessed at Possible was the main decision rule found in the Wind slab
avalanche problem section followed by another likelihood split for likelihoods equal or
smaller than Possible, and a split on destructive size for the other branch. Out of the 45
terminal nodes in the Wind slab avalanche problem tree, 19 (42%) were shared with the
Persistent slab avalanche problem tree (Figure 4.9). Most of these shared terminal
nodes occur in configurations with a) likelihoods of avalanches of Unlikely-Possible or
lower and any destructive sizes, b) likelihoods of avalanche of Possible and destructive
sizes of 1, and c) likelihoods of avalanche higher than Possible and destructive sizes of
1.5 or smaller in the alpine.
Although Wind slab and Persistent slab avalanche problems shared many of the
splitting rules and terminal nodes, one of the main differences between the two
avalanche problem types was that Wind slab avalanche problem assessments occupied
a much smaller area on the hazard chart than Persistent slab avalanche problems. This
resulted in fewer splitting rules being displayed on the hazard chart visualizations.

53
Figure 4.12 Wind slab avalanche problem section of the single avalanche problem CIT describing the decision rules and
corresponding terminal nodes based on the most common danger rating assigned based on those rules. Red outlined terminal nodes are shared between Persistent slab, Deep persistent slab and Wind slab avalanche problems, purple dashed outlined terminal nodes are shared between Wind and Deep persistent slab problems, orange dashed outlined terminal nodes are shared between Persistent and Wind slab avalanche problems, and black outlined terminal nodes are unique to Wind slab avalanche problems.

54
Similar to the Persistent slab avalanche problem tree section, splits based on
elevation band were frequent in the Wind slab avalanche problem portion of the CIT
model. Hence the same patterns of higher danger ratings for the same combinations of
likelihood of avalanches and destructive size at higher elevations were apparent (Figure
4.13). In the case of Wind slab avalanche problems, alpine was the only elevation band
where Considerable and High/Extreme contributed substantially to the distribution of
danger ratings.
a) Below treeline b) Treeline
c) Alpine
Figure 4.13 Hazard assessment decision rules and danger rating distributions for Wind slab avalanche problems based on each elevation band according to observed typical likelihood of avalanches and typical destructive size. Same presentation as in Figure 4.2.
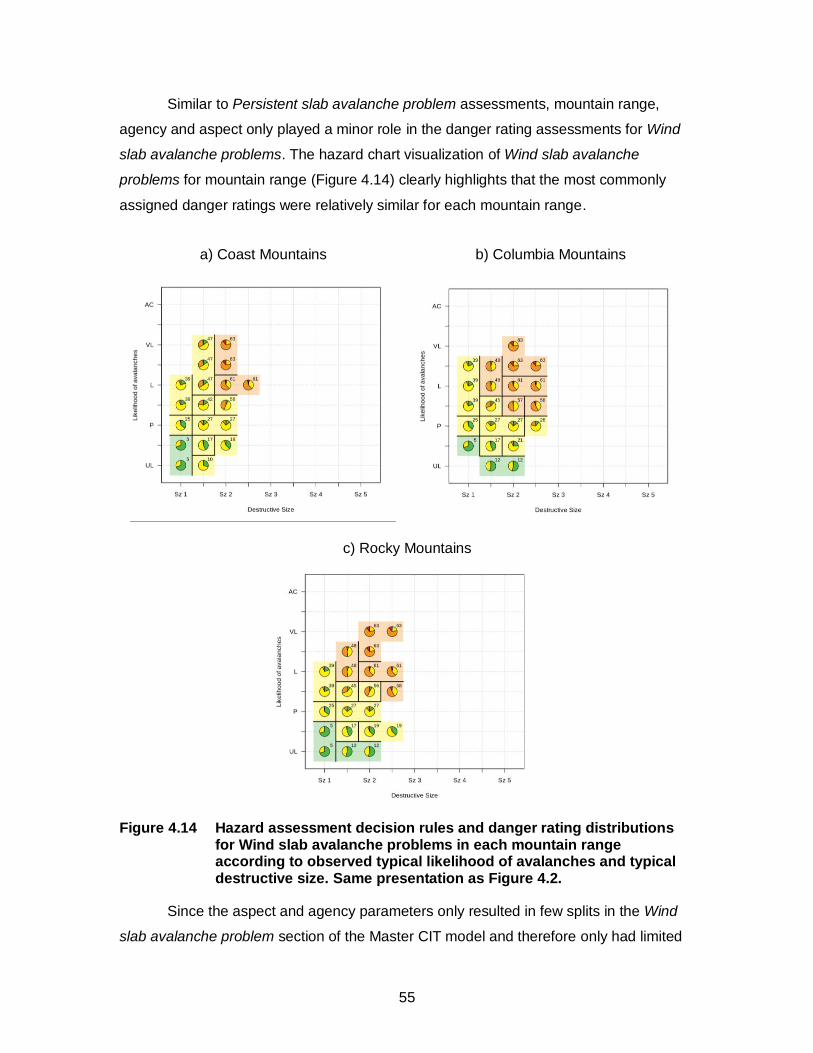
55
Similar to Persistent slab avalanche problem assessments, mountain range,
agency and aspect only played a minor role in the danger rating assessments for Wind
slab avalanche problems. The hazard chart visualization of Wind slab avalanche
problems for mountain range (Figure 4.14) clearly highlights that the most commonly
assigned danger ratings were relatively similar for each mountain range.
a) Coast Mountains b) Columbia Mountains
c) Rocky Mountains
Figure 4.14 Hazard assessment decision rules and danger rating distributions for Wind slab avalanche problems in each mountain range according to observed typical likelihood of avalanches and typical destructive size. Same presentation as Figure 4.2.
Since the aspect and agency parameters only resulted in few splits in the Wind
slab avalanche problem section of the Master CIT model and therefore only had limited

56
effect on danger ratings, hazard chart visualizations were omitted as they did not provide
further insight.
4.3. Analysis of hazard situations with multiple avalanche problems
4.3.1. Dataset overview
In total, my dataset included 54 different hazard situation types that contained
multiple avalanche problems. Twenty of these hazard situation types consisted of two
avalanche problems (Table 4.6) whereas 34 consist of three avalanche problems (Table
4.7). Overall, hazard situations with two and three avalanche problems accounted for
38% (16,386 assessments) and 11% (4,693 assessments) of the complete dataset
respectively. The frequencies of most hazard situations with avalanche problem
combinations were below 5% and many exhibited frequencies of 1% or less. The most
common avalanche problem combinations within the dataset were Persistent slab and
wind slab problems and Persistent slab and storm slab problems, which accounted for
41% of hazard situations with multiple problems and 21% of the entire dataset. Among
the hazard situations with three avalanche problems, Persistent, storm and wind slab
problems were the most prominent but only accounted for 4% of the hazard situations
with multiple problems. My discussion of hazard situations with multiple avalanche
problems will therefore only focus on Persistent slab and wind slab problems and
Persistent slab and storm slab problems.

57
Table 4.6 Frequency of hazard situations with two avalanche problems with the percentage of the dataset the combination contributed.
Avalanche problem combination Number of assessments
Persistent slab and wind slab problems 4566 22% Persistent slab and storm slab problems 3994 19% Deep persistent slab and wind slab problems 1805 9% Deep persistent and storm slab problems 914 4% Wind slab and cornice problems 558 3% Wind slab and dry loose avalanche problems 536 3% Persistent slab and wet loose avalanche problems 506 2% Wind slab and wet loose avalanche problems 469 2% Storm slab and wet loose avalanche problems 344 2% Storm slab and cornice problems 329 2% Deep persistent slab and persistent slab problems 268 1% Storm slab and dry loose avalanche problems 250 1% Cornice and wet loose avalanche problems 192 1% Persistent slab and dry loose avalanche problems 141 1% Wet slab and lose wet avalanche problems 106 1% Deep persistent slab and cornice avalanche problems 78 <1% Deep persistent slab and dry loose avalanche problems 64 <1% Persistent slab and cornice problems 45 <1% Deep persistent slab and wet slab problems 24 <1% Storm slab and wet slab problems 17 <1%
Total 15206 74%
In my dataset, the prevalence of Persistent slab and wind slab problems and
Persistent slab and storm slab problems differed considerably with respect to elevation
band and mountain range. While the Persistent slab and wind slab problem combination
was more common in the alpine and treeline, the Persistent slab and storm slab problem
hazard situation was found at similar frequencies at all elevation bands (Tables 4.7). The
dataset for both hazard situations was skewed towards the Columbia Mountains (Tables
4.8), which reflects both the higher number of forecast regions in this mountain range
and the higher frequency of these hazard situations in the transitional snow climate
(Shandro & Haegeli, 2018). While Persistent and wind slabs were least common in the
Coast Mountains, Persistent and storm slabs were least frequent in the Rocky
Mountains.

58
Table 4.7 Frequency of hazard situations with three avalanche problems with the percentage of the dataset the combination contributed.
Avalanche problem combinations Number of assessments
Persistent, storm and wind slab problems 746 4% Deep persistent, persistent and storm slab problems 389 2% Persistent slab, wind slab and cornice problems 350 2% Persistent slab, storm slab and cornice problems 285 1% Deep persistent slab, persistent slab and wind slab problems 268 1% Persistent slab, wind slabs and wet loose avalanche problems 264 1% Persistent slab, cornice and wet loose avalanche problems 234 1% Deep persistent slab, wind slab, and wet loose avalanche problems 229 1% Persistent slab, storm slab and wet loose avalanche problems 215 1% Wind slab, cornice and wet loose avalanche problems 182 1% Deep persistent slab, wind slab and cornice problems 182 1% Persistent slab, wind slab and dry loose avalanche problems 177 1% Deep persistent slab, storm slab and wind slab problems 166 1% Storm slabs, wind slabs and cornice problems 118 1% Deep persistent slabs, storm slabs and wet loose avalanche problems 100 <1% Persistent slab, storm slab and dry loose avalanche problems 99 <1% Storm slab, cornice, and wet loose avalanche problems 98 <1% Deep persistent slab, storm slab and cornice problems 95 <1% Deep persistent slab, cornice, and wet loose problems 82 <1% Storm slab, wind slab and dry loose avalanche problems 74 <1% Deep persistent slab, wind slab and dry loose problems 63 <1% Wind slab, cornice and dry loose avalanche problems 45 <1% Storm slab, cornice and dry loose avalanche problems 42 <1% Deep persistent slab, storm slab and dry loose avalanche problems 35 <1% Deep persistent slab, persistent slab and wet loose avalanche problems 32 <1% Cornice, wet slab and wet loose avalanche problems 28 <1% Deep persistent slab, wet slab and wet loose avalanche problems 24 <1% Deep persistent slab, storm slab and wet slab problems 24 <1% Deep persistent slab, persistent slab and cornice problems 22 <1%
Total 5027 26%
Table 4.8 Avalanche problem combination frequency according to elevation band with percentage of assessments at each elevation band.
Avalanche problem combination
Below treeline Treeline Alpine
Persistent slab and wind slab avalanche problems
127 3% 2302 50% 2137 47%
Persistent and storm slab avalanche problems
1052 26% 1521 38% 1421 36%

59
Table 4.9 Avalanche problem combination frequent according to mountain range with percentage of assessments within each mountain range
Avalanche problem combination
Coast Mountains
Columbia Mountains
Rocky Mountains
Persistent slab and wind slab avalanche problems
847 19% 1937 42% 1782 39%
Persistent and storm slab avalanche problems
859 22% 2693 68% 442 11%
4.3.2. Persistent slab and storm slab avalanche problem hazard situations
The hazard charts displaying the assessed combinations of typical likelihood of
avalanches and destructive size for the individual and combined avalanche problem
situations (Figure 4.15) showed that they occupy similar spaces. However, hazard
situations with both avalanche problems present simultaneously exhibited fewer
observations at size 1 compared to when the problems were present individually.
Furthermore, the hazard situations where both avalanche problems were present
simultaneously showed higher danger rating distributions for each likelihood and size
combination. At many of the likelihood and destructive size combinations, the danger
rating distribution was mainly split between Considerable and High/Extreme ratings.
General structure of classification tree
The CIT model for Persistent slab and storm slab avalanche problem situations
consisted of 40 decision rules that split the dataset into 41 terminal nodes (Figure 4.15).
Performance indicators for this model showed the lowest hit rate, only predicting the
correct danger rating 61% of the time. The multi-class AUC measure was 0.778.
Overall, the characteristics of the Storm slab avalanche problem dominated the
avalanche hazard assessment for this type of hazard situation. Storm slab destructive
size resulted in nine splits (22%) while Storm slab likelihood accounted for eight (20%).
Elevation band split the dataset a total of seven times (17%). The likelihood of
avalanches of the Storm slab avalanche problem was the most significant split
separating the hazard situations at Likely, followed by a split of elevation band
separating alpine assessments from those at treeline and below. Storm slab avalanche
problem destructive size was responsible for most of the subsequent decision splits (9,
22%), while only few were based on the characteristics of the Persistent slab avalanche

60
Figure 4.15 Persistent and Storm slab avalanche problem combination decision tree describing the decision rules and
corresponding terminal nodes based on the most common danger rating assigned based on those rules. Nodes indicated with a P are characteristics of the Persistent slab avalanche problem while those indicated with an S are characteristics of the Storm slab avalanche problem.
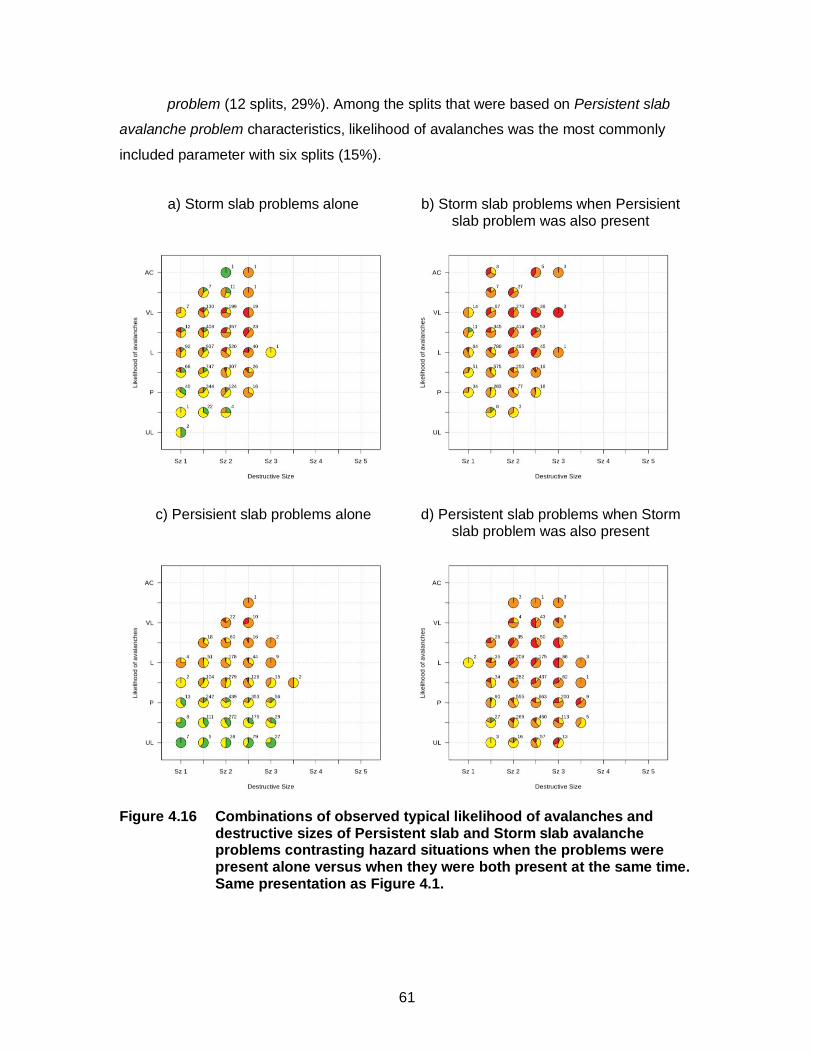
61
problem (12 splits, 29%). Among the splits that were based on Persistent slab
avalanche problem characteristics, likelihood of avalanches was the most commonly
included parameter with six splits (15%).
a) Storm slab problems alone b) Storm slab problems when Persisient slab problem was also present
c) Persisient slab problems alone d) Persistent slab problems when Storm slab problem was also present
Figure 4.16 Combinations of observed typical likelihood of avalanches and destructive sizes of Persistent slab and Storm slab avalanche problems contrasting hazard situations when the problems were present alone versus when they were both present at the same time. Same presentation as Figure 4.1.

62
Of the less prominent parameters, the binary aspect parameter for Storm slab
avalanche problems was responsible for three splits (7%) while Persistent slab aspect
was responsible for four (10%), while agency only accounted for a single split in the final
stage of a branch. The analysis found only one decision rule based on mountain range
separating the Coast and Rocky Mountains from the Columbia Mountains.
Hazard chart visualizations
Four series of hazard chart visualizations are shown to illustrate the interaction
between concurrent Persistent slab and Storm slab avalanche problems. However, it is
important to remember that these visualizations do not show the full complexity of the
CIT model since they only include the likelihood of avalanches and destructive size
terms of the two avalanche problems.
Storm slab avalanche problem hazard charts with a Persistent slab
avalanche problem at a likelihood of avalanches of Possible-Likely and
various destructive sizes (Figure 4.17).
Storm slab avalanche problem hazard charts with a Persistent slab
avalanche problem at various likelihoods of avalanches and a destructive
size of 2 (Figure 4.18).
Persistent slab avalanche problem hazard charts with a Storm slab
avalanche problem at a likelihood of avalanches of Possible-Likely and
various destructive sizes (Figure 4.19).
Persistent slab avalanche problem hazard charts with a Storm slab
avalanche problem at various likelihoods of avalanches and a destructive
size of 2 (Figure 4.20).
Storm slab avalanche problem hazard charts
The relative position of the coloured squares and the blue diamonds in the
hazard chart indicated that when the Persistent slab and Storm slab avalanche problems
are present together (Figures 4.17-20), the typical avalanches associated with the Storm
slab avalanche problem are typically more likely than the avalanches of the Persistent
slab avalanche problem. There is also a tendency that the Persistent slab avalanche
problem involves larger avalanches, but the pattern is not as strong. These observations

63
seem reasonable as the snowpack weakness responsible for the Persistent slab
avalanche problem is typically buried deeper in the snowpack than the superficial Storm
slab avalanche problem.
Overall, the Storm slab avalanche problem charts of the combined Persistent
slab and Storm slab avalanche problem situations (Figures 4.17 and 4.18) highlighted
the constant importance of the following splitting rules for the Storm slab avalanche
problem:
a) Between destructive sizes of 1.5 and 2
b) Between likelihoods of avalanches of Possible and Possible-Likely
c) Between likelihoods of avalanches of Possible-Likely and Likely
These three rules persisted in the Storm slab avalanche problem chart regardless of the
characteristics of the Persistent slab avalanche problem. Furthermore, rules a) and b)
were also present when the Storm slab avalanche problem exists in isolation (Figure
4.16, Panel a). Hence, these rules represent fundamental transitions in the assessment
of hazard situations involving Storm slab avalanche problems.
While the locations of the transitions remained stationary, the danger rating
distributions in the Storm slab avalanche problem hazard chart responded to changes in
the likelihoods and destructive sizes of the Persistent slab avalanche problem.
Comparisons of the first two panels in Figures 4.17 and 4.18 highlighted that adding
even a small or unlikely Persistent slab avalanche problem (Panels b) increased the
danger rating distributions relative to the pure Storm slab avalanche problem hazard
situations (Panels a). The scenarios with increasing destructive size of the Persistent
slab avalanche problem (Figure 4.17) showed a significant increase in danger rating
distributions when the destructive size increased from 2 to 2.5. However, this change
only affected Storm slab avalanche problems of likelihoods at Likely and higher and
destructive sizes of 2 or larger.

64
a) Storm slab avalanche problem alone
b) with Persistent slab avalanche problem with P-L likelihood and size 1.5
c) with Persistent slab avalanche problem with P-L likelihood and size 2
Figure 4.17 Hazard chart for Storm slab avalanche problems along and in combination with a Persistent slab avalanche problem at a likelihood of avalanches of Possible-Likely and various destructive sizes. Same presentation as Figure 4.2.

65
d) with Persistent slab avalanche problem with P-L likelihood and size 2.5
e) with Persistent slab avalanche problem with P-L likelihood and size 3
Figure 4.17 Continued.
The transitions with increasing likelihood of avalanches (Figure 4.18) were
initially a bit more gradual with changes occurring at every step until the likelihood of
avalanches for the Persistent slab avalanche problem reached Possible-Likely.
However, additional increases in the likelihood of avalanches did not further increase the
danger rating of the combined hazard situation. In addition, the available data points for
these hazard situations became increasingly rare as shown by the decreasing number of
coloured squares in the charts.

66
a) Storm slab avalanche problem alone b) with Persistent slab avalanche problem with UL-P likelihood and size 2
c) with Persistent slab avalanche problem with P likelihood and size 2
d) with Persistent slab avalanche problem with P-L likelihood and size 2
Figure 4.18 Hazard chart for Storm slab avalanche problem alone and in combination with a Persistent slab avalanche problem at various likelihoods of avalanches and a constant destructive size of 2. Same presentation as Figure 4.2.

67
e) with Persistent slab avalanche problem with L likelihood and size 2
f) with Persistent slab avalanche problem with L-VL likelihood and size 2
g) with Persistent slab avalanche problem with VL likelihood and size 2
h) with Persistent slab avalanche problem with VL-AC likelihood and size 2
Figure 4.18 Continued.
Persistent slab avalanche problem charts
The Persistent slab avalanche problem hazard charts for the Storm and
persistent slab avalanche problem combinations (Figure 4.19 and 4.20 tended to change
a bit more dramatically than the Storm slab avalanche problem hazard charts. While the
chart with a Storm slab avalanche problem of destructive size of 1.5 (Figure 4.19 Panel
b) still showed a few splitting rules, they completely disappeared once the destructive
size reaches 2 and the danger rating distribution became the same for the entire hazard
chart (Figure 4.19 Panels c). Additional increases in the destructive size of the Storm
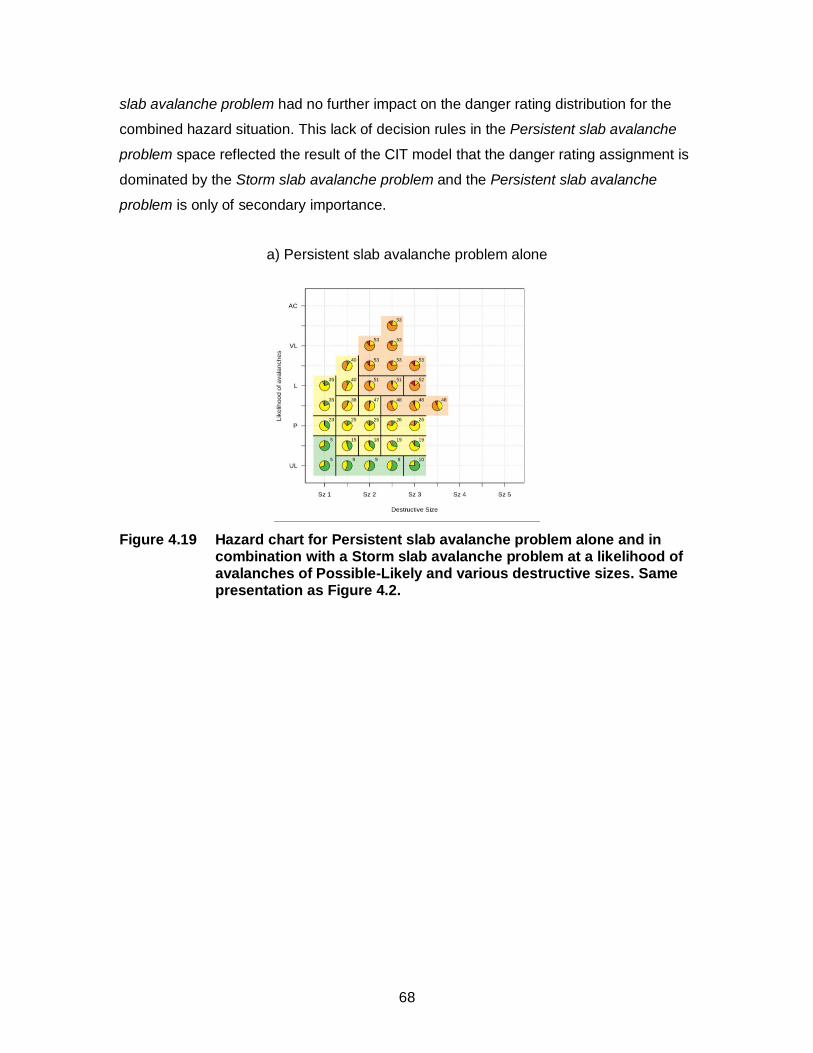
68
slab avalanche problem had no further impact on the danger rating distribution for the
combined hazard situation. This lack of decision rules in the Persistent slab avalanche
problem space reflected the result of the CIT model that the danger rating assignment is
dominated by the Storm slab avalanche problem and the Persistent slab avalanche
problem is only of secondary importance.
a) Persistent slab avalanche problem alone
Figure 4.19 Hazard chart for Persistent slab avalanche problem alone and in combination with a Storm slab avalanche problem at a likelihood of avalanches of Possible-Likely and various destructive sizes. Same presentation as Figure 4.2.

69
b) with Storm slab avalanche problem with P-L likelihood and size 1.5
c) with Storm slab avalanche problem with P-L likelihood and size 2
d) with Storm slab avalanche problem with P-L likelihood and size 2.5
e) with Storm slab avalanche problem with P-L likelihood and size 3
Figure 4.19 Continued.
The changes in the Persistent slab avalanche problem hazard chart in response
to increases in the likelihood of avalanches of the Storm slab avalanche problem were a
bit more variable (Figure 4.20), which showed that the Storm slab avalanche problem
likelihood of avalanches was a more significant decision rule in the CIT model than its
destructive size. As the Storm slab avalanche problem likelihood increased to Possible-
Likely, the danger rating distributions on the hazard chart became progressively more
severe (Figure 4.20, Panels b-d). No decision rules were found within these three hazard
scenarios except when the Storm slab avalanche problem likelihood of avalanches was

70
assessed at Possible (Figure 4.20Panel c). Once the likelihood of avalanches of the
Storm slab avalanche problem exceeded Likely, the hazard charts reveal two splitting
rules that divided the hazard space into three sectors for all of the higher likelihood
values (Figure 4.20, Panels e-h). In all of these scenarios, the danger rating distributions
included a substantial portion of High/Extreme ratings.
a) Persistent slab avalanche problem alone
b) with Storm slab avalanche problem with UL-P likelihood and size 2
c) with Storm slab avalanche problem with P likelihood and size 2
d) with Storm slab avalanche problem with P-L likelihood and size 2
Figure 4.20 Hazard chart for Persistent slab avalanche problem alone and in combination with a Persistent slab avalanche problem at various likelihoods of avalanches and a destructive size of 2. Same presenation as Figure 4.2

71
e) with Storm slab avalanche problem with L likelihood and size 2
f) with Storm slab avalanche problem with L-VL likelihood and size 2
g) with Storm slab avalanche problem with VL likelihood and size 2
h) with Storm slab avalanche problem with VL-AC likelihood and size 2
Figure 4.20 Continued.
4.3.3. Persistent slab and wind slab avalanche problem hazard situations
When Persistent slab avalanche problems were found in combination with Wind
slab avalanche problems, the locations of the avalanche problem assessments on the
hazard chart changed slightly (Figure 4.21). Both problems showed an increase in the
extent of likelihood of avalanches at higher ends of the likelihood scale as well as more
occurrences of higher destructive sizes. These differences were stronger among the
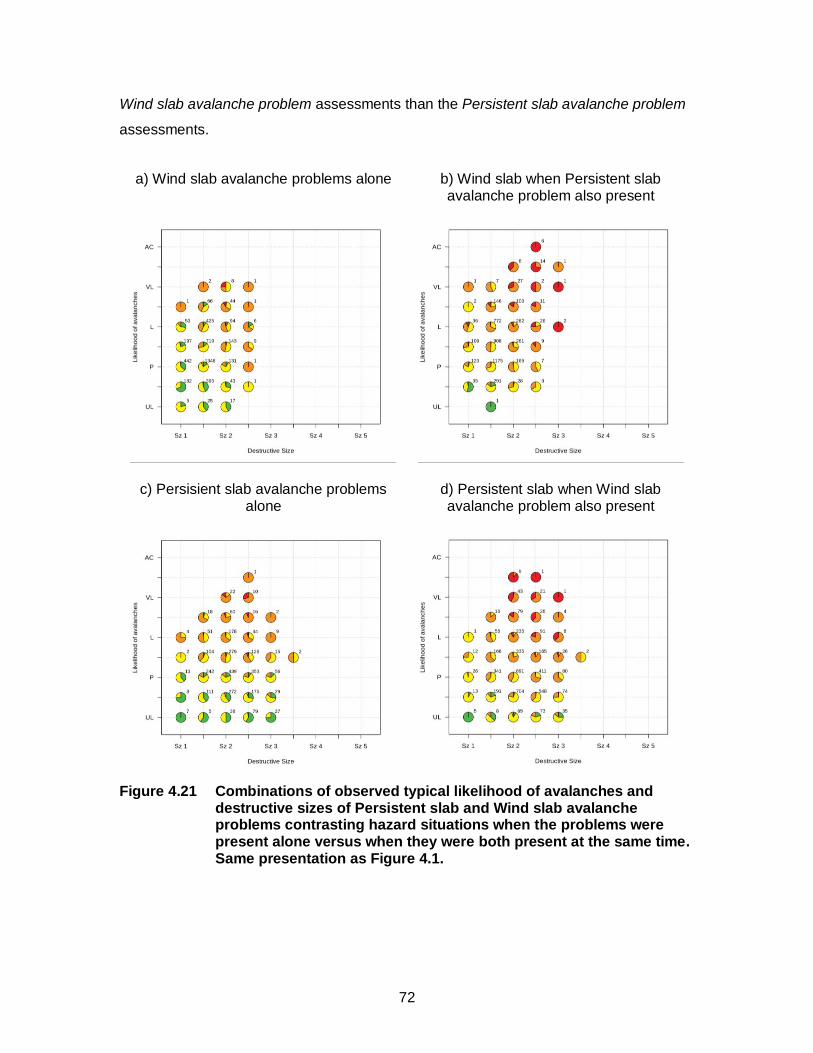
72
Wind slab avalanche problem assessments than the Persistent slab avalanche problem
assessments.
a) Wind slab avalanche problems alone b) Wind slab when Persistent slab avalanche problem also present
c) Persisient slab avalanche problems alone
d) Persistent slab when Wind slab avalanche problem also present
Figure 4.21 Combinations of observed typical likelihood of avalanches and destructive sizes of Persistent slab and Wind slab avalanche problems contrasting hazard situations when the problems were present alone versus when they were both present at the same time. Same presentation as Figure 4.1.

73
General structure of classification tree
The CIT analysis of the Persistent slab and wind slab avalanche problem
combination revealed a decision tree with 54 decision rules and 55 terminal nodes
(Figure 4.22). This model performed the best out of all assessed trees with a hit rate of
75% and a multi-class AUC score of 0.821. In this decision tree, likelihood of avalanches
of the Persistent slab avalanche problem made the first split. For likelihoods less than or
equal to Possible, this first split was followed by a split on likelihood of avalanches of the
Wind slab avalanche problem. For the other branch, Persistent slab avalanche problems
with likelihoods greater than Possible, the first split was followed by another split of
Persistent slab avalanche problem likelihood at Likely. In total, the likelihood of
avalanches and destructive size parameters of both avalanche problems were
responsible for similar numbers of splits in the CIT model, which highlights that both
problems contributed equally to the avalanche danger rating assignments. While
destructive size was the more influential parameter for the Wind slab avalanche problem,
likelihood of avalanches was the more important parameter for the Persistent slab
avalanche problem. Elevation band made a total of nine (16%) splits within the middle
sections of the decision tree while the aspect parameter was used for the Wind slab and
Persistent slab avalanche problem four (7%) and five (9%) times respectively. The
agency that produced the assessment made only one (2%) split while the mountain
range was not found to be a statistically significant contributor to the danger rating
distributions.

74
Figure 4.22 Persistent and Wind slab avalanche problem combination decision tree describing the decision rules and corresponding terminal nodes based on the most common danger rating assigned based on those rules. Nodes indicated with a P are characteristics of the Persistent slab problem while those indicated with a W are characteristic of the Wind slab avalanche problem.

75
Hazard chart visualizations
Similar to the discussion of the Persistent slab and storm slab avalanche problem
combination, I am showing four series of hazard chart visualizations to illustrate the
interactions between the two avalanche problems. The four chart series are:
Wind slab avalanche problem hazard charts with a Persistent slab
avalanche problem at a likelihood of avalanches of Possible-Likely and
various destructive sizes (Figure 4.23).
Wind slab avalanche problem hazard charts with a Persistent slab
avalanche problem at various likelihoods of avalanches and a destructive
size of 2 (Figure 4.24).
Persistent slab avalanche problem hazard charts with a Wind slab
avalanche problem at a likelihood of avalanches of Possible-Likely and
various destructive sizes (Figure 4.25).
Persistent slab avalanche problem hazard charts with a Wind slab
avalanche problem at various likelihoods of avalanches and a destructive
size of 2 (Figure 4.26).
Wind slab avalanche problem hazard charts
The relative position of the coloured squares and the blue diamonds in the
hazard charts (Figures 4.23-26) indicated that when the Persistent slab and Wind slab
avalanche problems are present together, the Wind slab avalanche problem typically
involves smaller avalanches than the concurrent Persistent slab avalanche problem at a
variety of likelihoods. This is reasonable, as the snowpack weakness responsible for the
Persistent slab avalanche problem is typically buried deeper in the snowpack than the
superficial Wind slab avalanche problem.
Comparing the hazard chart for single Wind slab avalanche problems with the
hazard charts for Persistent slab and wind slab avalanche problem combinations
(Figures 4.23 and 4.24) showed that adding a Persistent slab to a Wind slab avalanche
problem increases the resulting danger ratings substantially. The effect of the destructive
size is more sudden as even the addition of only a size 1.5 Persistent slab avalanche
problem results in a substantial increase in the danger rating distributions (Figure 4.23)

76
Panel a and b). The effect of likelihood of avalanches, on the other side, is more gradual
as the addition of a Persistent slab avalanche problem with a likelihood of avalanches of
Unlikely-Possible and a destructive size of 2 only produced minor changes in the
patterns of the hazard chart (Figure 4.23) Panel a and b).
When a Persistent slab avalanche problem is present, and its likelihood of
avalanches is set to Possible-Likely, the decision rules in the Wind slab avalanche
problem hazard chart disappear completely and the danger rating assessment becomes
independent of the likelihood of avalanches and destructive size parameters (Figure
4.23). The avalanche danger rating distributions for the Wind slab avalanche problem
increased gradually until the destructive size of the Persistent slab avalanche problem
reaches size 2.5 (Panel d). Increasing the destructive size further to 3 (Panel e) did not
change the danger rating distribution any further. In this progression, the proportion of
Considerable danger ratings increased substantially, but the contribution of
High/Extreme was low and did not change much.
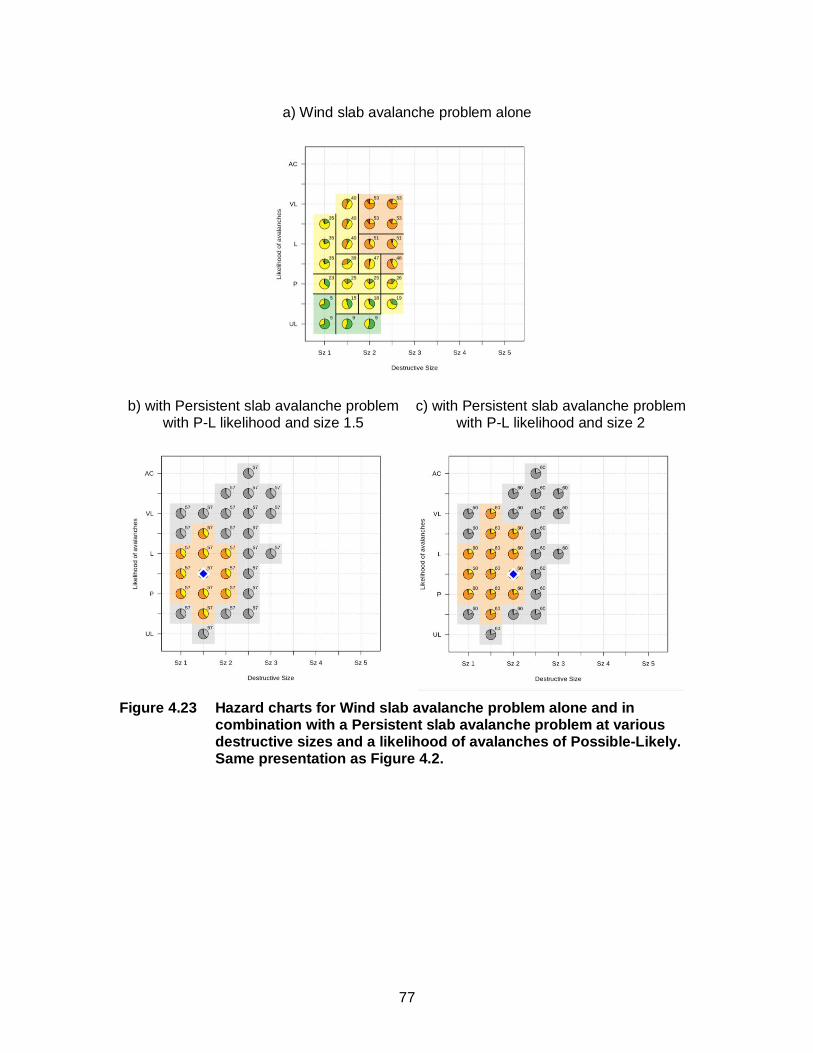
77
a) Wind slab avalanche problem alone
b) with Persistent slab avalanche problem with P-L likelihood and size 1.5
c) with Persistent slab avalanche problem with P-L likelihood and size 2
Figure 4.23 Hazard charts for Wind slab avalanche problem alone and in combination with a Persistent slab avalanche problem at various destructive sizes and a likelihood of avalanches of Possible-Likely. Same presentation as Figure 4.2.

78
d) with Persistent slab avalanche problem with P-L likelihood and size 2.5
e) with Persistent slab avalanche problem with P-L likelihood and size 3
Figure 4.23 Continued.
Variations in the likelihood of avalanches for the Persistent slab avalanche
problem at a destructive size of 2 had a more diverse effect on the Wind slab avalanche
problem hazard chart than variations in its destructive size (Figure 4.24). At the lowest
likelihood scenario of Unlikely-Possible, the decision rules and danger rating
assessments were similar to when Wind slab avalanche problems were assessed on
their own (Panel b). The main difference between the two scenarios was that none of the
likelihood of avalanches and destructive size combinations in situations with two
problems had Low as the most common danger rating. As the likelihood of the Persistent
slab avalanche problem increased, the number of decision rules displayed in the Wind
slab avalanche problem hazard chart decreased. When the likelihood of avalanches for
the Persistent slab avalanche problem was Possible-Likely and Likely, there were no
splits in the hazard chart (Panels d and e). Once the likelihood of avalanches of the
Persistent slab avalanche problem reached Likely-Very Likely, a decision rule that
separates Wind slab avalanche problem scenarios with likelihoods of Very Likely and
lower from scenarios with higher likelihoods appeared (Panel f-h). While the danger
rating distributions of the scenarios with lower likelihoods were dominated by
Considerable ratings, the danger rating distributions of the scenarios with higher
likelihoods of avalanches included more than 50% of High/Extreme ratings.

79
a) Wind slab avalanche problem alone b) with Persistent slab avalanche problem with UL-P likelihood and size 2
c) with Persistent slab avalanche problem with P likelihood and size 2
d) with Persistent slab avalanche problem with P-L likelihood and size 2
Figure 4.24 Hazard charts for a Wind slab avalanche problem alone and in combination with a Persistent slab avalanche problem at various likelihoods of avalanches and a constant destructive size of 2. Same presentation as Figure 4.2.

80
e) with Persistent slab avalanche problem with L likelihood and size 2
f) with Persistent slab avalanche problem with L-VL likelihood and size 2
g) with Persistent slab avalanche problem with VL likelihood and size 2
h) with Persistent slab avalanche problem with VL-AC likelihood and size 2
Figure 4.24 Continued.
Persistent slab avalanche problem hazard charts
An examination of the Persistent slab avalanche problem hazard charts with
changes in the destructive sizes of a Wind slab avalanche problem (Figure 4.25 and
4.26) showed that the decision rules related to the Persistent slab avalanche problem
persisted more as the characteristics of the Winds slab avalanche problem changed.
Hence, adding a Wind slab avalanche problem initially (Figure 4.25 and 4.26, Panels b)
only increased the danger rating distributions while the number and locations of many of
the decision rules remained stationary. As the destructive size of the Wind slab

81
avalanche problem increased to 2, the rules for Persistent slab avalanche problems with
likelihoods smaller than Possible-Likely disappeared and the danger ratings increased in
this area of the hazard chart. A further increase of the destructive size of the Wind slab
avalanche problem did not cause any more changes in the hazard chart. However, the
combination of a Persistent slab avalanche problem with a Wind slab avalanche problem
of destructive size 2.5 or 3 (Panel d and e) were very rare.
a) Persistent slab avalanche problem alone
Figure 4.25 Hazard charts for Persistent slab avalanche problem alone and in combination with a Wind slab avalanche problem at various destructive sizes and a constant likelihood of avalanches at Possible-Likely. Same presentation as Figure 4.2.
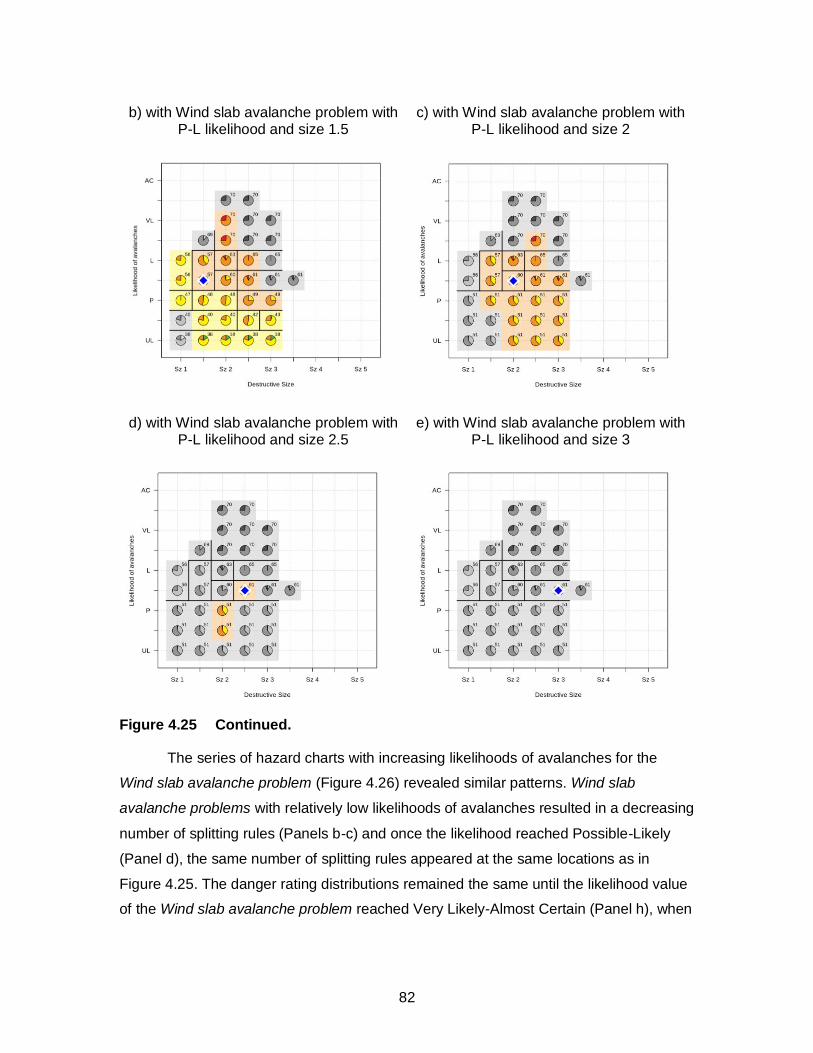
82
b) with Wind slab avalanche problem with P-L likelihood and size 1.5
c) with Wind slab avalanche problem with P-L likelihood and size 2
d) with Wind slab avalanche problem with P-L likelihood and size 2.5
e) with Wind slab avalanche problem with P-L likelihood and size 3
Figure 4.25 Continued.
The series of hazard charts with increasing likelihoods of avalanches for the
Wind slab avalanche problem (Figure 4.26) revealed similar patterns. Wind slab
avalanche problems with relatively low likelihoods of avalanches resulted in a decreasing
number of splitting rules (Panels b-c) and once the likelihood reached Possible-Likely
(Panel d), the same number of splitting rules appeared at the same locations as in
Figure 4.25. The danger rating distributions remained the same until the likelihood value
of the Wind slab avalanche problem reached Very Likely-Almost Certain (Panel h), when

83
more than 50% of the assessments for Persistent slab avalanche problems with
likelihoods higher than Likely had High/Extreme danger ratings.
The persistence of the likelihood of avalanche splitting in these hazard charts
(Figures 4.25 and 4.26) is consistent with some of the most important decision splits in
the CIT model and clearly highlights that the likelihood transitions from Possible to
Possible-Likely, Likely and Likely-Very Likely, play important roles as how avalanche
forecasters assess Wind slab avalanche problem hazard situations when Persistent slab
avalanche problems are present. While some of these splitting rules for Persistent slab
avalanche problems were also found in the Persistent slab and storm slab avalanche
problem hazard chart visualizations (Figures 4.19 and 4.20) they were not quite as
prominent for that combination. This might indicate that during times with both Storm
slab and Persistent slab avalanche problems, the characteristics of the Storm slab
avalanche problem are more important, whereas the characteristics of the Persistent
slab avalanche problem are more important when it co-occurs with a Wind slab
avalanche problem.
a) Persistent slab avalanche problem alone
b) with Wind slab avalanche problem with UL-P likelihood and size 2
Figure 4.26 Hazard charts for Persistent slab avalanche problem alone and in combination with a Wind slab avalanche problem at various likelihoods of avalanches and a constant destructive size of 2. Same presentation as Figure 4.2.

84
c) with Wind slab avalanche problem with P likelihood and size 2
d) with Wind slab avalanche problem with P-L likelihood and size 2
e) with Wind slab avalanche problem with L likelihood and size 2
f) with Wind slab avalanche problem with L-VL likelihood and size 2
Figure 4.26 Continued.

85
g) with Wind slab avalanche problem with VL likelihood and size 2
h) with Wind slab avalanche problem with VL-AC likelihood and size 2
Figure 4.26 Continued.

86
Chapter 5. Discussion
The purpose of my research was to explore the relationship between parameters
of the CMAH and assess their influence on avalanche danger rating assignments. In the
following section I reflect on the analysis in the context of the research questions based
on the findings of the CIT models.
5.1. General patterns of decision rules based on the core components of the CMAH
As expected, my analysis of single avalanche problem hazard situations
confirmed that the typical likelihood of avalanches and destructive size parameters of the
CMAH are key attributes influencing danger rating assignments. The CIT model
identified many statistically significant splits related to these two parameters. The hazard
chart visualizations of the assessments revealed that while forecasters used the full
likelihood scale for expressing the typical likelihood of avalanches, the maximum value
used for typical destructive size was 3.5 on the scale from 1 to 5.
One of the main findings of the single avalanche problem CIT model is that
avalanche forecasters do not assess all avalanche problem types the same, and that
danger ratings of different avalanche problem types are influenced differently by
changes in the likelihood of avalanches and destructive size parameters. Most notably,
the first splitting rule in the single avalanche problem CIT model separated Storm slab
avalanche problems from all other problem types. Single Storm slab avalanche problems
exhibited significantly higher danger ratings than other single avalanche problem types,
and destructive size affected the level of the avalanche danger rating more than
likelihood of avalanches. The importance of the main decision rule being based on
destructive size of 1.5 separating regions of Moderate from Considerable danger ratings
is nicely illustrated by both the decision tree and the hazard chart visualization. This can
likely be explained by the fact that according to the definitions in the avalanche size
classification (Canadian Avalanche Association, 2014) avalanches of size 2 or larger can
kill people, while smaller avalanches are generally not big enough to be harmful to
people. In contrast, the danger rating distributions of Deep persistent slab avalanche
problems were more strongly determined by the likelihood of avalanches parameter, and

87
for Persistent slab and Wind slab avalanche problems, it was a more even combination
of the likelihood of avalanches and destructive size parameters.
My analysis further revealed that the splitting rules for likelihood of avalanches
and destructive size of avalanche problem combinations differ from the rules when
avalanche problems are assessed individually. However, the observed differences are
context dependent. For example, in Persistent and storm slab avalanche problem
combinations, Storm slab avalanche problems were found to influence the resulting
danger rating more than the concurrent Persistent slab avalanche problem. While the
danger rating distributions changed in response to the severity of the two avalanche
problems, the locations of some of the Storm slab avalanche problem splitting rules
within the combination were relatively unaffected. In contrast, the number of decision
rules for the Persistent slab avalanche problem in the combination was fewer than when
the problem was assessed on its own. In the case of Persistent and wind slab avalanche
problem combinations, it was the Persistent slab avalanche problem that had a stronger
influence on the avalanche danger rating than the Wind slab avalanche problem. The
number of Wind slab avalanche problem decision rules decreased when coupled with a
Persistent slab avalanche problem.
Some of the avalanche problem-specific splitting rules for likelihood of
avalanches and destructive size exhibit substantial persistence. This means that the
location of the splitting rule on the hazard chart stays the same for a specific avalanche
problem regardless of whether the problem is assessed by itself or in combination with
another problem. For example, the transition in likelihood of avalanches from Possible to
Possible-Likely seems to be a fundamental rule for assessing Persistent slab avalanche
problems regardless of whether it is present by itself or in combination with other
avalanche problems. Similarly, the change from destructive size 1.5 to 2 emerged as a
fundamental transition for Storm slab avalanche problems due to the potentially lethal
consequences of avalanches of size 2 or larger. Hence, my results indicate that
avalanche forecasters might have fundamental, avalanche problem specific thresholds
for likelihood of avalanches and destructive size when assigning avalanche danger
ratings within the CMAH framework.

88
5.2. Influence of additional parameters on the avalanche danger rating
The CMAH outlines key parameters that forecasters consider when evaluating
avalanche hazard. In addition to likelihood of avalanches and destructive size, my
analysis also examined the potential effect of elevation band, mountain range, and
whether or not the problem was present on all aspects on avalanche danger ratings.
Through this analysis, I found that all these parameters have a statistically significant
effect on danger rating distributions. However, closer analyses of the CIT models and
hazard chart visualizations revealed that some parameters influence the danger rating
more than others.
At the beginning of the assessment process in AvalX, public avalanche
forecasters are asked to describe the location of where an avalanche problem is present
in terms of elevation band and aspect. The subsequent hazard assessment of the
avalanche problem then focuses on the conditions within the specified location. At the
end of the process, elevation specific danger ratings are specified based on these
assessments. My analysis found that avalanche problems with the exact same
characteristics are assessed more severely at higher elevation bands. In other words, a
Storm slab avalanche problem with the same typical values for likelihood of avalanches
and destructive size get a higher danger rating in the alpine than at treeline. While the
prevalence of avalanche problem types differs among elevation bands (Shandro &
Haegeli, 2018) and differences in the conditions can lead to avalanche problems of
different severity, there are no indications in the definitions of avalanche problem types
and the descriptions of relevant risk mitigation strategies (Statham et al., 2018; Haegeli,
Atkins & Klassen, 2010) that indicate that elevation should have a direct effect on
avalanche danger ratings. This means that avalanche forecasters might have a bias
towards assigning higher danger ratings at higher elevations.
Since avalanche danger ratings of an elevation band need to represent the
hazard condition of all aspects (i.e., cardinal directions), it seems reasonable that an
avalanche problem that is only present on one aspect sector might result in a lower
danger rating than when the same problem is present on all aspects. However, my
analysis revealed that aspect only plays a minor role in avalanche danger rating
assessments. The only avalanche problem type where I found significant splitting rules

89
associated with aspect was Wet loose avalanche problems, where problems that were
present on all aspects resulted in higher danger ratings than when they were present on
fewer aspects. Surprisingly, no aspect splits emerged for Wind slab avalanche problems,
the only other avalanche problem types that frequently occur on limited aspects. While
this result might seem counterintuitive initially, a reasonable interpretation is that danger
ratings generally represent the worst-case condition in a given elevation band. In other
words, avalanche forecasters choose danger ratings to warn recreationists about to the
worst conditions. If warranted, they might provide additional information in the text part of
the avalanche bulletin to inform more advanced users that conditions are more
favourable on specific aspects.
Agency and mountain range, the final two parameters included in my analyses,
did not result with many splits in the various CIT models. This means that I did not find
systematic differences in the way that avalanche forecasters from Avalanche Canada
and Parks Canada assess avalanche hazard situations examined in my study. This is
comforting as several recent studies (e.g., Lazar et al., 2016; Statham, Holezi &
Shandro, 2018; Techel et al., 2018) found substantial differences in avalanche hazard
assessments between agencies. Furthermore, my results indicate that avalanche hazard
situations were assessed independently of the mountain range and snow climate they
were located in. In other words, a Storm slab avalanche problem of a specific nature
generally received the same danger rating regardless of whether it was in the Coast
Mountains or Rocky Mountains.
5.3. Model performance
The hit rates of the CIT models developed in this study ranged from 61% to 75%,
whereas the multi-class AUC were between 0.778 and 0.821 (Table 5.1).
Table 5.1 Performance indicators for CIT models
Decision Tree Model Hit Rate Multi-Class AUC
Single avalanche problem 63% 0.805 Persistent slab and Storm slab problem combination
61% 0.778
Persistent slab and Wind slab problem combination
75% 0.821
90
The CIT models developed in this study perform considerably worse than the
models developed by Schirmer, Lehning and Schweizer (2010) and Bellaire and
Jamieson (2013). A possible reason for this difference is the fact that these studies used
different types of datasets. Schirmer, Lehning and Schweizer (2010) and Bellaire and
Jamieson (2013) used datasets with physical weather and snowpack data measured at
point locations and linked them to validated danger ratings. In contrast, the data for my
study relied entirely on human judgment data. While I originally hypothesized that the
involvement of human forecasters might address some of the challenges in the models
linking weather and snowpack observations to avalanche hazard, the results of my
analysis show that forecaster involvement might introduce a different type of variability.
Avalanche forecaster was not included in my CIT models as a parameter as the
objective of my analysis was to capture forecaster expertise in general. However,
McClung (2002) mentioned human bias as an issue in avalanche forecasting with factors
such as risk propensity and perception affecting how a forecaster produces an
avalanche forecast or assigns an avalanche danger rating. Future research on the link
between the CMAH and avalanche danger ratings should therefore examine the effect of
forecaster variability on avalanche danger rating assignments in more detail.
With a hit rate of 75%, the POLR model developed by Haegeli, Falk and Klassen
(2012) also performed considerably better than the CIT models presented in this study.
There are several possible reasons for this difference. First, the two studies used
different datasets. Haegeli, Falk and Klassen (2012) only had a dataset of two winter
seasons from Avalanche Canada, whereas the present study included eight seasons
from both Avalanche Canada and Parks Canada. Second, my models only used the
typical likelihood and size parameters, whereas the POLR model used the maximum as
well as the typical values to represent the avalanche problem. This allowed for a
potentially more comprehensive representation of avalanche problems in the model,
while the use of the typical values within my model only captured part of the avalanche
hazard. However, my model comparison did not reveal any substantial performance
differences between CIT models with different likelihood of avalanches and destructive
size representation. Another possible reason for the observed difference in performance
is that Haegeli, Falk and Klassen (2012) produced a single model that included
information from all concurrent avalanche problems and did not create separate models
for different combinations of avalanche problems. Furthermore, the analysis of Haegeli,

91
Falk and Klassen (2012) included contribution as an additional variable that describes
the importance of problems for the danger rating assignment. This variable was not
available for the dataset used in the present study.
5.4. Operational insights and potential for decision aid development for avalanche forecasting
The results of this study provide useful insights into how the CMAH has been
applied in hazard assessments for public avalanche bulletins by avalanche forecasters.
One of the objectives of the introduction of the CMAH was to standardize the workflow,
streamline the bulletin production process, and make avalanche bulletins more
consistent (Statham, Haegeli et al., 2018). While my analyses were able to identify
meaningful relationships between the danger ratings and the components of the CMAH,
my models indicate that there is substantial variability in the present danger rating
dataset that cannot be accounted for by the components of the CMAH. This is evident by
the relatively low performance indicators of the models and the broad distributions of
danger ratings displayed in the pie charts on the hazard chart visualizations. This means
that avalanche forecasters assign a wide range of danger ratings to hazard situations
that are the same with respect to avalanche problem type, typical likelihood of
avalanches, typical destructive size, elevation band, aspect, mountain range and
agency. While it is possible that additional hazard factors not included in the CMAH are
partially responsible for the observed unexplained variability, the most likely source is
inconsistency between and within avalanche forecasters. This result confirms concerns
around avalanche bulletin consistencies that have been raised by other recent studies
including Lazar et al. (2016), Techel et al. (2018), and Statham, Holezi and Shandro
(2018). This means that the lack of an explicit link between the avalanche danger scale
and the CMAH is a substantial stumbling block for producing consistent avalanche
danger ratings.
While forecaster training is one way to address this inconsistency, decision aids
that automatically combine the CMAH attributes that a forecaster enters into AvalX and
produce a danger rating or distribution of danger ratings have great promise to improve
avalanche bulletin consistency (Statham, Holeczi, & Shandro, 2018). While forecasters
might be resistant to completely delegate the danger rating assignment to a computer
program, the output of a decision aid could offer a useful starting point or independent

92
reference for a human forecaster, especially during tricky hazard situations. Since the
relationship between avalanche problems and danger ratings is multidimensional and
complex, a data-driven design approach is preferred over an expert opinion driven
approach (Statham, Haegeli et al., 2018). Examining the potential of the existing hazard
assessment dataset for the design of meaningful decision aids was therefore one of the
primary motivations for the present study. While my analysis was able to identify key
patterns in avalanche hazard assessments, the remaining unexplained variability seems
too large to directly derive a meaningful decision tool from my research. A decision tool
developed from the existing dataset might only reinforce and perpetuate the existing
biases and inconsistencies. However, the present research represents the first
quantitative insight into the complex relationship between avalanche problems and the
avalanche danger scale. The models and visualizations presented in this study can
provide avalanche forecasters with new ways for exploring their past hazard
assessments in a comprehensive way and starting a meaningful, evidence-based
discussion about what danger ratings should be associated with different types of
conditions. Examples of critical questions that forecasters might need to discuss include
‘Does it make sense that each avalanche problem type has different rules for assigning
danger ratings?’ or ‘Should the overall danger rating be heightened with an increase in
elevation band?’. The resulting guidelines could then be implemented in a decision aid
directly in AvalX. So, instead of having a purely data-driven approach to the design of
this decision aid, the decision aid would be based on data-informed expert opinion.
5.5. Limitations
While the present analysis offers meaningful first insights into the relationship
between the components of the CMAH and the avalanche danger scale, several
limitations need to be considered when interpreting the results. For instance, meaningful
CIT models could only be created for avalanche problems and problem combinations
with a sufficiently large dataset. Overall, the models used to derive the main results—
a) Master CIT model for single avalanche problems, b) CIT model for Persistent slab and
storm slab avalanche problem, and c) CIT model for Persistent slab and wind slab
avalanche problem—only represent 65% of the available hazard assessments with one
or more avalanche problems. However, most of the avalanche problem situations that
were not included in the analysis are relatively rare and do not have big enough datasets

93
(i.e., less than 300 data points) to provide meaningful statistically significant insights. It is
therefore inherently difficult to provide a truly comprehensive picture of the existing
decision rules. While this issue could be addressed by developing an even bigger
dataset, the additional information gain might only be incremental and of limited
operational value.
Perhaps the biggest limitation in my analysis approach was the reduction of the
avalanche problem hazard assessments to only the typical values of likelihood of
avalanches and destructive size. The original value triplets (minimum, typical and
maximum) for these parameters are an important component of the CMAH as they allow
forecasters to represent uncertainty in the hazard assessment. By simplifying this aspect
of the hazard characterization to just one parameter, information was lost that could
potentially be responsible for some of the observed unexplained variability. While
including the full value triplets in the CIT analysis could result in different splitting rules
and might allow a finer grained interpretation of the connection of the CMAH to the
danger rating scale, the resulting decision trees would likely become extremely difficult to
describe and interpret. The applied objective of this research project and the desire to
provide avalanche forecasters at Avalanche Canada and Parks Canada with
interpretable results seemed valid reasons for justifying this simplification.
94
Chapter 6. Conclusion
The purpose of this research was to explore the relationship between hazard
assessments produced according to the conceptual model of avalanche hazard (CMAH;
Statham et al. 2018) and the North American Public Avalanche Danger Scale (Statham
et al., 2010). Using a dataset of 42,589 avalanche hazard assessments included in
public avalanche bulletins produced by Avalanche Canada and Parks Canada from 2012
to 2018, I employed conditional inference trees (CIT; Hothorn, Hornik & Zeileis, 2006) to
examine how the CMAH parameters used to describe the location and nature of
avalanche problems—forecasting agency, mountain range, avalanche problem type,
elevation band, aspect, likelihood of avalanches and destructive size—relate to
avalanche danger ratings. I chose decision trees for the analysis because of their ability
to model complex non-linear relationships and simultaneously produce tangible and
easy to interpret insight into the underlying decision rules. Furthermore, I selected the
CIT over the traditional CART methodology (Breiman et al., 1998) because of its
grounding in statistical significance testing, which produces unbiased splits and trees
that do not require pruning.
I first used hazard assessments with only one avalanche problem to derive a
single CIT model for all avalanche problem types. The model included the typical values
of likelihood of avalanches and destructive size representing the core components of the
CMAH as well as elevation band, mountain range, forecast agency and a binary
representation of aspect. I then extracted the splitting rules from the CIT model and
plotted the results for specific scenarios onto hazard charts for a more tangible and easy
to understand visualization. I subsequently built separate CIT models for two of the most
frequent avalanche problem combinations—Persistent and storm slab avalanche
problems and Persistent and wind slab avalanche problem combinations—to assess
how having multiple avalanche problems present simultaneously affects the decision
rules.
Results of the CIT analyses revealed both expected and surprising patterns.
Likelihood of avalanches and destructive size, the two key contributors to avalanche
hazard, influenced avalanche danger as expected. Avalanche danger ratings generally
increased with increasing likelihood of avalanches and destructive size, and higher

95
danger ratings were more prevalent in scenarios in the top right corner of the hazard
chart, whereas lower ratings were assigned most commonly towards the bottom left
corner. A more surprising result was that avalanche danger ratings depend on
avalanche problem type and location in the terrain. Avalanche problem type was the first
and therefore statistically most significant split in the CIT model for single avalanche
problems. First, the model separated Storm slab avalanche problems from all other
avalanche problem types. Further down on the tree, Wet loose avalanche problems and
Dry loose avalanche problems were separated from Deep persistent slab avalanche
problems, Persistent slab avalanche problems and Wind slab avalanche problems. This
was surprising as it highlights that identical combinations of likelihood of avalanches and
destructive size were not assessed the same for every avalanche problem type.
Furthermore, I found that the danger ratings for different avalanche problem types were
more sensitive to changes in either typical likelihood of avalanches or typical destructive
size. While destructive size was the more influential contributor for Storm slab avalanche
problems, likelihood of avalanches was more dominant for Deep persistent slab
avalanche problems, Persistent slab avalanche problems and Wind slab avalanche
problems. Another surprising result of my analysis of single avalanche problem
situations was that elevation band emerged as a key parameter affecting avalanche
danger ratings. Identical combinations of likelihood of avalanches and destructive size
were consistently assessed more serious in the alpine than at treeline or below. In
comparison, forecasting agency, aspect and mountain range seemed to have little effect
on danger ratings.
My analysis of multiple avalanche problem situations offered additional insight on
how decision rules change when additional avalanche problems are present. As
expected, my findings show that avalanche danger ratings were generally higher when
multiple avalanche problems are present. While likelihood of avalanches and destructive
size remained the main drivers for the avalanche danger rating, the number and
locations of splitting rules changed. I also found that one avalanche problem type
typically influenced the danger rating assignment considerably more than the other. For
Persistent and storm slab avalanche problem combinations, for example, the Storm slab
avalanche problem influenced the danger rating assignment more than the Persistent
slab avalanche problem.

96
Despite the CIT models extracting meaningful relationships, the relatively low
performance measures of the models highlighted a substantial amount of variability in
the dataset that cannot be explained with the CMAH. While some of this variability is
likely due to simplifications in the model specification (e.g., only using typical values for
likelihood of avalanches and destructive size) and hazard related factors not captured in
the CMAH, inconsistencies between individual forecasters is another likely source. This
interpretation is consistent with other recent research that has highlighted
inconsistencies in avalanche hazard assessments (e.g. Lazar et al. 2016; Statham,
Holezi & Shandro 2018; Techel et al. 2018). This means that the introduction of the
CMAH only partially succeeded in making avalanche bulletins more consistent. While the
framework has added structure to the forecasting process and facilitates more consistent
documentation, the lack of an explicit link between the components of the CMAH and the
North American Avalanche Danger Scale leaves the system vulnerable to forecaster
interpretation and human bias.
While my results do not seem to provide sufficient insight for the direct
development of an operational decision aid to address this issue, the derived models do
create new opportunities for avalanche forecasters to critically review their forecasting
practices. The identified decision rules can be used to illustrate how the CMAH has been
used in the past and to explicitly highlight inconsistencies or challenges. This was not
possible prior to the introduction of the CMAH framework. A more explicit examination of
differences among forecasters might offer additional opportunities that allow individual
forecasters to better understand their approach to the hazard assessment process and
shine light on potential sources of inconsistencies or bias. Overall, this will improve the
understanding of the connection between avalanche problems and avalanche danger
ratings to create a platform for an informed discussion about what ratings should be
associated with what conditions. These rules can eventually be incorporated into a
formal decision aid to improve consistency in avalanche danger ratings in the long-term.

97
References
Avalanche Canada. (2017). Incident Report Database. Retrieved from http://old.avalanche.ca/cac/library/incident-report-database/view
Avalanche Canada. (2019). Glossary. Retrieved from: https://www.avalanche.ca/glossary
Bellaire, S., & Jamieson, B. (2013). On estimating avalanche danger from simulated snow profiles. Proceedings of the 2013 International Snow Science Workshop, Grenoble, France, 154–161.
Bishop, C. (2006). Pattern Recognition and Machine Learning. Springer.
Blattenberger, G., & Fowles, R. (2016). Treed Avalanche Forecasting: Mitigating Avalanche Danger Utilizing Bayesian Additive Regression Trees. Journal of Forecasting, 36(2), 165–180. https://doi.org/10.1002/for.2421
Brabec, B., & Meister, R. (2001). A nearest-neighbor model for regional avalanche forecasting. Annals of Glaciology, 32, 130–135.
https://doi.org/10.3189/172756401781819247
Breiman, L., Friedman, J.H, Olshen, R.A., Stone, C.J. (1998). Classification and Regression Trees. Boca, Raton, FL: CRC Press
Canadian Avalanche Association. (2014). Observation Guidelines and Recording Standards for Weather, Snowpack and Avalanches.Revelstoke, BC, Canada.
Canadian Avalanche Association. (2016). Technical Aspects of Snow Avalanche Risk Management - Resources and Guidelines for Avalanche Practicioners in Canada. Revelstoke, BC, Canada: Canadian Avalanche Association. https://doi.org/10.1354/vp.42-4-405
European Avalanche Warning Services. (n.d.). EAWS Matrix (Bavarian Matrix). Retrieved from: http://www.avalanches.org/eaws/en/main_layer.php? layer=basics&id=4
Fawcett, T. (2005). An introduction to ROC analysis. Pattern Recognition Letters, 35(6),
299–309. https://doi.org/10.1016/j.patrec.2005.10.010
Floyer, J., & McClung, D. (2003). Numerical avalanche prediction: Bear Pass, British Columbia, Canada. Cold Regions Science and Technology, 37(3), 333–342.
https://doi.org/10.1016/S0165-232X(03)00074-0
Giraud, G. (1992). MEPRA: an expert system for avalanche risk forecasting. Proceedings of the 1992 International Snow Science Workshop, Breckenridge, Colorado., 97–104.

98
Haegeli, P., Atkins, R, & Klassen, K. (2010). Auxillary material for Decision making in avalanche avalnache terrain: a field book for winter backcountry users. Revelstoke,
BC, Canada: Retrieved from http://old.avalanche.ca/cac/pre-trip-planning/decisionmaking
Haegeli, P., Falk, M., & Klassen, K. (2012). Linking avalanche problems to avalanche danger - A first statistical examination of the conceptual model of avalanche hazard. Proceedings of the 2012 International Snow Science Workshop, Ancorage, AK., 1–
7.
Haegeli, P., & McClung, D. (2004). Hierarchy theory as a conceptual framework for scale issues in avalanche forecast modeling. Annals of Glaciology, 38(1), 209-214.
doi:10.3189/172756404781815266
Haegeli, P., & McClung, D. (2007). Expanding the snow-climate classification with avalanche-relevant information: Initial description of avalanche winter regimes for southwestern Canada. Journal of Glaciology, 53(181), 266–276.
https://doi.org/10.3189/172756507782202801
Haegeli, P., & Strong-Cvetich, L. R. (in press). Using discrete choice experiments to examine the stepwise nature of avalanche risk management decisions—An example from mountain snowmobiling. Journal of Outdoor Recreation and Tourism.
https://doi.org/10.1016/J.JORT.2018.01.007
Hand, D., & Till, R. (2001). A Simple Generalisation of the Area Under the ROC Curve for Multiple Class Classification Problems. Machine Learning, 45(2), 171–186.
https://doi.org/10.1023/A:1010920819831
Harrell, F. (2011). Regression Modeling Strategies. Revista Española de Cardiología (English Edition) (Vol. 64). New York: Springer.
https://doi.org/10.1016/j.rec.2011.01.017
Hendrikx, J., Murphy, M., & Onslow, T. (2014). Classification trees as a tool for operational avalanche forecasting on the Seward Highway, Alaska. Cold Regions Science and Technology, 97, 113–120.
https://doi.org/10.1016/j.coldregions.2013.08.009
Hothorn, T., Hornik, K., Wiel, M., & Zeileis, A. (2008). Implementing a Class of Permutation Tests: The coin Package. Journal of Statistical Software, 28(8).
https://doi.org/10.18637/jss.v028.i08
Hothorn, T., Hornik, K., & Zeileis, A. (2006). Unbiased recursive partitioning: A conditional inference framework. Journal of Computational and Graphical Statistics, 15(3), 651–674. https://doi.org/10.1198/106186006X133933
Jamieson, B., Haegeli, P., & Gauthier, D. (2010). Avalanche Accidents in Canada (5th
ed.). Revelstoke, BC, Canada: Canadian Avalanche Association.
Kuhn, M., & Johnson, K. (2013). Applied Predictive Modeling.
https://doi.org/10.1007/978-1-4614-6849-3

99
Lazar, B., Trautman, S., Cooperstein, M., Greene, E., & Birkeland, K. (2016). North American Avalanche Danger Scale: Do Backcountry Forecasters Apply It Consistently?, 457–465.
Martignon, L., Katsikopouls, K., & Woike, J. (2012). Näive, Fast, and Frugal Trees for Classification. (E. P.M. Todd, G. Gigerenzer, and A.B.C.R. Group, Ed.). Oxford
University Press.
McClung, D. (2002). The elements of applied avalanche forecasting part I: The human issues. Natural Hazards, 25(2), 111–129. https://doi.org/10.1023/A:1015665432221
McClung, D., & Schaerer, P. (2006). The Avalanche Handbook (3rd ed.). Seattle, WA:
The Mountaineers.
McClung, D., & Tweedy, J. (1994). Numerical avalanche predictions: Kootenay Pass, British Columbia, Canada. Journal of Glaciology, 40(135), 350–358.
Mileti, D., & Sorensen, J. (1990). Communication of emergency public warnings: A social science perspective and state-of-the-art assessment, (January). https://doi.org/10.2172/6137387
Murphy, A. (1993). What Is a Good Forecast? An Essay on the Nature of Goodness in Weather Forecasting. Weather and Forecasting. https://doi.org/10.1175/1520-
0434(1993)008<0281:WIAGFA>2.0.CO;2
Obled, C., & Good, W. (1980). Recent Developments of Avalanche Forecasting By Discriminant Analysis Techniques: Methogological Review and Some Applications to the Parsenn Area (Davos, Switzerland). Journal of Glaciology, 25(92), 315–354.
Pozdnoukhov, A., Matasci, G., Kanevski, M., & Purves, R. (2011). Spatio-temporal avalanche forecasting with Support Vector Machines. Natural Hazards and Earth System Science, 11(2), 367–382. https://doi.org/10.5194/nhess-11-367-2011
Russell, S., & Norvig, P. (2010). Artificial Intelligence: A Modern Approach (3rd ed.).
Upper Saddle River, New Jersey: Prentice Hall.
Schirmer, M., Lehning, M., & Schweizer, J. (2009). Statistical forecasting of regional avalanche danger using simulated snow-cover data. Journal of Glaciology, 55(193),
761–768. https://doi.org/10.3189/002214309790152429
Schweizer, J., & Föhn, P. (1996). Avalanche forecasting-an expert system approach. Journal of Glaciology, 42(141), 318–332.
Shandro, B., & Haegeli, P. (2018). Characterizing the nature and variability of avalanche hazard in western Canada. Natural Hazards and Earth System Sciences, 18(4),
1141–1158. https://doi.org/10.5194/nhess-18-1141-2018

100
Statham, G. (2008). Avalanche hazard, danger and risk - a practical explanation. Proceedings of the 2008 International Snow Science Workshop, Whistler, British Columbia, 224–227.
Statham, G., Campbell, S., & Klassen, K. (2012). The AvalX public avalanche forecasting system. Proceedings of the 2012 International Snow Science Workshop, Anchorage, Alaska. (2012), 523–527.
Statham, G., Haegeli, P., Birkeland, K., Greene, E., Israelson, C., Tremper, B., … Kelly, J. (2010). The North American Public Avalanche Danger Scale. Proceedings of the 2010 International Snow Science Workshop Squaw Valley, CA, 80–87.
Statham, G., Haegeli, P., Greene, E., Birkeland, K., Israelson, C., Tremper, B., … Kelly, J. (2018). A conceptual model of avalanche hazard. Natural Hazards, 90(2), 663–
691. https://doi.org/10.1007/s11069-017-3070-5
Statham, G., Holeczi, S., & Shandro, B. (2018). Consistency and Accuracy of Public Avalanche Forecasts in Western Canada. Proceedings of the 2018 International Snow Science Workshop. https://doi.org/10.1590/S1516-18462008000300012
Techel, F., Mitterer, C., Ceaglio, E., Coléou, C., Morin, S., Rastelli, F., ... & Birkeland, K. (2018). Spatial consistency and bias in avalanche forecasts-a case study in the European Alps. Natural Hazards & Earth System Sciences, 18(10).
Wilks, D. (2006). Statistical Methods in the Atmospheric Sciences (2nd ed.). Academic
Press.

101
Appendix A. Bavarian Matrix
Figure A1: The Bavarian Matrix used for assigning avalanche danger ratings in Europe based on the distribution of hazardous sites and the probability of avalanche release.

102
Appendix B. Single Avalanche Problem Decision Trees
Figure B1: Deep persistent slab avalanche problem section of the single avalanche problem CIT mode describing the decision rules and corresponding terminal nodes based on the most common danger ratings assigned based on those rules. Red outlined terminal nodes are shared between Persistent slab, Deep persistent slab and Wind slab avalanche problems, blue dashed outlined terminal nodes are shared Persistent and Deep persistent slab problems, and purple dashed outlined terminal nodes are shared between Wind and Deep Persistent slab problems while black outlined terminal nodes are unique to Deep persistent slab avalanche problems.

103
Figure B2: Dry loose avalanche problem section of the single avalanche problem CIT model describing the decision
rules and corresponding terminal nodes based on the most common danger rating assigned based on those rules. Red outlined termianl nodes are shared between Dry loose and Wet loose avalanche problems while black outlined termianl nodes are unique to Dry loose avalanche problems.

104
Figure B3: Wet loose avalanche problem section of the single avalanche problem CIT model describing the decision rules and corresponding terminal nodes based on the most common danger rating assigned based on those rules. Red outlined termianl nodes are shared between Wet loose and Dry loose avalanche problems while black outlined termianl nodes are unique to Wet loose avalanche problems.