exploring the link between guns and violence
TRANSCRIPT

Exploring the Link between
Guns and Violence
David Hemenway
Harvard School of Public Health
Public Health Institute Webcast
July 10, 2013


Major Points • Guns have little to do with most
crimes/violence
• Strong relationship between gun
prevalence and violent death
• Currently guns create major public health
problems for the United States
• For most families, a gun in the home
increases the risk of violent death
• Unlike drugs, virtually all guns start in the
hands of “law-abiding citizens”
• Crime guns move

Focus on Data and Studies
Better data and more studies would be
extremely helpful
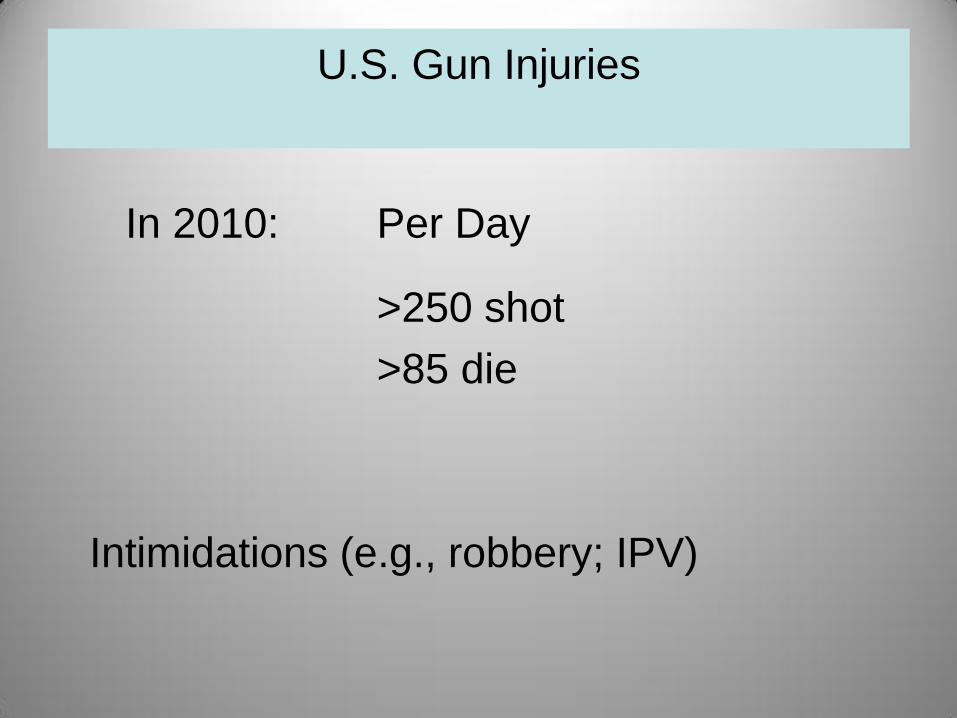
U.S. Gun Injuries
In 2010: Per Day
>250 shot
>85 die
Intimidations (e.g., robbery; IPV)

2010 Violent Deaths
Suicides 38,364
Firearm Suicides 19,392 (51%)
Homicides 16,259
Firearm Homicide 11,078 (68%)
Unintentional Firearm Deaths 606
Total Firearm Deaths 31,672

U.S. vs. Other First World
Countries
Similar Crime
Similar Violence
Similar Bullying rates
Similar Fighting/Depression rates
among school children

Percentage of People Victimized in
2000 (from comparable victimization surveys)
Nation Car Theft Burglary Robbery Sexual
Incident
Assault or
Threat
United States 0.5 1.8 0.6 1.5 3.4
17
Industrialized
Nations*
1.0 1.8 0.8 1.7 3.5
*Australia, Belgium, Canada, Catalonia (Spain), Denmark, England & Wales, Finland, France,
Japan, Netherlands, Northern Ireland, Poland, Portugal, Scotland, Sweden, Switzerland, USA
**Additional crimes: theft from car, car vandalism, motorcycle theft, bike theft, attempted
burglary, personal theft
Source: Van Kesteren et al. 2000
11
Crimes**
21.1
21.3

U.S. vs. Other First World
Countries
Differences
• More private guns
Handguns
+ Permissive gun laws
= More gun homicides
= MORE HOMICIDES

Firearm Regulations Country License
System
Storage
Regulations
Training Certificate
Needed for Purchase
Handgun Ownership
Permitted for Protection
Australia Yes Yes Yes No
Austria Yes Yes Yes
Belgium Yes Yes Yes Yes
Canada Yes Yes Yes No*
Finland Yes No No
Germany Yes Yes Yes
Japan Yes Yes Yes No
New Zealand Yes Yes Yes No
Norway Yes Yes Yes Yes
Spain Yes Yes Yes Yes
Sweden Yes Yes No
Switzerland Yes Yes No Yes
UK Yes Yes No*
United States No No Yes
Source: United Nations International Study of Firearm Regulation. New York: United Nations. 1998.
A blank indicates “No Response.” *In exceptional cases, permit may be issued.

Firearm and Non-Firearm Homicide Rates
per 100,000 Nation Firearm
Homicide
Rate
Non-Firearm
Homicide
Rate
Total
Homicide
Rate
Percentage
of
Households
with Guns
United States 3.1 1.5 4.6 35%
United
Kingdom
0.1 1.3 1.4 7%
Canada 0.6 1.2 1.8 24%
Australia 0.1 1.3 1.4 15%
New Zealand 0.2 0.9 1.1 23%
Sources: UK: UCR 2009, norc.org (2006)
UK: UNODC 2008; Small Arms Survey 2007
Canada: Beattie 2009, Royal Canadian mounted Police 2010
Australia: AU Bureau of Statistics 2009; Small Arms Survey 2007
New Zealand: UNODC 2008; Small Arms survey 2007

Homicide, Suicide, and Unintentional Gun Deaths among 5-14 year olds:
The United States vs. the Other High Income Populous Countries, early 2003
Mortality Rate
Ratio
Homicides
Gun homicides 13.2
Non-gun homicides 1.7
Total 3.4
Suicides
Gun Suicides 7.8
Non-gun Suicides 1.3
Total 1.7
Unintentional firearm deaths 10.3
Source: Richardson &
Hemenway, J Trauma 2011

Within the U.S.
Ecological Studies
Case Control Studies
Where more guns,
more homicide because more gun homicide
more suicide because more gun suicide

State Studies:
Factors held constant:
• Poverty
• Alcohol Consumption
• Unemployment
• Urbanization
• Divorce
• Education
• Violent Crime
• Major Depression
• Suicidal Thoughts
• Suicide Attempts (Hospitalized)

Violent Deaths, 2001-2007, U.S. Children (aged 5-14)
Mortality Rate Ratio
High-Gun States Low-Gun States (High Gun : Low Gun)
Total population,
5-14 Year Olds (2001-2007)
36.7 million 37.5 million
Homicides
Gun homicides
Non-gun homicides
Total
184 79 2.3
141 130 1.1
325 209 1.6
Suicides
Gun Suicides
Non-gun Suicides
Total
117 10 11.7
178 119 1.5
295 129 2.3
Unintentional firearm
deaths
112 12 9.3
The 15 States with the highest average levels of household gun ownership (based on the 2001 Behavioral Risk Factor
Surveillance System) were WY, MT, AK, SD, AR, WV, AL, ID, MS, ND, KY, WI, SC, UT, and LA. The 6 States with the
lowest average gun levels were HI, MA, RI, NJ, CT, and NY.
Source: WISQARS

Violent Deaths to US Women 2001-2007

A Gun in the Home
Suicide: a gun in the
home increases risk for:
• Gun owner
• Gun owner’s spouse
• Gun owner’s children

1. Suicides often impulsive
2. Risks Transitory
3. Guns are highly lethal

Ecological Studies (e.g. New England))
Suicide Rate 1994 – 1998
per 100,000
State Households
with Firearms
(%)
Overall Firearm Non-Firearm
ME 45% 13.5 7.9 5.6
VT 48% 12.3 7.9 4.4
NH 33% 12.1 6.8 5.3
CT 21% 8.9 3.7 5.2
RI 16% 8.3 3.0 5.3
MA 14% 8.2 2.4 5.8
NJ 12% 7.3 2.4 4.9
Source: Miller et al., J Trauma, 2004.

A gun in the home also
• Increases risk of
femicide
• Increases risk of
gun accidents

Benefits of Guns?
• Deterrence?
Where more guns, more burglaries
• Protect by thwarting crime?

Self-Defense Gun Use:
Effectiveness Percent of Victims Physically
Injured after Self-Defense (1992-
2001) NCVS
Type of Victim Action
Call Police 0.9
Run Away 1.8
Threaten/Attack w/ Gun 2.5
Struggled 4.1
All 2.4
If we are to have lots of guns
• Need better public policies
• Changes in social norms

Gun Manufacturers and Dealers
Protections • 1) No agency has oversight for safety
• 2) Almost impossible to sue
• 3) ATF hands tied in numerous ways

Restrictions on Data and
Research • NVDRS
• BRFSS
• ATF tracing data
• Very Little money for research
• (from government or foundations)
• CDC afraid to say the word “guns”

Huge Problem
Lots of Aspects
• If Not Now, When?
• Other developed nations respond to their
mass killings
