executive summary the economics of clean energy portfolios · executive summary - the economics of...
TRANSCRIPT
EXECUTIVE SUMMARY
THE ECONOMICS OF CLEAN ENERGY PORTFOLIOSHOW RENEWABLE AND DISTRIBUTED ENERGY RESOURCES ARE OUTCOMPETING AND CAN STRAND INVESTMENT IN NATURAL GAS-FIRED GENERATION
BY MARK DYSON, ALEXANDER ENGEL, AND JAMIL FARBES
RO
CKY MOUNTA
IN
INSTIT UTE
Authors Mark Dyson, Alexander Engel, and Jamil Farbes
* Authors listed alphabetically. All authors from
Rocky Mountain Institute unless otherwise noted.
ContactsMark Dyson, [email protected]
Alexander Engel, [email protected]
Suggested Citation Dyson, Mark, Jamil Farbes, and Alexander Engel. The Economics of Clean
Energy Portfolios: How Renewable and Distributed Energy Resources Are
Outcompeting and Can Strand Investment in Natural Gas-Fired Generation.
Rocky Mountain Institute, 2018.
www.rmi.org/insights/reports/economics-clean-energy-portfolios/
Editorial/Design Editorial Director: Cindie Baker
Editor: David Labrador
Creative Director: Romy Purshouse
Design: Marijke Jongbloed
Images courtesy of iStock unless otherwise noted.
AcknowledgmentsThe authors thank the following individuals/organizations for offering their
insights and perspectives on this work:
• Sonia Aggarwal, Energy Innovation
• Steven Corneli
• Jeremy Fisher, Sierra Club
• Leia Guccione, Rocky Mountain Institute
• Ray Hohenstein, Fluence
• Audrey Lee, Sunrun
• Jamie Mandel, Rocky Mountain Institute
• James Newcomb, Rocky Mountain Institute
• Ric O’Connell, GridLab
• Brendan Pierpont, Climate Policy Initiative
• Jake Young, Stanford University
AUTHORS & ACKNOWLEDGMENTS

ABOUT US
About Rocky Mountain InstituteRocky Mountain Institute (RMI)—an independent nonprofit founded in
1982—transforms global energy use to create a clean, prosperous, and
secure low-carbon future. It engages businesses, communities, institutions,
and entrepreneurs to accelerate the adoption of market-based solutions
that cost-effectively shift from fossil fuels to efficiency and renewables.
In 2014, RMI merged with Carbon War Room (CWR), whose business-led
market interventions advance a low-carbon economy. The combined
organization has offices in Basalt and Boulder, Colorado; New York City;
Washington, D.C.; and Beijing.
RO
C
KY MOUNTAIN
INSTIT UTE

EXECUTIVE SUMMARY01

EXECUTIVE SUMMARY
EXECUTIVE SUMMARY - THE ECONOMICS OF CLEAN ENERGY PORTFOLIOS | 5 RO
C
KY MOUNTAIN
INSTIT UTE
The current rush to gas in the US electricity system could lock in $1 trillion of cost through 2030The US power grid is the largest, most complicated, most expensive, and
likely the oldest continually operating machine in the world, but it is not aging
gracefully. The grid has fueled the US economy for over a century, but
requires significant reinvestment to maintain the same level of cost-effective,
reliable service for the next century. In particular, the fleet of thermal power
plants that convert fuel to electricity is aging, with over half of thermal capacity
more than 30 years old and expected to reach retirement age by 2030.
Recent advances in power plant technology and the currently low price of
natural gas mean that new natural gas-fired turbines are more efficient and
less costly to run than aging power plants. This has led to a “rush to gas,”
with utilities and independent power plant developers having announced
plans to invest over $110 billion in new gas-fired power plants through
2025. Extrapolating this trend to 2030 suggests that over $500 billion will
be required to replace all retiring power plants with new natural gas-fired
capacity. This will lock in another $480 billion in fuel costs and 5 billion tons
of CO2 emissions through 2030, and up to 16 billion tons through 2050.
50% of US thermal power plant capacity is likely to retire by 2030
$520 BILLION is required for natural gas-fired power plants to replace retiring capacity
$480 BILLION is required for fuel to run those power plants through 2030
EXECUTIVE SUMMARY - THE ECONOMICS OF CLEAN ENERGY PORTFOLIOS | 6
EXECUTIVE SUMMARY R
OC
KY MOUNTAIN
INSTIT UTE
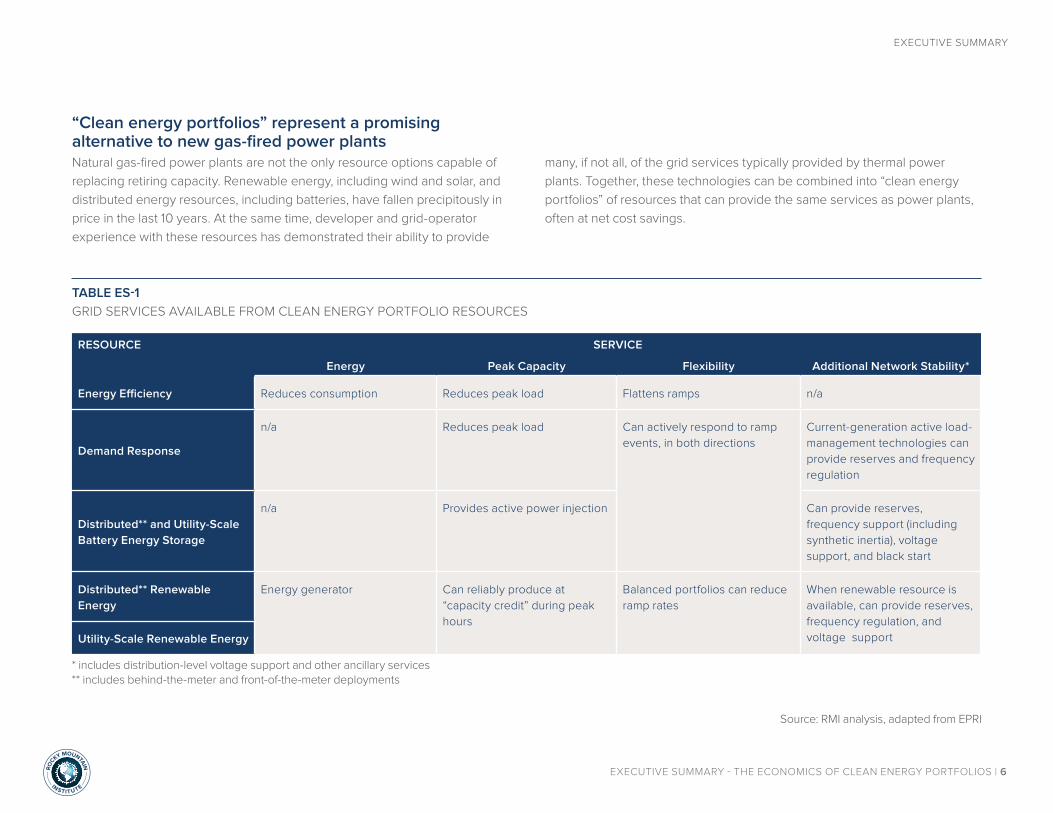
TABLE ES-1
GRID SERVICES AVAILABLE FROM CLEAN ENERGY PORTFOLIO RESOURCES
RESOURCE SERVICE
Energy Peak Capacity Flexibility Additional Network Stability*
Energy Efficiency Reduces consumption Reduces peak load Flattens ramps n/a
Demand Response
n/a Reduces peak load Can actively respond to ramp
events, in both directions
Current-generation active load-
management technologies can
provide reserves and frequency
regulation
Distributed** and Utility-Scale
Battery Energy Storage
n/a Provides active power injection Can provide reserves,
frequency support (including
synthetic inertia), voltage
support, and black start
Distributed** Renewable
Energy
Energy generator Can reliably produce at
“capacity credit” during peak
hours
Balanced portfolios can reduce
ramp rates
When renewable resource is
available, can provide reserves,
frequency regulation, and
voltage supportUtility-Scale Renewable Energy
“Clean energy portfolios” represent a promising alternative to new gas-fired power plantsNatural gas-fired power plants are not the only resource options capable of
replacing retiring capacity. Renewable energy, including wind and solar, and
distributed energy resources, including batteries, have fallen precipitously in
price in the last 10 years. At the same time, developer and grid-operator
experience with these resources has demonstrated their ability to provide
many, if not all, of the grid services typically provided by thermal power
plants. Together, these technologies can be combined into “clean energy
portfolios” of resources that can provide the same services as power plants,
often at net cost savings.
* includes distribution-level voltage support and other ancillary services** includes behind-the-meter and front-of-the-meter deployments
Source: RMI analysis, adapted from EPRI

Clean energy portfolios are cost-competitive with proposed natural gas-fired power plants in four diverse case studies from across the USThis study compares the costs of four natural gas-fired power plants
currently proposed for construction across the US against optimized,
region-specific clean energy portfolios of renewable energy and
distributed energy resources (DERs) that can provide the same services.
We analyzed two announced combined-cycle gas turbine (CCGT) power
plants, planned for high capacity-factor operation, and two announced
combustion turbine (CT) power plants, planned for peak-hour operation.
EXECUTIVE SUMMARY - THE ECONOMICS OF CLEAN ENERGY PORTFOLIOS | 7
EXECUTIVE SUMMARY R
OC
KY MOUNTAIN
INSTIT UTE
FIGURE ES-1
NET COST OF CLEAN ENERGY PORTFOLIOS ACROSS FOUR CASE STUDIES, RELATIVE TO PROPOSED GAS-FIRED POWER PLANTS
Mid-Atlantic Proposed CT
Texas Proposed CT
100%
80%
60%
40%
20%
0%
Florida Proposed CCGT
West Coast Proposed CCGT
8%
60%
47%
6%
In only one case did we find that the net cost of the optimized clean energy
portfolio is slightly (~6%) greater than the proposed power plant; in the
other three cases, an optimized clean energy portfolio would cost 5–60%
less than the announced power plant. Factoring in expected further cost
reductions in distributed solar and/or a $7.50/ton price on CO2 emissions,
all four cases show that an optimized clean energy portfolio is more
cost-effective and lower in risk than the proposed gas plant.

EXECUTIVE SUMMARY - THE ECONOMICS OF CLEAN ENERGY PORTFOLIOS | 8
EXECUTIVE SUMMARY R
OC
KY MOUNTAIN
INSTIT UTE
Low-cost clean energy portfolios threaten to strand investments in natural gas-fired power plantsIn addition to competing with proposed gas-fired power plants on a levelized
cost basis, clean energy portfolios will also increasingly threaten the
profitability of existing power plants. Comparing the future operating costs of
the two proposed CCGTs in this study against new-build clean energy
portfolios, we find that, depending on gas price forecasts, the clean
energy portfolio’s levelized, all-in costs will fall below marginal operating costs
of the CCGTs well within the planned operating lifetime of the proposed
plants. In other words, the same technological innovations and price declines
in renewable energy that have already contributed to early coal-plant
retirement are now threatening to strand investments in natural gas.
FIGURE ES-2
COMPARISON OF COMBINED CYCLE OPERATING COSTS VS. CLEAN ENERGY PORTFOLIO LEVELIZED COSTS, 2020–2040
45
40
35
30
25
20
15
10
5
0
2020 2025 2030 2035 2040
CCGT OpEx with $5.00 Gas
CCGT OpEx with $3.00 Gas
Florida Portfolio, Levelized CostWest Coast Portfolio,
Levelized Cost
⊲ Optimized clean energy portfolios, depending on location and
technology mix, will cost less to build than CCGTs cost to run by
2026 (assuming $5/MMBtu gas) or ~2040 (assuming $3/MMBtu gas)
$/M
Wh
(2
017
re
al)
⊲ Assuming gas prices between $3–5/MMBtu, combined-cycle
operating costs will vary between $23/MWh and $36/MWh
EXECUTIVE SUMMARY - THE ECONOMICS OF CLEAN ENERGY PORTFOLIOS | 9
EXECUTIVE SUMMARY R
OC
KY MOUNTAIN
INSTIT UTE
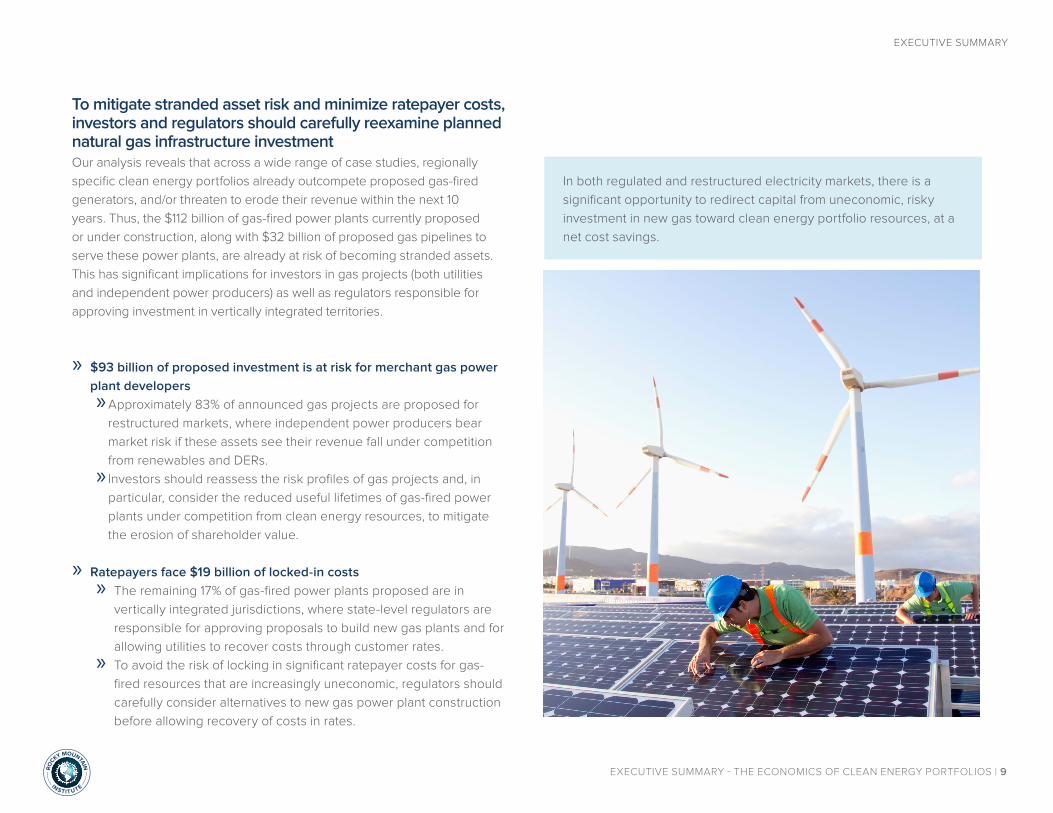
To mitigate stranded asset risk and minimize ratepayer costs, investors and regulators should carefully reexamine planned natural gas infrastructure investment Our analysis reveals that across a wide range of case studies, regionally
specific clean energy portfolios already outcompete proposed gas-fired
generators, and/or threaten to erode their revenue within the next 10
years. Thus, the $112 billion of gas-fired power plants currently proposed
or under construction, along with $32 billion of proposed gas pipelines to
serve these power plants, are already at risk of becoming stranded assets.
This has significant implications for investors in gas projects (both utilities
and independent power producers) as well as regulators responsible for
approving investment in vertically integrated territories.
In both regulated and restructured electricity markets, there is a
significant opportunity to redirect capital from uneconomic, risky
investment in new gas toward clean energy portfolio resources, at a
net cost savings.
» $93 billion of proposed investment is at risk for merchant gas power
plant developers
»Approximately 83% of announced gas projects are proposed for
restructured markets, where independent power producers bear
market risk if these assets see their revenue fall under competition
from renewables and DERs.
» Investors should reassess the risk profiles of gas projects and, in
particular, consider the reduced useful lifetimes of gas-fired power
plants under competition from clean energy resources, to mitigate
the erosion of shareholder value.
» Ratepayers face $19 billion of locked-in costs
» The remaining 17% of gas-fired power plants proposed are in
vertically integrated jurisdictions, where state-level regulators are
responsible for approving proposals to build new gas plants and for
allowing utilities to recover costs through customer rates.
» To avoid the risk of locking in significant ratepayer costs for gas-
fired resources that are increasingly uneconomic, regulators should
carefully consider alternatives to new gas power plant construction
before allowing recovery of costs in rates.
EXECUTIVE SUMMARY - THE ECONOMICS OF CLEAN ENERGY PORTFOLIOS | 10
EXECUTIVE SUMMARY R
OC
KY MOUNTAIN
INSTIT UTE
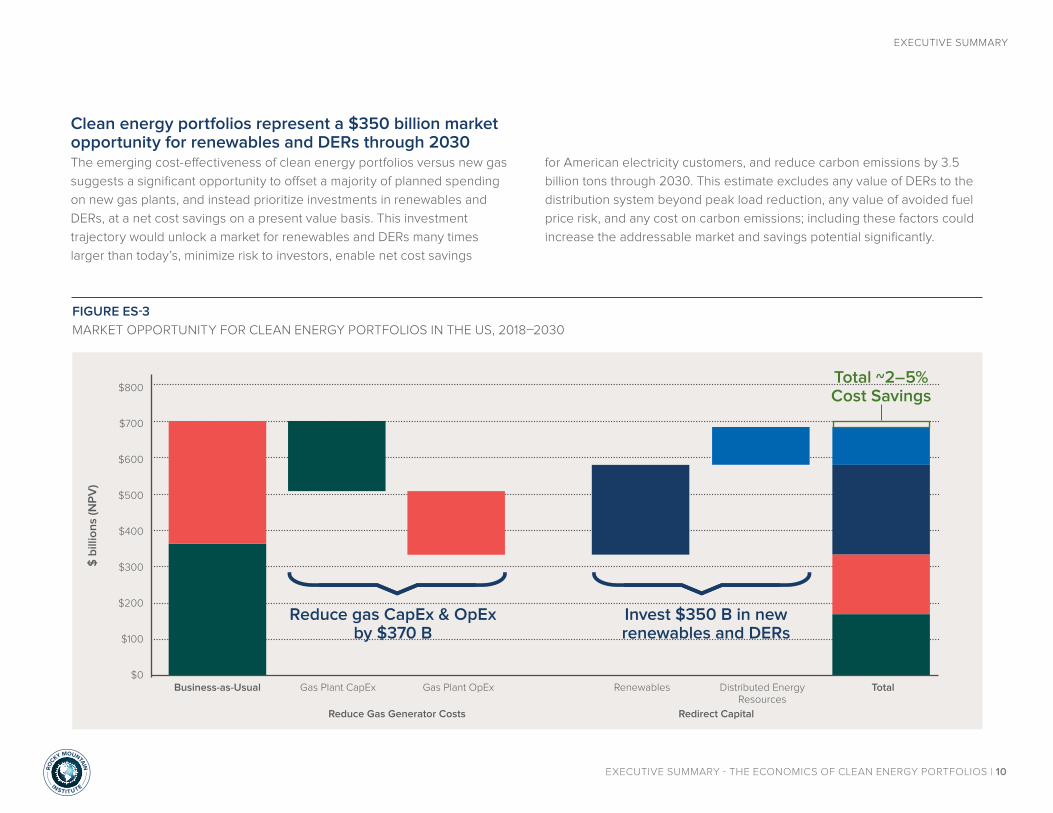
Clean energy portfolios represent a $350 billion market opportunity for renewables and DERs through 2030The emerging cost-effectiveness of clean energy portfolios versus new gas
suggests a significant opportunity to offset a majority of planned spending
on new gas plants, and instead prioritize investments in renewables and
DERs, at a net cost savings on a present value basis. This investment
trajectory would unlock a market for renewables and DERs many times
larger than today’s, minimize risk to investors, enable net cost savings
FIGURE ES-3
MARKET OPPORTUNITY FOR CLEAN ENERGY PORTFOLIOS IN THE US, 2018–2030
$800
$700
$600
$500
$400
$300
$200
$100
$0
$ b
illio
ns
(NP
V)
Business-as-Usual Gas Plant CapEx Gas Plant OpEx Renewables Distributed Energy Resources
Total
Reduce Gas Generator Costs Redirect Capital
Reduce gas CapEx & OpEx by $370 B
Invest $350 B in new renewables and DERs
for American electricity customers, and reduce carbon emissions by 3.5
billion tons through 2030. This estimate excludes any value of DERs to the
distribution system beyond peak load reduction, any value of avoided fuel
price risk, and any cost on carbon emissions; including these factors could
increase the addressable market and savings potential significantly.
Total ~2–5% Cost Savings

EXECUTIVE SUMMARY - THE ECONOMICS OF CLEAN ENERGY PORTFOLIOS | 11
EXECUTIVE SUMMARY R
OC
KY MOUNTAIN
INSTIT UTE
Current regulatory incentives, market rules, and resource planning processes limit the ability to capture the full value offered by clean energy portfoliosClean energy portfolios represent a cost-effective alternative to investment
in new gas-fired power plants, with a potentially accessible market in
the hundreds of billions of dollars through 2030, while avoiding the fuel
price risks and CO2 emissions associated with new natural gas power
RECOMMENDATIONS
For regulators and market operators: Study
alternatives and level the playing field.
• Seek broad input: Solicit input from alternative-
solution providers as part of the approval
process for proposed power plant investments
• Align incentives: In states with rate-
based generation, adjust utility earnings
incentives to put clean energy portfolios
on a level playing field with traditional
capital investments by rewarding least-cost
resources more effectively than does the
traditional return-on-capital business model
• Open up market participation: In restructured
markets, allow participation of distributed
resources in wholesale market products
historically designed with thermal generators
in mind
For utilities: Revolutionize resource planning
and procurement processes.
• Update planning: Accurately reflect system
needs and the capabilities and potential of
clean energy portfolio technologies, including
distributed and demand-side options, to meet
those needs
• Scale deployment quickly: Limit pilots of
already-proven technology, and move quickly
toward scaled deployment
• Procure solutions: Request technology-
neutral solutions from the market, and move
toward standard tariff- or market-based
incentive structures to procure them
For technology providers and project developers:
Offer holistic, low-cost solutions to meet grid needs.
• Integrate multiple technologies: Where
utilities seek or markets support turnkey
alternatives to gas plants, partner across
vendors to optimize bids and deployment
accordingly
• Drive down costs: Leverage technology to
reduce the costs of system design, customer
acquisition, operational integration, and other
“soft” costs
• Generate confidence: Work with planners
and system operators to characterize discrete
grid service needs, including measurement
and verification, and validate performance
characteristics of portfolio technologies
plants. However, the industry is just beginning to recognize and capture
the benefits of these resources, and execution of clean energy portfolio
projects remains relatively low compared to their potential. Coordinated
action by several stakeholder groups can accelerate adoption.

RO
C
KY MOUNTAIN
INSTIT UTE
22830 Two Rivers Road
Basalt, CO | 81621 USA
www.rmi.org
© May 2018 RMI. All rights reserved. Rocky Mountain Institute® and RMI® are registered trademarks.