2017 western asset enhanced cash sma portfolios … · western asset enhanced cash sma portfolios...
TRANSCRIPT
1Q 2018 Separately Managed Accounts
WESTERN ASSETENHANCED CASHSMA PORTFOLIOS
INVESTMENT PRODUCTS: NOT FDIC INSURED • NO BANK GUARANTEE • MAY LOSE VALUE
Introduction | Legg Mason
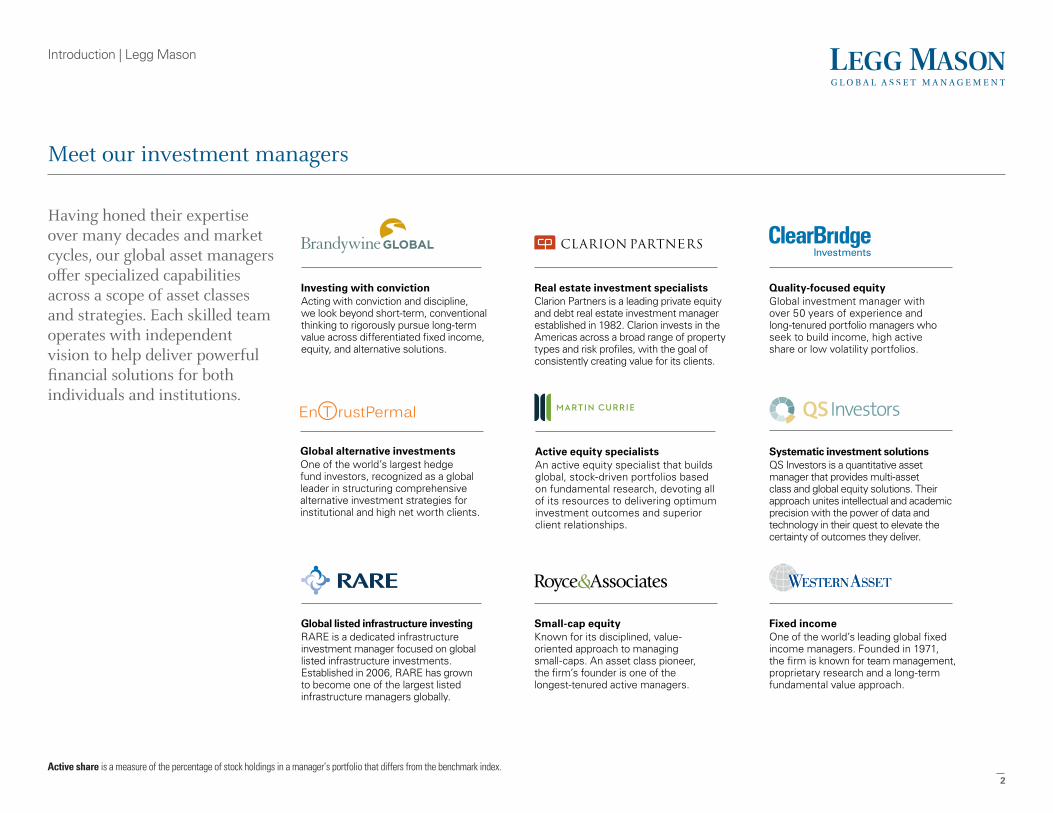
Meet our investment managers
Having honed their expertiseover many decades and marketcycles, our global asset managersoffer specialized capabilitiesacross a scope of asset classesand strategies. Each skilled teamoperates with independentvision to help deliver powerfulfinancial solutions for bothindividuals and institutions.
Global alternative investments One of the world’s largest hedge fund investors, recognized as a global leader in structuring comprehensive alternative investment strategies for institutional and high net worth clients.
Active equity specialists An active equity specialist that builds global, stock-driven portfolios based on fundamental research, devoting all of its resources to delivering optimum investment outcomes and superior client relationships.
Quality-focused equity Global investment manager with over 50 years of experience and long-tenured portfolio managers who seek to build income, high active share or low volatility portfolios.
Investing with conviction Acting with conviction and discipline, we look beyond short-term, conventional thinking to rigorously pursue long-term value across differentiated fixed income, equity, and alternative solutions.
Systematic investment solutions QS Investors is a quantitative asset manager that provides multi-asset class and global equity solutions. Their approach unites intellectual and academic precision with the power of data and technology in their quest to elevate the certainty of outcomes they deliver.
Small-cap equityKnown for its disciplined, value-oriented approach to managing small-caps. An asset class pioneer, the firm’s founder is one of the longest-tenured active managers.
Global listed infrastructure investing RARE is a dedicated infrastructure investment manager focused on global listed infrastructure investments. Established in 2006, RARE has grown to become one of the largest listed infrastructure managers globally.
Fixed incomeOne of the world’s leading global fixed income managers. Founded in 1971, the firm is known for team management, proprietary research and a long-term fundamental value approach.
Real estate investment specialists Clarion Partners is a leading private equity and debt real estate investment manager established in 1982. Clarion invests in the Americas across a broad range of property types and risk profiles, with the goal of consistently creating value for its clients.
Active share is a measure of the percentage of stock holdings in a manager’s portfolio that differs from the benchmark index.
.
2
Introduction | Western Asset
Western Asset Management Approach and Philosophy
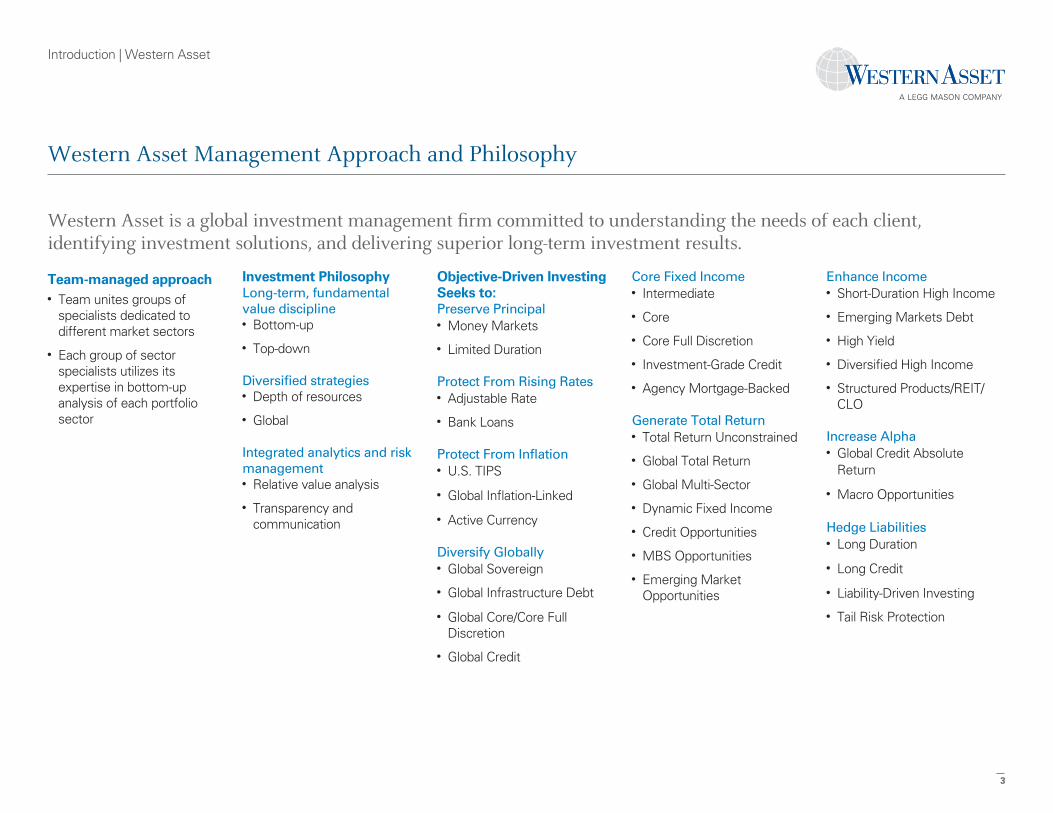
Western Asset is a global investment management firm committed to understanding the needs of each client,identifying investment solutions, and delivering superior long-term investment results.
Team-managed approach• Team unites groups of
specialists dedicated todifferent market sectors
• Each group of sectorspecialists utilizes itsexpertise in bottom-upanalysis of each portfoliosector
Investment PhilosophyLong-term, fundamentalvalue discipline• Bottom-up
• Top-down Diversified strategies• Depth of resources
• Global Integrated analytics and riskmanagement• Relative value analysis
• Transparency andcommunication
Objective-Driven InvestingSeeks to:Preserve Principal§• Money Markets
• Limited Duration Protect From Rising Rates§• Adjustable Rate
• Bank Loans Protect From Inflation§• U.S. TIPS§
• Global Inflation-Linked§
• Active Currency Diversify Globally§• Global Sovereign
• Global Infrastructure Debt§
• Global Core/Core FullDiscretion
• Global Credit
Core Fixed Income§• Intermediate
• Core
• Core Full Discretion
• Investment-Grade Credit
• Agency Mortgage-Backed Generate Total Return§• Total Return Unconstrained
• Global Total Return
• Global Multi-Sector
• Dynamic Fixed Income
• Credit Opportunities
• MBS Opportunities
• Emerging MarketOpportunities
Enhance Income§• Short-Duration High Income
• Emerging Markets Debt
• High Yield
• Diversified High Income
• Structured Products/REIT/CLO
Increase Alpha§• Global Credit Absolute
Return§
• Macro Opportunities§
Hedge Liabilities§• Long Duration§
• Long Credit§
• Liability-Driven Investing
• Tail Risk Protection§
.
3
Your investment portfolio | Enhanced Cash SMA
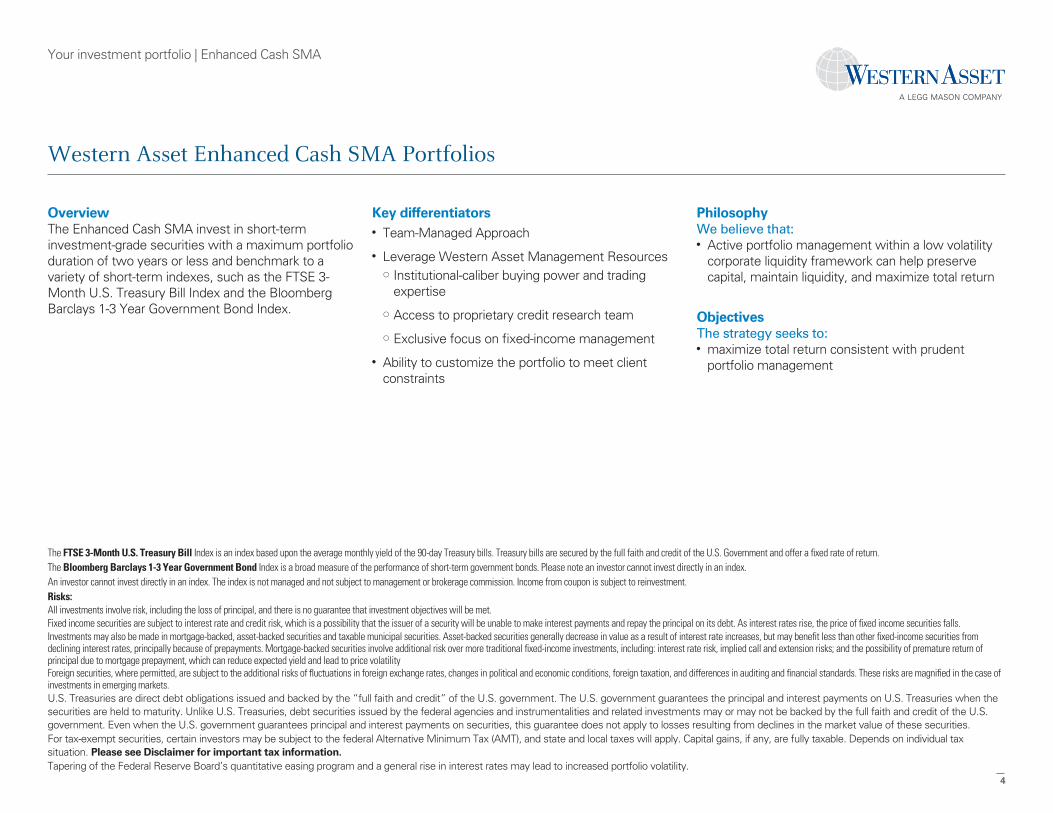
Western Asset Enhanced Cash SMA Portfolios
OverviewThe Enhanced Cash SMA invest in short-terminvestment-grade securities with a maximum portfolioduration of two years or less and benchmark to avariety of short-term indexes, such as the FTSE 3-Month U.S. Treasury Bill Index and the BloombergBarclays 1-3 Year Government Bond Index.
Key differentiators• Team-Managed Approach
• Leverage Western Asset Management Resources Institutional-caliber buying power and trading
expertise
Access to proprietary credit research team
Exclusive focus on fixed-income management
• Ability to customize the portfolio to meet clientconstraints
PhilosophyWe believe that:• Active portfolio management within a low volatility
corporate liquidity framework can help preservecapital, maintain liquidity, and maximize total return
ObjectivesThe strategy seeks to:• maximize total return consistent with prudent
portfolio management
The FTSE 3-Month U.S. Treasury Bill Index is an index based upon the average monthly yield of the 90-day Treasury bills. Treasury bills are secured by the full faith and credit of the U.S. Government and offer a fixed rate of return.The Bloomberg Barclays 1-3 Year Government Bond Index is a broad measure of the performance of short-term government bonds. Please note an investor cannot invest directly in an index.An investor cannot invest directly in an index. The index is not managed and not subject to management or brokerage commission. Income from coupon is subject to reinvestment.Risks:§All investments involve risk, including the loss of principal, and there is no guarantee that investment objectives will be met.§Fixed income securities are subject to interest rate and credit risk, which is a possibility that the issuer of a security will be unable to make interest payments and repay the principal on its debt. As interest rates rise, the price of fixed income securities falls.§Investments may also be made in mortgage-backed, asset-backed securities and taxable municipal securities. Asset-backed securities generally decrease in value as a result of interest rate increases, but may benefit less than other fixed-income securities fromdeclining interest rates, principally because of prepayments. Mortgage-backed securities involve additional risk over more traditional fixed-income investments, including: interest rate risk, implied call and extension risks; and the possibility of premature return ofprincipal due to mortgage prepayment, which can reduce expected yield and lead to price volatility§Foreign securities, where permitted, are subject to the additional risks of fluctuations in foreign exchange rates, changes in political and economic conditions, foreign taxation, and differences in auditing and financial standards. These risks are magnified in the case ofinvestments in emerging markets.§U.S. Treasuries are direct debt obligations issued and backed by the “full faith and credit” of the U.S. government. The U.S. government guarantees the principal and interest payments on U.S. Treasuries when thesecurities are held to maturity. Unlike U.S. Treasuries, debt securities issued by the federal agencies and instrumentalities and related investments may or may not be backed by the full faith and credit of the U.S.government. Even when the U.S. government guarantees principal and interest payments on securities, this guarantee does not apply to losses resulting from declines in the market value of these securities.§For tax-exempt securities, certain investors may be subject to the federal Alternative Minimum Tax (AMT), and state and local taxes will apply. Capital gains, if any, are fully taxable. Depends on individual taxsituation. Please see Disclaimer for important tax information.§Tapering of the Federal Reserve Board’s quantitative easing program and a general rise in interest rates may lead to increased portfolio volatility.
.
4
Your investment portfolio | Enhanced Cash SMA
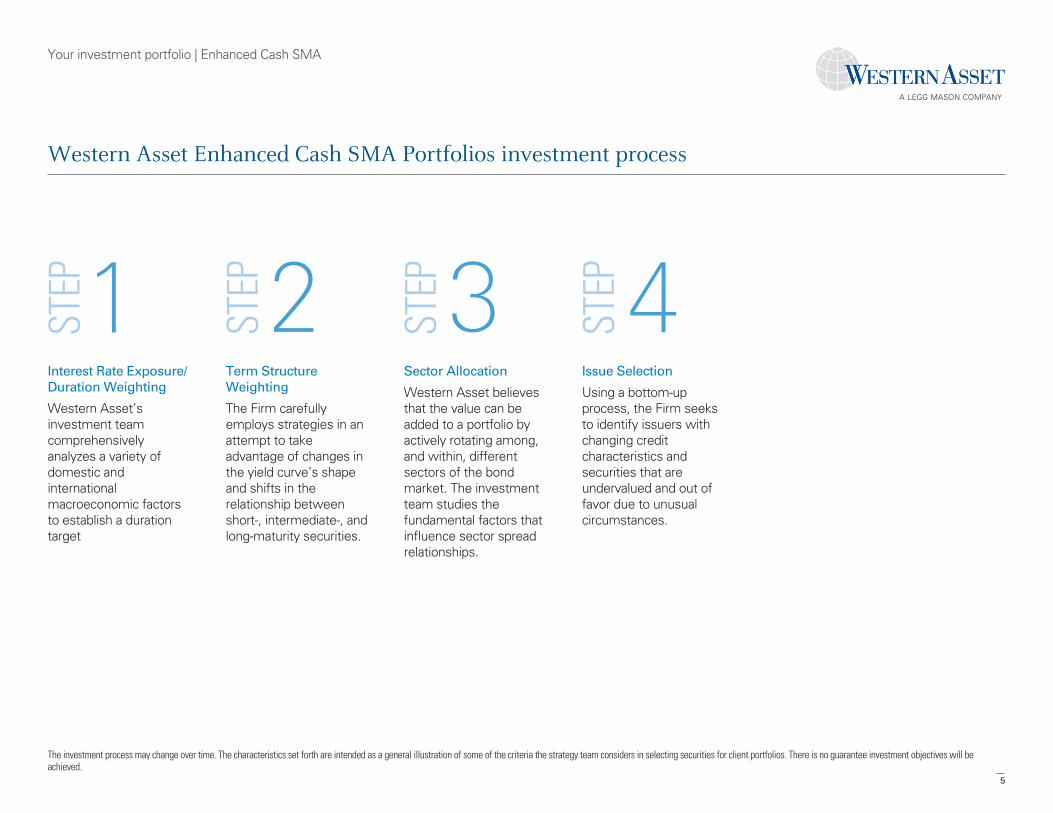
Western Asset Enhanced Cash SMA Portfolios investment process
Interest Rate Exposure/Duration Weighting
Western Asset’sinvestment teamcomprehensivelyanalyzes a variety ofdomestic andinternationalmacroeconomic factorsto establish a durationtarget
Term StructureWeighting
The Firm carefullyemploys strategies in anattempt to takeadvantage of changes inthe yield curve’s shapeand shifts in therelationship betweenshort-, intermediate-, andlong-maturity securities.
Sector Allocation
Western Asset believesthat the value can beadded to a portfolio byactively rotating among,and within, differentsectors of the bondmarket. The investmentteam studies thefundamental factors thatinfluence sector spreadrelationships.
Issue Selection
Using a bottom-upprocess, the Firm seeksto identify issuers withchanging creditcharacteristics andsecurities that areundervalued and out offavor due to unusualcircumstances.
The investment process may change over time. The characteristics set forth are intended as a general illustration of some of the criteria the strategy team considers in selecting securities for client portfolios. There is no guarantee investment objectives will beachieved.
.
5
Your investment portfolio | Enhanced Cash SMA
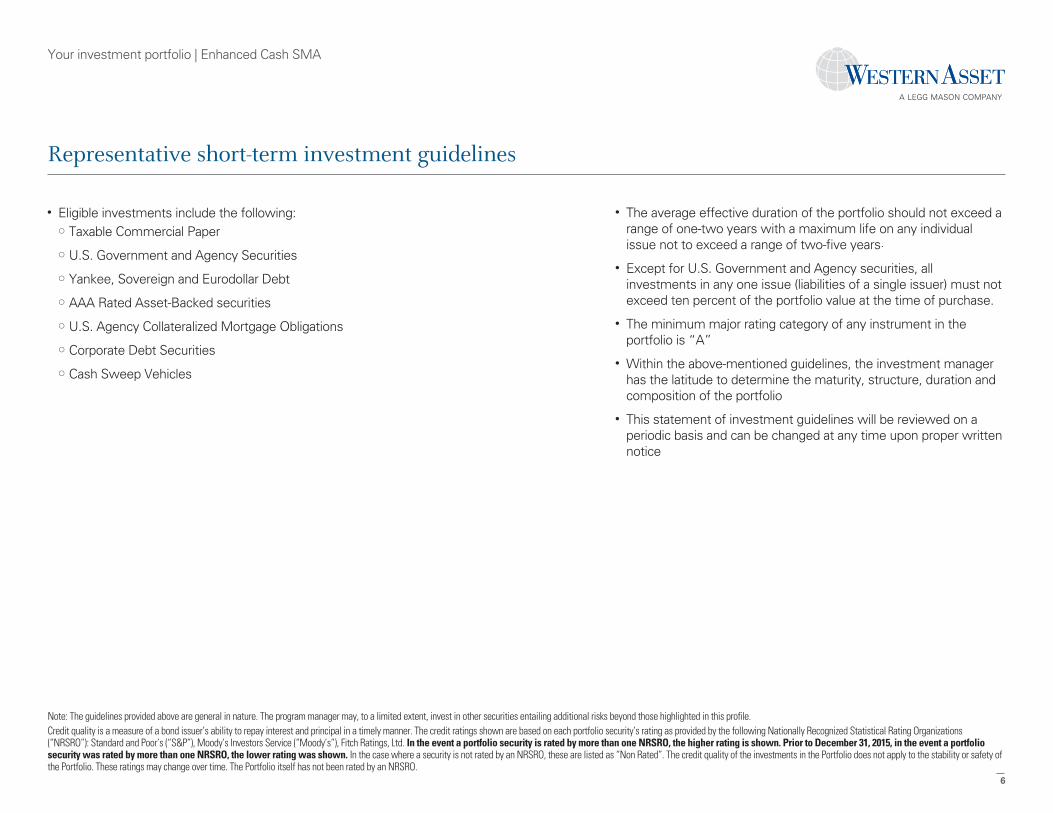
Representative short-term investment guidelines
• Eligible investments include the following: Taxable Commercial Paper
U.S. Government and Agency Securities
Yankee, Sovereign and Eurodollar Debt
AAA Rated Asset-Backed securities
U.S. Agency Collateralized Mortgage Obligations
Corporate Debt Securities
Cash Sweep Vehicles
• The average effective duration of the portfolio should not exceed arange of one-two years with a maximum life on any individualissue not to exceed a range of two-five years.
• Except for U.S. Government and Agency securities, allinvestments in any one issue (liabilities of a single issuer) must notexceed ten percent of the portfolio value at the time of purchase.
• The minimum major rating category of any instrument in theportfolio is “A”
• Within the above-mentioned guidelines, the investment managerhas the latitude to determine the maturity, structure, duration andcomposition of the portfolio
• This statement of investment guidelines will be reviewed on aperiodic basis and can be changed at any time upon proper writtennotice
Note: The guidelines provided above are general in nature. The program manager may, to a limited extent, invest in other securities entailing additional risks beyond those highlighted in this profile.Credit quality is a measure of a bond issuer’s ability to repay interest and principal in a timely manner. The credit ratings shown are based on each portfolio security’s rating as provided by the following Nationally Recognized Statistical Rating Organizations(“NRSRO”): Standard and Poor’s (“S&P”), Moody’s Investors Service (“Moody’s”), Fitch Ratings, Ltd. In the event a portfolio security is rated by more than one NRSRO, the higher rating is shown. Prior to December 31, 2015, in the event a portfoliosecurity was rated by more than one NRSRO, the lower rating was shown. In the case where a security is not rated by an NRSRO, these are listed as “Non Rated”. The credit quality of the investments in the Portfolio does not apply to the stability or safety ofthe Portfolio. These ratings may change over time. The Portfolio itself has not been rated by an NRSRO.
.
6
Strategy characteristics & performance | Fixed Income Portfolio characteristics
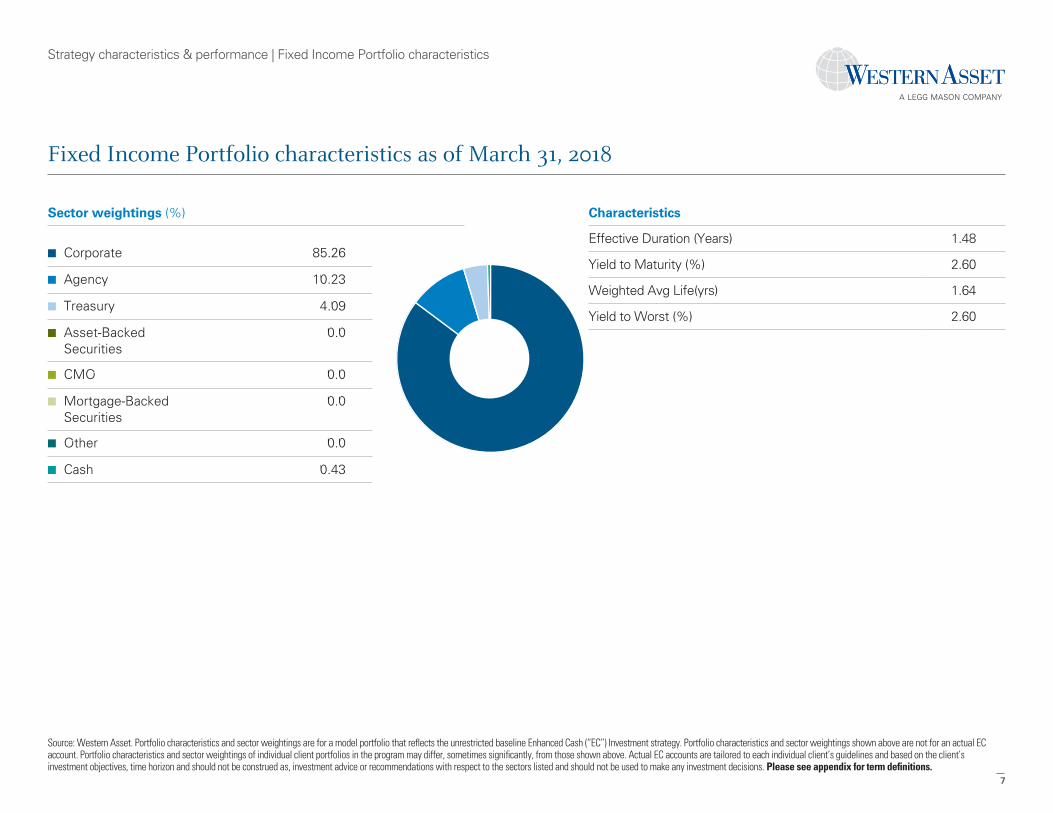
Fixed Income Portfolio characteristics as of March 31, 2018
Sector weightings (%)
Corporate 85.26Agency 10.23Treasury 4.09Asset-BackedSecurities
0.0
CMO 0.0Mortgage-BackedSecurities
0.0
Other 0.0Cash 0.43
Corporate 85.26
Agency 10.23
Treasury 4.09
Asset-BackedSecurities
0.0
CMO 0.0
Mortgage-BackedSecurities
0.0
Other 0.0
Cash 0.43
Characteristics
Effective Duration (Years) 1.48
Yield to Maturity (%) 2.60
Weighted Avg Life(yrs) 1.64
Yield to Worst (%) 2.60
Source: Western Asset. Portfolio characteristics and sector weightings are for a model portfolio that reflects the unrestricted baseline Enhanced Cash (“EC”) Investment strategy. Portfolio characteristics and sector weightings shown above are not for an actual ECaccount. Portfolio characteristics and sector weightings of individual client portfolios in the program may differ, sometimes significantly, from those shown above. Actual EC accounts are tailored to each individual client’s guidelines and based on the client’sinvestment objectives, time horizon and should not be construed as, investment advice or recommendations with respect to the sectors listed and should not be used to make any investment decisions. Please see appendix for term definitions.
.
7
Strategy characteristics & performance | Performance
Performance
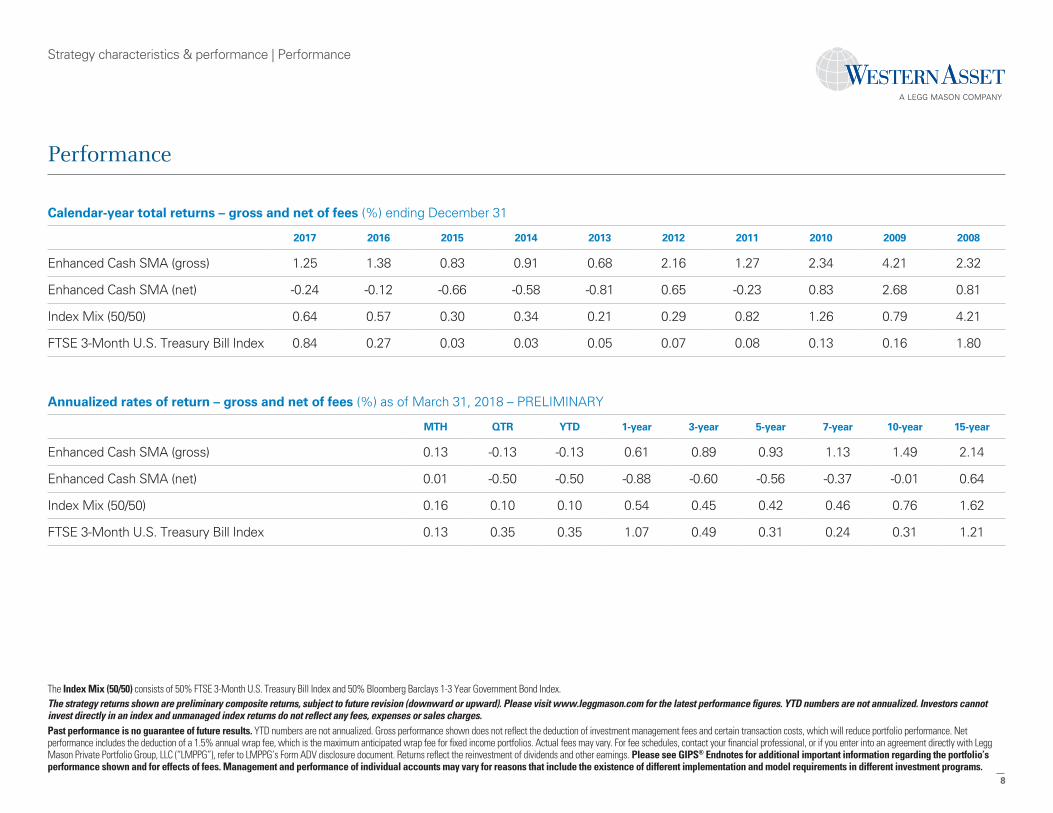
Calendar-year total returns – gross and net of fees (%) ending December 31
2017 2016 2015 2014 2013 2012 2011 2010 2009 2008
Enhanced Cash SMA (gross) 1.25 1.38 0.83 0.91 0.68 2.16 1.27 2.34 4.21 2.32
Enhanced Cash SMA (net) -0.24 -0.12 -0.66 -0.58 -0.81 0.65 -0.23 0.83 2.68 0.81
Index Mix (50/50) 0.64 0.57 0.30 0.34 0.21 0.29 0.82 1.26 0.79 4.21
FTSE 3-Month U.S. Treasury Bill Index 0.84 0.27 0.03 0.03 0.05 0.07 0.08 0.13 0.16 1.80
Annualized rates of return – gross and net of fees (%) as of March 31, 2018 – PRELIMINARY
MTH QTR YTD 1-year 3-year 5-year 7-year 10-year 15-year
Enhanced Cash SMA (gross) 0.13 -0.13 -0.13 0.61 0.89 0.93 1.13 1.49 2.14
Enhanced Cash SMA (net) 0.01 -0.50 -0.50 -0.88 -0.60 -0.56 -0.37 -0.01 0.64
Index Mix (50/50) 0.16 0.10 0.10 0.54 0.45 0.42 0.46 0.76 1.62
FTSE 3-Month U.S. Treasury Bill Index 0.13 0.35 0.35 1.07 0.49 0.31 0.24 0.31 1.21
The Index Mix (50/50) consists of 50% FTSE 3-Month U.S. Treasury Bill Index and 50% Bloomberg Barclays 1-3 Year Government Bond Index.The strategy returns shown are preliminary composite returns, subject to future revision (downward or upward). Please visit www.leggmason.com for the latest performance figures. YTD numbers are not annualized. Investors cannotinvest directly in an index and unmanaged index returns do not reflect any fees, expenses or sales charges.§Past performance is no guarantee of future results. YTD numbers are not annualized. Gross performance shown does not reflect the deduction of investment management fees and certain transaction costs, which will reduce portfolio performance. Netperformance includes the deduction of a 1.5% annual wrap fee, which is the maximum anticipated wrap fee for fixed income portfolios. Actual fees may vary. For fee schedules, contact your financial professional, or if you enter into an agreement directly with LeggMason Private Portfolio Group, LLC (“LMPPG”), refer to LMPPG’s Form ADV disclosure document. Returns reflect the reinvestment of dividends and other earnings. Please see GIPS® Endnotes for additional important information regarding the portfolio’sperformance shown and for effects of fees. Management and performance of individual accounts may vary for reasons that include the existence of different implementation and model requirements in different investment programs.
.
8
Strategy characteristics & performance | Performance
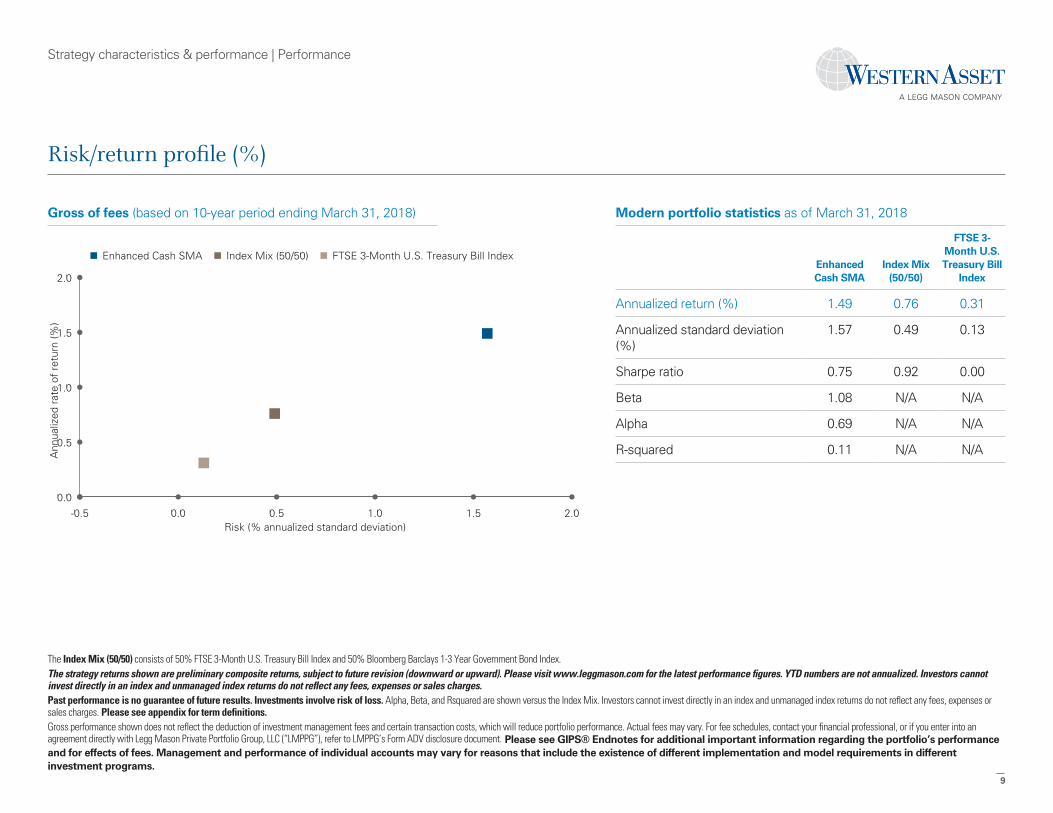
Risk/return profile (%)
Gross of fees (based on 10-year period ending March 31, 2018)
-0.5 0.0 0.5 1.0 1.5 2.00.0
0.5
1.0
1.5
2.0
Enhanced Cash SMA Index Mix (50/50) FTSE 3-Month U.S. Treasury Bill Index
Ann
ualiz
ed r
ate
of r
etur
n (%
)
Risk (% annualized standard deviation)
Modern portfolio statistics as of March 31, 2018
EnhancedCash SMA
Index Mix(50/50)
FTSE 3-Month U.S.Treasury Bill
Index
Annualized return (%) 1.49 0.76 0.31
Annualized standard deviation(%)
1.57 0.49 0.13
Sharpe ratio 0.75 0.92 0.00
Beta 1.08 N/A N/A
Alpha 0.69 N/A N/A
R-squared 0.11 N/A N/A
The Index Mix (50/50) consists of 50% FTSE 3-Month U.S. Treasury Bill Index and 50% Bloomberg Barclays 1-3 Year Government Bond Index.The strategy returns shown are preliminary composite returns, subject to future revision (downward or upward). Please visit www.leggmason.com for the latest performance figures. YTD numbers are not annualized. Investors cannotinvest directly in an index and unmanaged index returns do not reflect any fees, expenses or sales charges.Past performance is no guarantee of future results. Investments involve risk of loss. Alpha, Beta, and Rsquared are shown versus the Index Mix. Investors cannot invest directly in an index and unmanaged index returns do not reflect any fees, expenses orsales charges. Please see appendix for term definitions.Gross performance shown does not reflect the deduction of investment management fees and certain transaction costs, which will reduce portfolio performance. Actual fees may vary. For fee schedules, contact your financial professional, or if you enter into anagreement directly with Legg Mason Private Portfolio Group, LLC (“LMPPG”), refer to LMPPG’s Form ADV disclosure document. Please see GIPS® Endnotes for additional important information regarding the portfolio’s performanceand for effects of fees. Management and performance of individual accounts may vary for reasons that include the existence of different implementation and model requirements in differentinvestment programs.
.
9
Strategy characteristics & performance | Performance
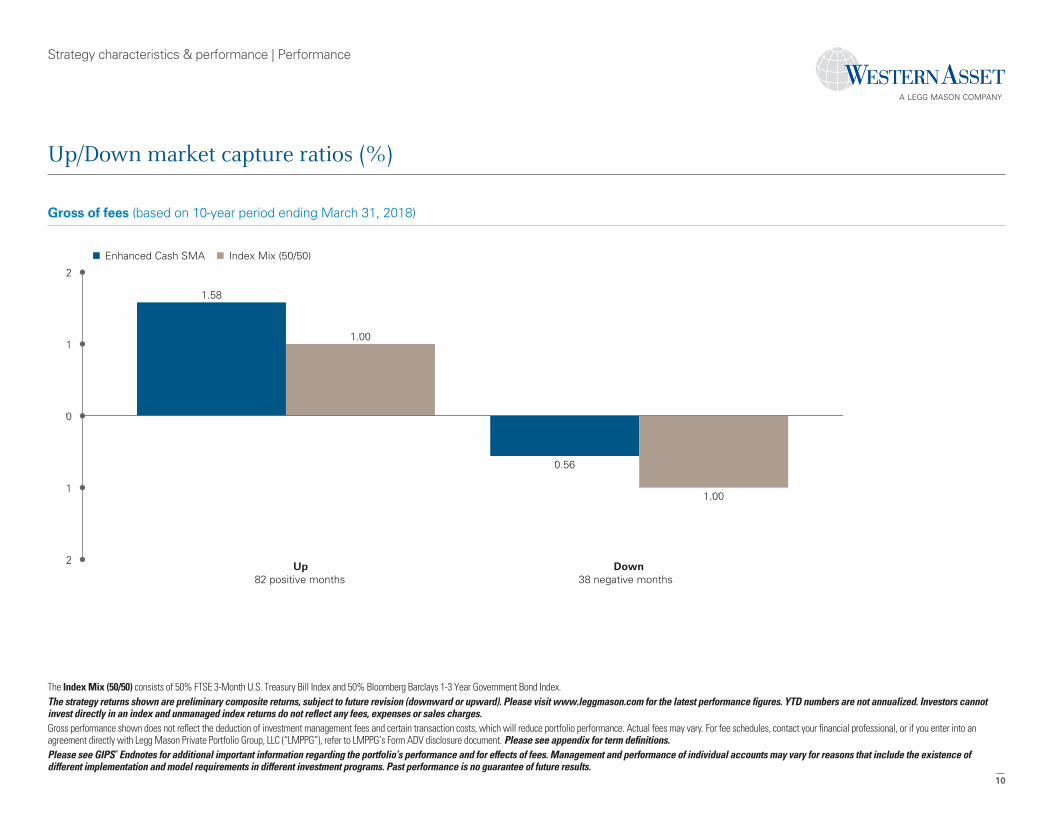
Up/Down market capture ratios (%)
Gross of fees (based on 10-year period ending March 31, 2018)
1.58
0.56
1.00
1.00
2
1
0
1
2
Enhanced Cash SMA Index Mix (50/50)
Up82 positive months
Down38 negative months
The Index Mix (50/50) consists of 50% FTSE 3-Month U.S. Treasury Bill Index and 50% Bloomberg Barclays 1-3 Year Government Bond Index.The strategy returns shown are preliminary composite returns, subject to future revision (downward or upward). Please visit www.leggmason.com for the latest performance figures. YTD numbers are not annualized. Investors cannotinvest directly in an index and unmanaged index returns do not reflect any fees, expenses or sales charges.Gross performance shown does not reflect the deduction of investment management fees and certain transaction costs, which will reduce portfolio performance. Actual fees may vary. For fee schedules, contact your financial professional, or if you enter into anagreement directly with Legg Mason Private Portfolio Group, LLC (“LMPPG”), refer to LMPPG’s Form ADV disclosure document. Please see appendix for term definitions.Please see GIPS® Endnotes for additional important information regarding the portfolio’s performance and for effects of fees. Management and performance of individual accounts may vary for reasons that include the existence ofdifferent implementation and model requirements in different investment programs. Past performance is no guarantee of future results.
.
10
Strategy characteristics & performance | Performance
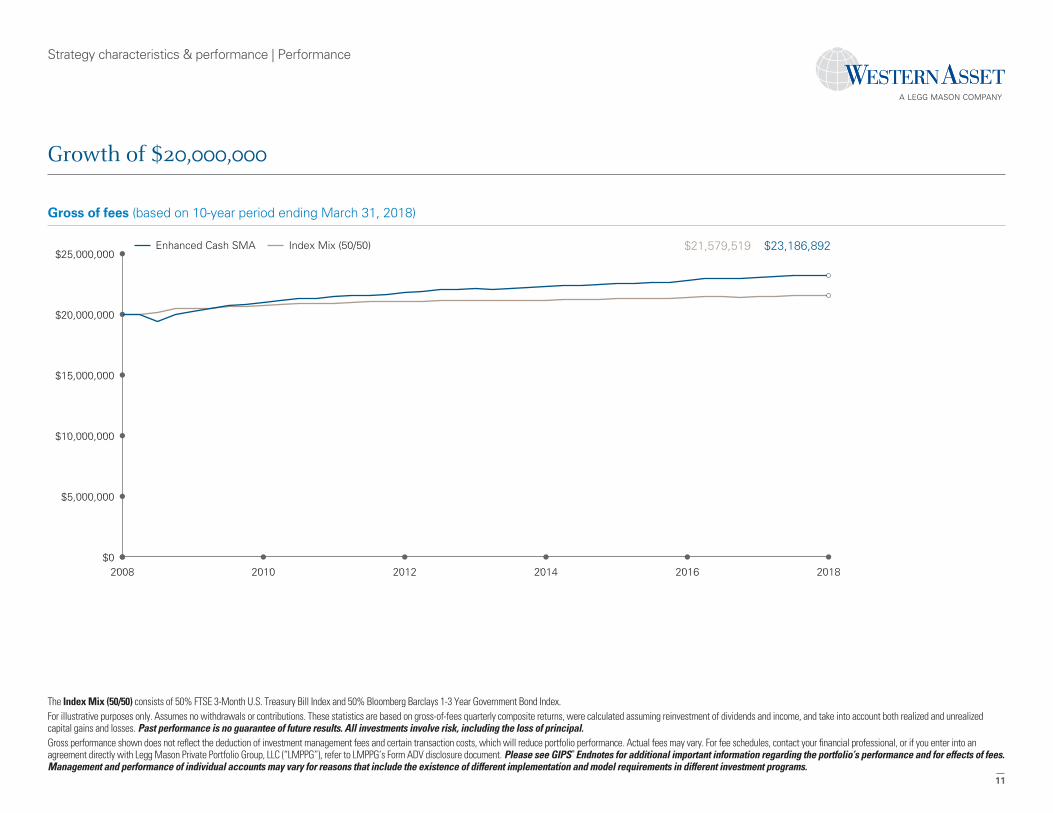
Growth of $20,000,000
Gross of fees (based on 10-year period ending March 31, 2018)
2008 2010 2012 2014 2016 2018$0
$5,000,000
$10,000,000
$15,000,000
$20,000,000
$25,000,000Enhanced Cash SMA Index Mix (50/50) $23,186,892 $21,579,519
The Index Mix (50/50) consists of 50% FTSE 3-Month U.S. Treasury Bill Index and 50% Bloomberg Barclays 1-3 Year Government Bond Index.For illustrative purposes only. Assumes no withdrawals or contributions. These statistics are based on gross-of-fees quarterly composite returns, were calculated assuming reinvestment of dividends and income, and take into account both realized and unrealizedcapital gains and losses. Past performance is no guarantee of future results. All investments involve risk, including the loss of principal.Gross performance shown does not reflect the deduction of investment management fees and certain transaction costs, which will reduce portfolio performance. Actual fees may vary. For fee schedules, contact your financial professional, or if you enter into anagreement directly with Legg Mason Private Portfolio Group, LLC (“LMPPG”), refer to LMPPG’s Form ADV disclosure document. Please see GIPS® Endnotes for additional important information regarding the portfolio’s performance and for effects of fees.Management and performance of individual accounts may vary for reasons that include the existence of different implementation and model requirements in different investment programs.
.
11
Appendix | Investment Management Team
Investment management team
Western Asset, one of the world’s leading fixed income managers, was founded in 1971. With a focus on long-termfundamental value investing that employs a top-down, bottom-up approach, the firm has nine offices around the globeand deep experience across the range of fixed income sectors. Western Asset has been recognized for its emphasis onteam management and intensive proprietary research, supported by robust risk management.
.
12
Appendix | Performance Endnotes
GIPS® Endnotes
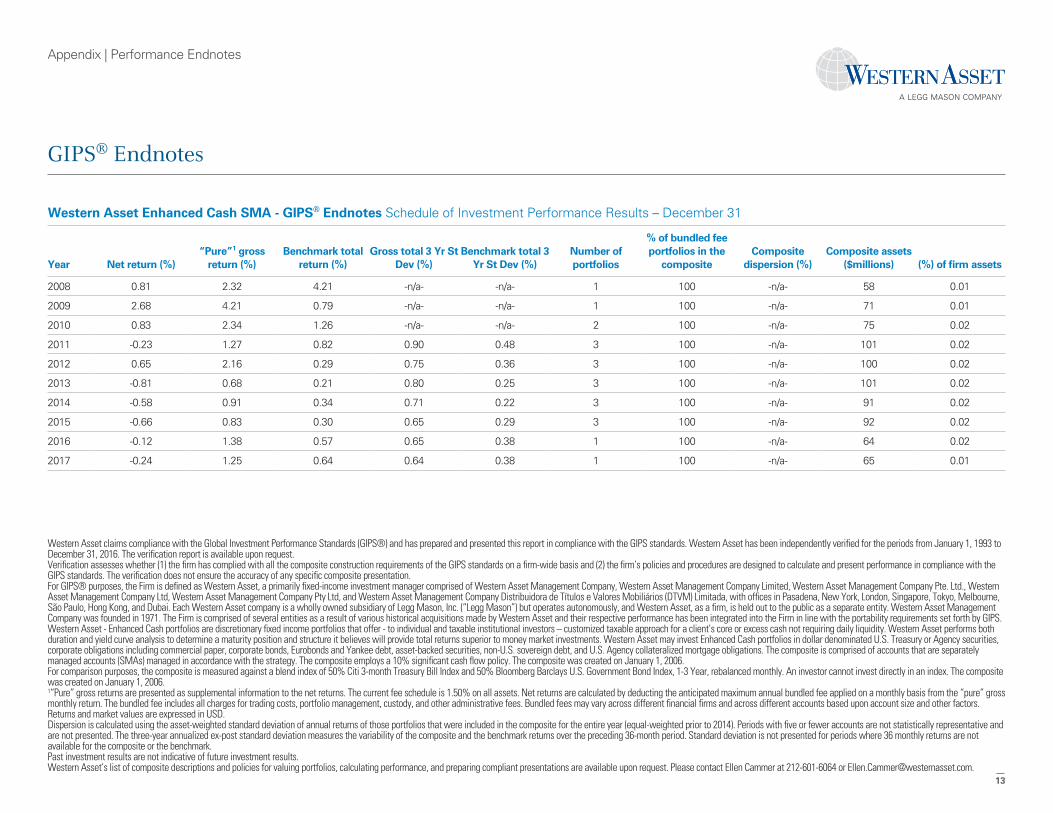
Western Asset Enhanced Cash SMA - GIPS® Endnotes Schedule of Investment Performance Results – December 31
Year Net return (%)“Pure”1 gross
return (%)Benchmark total
return (%)Gross total 3 Yr St
Dev (%)Benchmark total 3
Yr St Dev (%)Number ofportfolios
% of bundled feeportfolios in the
compositeComposite
dispersion (%)Composite assets
($millions) (%) of firm assets
2008 0.81 2.32 4.21 -n/a- -n/a- 1 100 -n/a- 58 0.01
2009 2.68 4.21 0.79 -n/a- -n/a- 1 100 -n/a- 71 0.01
2010 0.83 2.34 1.26 -n/a- -n/a- 2 100 -n/a- 75 0.02
2011 -0.23 1.27 0.82 0.90 0.48 3 100 -n/a- 101 0.02
2012 0.65 2.16 0.29 0.75 0.36 3 100 -n/a- 100 0.02
2013 -0.81 0.68 0.21 0.80 0.25 3 100 -n/a- 101 0.02
2014 -0.58 0.91 0.34 0.71 0.22 3 100 -n/a- 91 0.02
2015 -0.66 0.83 0.30 0.65 0.29 3 100 -n/a- 92 0.02
2016 -0.12 1.38 0.57 0.65 0.38 1 100 -n/a- 64 0.02
2017 -0.24 1.25 0.64 0.64 0.38 1 100 -n/a- 65 0.01
Western Asset claims compliance with the Global Investment Performance Standards (GIPS®) and has prepared and presented this report in compliance with the GIPS standards. Western Asset has been independently verified for the periods from January 1, 1993 toDecember 31, 2016. The verification report is available upon request.Verification assesses whether (1) the firm has complied with all the composite construction requirements of the GIPS standards on a firm-wide basis and (2) the firm’s policies and procedures are designed to calculate and present performance in compliance with theGIPS standards. The verification does not ensure the accuracy of any specific composite presentation.For GIPS® purposes, the Firm is defined as Western Asset, a primarily fixed-income investment manager comprised of Western Asset Management Company, Western Asset Management Company Limited, Western Asset Management Company Pte. Ltd., WesternAsset Management Company Ltd, Western Asset Management Company Pty Ltd, and Western Asset Management Company Distribuidora de Títulos e Valores Mobiliários (DTVM) Limitada, with offices in Pasadena, New York, London, Singapore, Tokyo, Melbourne,São Paulo, Hong Kong, and Dubai. Each Western Asset company is a wholly owned subsidiary of Legg Mason, Inc. (“Legg Mason”) but operates autonomously, and Western Asset, as a firm, is held out to the public as a separate entity. Western Asset ManagementCompany was founded in 1971. The Firm is comprised of several entities as a result of various historical acquisitions made by Western Asset and their respective performance has been integrated into the Firm in line with the portability requirements set forth by GIPS.Western Asset - Enhanced Cash portfolios are discretionary fixed income portfolios that offer - to individual and taxable institutional investors – customized taxable approach for a client’s core or excess cash not requiring daily liquidity. Western Asset performs bothduration and yield curve analysis to determine a maturity position and structure it believes will provide total returns superior to money market investments. Western Asset may invest Enhanced Cash portfolios in dollar denominated U.S. Treasury or Agency securities,corporate obligations including commercial paper, corporate bonds, Eurobonds and Yankee debt, asset-backed securities, non-U.S. sovereign debt, and U.S. Agency collateralized mortgage obligations. The composite is comprised of accounts that are separatelymanaged accounts (SMAs) managed in accordance with the strategy. The composite employs a 10% significant cash flow policy. The composite was created on January 1, 2006.For comparison purposes, the composite is measured against a blend index of 50% Citi 3-month Treasury Bill Index and 50% Bloomberg Barclays U.S. Government Bond Index, 1-3 Year, rebalanced monthly. An investor cannot invest directly in an index. The compositewas created on January 1, 2006.1“Pure” gross returns are presented as supplemental information to the net returns. The current fee schedule is 1.50% on all assets. Net returns are calculated by deducting the anticipated maximum annual bundled fee applied on a monthly basis from the “pure” grossmonthly return. The bundled fee includes all charges for trading costs, portfolio management, custody, and other administrative fees. Bundled fees may vary across different financial firms and across different accounts based upon account size and other factors.Returns and market values are expressed in USD.Dispersion is calculated using the asset-weighted standard deviation of annual returns of those portfolios that were included in the composite for the entire year (equal-weighted prior to 2014). Periods with five or fewer accounts are not statistically representative andare not presented. The three-year annualized ex-post standard deviation measures the variability of the composite and the benchmark returns over the preceding 36-month period. Standard deviation is not presented for periods where 36 monthly returns are notavailable for the composite or the benchmark.Past investment results are not indicative of future investment results.Western Asset’s list of composite descriptions and policies for valuing portfolios, calculating performance, and preparing compliant presentations are available upon request. Please contact Ellen Cammer at 212-601-6064 or [email protected].
.
13
Appendix | Term Definitions
Definitions
Term definitionsMaturity is the date at which a debt instrument is due and payable.A bond due to mature on January 1, 2010, will return thebondholder’s principal and final interest payment when it reachesmaturity on that date. Bond yields are frequently calculated on ayield-to-maturity basis.
Duration (Modified Duration) is the measure of the price sensitivityof a fixed income security to an interest rate change of 100 basispoints. Calculation is based on the weighted average of the presentvalues for all cash flows.
Yield to Worst (YTW) is based on a portfolio’s current holdings onone specific day, is gross of all portfolio expenses, and is calculatedbased on assumptions that prepayment occurs if the bond has call orput provisions and the issuer can offer a lower coupon rate based oncurrent market rates. If market rates are higher than the current yieldof a bond, the YTW calculation will assume no prepayments aremade, and YTW will equal the yield to maturity. The YTW will be thelowest of yield to maturity or yield to call (if the bond has prepaymentprovisions). The YTW of a bond portfolio is the market-weightedaverage of the YTWs of all the bonds in the portfolio.
Insured municipal bonds are ones where scheduled interest andprincipal payments are guaranteed by AAA-rated municipal bondinsurers.
General Obligation municipal bonds are backed by the credit andtaxing power of the issuing jurisdiction rather than the revenue of agiven project.§
Revenue bonds are municipal bonds supported by the revenue froma specific project.
Pre-refunded bonds are municipal bonds that are generally backedor secured by U.S. Treasury bonds.
Effective Duration is a duration calculation for bonds withembedded options. Effective duration takes into account thatexpected cash flows will fluctuate as interest rates change.
Average Maturity is the average length of maturity for all fixed-ratedebt instruments held in a portfolio.
Average Coupon based on the portfolio’s underlying holdings,which may differ and are subject to change. Coupon rate is theannual coupon payments paid by the issuer relative to a bond’s faceor par value.
Yield to Maturity - The rate of return anticipated on a bond if it isheld until the maturity date. The calculation of YTM takes intoaccount the current market price, par value, coupon interest rate andtime to maturity.
The Sharpe Ratio is a risk-adjusted measure that is calculated usingstandard deviation and excess return to determine reward per unit ofrisk. The higher the Sharpe Ratio, the better the portfolio’s historicaladjusted performance.§
Alpha is a measure of the difference between actual returns andexpected performance, given the level of risk as measured by Beta,where Beta measures sensitivity to benchmark movements.
R-Squared measures the strength of the linear relationship betweenthe portfolio and its benchmark. R-squared at 1.0 implies perfectlinear relationship and zero implies no relationship exists. Standarddeviation is based on quarterly data.
Standard Deviation is a measure of the variability of returns; thehigher the standard deviation, the greater the range of performance(i.e., volatility).
The Capture Ratios measure a manager’s composite performancerelative to the benchmark, considering only those quarters that areeither positive (Up) or negative (Down) for the benchmark.
An Up Market Capture Ratio greater than 1.0 indicates a managerwho has outperformed the benchmark in the benchmark’s positivequarters.
A Down Market Capture Ratio of less than 1.0 indicates a managerwho has outperformed the relative benchmark in the benchmark’snegative quarters.
.
14
Brandywine Global
Clarion Partners
ClearBridge Investments
EnTrustPermal
Martin Currie
QS Investors
RARE Infrastructure
Royce & Associates
Western Asset leggmason.com
Legg Mason is a leading global investment company committed to helping clients reach their financial goals through long-term, actively managed investment strategies.
• A broad mix of equities, fixed-income, alternatives and cash strategies invested worldwide
• A diverse family of specialized investment managers, each with its own independent approach to research and analysis
• Over a century of experience in identifying opportunities and delivering astute investment solutions to clients
Separately Managed Accounts (SMAs) are investment services provided by Legg Mason Private Portfolio Group, LLC (LMPPG), a federally registered investment adviser. Client portfolios are managed based oninvestment instructions or advice provided by one or more of the following Legg Mason-affiliated sub-advisers: ClearBridge Investments, LLC. and Western Asset Management Company. Management isimplemented by LMPPG, the designated subadviser or, in the case of certain programs, the program sponsor or its designee.Investments for the program(s) discussed herein are traded primarily in U.S. markets and unless otherwise noted, equity and fixed-income investments for such program(s) are primarily of U.S. issuers. In addition,unless otherwise noted, indexes referred to herein represent groups of securities that are issued primarily by U.S. issuers.IMPORTANT TAX INFORMATION: Legg Mason, Inc., its affiliates, and its employees are not in the business of providing tax or legal advice to taxpayers. These materials and any tax-related statements are notintended or written to be used, and cannot be used or relied upon, by any such taxpayer for the purpose of avoiding tax penalties or complying with any applicable tax laws or regulations. Tax-related statements, ifany, may have been written in connection with the “promotion or marketing” of the transaction(s) or matter(s) addressed by these materials, to the extent allowed by applicable law. Any such taxpayer should seekadvice based on the taxpayer’s particular circumstances from an independent tax advisor.Gross of fees performance results shown herein do not reflect deduction for investment management fees and transaction costs. The performance of individual client accounts will vary and will be reduced by suchfees and costs. Please review the effect of fees and transaction costs on account performance with your financial professional.Investments are not obligations of, and are not guaranteed by, LMPPG or any other Legg Mason Inc affiliate or subsidiary; are not FDIC or government insured; and are subject to risks,including possible loss of the principal amount invested. Professional money management may not be suitable for all investors.Any information, statement or opinion set forth herein is general in nature, is not directed to or based on the financial situation or needs of any particular investor, and does not constitute,and should not be construed as, investment advice, forecast of future events, a guarantee of future results, or a recommendation with respect to any particular security or investment strategyor type of retirement account. Investors seeking financial advice regarding the appropriateness of investing in any securities or investment strategies should consult their financialprofessional.©2018 Legg Mason Investor Services, LLC, member FINRA, SIPC. Legg Mason Investor Services, LLC and Western Asset Management Company are subsidiaries of Legg Mason, Inc.FN1313271 SMA0037 PPG-Q118-V1§