2017 clearbridge large cap growth portfolios · 4 q 2017 s eparately managed accounts clearbridge...
TRANSCRIPT

1Q 2018 Separately Managed Accounts
CLEARBRIDGELARGE CAP GROWTHPORTFOLIOS
INVESTMENT PRODUCTS: NOT FDIC INSURED • NO BANK GUARANTEE • MAY LOSE VALUE

Introduction | About Legg Mason
Meet our investment managers
Having honed their expertiseover many decades and marketcycles, our global asset managersoffer specialized capabilitiesacross a scope of asset classesand strategies. Each skilled teamoperates with independentvision to help deliver powerfulfinancial solutions for bothindividuals and institutions.
Global alternative investments One of the world’s largest hedge fund investors, recognized as a global leader in structuring comprehensive alternative investment strategies for institutional and high net worth clients.
Active equity specialists An active equity specialist that builds global, stock-driven portfolios based on fundamental research, devoting all of its resources to delivering optimum investment outcomes and superior client relationships.
Quality-focused equity Global investment manager with over 50 years of experience and long-tenured portfolio managers who seek to build income, high active share or low volatility portfolios.
Investing with conviction Acting with conviction and discipline, we look beyond short-term, conventional thinking to rigorously pursue long-term value across differentiated fixed income, equity, and alternative solutions.
Systematic investment solutions QS Investors is a quantitative asset manager that provides multi-asset class and global equity solutions. Their approach unites intellectual and academic precision with the power of data and technology in their quest to elevate the certainty of outcomes they deliver.
Small-cap equityKnown for its disciplined, value-oriented approach to managing small-caps. An asset class pioneer, the firm’s founder is one of the longest-tenured active managers.
Global listed infrastructure investing RARE is a dedicated infrastructure investment manager focused on global listed infrastructure investments. Established in 2006, RARE has grown to become one of the largest listed infrastructure managers globally.
Fixed incomeOne of the world’s leading global fixed income managers. Founded in 1971, the firm is known for team management, proprietary research and a long-term fundamental value approach.
Real estate investment specialists Clarion Partners is a leading private equity and debt real estate investment manager established in 1982. Clarion invests in the Americas across a broad range of property types and risk profiles, with the goal of consistently creating value for its clients.
Active share is a measure of the percentage of stock holdings in a manager’s portfolio that differs from the benchmark index.
.
2

Introduction | ClearBridge
Long and distinguished history in equity market investing
Well-established globalinvestment manager with alegacy dating back morethan 50 years• Owned by Legg Mason,
operating with investmentindependence
• Offices in New York,Baltimore, San Francisco andWilmington
Boutique Asset Managers
Individual, specialized asset manager firms• Smith Barney Asset
Management• Loeb Rhoades Asset
Management• Davis Skaggs Asset
Management• Shearson Asset
Management• Salomon Brothers
Asset Management
Singular Focus on Investment Managers
Benefits of Scale
Citigroup forms a Combined Asset Management• Citigroup Asset
Management
1962-1997
1998-2005 present
ClearBridge timeline
2005-
.
3

Introduction | ClearBridge
A long-term commitment to fundamental investing
• ClearBridge Investments’ time-tested investment process has guided the Firm throughout its history• An investment philosophy focused on quality businesses: Differentiated business models Sustainable returns Strong financial characteristics Seasoned management teams
• A long-term approach with low turnover.• An investment culture developed over five decades that is dedicated to training and advancement• Independent risk management supported by a team of risk and portfolio analytics professionals• Innovative compensation program aligning ClearBridge with clients
Managers seek to keep portfolio turnover low to allow for the positive compounding effect of dividends over time, although market, security and other investment considerations may cause turnover to be higher from time to time. Also, all capitalization ranges will notnecessarily be represented in an individual account.
.
4

Your investment portfolio | Large Cap Growth
ClearBridge Large Cap Growth Portfolios
Overview• The Large Cap Growth (LCG) investment portfolios
seek out high-quality, large-company stocks that canprovide the potential for superior long-termperformance
Portfolio positioning• Designed for investors seeking long-term capital
appreciation through investments in large-capitalization companies with the potential for highfuture earnings growth
• Long-term, buy-and-hold approach results in lowerportfolio turnover
ObjectivesSeeks long-term growth of capital
Key differentiators• Experienced investment team
• Looks to invest in world-class companiespossessing strong financials, dominant positions,innovation, and best-in-class products and services,led by results-oriented management teams withstrong track records and sound future plans
• Portfolios typically concentrated in 35 to 45 stocks
• Stock and sector weightings are by-products of thebottom-up fundamental research-driven stockselection process
• Points of Differentiation Concentrated, low turnover approach
Bottom-up driven investment decisions
Diversification across growth spectrum (cyclical,stable, select)
Philosophy• Invest in leadership companies where we believe
the market price underestimates the magnitude offuture growth
• Use stock selection as primary driver – identifycategory leaders with characteristics to sustain thatposition
• Find secular tailwinds to support multi-yearinvestment opportunities, allowing for compoundingof earnings and cash flow
• Perform rigorous analysis to understand companyfundamentals, key competitive dynamics andindustry structure Believe the best business models win over time
– Identify barriers to entry and prefer companieswith innovation prowess, regardless of size
–Look for businesses that protect and growmarket share consistently
–Gravitate to self-funding business models withsignificant recurring revenue
Seek businesses with the ability to generatesuperior free cash flow over time–Stress test the sustainability of profitability and
growth
Take a disciplined approach to valuation
RISKS: All investments involve risk, including the loss of principal, and there is no guarantee that investment objectives will be met.While most investments are in U.S. companies, investments may also be made in ADRs and other securities of non-U.S. companies in developed and emerging markets which involve risks in addition to those ordinarily associated with investing in domestic securities,including the potentially negative effects of currency fluctuation, political and economic developments, foreign taxation and differences in auditing and other financial standards. These risks are magnified in emerging markets.Diversification does not assure a profit or protect against market loss.Managers seek to keep portfolio turnover low to allow for the positive compounding effect of dividends over time, although market, security and other investment considerations may cause turnover to be higher from time to time. Also, all capitalization ranges will notnecessarily be represented in an individual account.
.
5

Your investment portfolio | Large Cap Growth
ClearBridge Large Cap Growth Portfolios investment process
Idea generation• Sector analysts and
PMs each proposecompanies with attractivebusiness models andgood long-term growthprospects forfurther review
• Idea generation is anongoing and continualprocess, but alsoconsider mid- andsmall-capitalizationcompanies and ADR’sof foreign companiesopportunistically
Fundamental analysis• Analysts and PMs work
together to understandthe durability of acompany’s growth andprofit
• Meet with targetcompany management,competitorsand industry experts
• Determine appropriateentry price
Portfolio construction• Own companies with a
range of growth andvolatility
• Maintain high activeshare
• Monitor sectorweightings andcorrelations amongcurrent holdings
Risk management/Evaluation discipline• Assess risk regularly
The investment process may change over time. The characteristics set forth are intended as a general illustration of some of the criteria the strategy team considers in selecting securities for client portfolios. There is no guarantee investment objectives will beachieved.
.
6

Strategy characteristics & performance | Equity Portfolio characteristics
Equity Portfolio characteristics as of March 31, 2018
Market capitalization (%)
69.34
15.49 14.15
1.02 0.00
65.68
14.26 13.146.70
0.22
Above $50B $25 - $50B $10 - $25B $3 - $10B 0 - $3B0
20
40
60
80
100Portfolio BM
Characteristics
Portfolio BM
Number of Holdings 48 553
Dividend Yield 1.00 1.29
Forecasted P/E Ratio -1 Year 21.77 20.23
Price/Book Ratio 6.86 7.31
Long-Term EPS Growth 17.04 15.69
Weighted Median Market Capitalization 89.90 98.61
Weighted Average Market Capitalization 202.65 221.05
Source: FactSet. Portfolio characteristics are based on a model portfolio, not an actual client account. The model portfolio is a hypothetical portfolio whereby the portfolio characteristics are based on simulated trading and account activity of a client account invested inthis strategy. The model portfolio assumes no withdrawals, contributions or client-imposed restrictions. Portfolio characteristics of individual client accounts may differ from those of the model portfolio as a result of account size, client-imposed restrictions, the timingof client investments, market conditions, contributions, withdrawals and other factors. Please see Endnotes for additional information. Please see appendix for term definitions.P/E ratio Year 1 and Long-term EPS growth are provided by I/B/E/S, are inherently limited and should not be used as an indication of future performance.Yields and dividends represent past performance and there is no guarantee they will continue to be paid.
.
7

Strategy characteristics & performance | Equity Portfolio characteristics
Equity Portfolio characteristics as of March 31, 2018
Sector weightings (%)
Portfolio BM
Information Technology 37.41 38.68
Health Care 17.27 12.51
Consumer Discretionary 14.85 18.61
Industrials 6.89 12.70
Consumer Staples 6.75 6.37
Financials 6.08 3.49
Energy 3.46 0.83
Materials 3.20 3.48
Real Estate 1.56 2.40
Telecommunication Services 0.00 0.91
Utilities 0.00 0.01
Cash 2.53 0.00
Top equity holdings (%)
Amazon.com Inc 5.82
Alphabet Inc 5.58
Microsoft Corp 4.17
Visa Inc 3.40
Adobe Systems Inc 3.02
UnitedHealth Group Inc 2.81
Red Hat Inc 2.66
Zoetis Inc 2.43
BlackRock Inc 2.37
Home Depot Inc/The 2.36
Total 34.62
Source: FactSet. Portfolio characteristics are based on a model portfolio, not an actual client account. The model portfolio is a hypothetical portfolio whereby the portfolio characteristics are based on simulated trading and account activity of a client account invested inthis strategy. The model portfolio assumes no withdrawals, contributions or client-imposed restrictions. Portfolio characteristics of individual client accounts may differ from those of the model portfolio as a result of account size, client-imposed restrictions, the timingof client investments, market conditions, contributions, withdrawals and other factors.
.
8

Strategy characteristics & performance | Performance
Performance
Calendar-year total returns – gross and net of fees (%) ending December 31
2017 2016 2015 2014 2013 2012 2011 2010 2009 2008
Large Cap Growth (gross) 26.36 8.37 10.53 14.59 38.83 21.27 1.12 10.49 36.37 -37.63
Large Cap Growth (net) 22.74 5.23 7.33 11.28 34.88 17.79 -1.84 7.29 32.49 -39.53
Russell 1000 Growth Index 30.21 7.08 5.67 13.05 33.48 15.26 2.64 16.71 37.21 -38.44
S&P 500 Index 21.83 11.96 1.38 13.69 32.39 16.00 2.11 15.06 26.46 -37.00
Annualized rates of return – gross and net of fees (%) as of March 31, 2018 – PRELIMINARY
MTH QTR YTD 1-year 3-year 5-year 7-year 10-year 15-year 20-year
Large Cap Growth (gross) -1.92 1.64 1.64 20.31 14.06 17.00 16.51 11.92 10.82 8.10
Large Cap Growth (net) -2.17 0.90 0.90 16.85 10.76 13.62 13.15 8.68 7.61 4.96
Russell 1000 Growth Index -2.74 1.42 1.42 21.25 12.90 15.53 14.09 11.34 10.88 6.19
S&P 500 Index -2.54 -0.76 -0.76 13.99 10.78 13.31 12.71 9.49 10.10 6.46
The strategy returns shown are preliminary composite returns, subject to future revision (downward or upward). Please visit www.leggmason.com for the latest performance figures. YTD numbers are not annualized. Investors cannotinvest directly in an index and unmanaged index returns do not reflect any fees, expenses or sales charges.Past performance is no guarantee of future results. YTD numbers are not annualized. Gross performance shown does not reflect the deduction of investment management fees and certain transaction costs, which will reduce portfolio performance. Netperformance includes the deduction of a 3.0% annual wrap fee, which is the maximum anticipated wrap fee for equity and balanced portfolios. Actual fees may vary. For fee schedules, contact your financial professional, or if you enter into an agreement directly withLegg Mason Private Portfolio Group, LLC (“LMPPG”), refer to LMPPG’s Form ADV disclosure document. Returns reflect the reinvestment of dividends and other earnings. Please see GIPS® Endnotes for additional important information regarding theportfolio’s performance and for effects of fees. Management and performance of individual accounts may vary for reasons that include the existence of different implementation and model requirements in different investment programs.
.
9

Strategy characteristics & performance | Performance
Risk/return profile (%)
Gross of fees (based on 10-year period ending March 31, 2018)
0 5 10 15 200
5
10
15
20
Large Cap Growth Russell 1000 Growth Index S&P 500 Index
Ann
ualiz
ed r
ate
of r
etur
n (%
)
Risk (% annualized standard deviation)
Modern portfolio statistics as of March 31, 2018
Large CapGrowth
Russell 1000GrowthIndex
S&P 500Index
Annualized return (%) 11.92 11.34 9.49
Annualized standard deviation (%) 15.51 15.32 15.05
Sharpe ratio 0.79 0.76 0.66
Beta 0.98 N/A N/A
Alpha 0.84 N/A N/A
R-squared 0.93 N/A N/A
The strategy returns shown are preliminary composite returns, subject to future revision (downward or upward). Please visit www.leggmason.com for the latest performance figures. YTD numbers are not annualized. Investors cannotinvest directly in an index and unmanaged index returns do not reflect any fees, expenses or sales charges.Alpha, Beta, and R-squared are shown versus the Russell 1000 Growth Index. Investors cannot invest directly in an index and unmanaged index returns do not reflect any fees, expenses or sales charges. Please see appendix for term definitions.Gross performance shown does not reflect the deduction of investment management fees and certain transaction costs, which will reduce portfolio performance. Actual fees may vary. For fee schedules, contact your financial professional, or if you enter into anagreement directly with Legg Mason Private Portfolio Group, LLC (“LMPPG”), refer to LMPPG’s Form ADV disclosure document. Please see GIPS® Endnotes for additional important information regarding the portfolio’s performance and for effects of fees.Management and performance of individual accounts may vary for reasons that include the existence of different implementation and model requirements in different investment programs.
.
10

Strategy characteristics & performance | Performance
Up/Down market capture ratios (%)
Gross of fees (based on 10-year period ending March 31, 2018)
0.99
0.96
1.00
1.00
2
1
0
1
2
Large Cap Growth Russell 1000 Growth Index
Up75 positive months
Down45 negative months
The strategy returns shown are preliminary composite returns, subject to future revision (downward or upward). Please visit www.leggmason.com for the latest performance figures. YTD numbers are not annualized. Investors cannotinvest directly in an index and unmanaged index returns do not reflect any fees, expenses or sales charges.Gross performance shown does not reflect the deduction of investment management fees and certain transaction costs, which will reduce portfolio performance. Actual fees may vary. For fee schedules, contact your financial professional, or if you enter into anagreement directly with Legg Mason Private Portfolio Group, LLC (“LMPPG”), refer to LMPPG’s Form ADV disclosure document. Please see appendix for term definitions.Please see GIPS® Endnotes for additional important information regarding the portfolio’s performance and for effects of fees. Management and performance of individual accounts may vary for reasons that include the existence ofdifferent implementation and model requirements in different investment programs. Past performance is no guarantee of future results.
.
11
Strategy characteristics & performance | Performance
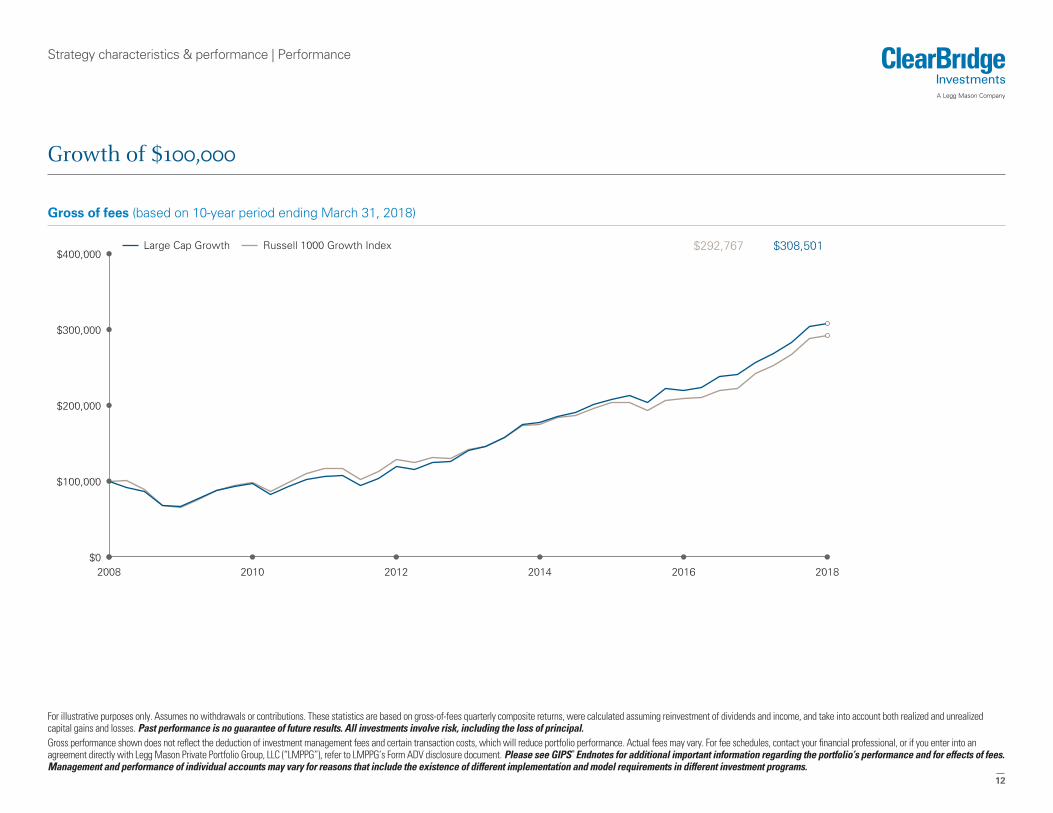
Growth of $100,000
Gross of fees (based on 10-year period ending March 31, 2018)
2008 2010 2012 2014 2016 2018$0
$100,000
$200,000
$300,000
$400,000Large Cap Growth Russell 1000 Growth Index $308,501 $292,767
For illustrative purposes only. Assumes no withdrawals or contributions. These statistics are based on gross-of-fees quarterly composite returns, were calculated assuming reinvestment of dividends and income, and take into account both realized and unrealizedcapital gains and losses. Past performance is no guarantee of future results. All investments involve risk, including the loss of principal.Gross performance shown does not reflect the deduction of investment management fees and certain transaction costs, which will reduce portfolio performance. Actual fees may vary. For fee schedules, contact your financial professional, or if you enter into anagreement directly with Legg Mason Private Portfolio Group, LLC (“LMPPG”), refer to LMPPG’s Form ADV disclosure document. Please see GIPS® Endnotes for additional important information regarding the portfolio’s performance and for effects of fees.Management and performance of individual accounts may vary for reasons that include the existence of different implementation and model requirements in different investment programs.
.
12

Appendix | Investment Management Team
Investment management team
Peter Bourbeau§
Managing Director, Portfolio Manager§• Industry since 1991
• Firm since 1991
• Fordham University — MBA
• University of Florida — BSBA
Margaret Vitrano§
Managing Director, Portfolio Manager• Industry since 1996
• Firm since 1997
• University of Pennsylvania — MBA in Finance
• Duke University — BA in Public Policy studies and Art History
• Citigroup — Research Analyst for consumer discretionary sector
.
13

Appendix | Performance Endnotes
GIPS® Endnotes
ClearBridge Large Cap Growth SMA Inception date: January 2006. Composite Creation Date: June 2008. Reporting Currency: USD
PeriodTotal Return
(Net, %)Total Return
(*Pure Gross, %)
Russell 1000Growth
BenchmarkReturn
Number ofPortfolios
% of BundledFee Portfolios inthe Composite
CompositeDispersion (%)
Composite 3 Yr.St. Dev. (%)
Benchmark 3 Yr.St. Dev. (%)
Total CompositeAssets at End of
Period (USDmillion)
Percentage ofFirm Assets
Total FirmAssets at End of
Period (USDmillion)
2017 22.74 26.36 30.21 1,870 98 0.23 10.38 10.69 1,750.7 1.5 119,187.1
2016 5.23 8.37 7.08 1,390 99 0.22 11.26 11.31 1,225.5 1.2 100,936.9
2015 7.33 10.53 5.67 682 100 0.23 11.17 10.85 852.8 0.9 92,536.4
2014 11.28 14.59 13.05 452 100 0.13 10.25 9.73 825.9 0.8 100,721.5
2013 34.88 38.83 33.48 359 100 0.71 12.61 12.35 715.1 0.8 85,024.7
2012 17.79 21.27 15.26 2,864 100 0.43 16.28 15.88 545.2 1.0 54,624.3
2011 -1.84 1.12 2.64 2,708 100 0.42 18.66 18.01 385.9 0.8 50,870.8
2010 7.29 10.49 16.71 3,264 100 0.72 n/a n/a 481.3 0.9 55,366.5
2009 32.49 36.37 37.21 4,129 100 1.98 n/a n/a 573.0 1.1 53,522.7
2008 -39.53 -37.63 -38.44 4,113 100 1.08 n/a n/a 435.3 0.9 50,614.9
*Pure gross of fee returns do not reflect the deduction of any expenses, including transaction costs, and are presented as supplemental to the net of fee returns.Compliance Statement:§ClearBridge Investments, LLC claims compliance with the Global Investment Performance Standards (GIPS®) and has prepared and presented this report in compliance with the GIPS standards. ClearBridge Investments, LLC has been independently verified for theperiods January 1, 1997 - December 31, 2016. The verification reports are available upon request.Verification assesses whether (1) the firm has complied with all the composite construction requirements of the GIPS standards on a firm-wide basis and (2) the firm’s policies and procedures are designed to calculate and present performance in compliance with theGIPS standards. Verification does not ensure the accuracy of any specific composite presentation.Firm Information:§ClearBridge Investments, LLC (“ClearBridge”) is a wholly owned subsidiary of Legg Mason, Inc. (“Legg Mason”). The investment advisory business now known as ClearBridge was registered in September 2005 to facilitate Legg Mason’s acquisition of substantially allthe equity asset management businesses known as Citigroup Asset Management. These former businesses serve as the foundation of ClearBridge and its claim of GIPS compliance for institutional accounts through predecessor firms, effective as of January 1997. InJune 2008, ClearBridge combined this business with its retail business to form a single GIPS firm. As of April 1, 2013 and January 1, 2016, ClearBridge’s affiliates, Global Currents Investment Management, LLC, and ClearBridge, LLC, respectively, have become part ofthe ClearBridge GIPS firm.Composite Information:§The ClearBridge Large Cap Growth SMA composite consists of discretionary wrap accounts with an account minimum of US $25,000. Accounts within the composite seek consistent growth of capital while minimizing volatility. Investments are primarily made in U.S.companies, with an objective of outperforming the Russell 1000 Growth Index. The main risks of this strategy are General Investment Risk and Non-U.S. Investment Risk. Prior to June 2008, the minimum was $5,000.Input and Calculation Data:§The fee schedule currently in effect is 3.00% on all assets. Net of fee composite returns are calculated by reducing each monthly composite pure gross rate of return by the highest “bundled” fee charged (3.00%) annually, prorated to a monthly ratio. The “bundled” feeincludes transaction costs, investment management, custodial, and other administrative fees. Effective January 1, 2013, the number of portfolios reflects a change from prior periods due to an aggregation of accounts as reported by one sponsor. As of January 2014,the internal dispersion of annual returns is measured by the asset-weighted standard deviation of portfolio returns included in the composite for the entire year. For prior years, the equal-weighted standard deviation was used. The composite employed a 10%significant cash flow policy which was discontinued in January 2012. A list of composite descriptions is available upon request. Policies for valuing portfolios, calculating performance, and preparing compliant presentations are available upon request. Pastperformance is not necessarily indicative of future results.Benchmark Information:§The Russell 1000® Growth Index measures the performance of those Russell 1000 companies with higher price-to-book ratios and higher forecasted growth values.
.
14

Appendix | Index Definitions
Definitions
Index DefinitionsThe Bloomberg Barclays U.S. Government/Credit Bond Indextracks the performance of the overall bond market and is a broadmeasure of the performance of government and corporate fixed-ratedebt issues.
The FTSE 3-Month U.S. Treasury Bill Index is an index based uponthe average monthly yield of the 90-Day Treasury Bills. Treasury billsare secured by the full faith and credit of the U.S. Government andoffer a fixed rate of return.
The MSCI EAFE Index (Europe, Australasia, Far East) is anunmanaged index of common stocks of companies located inEurope, Australasia and the Far East.
The MSCI World Index is a free float-adjusted market capitalizationweighted index that is designed to measure the equity marketperformance of developed markets.
The MSCI World ex. US Index consists of the following 22developed market country indexes: Australia, Austria, Belgium,Canada, Denmark, Finland, France, Germany, Hong Kong, Ireland,Israel, Italy, Japan, Netherlands, New Zealand, Norway, Portugal,Singapore, Spain, Sweden, Switzerland, and, the United Kingdom.
The Russell 1000 Index consists of the 1000 largest securities in theRussell 3000 Index, and this large cap (market-oriented) index ishighly correlated with the S&P 500 Index.
The Russell 1000 Growth Index measures the performance ofthose Russell 1000 Index companies with higher price-to-book ratiosand higher forecasted growth values. (A priceto-book ratio is theprice of a stock compared to the difference between a company’sassets and liabilities).
The Russell 1000 Value Index measures the performance of thoseRussell 1000 Index companies with lower price-to-book ratios andlower forecasted growth values.
The Russell 2000 Index is comprised of the 2,000 smallestcompanies in the Russell 3000 Index.
The Russell 2000 Growth Index measures the performance ofthose Russell 2000 Index companies with higher price-to-book ratiosand higher forecasted growth values.
The Russell 2000 Value Index measures the performance of thoseRussell 2000 Index companies with lower price-to-book ratios andlower forecasted growth values.
The Russell 3000 Index is comprised of the 3,000 largest U.S.companies based on total market capitalization, and represents thevast majority of the investable U.S. market.
The Russell 3000 Growth Index measures the performance ofthose Russell 3000 Index companies with higher price-to-book ratiosand higher forecasted growth values.
The Russell MidCap Index consists of the 800 smallest companiesin the Russell 1000 Index as ranked by total market capitalization.
The Russell MidCap Growth Index measures the performance ofthose Russell MidCap companies with higher price-to-book ratiosand higher forecasted growth values.
The Russell MidCap Value Index measures the performance ofthose Russell MidCap companies with lower price-to-book ratios andlower forecasted growth values. The stock are also members of theRussell 1000 Value Index.
The S&P 500 Index is a capitalization weighted, composite index of500 stocks designed to measure performance of the broad domesticeconomy through changes in the aggregate market value of 500stocks representing all major industries.
The S&P 500/FTSE Value Index is an index of stocks representingapproximately half of the market capitalization of the stocks in theS&P 500 Index that, on a growth-value spectrum, have beenidentified as falling either wholly or partially within the value half ofthe spectrum based on a number of factors. Until December 16,2005, when Standard & Poor’s changed both the name of the indexand its calculation methodology, the index was called the S&P 500/BARRA Value Index.
Investors cannot invest directly in an index and unmanaged indexreturns do not reflect any fees, expenses or sales charges.
.
15

Appendix | Term Definitions
Definitions
Term definitionsMarket Capitalization measures the number of outstandingcommon shares of a given corporation multiplied by the latest priceper share.
Weighted Median Market Capitalization represents the value atwhich half the portfolio’s market capitalization weight falls above andhalf falls below.
Weighted Average Market Capitalization represents the averagevalue of the companies held in the portfolio. When that figure isweighted, the impact of each company’s capitalization on the overallaverage is proportional to the total market value of its shares.
Dividend Yield is determined by dividing a stock’s annual dividendsper share by the current market price per share. Dividend yield is afinancial ratio that shows how much a company pays out individends.
P/E (Year 1) is the previous day’s closing price of the stock dividedby the consensus earnings per share (EPS) of fiscal year 1 (FY1)provided by I/B/E/S. Forecasts are inherently limited and should notbe relied upon as indicators of future performance.§
The Price-to-Book ratio (P/B) is a stock’s price divided by the stock’sper share book value.
Earnings Per Share (EPS) is the portion of a company’s profitallocated to each outstanding share of a common stock.
The Sharpe Ratio is a risk-adjusted measure, calculated usingstandard deviation and excess return to determine reward per unit ofrisk. The higher the Sharpe Ratio, the better the portfolio’s historicaladjusted performance.
Alpha is a measure of the difference between actual returns andexpected performance, given the level of risk as measured by Beta,where Beta measures sensitivity to benchmark movements.
R-Squared measures the strength of the linear relationship betweenthe portfolio and its benchmark. R-squared at 1.0 implies perfectlinear relationship and zero implies no relationship exists.§
Standard Deviation is based on quarterly data. Standard deviation isa measure of the variability of returns; the higher the standarddeviation, the greater the range of performance (i.e., volatility).
The Capture Ratios measure a manager’s composite performancerelative to the benchmark, considering only those quarters that areeither positive (Up) or negative (Down) for the benchmark.
An Up Market Capture Ratio greater than 1.0 indicates a managerwho has outperformed the benchmark in the benchmark’s positivequarters.
A Down Market Capture Ratio of less than 1.0 indicates a managerwho has outperformed the relative benchmark in the benchmark’snegative quarters.§
.
16

Brandywine Global
Clarion Partners
ClearBridge Investments
EnTrustPermal
Martin Currie
QS Investors
RARE Infrastructure
Royce & Associates
Western Asset leggmason.com
Legg Mason is a leading global investment company committed to helping clients reach their financial goals through long-term, actively managed investment strategies.
• A broad mix of equities, fixed-income, alternatives and cash strategies invested worldwide
• A diverse family of specialized investment managers, each with its own independent approach to research and analysis
• Over a century of experience in identifying opportunities and delivering astute investment solutions to clients
Separately Managed Accounts (SMAs) are investment services provided by Legg Mason Private Portfolio Group, LLC (LMPPG), a federally registered investment adviser. Client portfolios are managed based oninvestment instructions or advice provided by one or more of the following Legg Mason-affiliated sub-advisers: ClearBridge Investments, LLC. and Western Asset Management Company. Management isimplemented by LMPPG, the designated subadviser or, in the case of certain programs, the program sponsor or its designee.Investments for the program(s) discussed herein are traded primarily in U.S. markets and unless otherwise noted, equity and fixed-income investments for such program(s) are primarily of U.S. issuers. In addition,unless otherwise noted, indexes referred to herein represent groups of securities that are issued primarily by U.S. issuers.IMPORTANT TAX INFORMATION:§Legg Mason, Inc., its affiliates, and its employees are not in the business of providing tax or legal advice to taxpayers. These materials and any tax-related statements are not intended or written to be used, andcannot be used or relied upon, by any such taxpayer for the purpose of avoiding tax penalties or complying with any applicable tax laws or regulations. Tax-related statements, if any, may have been written inconnection with the “promotion or marketing” of the transaction(s) or matter(s) addressed by these materials, to the extent allowed by applicable law. Any such taxpayer should seek advice based on the taxpayer’sparticular circumstances from an independent tax advisor.Gross of fees performance results shown herein do not reflect deduction for investment management fees and transaction costs. The performance of individual client accounts will vary and will be reduced by suchfees and costs. Please review the effect of fees and transaction costs on account performance with your financial professional.Investments are not obligations of, and are not guaranteed by, LMPPG or any other Legg Mason Inc affiliate or subsidiary; are not FDIC or government insured; and are subject to risks,including possible loss of the principal amount invested. Professional money management may not be suitable for all investors.Any information, statement or opinion set forth herein is general in nature, is not directed to or based on the financial situation or needs of any particular investor, and does not constitute,and should not be construed as, investment advice, forecast of future events, a guarantee of future results, or a recommendation with respect to any particular security or investment strategyor type of retirement account. Investors seeking financial advice regarding the appropriateness of investing in any securities or investment strategies should consult their financialprofessional.©2018 Legg Mason Investor Services, LLC, member FINRA, SIPC. Legg Mason Investor Services, LLC and ClearBridge Investments are subsidiaries of Legg Mason, Inc. FN1414272 SMA0003 PPG-Q118-V1§