executive summary school accountability report card, 2011–12
TRANSCRIPT

Page 1 of 23
Executive Summary School Accountability Report Card, 2011–12
For Frick Middle Address: 2845 64th Ave., Oakland, CA, 94605-2027 Phone: (510) 729-7736 Principal: Jerome Gourdine, Principal Grade Span: 6-8
This executive summary of the School Accountability Report Card (SARC) is intended to provide parents and community members with a quick snapshot of information related to individual public schools. Most data presented in this report are reported for the 2011–12 school year. School finances and school completion data are reported for the 2010–11 school year. Contact information, facilities, curriculum and instructional materials, and select teacher data are reported for the 2012–13 school year. For additional information about the school, parents and community members should review the entire SARC or contact the school principal or the district office.
About This School Frick Middle School cultivates positive learning partnerships. Living and learning in the heart of the Castlemont corridor, Frick students are driven by, and instilled with a belief in, their future success. Frick has 406 students and is located at 64th avenue and Brann Street in East Oakland. Our size and location make Frick a nexus for student services and community advocacy. Reflecting the diversity of the population we serve, Frick is 56% African-American, 37% Latino, and 7% Asian-Pacific Islander. All students qualify for the free or reduced lunch program. Frick works relentlessly to earn its reputation as one of OUSD's rising stars of student success. Since 1999, Frick's API has increased 250 points. The 2011 API of 656 represented an increase of 23 points from 2010, a combined two year increase of 74 points. Frick prides itself on academic culture, a culturally responsive environment, cleanliness, and order. Students, parents, and visiting educators take pride in Frick's transformation into one of Oakland's finest full-service community schools. Frick has received awards for sustained growth and achievement. In 2011, Frick was recognized for Outstanding Latino Student Growth in Proficient and Advanced on the CST, Outstanding ELL growth in Math, Outstanding API Growth School Wide for ELL and Latino students. Staff have been recognized for excellence, including Teacher of the Year. Work from ELA and Math was instrumental in developing district-wide literacy initiatives, pilot programs, and the RTI process. For 2012-2013, Frick is committed to developing four areas: data-driven instruction, academic and non-academic programs, increasing parent involvement, and professional development. Teachers will continue to use data to differentiate instruction on the daily level. In Balanced Literacy, the continuation of Frick's work with Spring Board's pre-AP curriculum, school-wide adoption of strategies that maximize student-student interaction, and common engagement strategies across content areas ensure academic rigor. Thematic PE / Health units will test students' physical fitness and encourage positive social interaction through service projects. To bridge the gap between the school day and afterschool program, Frick will focus on coordinating literacy and STEM intervention to better support student needs. As with School 2 Home in 2011-2012, technology will be a centerpiece of Frick's vision of student growth and parent participation. Frick will increase parent involvement by hosting a Parent Day, having a School-Family Liaison, offering additional training for parents, and providing opportunities for nutrition / health programs. Students already have an established role planning events and Awards Assembly rallies, yet next year we will institute peer-mentoring programs and student-body leadership. To hold ourselves accountable, Frick will rely on three resources: our students / parents, staff, and

Page 2 of 23
established OUSD frameworks. Students and parents will be consulted through surveys and focus groups to assess their learning experiences and the cohesiveness of our school's mission and vision. District administrators, on site-coaches, and the ILT will monitor, critique, and offer constructive strategies to ensure that our goals are met in a timely, productive manner.
Student Enrollment Group Enrollment
Number of students 426
Black or African American 54.9%
American Indian or Alaska Native 0.0%
Asian 1.2%
Filipino 1.4%
Hispanic or Latino 37.3%
Native Hawaiian or Pacific Islander 3.3%
White 0.9%
Two or More Races 0.5%
Socioeconomically Disadvantaged 99.5%
English Learners 33.3%
Students with Disabilities 16.7%
Teachers Indicator Teachers
Teachers with full credential 26
Teachers without full credential 2
Teachers Teaching Outside Subject Area of Competence 0
Misassignments of Teachers of English Learners 0
Total Teacher Misassignments 0
Student Performance Subject Students Proficient and Above on STAR* Program Results
English-Language Arts 28%
Mathematics 19%
Science 47%
History-Social Science 32%*Standardized Testing and Reporting Program assessments used for accountability purposes include the California Standards Tests, the California Modified Assessment, and the California Alternate Performance Assessment.

Page 3 of 23
Academic Progress* Indicator Result
2012 Growth API Score (from 2012 Growth API Report) 645
Statewide Rank (from 2011 Base API Report) 1
Met All 2012 AYP Requirements no
Number of AYP Criteria Met Out of the Total Number of Criteria Possible Met 12 of 25
2012–13 Program Improvement Status (PI Year) Year 5*The Academic Performance Index is required under state law. Adequate Yearly Progress is required by federal law.
School Facilities Summary of Most Recent Site Inspection Overall the school is in good condition.
Repairs Needed Heating system has been repaired; some damage in gym and music wing repaired. Windows repaired. Damaged ceiling tiles repaired; some cracks and holes in walls in gyms pending; Exterior walls repaired. Exit signs repaired; lights repaired all over campus; some exit sign repair pending Soap dispensers repaired in various bathrooms.
Corrective Actions Taken or Planned Wellness Center to be completed in Spring 2011
Curriculum and Instructional Materials Core Curriculum Area Pupils Who Lack Textbooks and Instructional
Materials
Reading/Language Arts 0 Mathematics 0 Science 0 History-Social Science 0 Foreign Language 0 Health 0 Visual and Performing Arts 0 Science Laboratory Equipment (grades 9-12) 0
Page 4 of 23
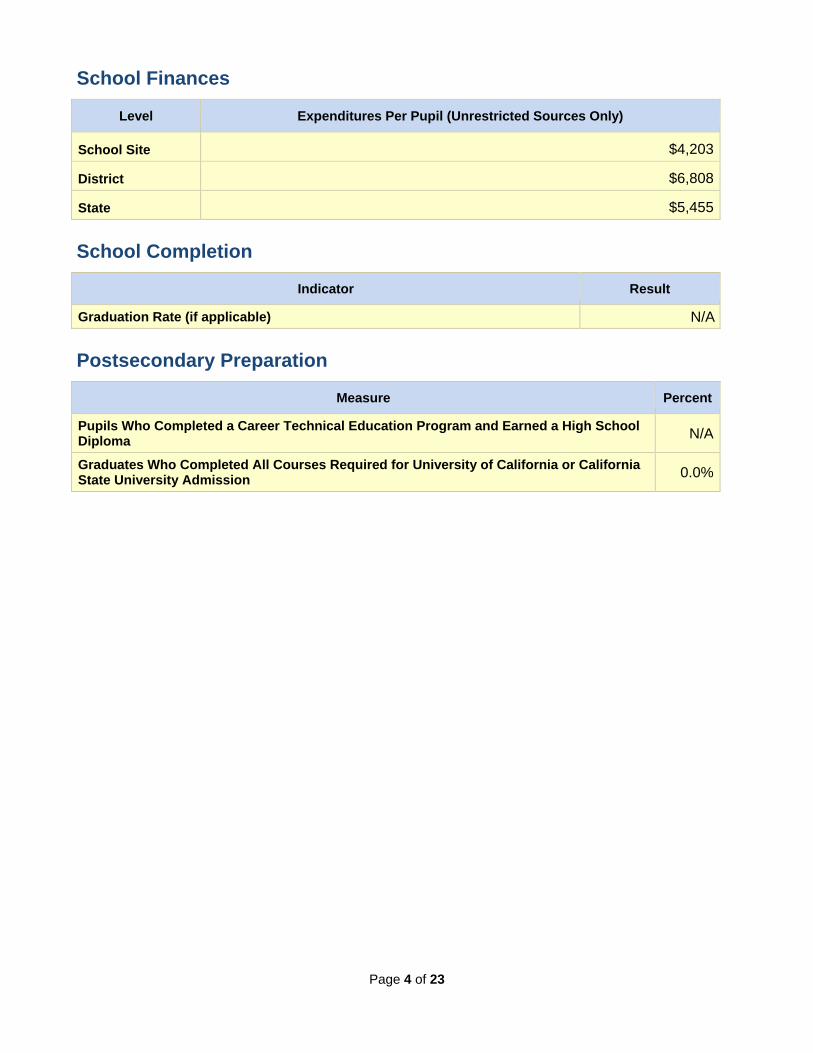
School Finances Level Expenditures Per Pupil (Unrestricted Sources Only)
School Site $4,203
District $6,808
State $5,455
School Completion Indicator Result
Graduation Rate (if applicable) N/A
Postsecondary Preparation Measure Percent
Pupils Who Completed a Career Technical Education Program and Earned a High School Diploma N/A
Graduates Who Completed All Courses Required for University of California or California State University Admission 0.0%
Page 5 of 23
School Accountability Report Card
Reported Using Data from the 2011–12 School Year
Published During 2012–13 Every school in California is required by state law to publish a School Accountability Report Card (SARC), by February 1 of each year. The SARC contains information about the condition and performance of each California public school.
• For more information about SARC requirements, see the California Department of Education (CDE) SARC Web page at http://www.cde.ca.gov/ta/ac/sa/.
• For additional information about the school, parents and community members should contact the school principal or the district office.
I. Data and Access Ed-Data Partnership Web Site Ed-Data is a partnership of the CDE, EdSource, and the Fiscal Crisis and Management Assistance Team (FCMAT) that provides extensive financial, demographic, and performance information about California’s public kindergarten through grade twelve school districts and schools.
DataQuest DataQuest is an online data tool located on the CDE DataQuest Web page at http://dq.cde.ca.gov/dataquest/ that contains additional information about this school and comparisons of the school to the district, the county, and the state. Specifically, DataQuest is a dynamic system that provides reports for accountability (e.g., state Academic Performance Index [API], federal Adequate Yearly Progress [AYP]), test data, enrollment, high school graduates, dropouts, course enrollments, staffing, and data regarding English learners.
Internet Access Internet access is available at public libraries and other locations that are publicly accessible (e.g., the California State Library). Access to the Internet at libraries and public locations is generally provided on a first-come, first-served basis. Other use restrictions may include the hours of operation, the length of time that a workstation may be used (depending on availability), the types of software programs available on a workstation, and the ability to print documents.

Page 6 of 23
II. About This School Contact Information (School Year 2012–13)
School District
School Name Frick Middle District Name Oakland Unified Street 2845 64th Ave. Phone Number (510) 879-8582 City, State, Zip Oakland, CA, 94605-2027 Web Site www.ousd.k12.ca.us Phone Number (510) 729-7736 Superintendent Anthony Smith Principal Jerome Gourdine, Principal E-mail Address [email protected] E-mail Address [email protected] CDS Code 01612596057020
School Description and Mission Statement (School Year 2011–12) Frick Middle School is a full service community school dedicated to the growth of every child's mind, body, and spirit. At Frick, students gain skills and knowledge to be successful scholars and citizens in high school and beyond. Our school serves the whole child through quality teachers and instruction, programs that extend learning beyond the school day, and a commitment to wellness / community. Frick's kings and queens are focused learners; our teachers are resilient and relentless in the pursuit of student growth. Teachers engage students with a variety of structures and methods, use data to drive lesson plans, engage with rigorous curriculum, have culturally relevant classroom environments, and collaborate as team members. Staff hold themselves accountable to high professional standards in ongoing professional development and inquiry cycles. Frick's programs foster independent-thinkers who apply academic skills to the real world. All programs have academic, experiential, and community components. During the school day Frick offers School 2 Home, Art Esteem, Leadership, Americorps mentoring, and extended academic time during Saturday School. Students gain invaluable computer literacy skills, exposure to art and music, and opportunities for supplemental academic instruction. Our thriving afterschool program offers academic support and engagement through sports, media editing, urban arts, bike shop, cheerleading, dance, and the Model UN. The after school program provides students with small-group academic support and hands-on learning. Other opportunities to link academics and real-world applications include Tech Bridge, Highland Hospital Volunteer Program, and Spark where students engage in off-campus enrichment in science, health-related, and other career-focused fields. The final component of Frick's vision is student wellness and community service. Frick supports physical, mental, emotional, and social wellness initiatives that ensure students' extra-academic needs are met. At Frick, we believe that no student can excel when their health receives mere "passing" grades. Nurse Burns, Mrs. Clay in PE, and physicians from Native American Health Services provide care for students' physical wellbeing. Students receive on-site check-ups, vision tests, and dental screenings at our newly constructed Health Center - eliminating the need for students to miss school days due to illness. In addition, our mental health team and programs like Brothers on the Rise, Teens on Target, TUPE, Aspire, and crisis counseling provide emotional and mental health services. Our students face great challenges outside the classroom, and mental health care is a key component in creating resilient students with the necessary tools to face the realities of life in Oakland. Social wellness and broader community engagement are present in site-based events such as Academic Awards Rallies, a Polynesian Culture festival, art exhibitions, After School Program Expo, dances, graduation, and Back to School Night. These events firmly ground Frick in the community through celebrating our community of students and staff.
Page 7 of 23
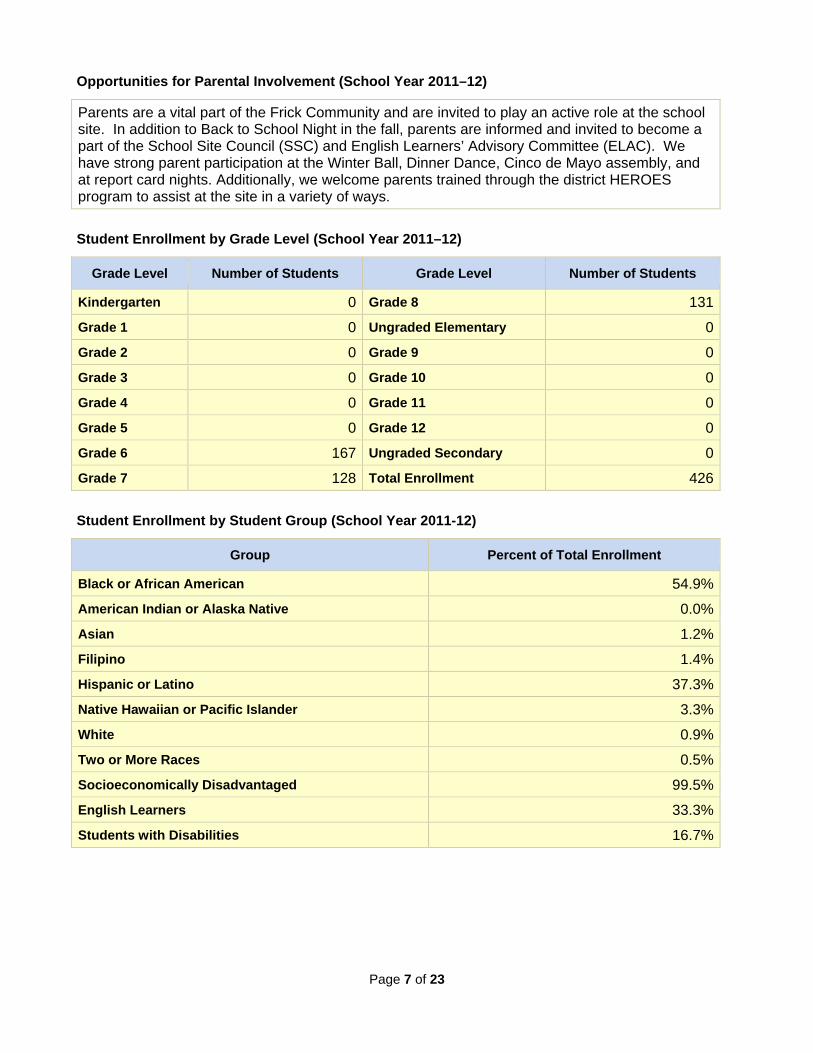
Opportunities for Parental Involvement (School Year 2011–12) Parents are a vital part of the Frick Community and are invited to play an active role at the school site. In addition to Back to School Night in the fall, parents are informed and invited to become a part of the School Site Council (SSC) and English Learners’ Advisory Committee (ELAC). We have strong parent participation at the Winter Ball, Dinner Dance, Cinco de Mayo assembly, and at report card nights. Additionally, we welcome parents trained through the district HEROES program to assist at the site in a variety of ways.
Student Enrollment by Grade Level (School Year 2011–12) Grade Level Number of Students Grade Level Number of Students
Kindergarten 0 Grade 8 131
Grade 1 0 Ungraded Elementary 0
Grade 2 0 Grade 9 0
Grade 3 0 Grade 10 0
Grade 4 0 Grade 11 0
Grade 5 0 Grade 12 0
Grade 6 167 Ungraded Secondary 0
Grade 7 128 Total Enrollment 426
Student Enrollment by Student Group (School Year 2011-12) Group Percent of Total Enrollment
Black or African American 54.9%
American Indian or Alaska Native 0.0%
Asian 1.2%
Filipino 1.4%
Hispanic or Latino 37.3%
Native Hawaiian or Pacific Islander 3.3%
White 0.9%
Two or More Races 0.5%
Socioeconomically Disadvantaged 99.5%
English Learners 33.3%
Students with Disabilities 16.7%

Page 8 of 23
Average Class Size and Class Size Distribution (Secondary)
Subject Avg. Class Size
2009–10 Number of Classes* Avg.
Class Size
2010–11 Number of Classes* Avg.
Class Size
2011–12 Number of Classes*
1-22
23-32 33+ 1-
22 23-32 33+ 1-
22 23-32 33+
English 18.5 14 13 20.6 9 5 0 22.3 2 10 0
Mathematics 17.2 24 11 21.1 8 7 0 22.6 4 10 0
Science 20.1 10 9 21.3 7 6 0 24.6 1 9 0 Social Science 19.6 9 12 22.3 6 6 0 24.6 2 8 0
* Number of classes indicates how many classrooms fall into each size category (a range of total students per classroom). At the secondary school level, this information is reported by subject area rather than grade level.

Page 9 of 23
III. School Climate School Safety Plan (School Year 2011–12) The school reviewed, revised and submitted to the Board in 11-12 an updated Safety Plan that ncluded: school site safety programs, procedures for complying with school safety laws, and Disaster/Emergency/Crisis Response procedures.
Suspensions and Expulsions
Rate* School 2009–10
School 2010–11
School 2011–12
District 2009–10
District 2010–11
District 2011–12
Suspensions 66.51% 62.41% 23.2% 14.16% 12.26% 14.8%
Expulsions 0.23% 0.00% 0.0% 0.16% 0.19% 0.1% * The rate of suspensions and expulsions is calculated by dividing the total number of incidents by the total enrollment.

Page 10 of 23
IV. School Facilities School Facility Conditions and Planned Improvements (School Year 2012–13)
- Data provided by Department of Facilities on November 13, 2012 Overall the school is in good condition. Regular maintenance continued per below: Heating system has been repaired; some damage in gym and music wing repaired. Windows repaired. Damaged ceiling tiles repaired; some cracks and holes in walls in gyms pending; Exterior walls repaired. Exit signs repaired; lights repaired all over campus; some exit sign repair pending Soap dispensers repaired in various bathrooms.
School Facility Good Repair Status (School Year 2012–13)
System Inspected Repair Status Repair Needed and
Action Taken or Planned Exemplary Good Fair Poor
Systems: Gas Leaks, Mechanical/HVAC, Sewer X
Interior: Interior Surfaces X New floor in multi purpose room
Cleanliness: Overall Cleanliness, Pest/ Vermin Infestation X Electrical: Electrical X Restrooms/Fountains: Restrooms, Sinks/ Fountains X Safety: Fire Safety, Hazardous Materials X Structural: Structural Damage, Roofs X External: Playground/School Grounds, Windows/ Doors/Gates/Fences X Overall Rating GoodNote: Cells shaded in black do not require data.

Page 11 of 23
V. Teachers Teacher Credentials
Teachers School 2009–10
School 2010–11
School 2011–12
District 2011–12
With Full Credential 20 25 26 1835
Without Full Credential 6 1 2 128 Teaching Outside Subject Area of Competence (with full credential) 0 0 0 N/A
Teacher Misassignments and Vacant Teacher Positions
Indicator 2010–11 2011–12 2012–13
Misassignments of Teachers of English Learners 0 0
Total Teacher Misassignments* 0 0
Vacant Teacher Positions 0 0 Note: “Misassignments” refers to the number of positions filled by teachers who lack legal authorization to teach that grade level, subject area, student group, etc. * Total Teacher Misassignments includes the number of Misassignments of Teachers of English Learners.
Core Academic Classes Taught by Highly Qualified Teachers (School Year 2011–12) The Federal Elementary and Secondary Education Act (ESEA), also known as No Child Left Behind (NCLB), requires that core academic subjects be taught by Highly Qualified Teachers, defined as having at least a bachelor’s degree, an appropriate California teaching credential, and demonstrated core academic subject area competence. For more information, see the CDE Improving Teacher and Principal Quality Web page at: http://www.cde.ca.gov/nclb/sr/tq/
Location of Classes
Percent of Classes In Core Academic Subjects Taught by Highly Qualified
Teachers
Percent of Classes In Core Academic Subjects Not Taught by Highly
Qualified Teachers
This School 100.00% 0.00%All Schools in District 93.81% 6.19%
High-Poverty Schools in District
93.71% 6.29%
Low-Poverty Schools in District
97.79% 2.21%
Note: High-poverty schools are defined as those schools with student eligibility of approximately 40 percent or more in the free and reduced price meals program. Low-poverty schools are those with student eligibility of approximately 25 percent or less in the free and reduced price meals program.

Page 12 of 23
VI. Support Staff Academic Counselors and Other Support Staff (School Year 2011–12)
Title Number of FTE* Assigned to School
Average Number of Students per Academic Counselor
Academic Counselor 0 Counselor (Social/Behavioral or Career Development) 0 Library Media Teacher (librarian) 0 Library Media Services Staff (paraprofessional) 0 Psychologist 0
Social Worker 0
Nurse 0
Speech/Language/Hearing Specialist 0
Resource Specialist (non-teaching) 3
Other 15 Note: Cells shaded in black do not require data. * One Full-Time Equivalent (FTE) equals one staff member working full-time; one FTE could also represent two staff members who each work 50 percent of full-time.

Page 13 of 23
VII. Curriculum and Instructional Materials
Quality, Currency, Availability of Textbooks and Instructional Materials (School Year 2012–13)
This section describes whether the textbooks and instructional materials used at the school are from the most recent adoption; whether there are sufficient textbooks and instruction materials for each student; and information about the school’s use of any supplemental curriculum or non-adopted textbooks or instructional materials. Year and month in which data were collected: ___October 2012______________
Core Curriculum Area Textbooks and instructional materials/year of adoption
From most recent adoption?
Percent students lacking own
assigned copy
Reading/Language Arts 2000 Yes 0%
Mathematics 2009 Yes 0%
Science 2007 Yes 0%
History-Social Science 2006 (Grade 4 -12) 2007 (Grade k -3)
Yes 0%
Foreign Language N/A Yes 0%
Health N/A Yes 0%
Visual and Performing Arts N/A Yes 0%
Science Laboratory Equipment (grades 9-12) N/A Yes 0%

Page 14 of 23
VIII. School Finances Expenditures Per Pupil and School Site Teacher Salaries (Fiscal Year 2010–11)
Level Total
Expenditures Per Pupil
Expenditures Per Pupil
(Supplemental / Restricted)
Expenditures Per Pupil (Basic / Unrestricted)
Average Teacher Salary
School Site $8,441.85 $3,346 $4,203 $53,846
District $6,808 $54,035
Percent Difference – School
Site and District -38.27% 0%
State $5,455 $68,835
Percent Difference – School
Site and State -23% -22%
Note: Cells shaded in black do not require data. Supplemental/Restricted expenditures come from money whose use is controlled by law or by a donor. Money that is designated for specific purposes by the district or governing board is not considered restricted. Basic/unrestricted expenditures are from money whose use, except for general guidelines, is not controlled by law or by a donor. For detailed information on school expenditures for all districts in California, see the CDE Current Expense of Education & Per-pupil Spending Web page at http://www.cde.ca.gov/ds/fd/ec/. For information on teacher salaries for all districts in California, see the CDE Certificated Salaries & Benefits Web page at http://www.cde.ca.gov/ds/fd/cs/. To look up expenditures and salaries for a specific school district, see the Ed-Data Web site at: http://www.ed-data.org.
Types of Services Funded (Fiscal Year 2011–12) This school strategically allocates its resources to support professional development for teachers and inside and outside of classroom intervention and extracurricular opportunities for students. Specifically, the school served 251 students in the after school programs, worked with Safe Passages and had 2 part time coaches for classroom management.
Page 15 of 23
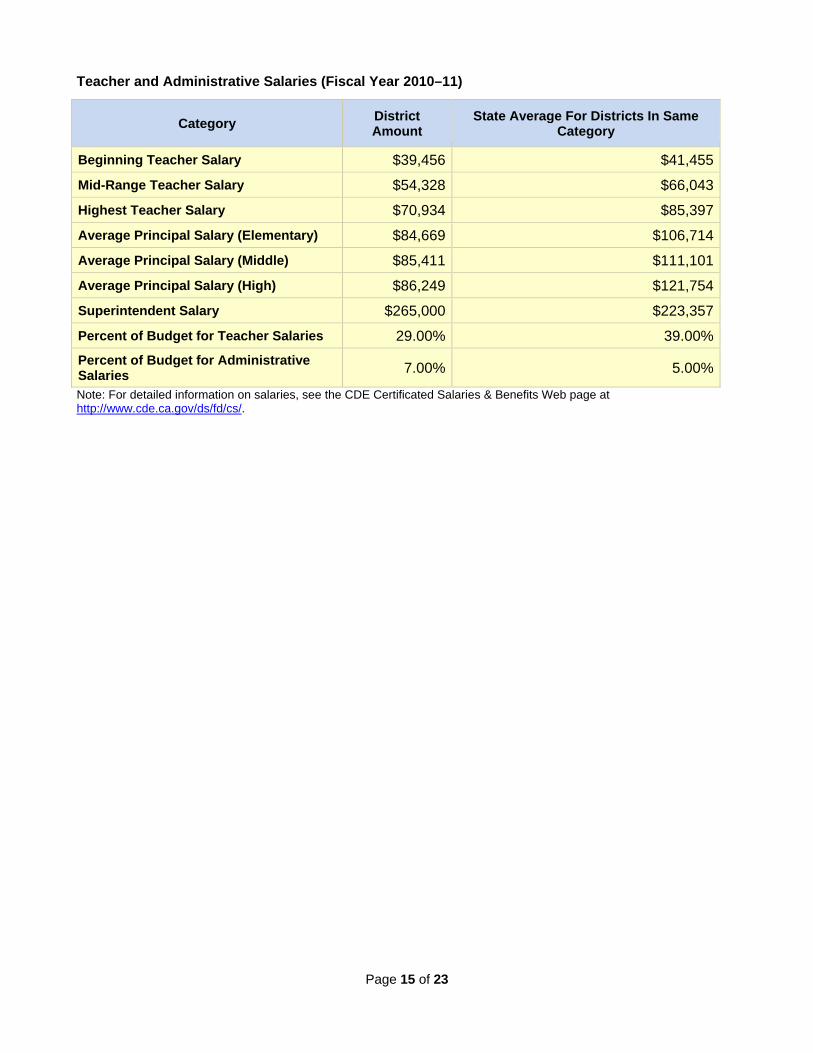
Teacher and Administrative Salaries (Fiscal Year 2010–11)
Category District Amount
State Average For Districts In Same Category
Beginning Teacher Salary $39,456 $41,455
Mid-Range Teacher Salary $54,328 $66,043
Highest Teacher Salary $70,934 $85,397
Average Principal Salary (Elementary) $84,669 $106,714
Average Principal Salary (Middle) $85,411 $111,101
Average Principal Salary (High) $86,249 $121,754
Superintendent Salary $265,000 $223,357
Percent of Budget for Teacher Salaries 29.00% 39.00%Percent of Budget for Administrative Salaries 7.00% 5.00%
Note: For detailed information on salaries, see the CDE Certificated Salaries & Benefits Web page at http://www.cde.ca.gov/ds/fd/cs/.
Page 16 of 23
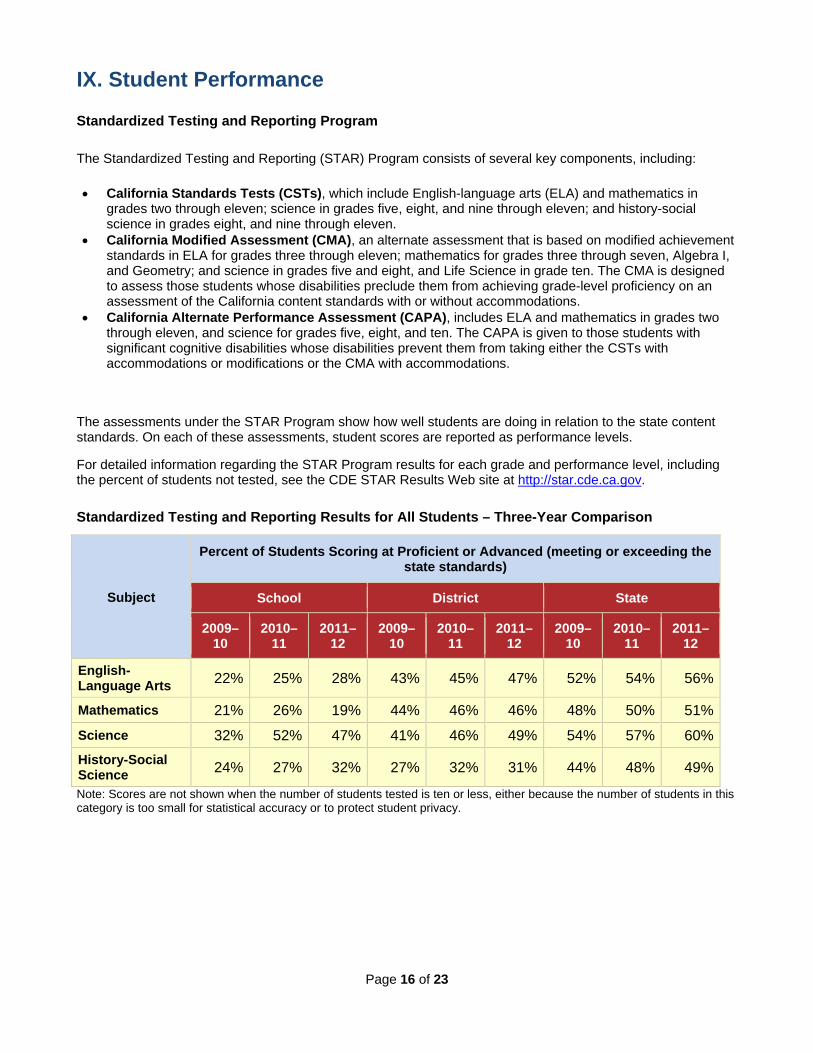
IX. Student Performance Standardized Testing and Reporting Program The Standardized Testing and Reporting (STAR) Program consists of several key components, including:
• California Standards Tests (CSTs), which include English-language arts (ELA) and mathematics in grades two through eleven; science in grades five, eight, and nine through eleven; and history-social science in grades eight, and nine through eleven.
• California Modified Assessment (CMA), an alternate assessment that is based on modified achievement standards in ELA for grades three through eleven; mathematics for grades three through seven, Algebra I, and Geometry; and science in grades five and eight, and Life Science in grade ten. The CMA is designed to assess those students whose disabilities preclude them from achieving grade-level proficiency on an assessment of the California content standards with or without accommodations.
• California Alternate Performance Assessment (CAPA), includes ELA and mathematics in grades two through eleven, and science for grades five, eight, and ten. The CAPA is given to those students with significant cognitive disabilities whose disabilities prevent them from taking either the CSTs with accommodations or modifications or the CMA with accommodations.
The assessments under the STAR Program show how well students are doing in relation to the state content standards. On each of these assessments, student scores are reported as performance levels. For detailed information regarding the STAR Program results for each grade and performance level, including the percent of students not tested, see the CDE STAR Results Web site at http://star.cde.ca.gov.
Standardized Testing and Reporting Results for All Students – Three-Year Comparison
Subject
Percent of Students Scoring at Proficient or Advanced (meeting or exceeding the state standards)
School District State
2009–10
2010–11
2011–12
2009–10
2010–11
2011–12
2009–10
2010–11
2011–12
English-Language Arts 22% 25% 28% 43% 45% 47% 52% 54% 56%
Mathematics 21% 26% 19% 44% 46% 46% 48% 50% 51%
Science 32% 52% 47% 41% 46% 49% 54% 57% 60%History-Social Science 24% 27% 32% 27% 32% 31% 44% 48% 49%
Note: Scores are not shown when the number of students tested is ten or less, either because the number of students in this category is too small for statistical accuracy or to protect student privacy.

Page 17 of 23
Standardized Testing and Reporting Results by Student Group – Most Recent Year
Group
Percent of Students Scoring at Proficient or Advanced
English- Language Arts Mathematics Science History- Social
Science
All Students in the LEA 47% 46% 49% 31%
All Students at the School 28% 19% 47% 32%
Male 25% 15% 48% 28%
Female 31% 22% 46% 36%
Black or African American 23% 10% 38% 17%American Indian or Alaska Native Asian 0% 0% 0% 0%
Filipino 0% 0% 0% 0%
Hispanic or Latino 35% 28% 56% 44%
Native Hawaiian or Pacific Islander 36% 36% 0% 0%
White 0% 0% 0% 0%
Two or More Races 0% 0% 0% 0%
Socioeconomically Disadvantaged 26% 18% 42% 34%
English Learners 7% 16% 17% 7%
Students with Disabilities 16% 9% 0% 12%Students Receiving Migrant Education Services 0% 0% 0% 0%
Note: Scores are not shown when the number of students tested is ten or less, either because the number of students in this category is too small for statistical accuracy or to protect student privacy.

Page 18 of 23
California High School Exit Examination The California High School Exit Examination (CAHSEE) is primarily used as a graduation requirement. However, the grade ten results of this exam are also used to establish the percentages of students at three proficiency levels (not proficient, proficient, or advanced) in ELA and mathematics to compute AYP designations required by the federal ESEA, also known as NCLB. For detailed information regarding CAHSEE results, see the CDE CAHSEE Web site at http://cahsee.cde.ca.gov/.
California High School Exit Examination Results for All Grade Ten Students – Three-Year Comparison (if applicable)
Subject
Percent of Students Scoring at Proficient or Advanced
School District State
2009–10
2010–11
2011–12
2009–10
2010–11
2011–12
2009–10
2010–11
2011–12
English-Language Arts 35% 40% 39% 54% 59% 56%
Mathematics 36% 40% 44% 54% 56% 58%Note: Scores are not shown when the number of students tested is ten or less, either because the number of students in this category is too small for statistical accuracy or to protect student privacy.

Page 19 of 23
California High School Exit Examination Grade Ten Results by Student Group – Most Recent Year (if applicable)
Group
English-Language Arts Mathematics
Not Proficient Proficient Advanced Not
Proficient Proficient Advanced
All Students in the LEA 61% 18% 22% 56% 28% 16%All Students at the School Male Female Black or African American American Indian or Alaska Native Asian Filipino Hispanic or Latino Native Hawaiian or Pacific Islander White Two or More Races Socioeconomically Disadvantaged
English Learners Students with Disabilities Students Receiving Migrant Education Services
Note: Scores are not shown when the number of students tested is ten or less, either because the number of students in this category is too small for statistical accuracy or to protect student privacy.
California Physical Fitness Test Results (School Year 2011–12)
The California Physical Fitness Test (PFT) is administered to students in grades five, seven, and nine only. This table displays by grade level the percent of students meeting the fitness standards for the most recent testing period. For detailed information regarding this test, and comparisons of a school’s test results to the district and state, see the CDE PFT Web page at http://www.cde.ca.gov/ta/tg/pf/.
Grade Level Percent of Students Meeting Fitness Standards
Four of Six Standards Five of Six Standards Six of Six Standards
5 0.00% 0.00% 0.00%
7 34.00% 14.20% 6.60%
9 0.00% 0.00% 0.00%Note: Scores are not shown when the number of students tested is ten or less, either because the number of students in this category is too small for statistical accuracy or to protect student privacy.
Page 20 of 23
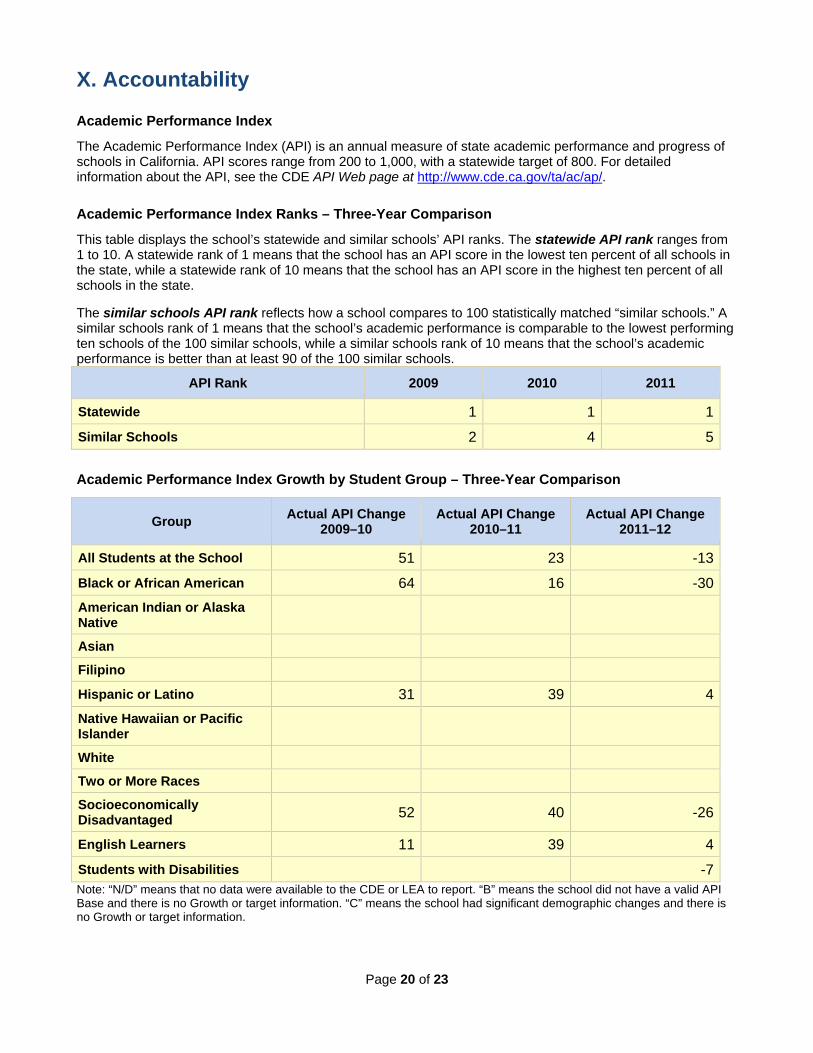
X. Accountability Academic Performance Index The Academic Performance Index (API) is an annual measure of state academic performance and progress of schools in California. API scores range from 200 to 1,000, with a statewide target of 800. For detailed information about the API, see the CDE API Web page at http://www.cde.ca.gov/ta/ac/ap/.
Academic Performance Index Ranks – Three-Year Comparison This table displays the school’s statewide and similar schools’ API ranks. The statewide API rank ranges from 1 to 10. A statewide rank of 1 means that the school has an API score in the lowest ten percent of all schools in the state, while a statewide rank of 10 means that the school has an API score in the highest ten percent of all schools in the state. The similar schools API rank reflects how a school compares to 100 statistically matched “similar schools.” A similar schools rank of 1 means that the school’s academic performance is comparable to the lowest performing ten schools of the 100 similar schools, while a similar schools rank of 10 means that the school’s academic performance is better than at least 90 of the 100 similar schools.
API Rank 2009 2010 2011
Statewide 1 1 1
Similar Schools 2 4 5
Academic Performance Index Growth by Student Group – Three-Year Comparison
Group Actual API Change 2009–10
Actual API Change 2010–11
Actual API Change 2011–12
All Students at the School 51 23 -13
Black or African American 64 16 -30American Indian or Alaska Native Asian Filipino Hispanic or Latino 31 39 4Native Hawaiian or Pacific Islander White Two or More Races Socioeconomically Disadvantaged 52 40 -26
English Learners 11 39 4
Students with Disabilities -7Note: “N/D” means that no data were available to the CDE or LEA to report. “B” means the school did not have a valid API Base and there is no Growth or target information. “C” means the school had significant demographic changes and there is no Growth or target information.

Page 21 of 23
Academic Performance Index Growth by Student Group – 2012 Growth API Comparison This table displays, by student group, the number of students included in the API and the 2012 Growth API at the school, LEA, and state level.
Group
2012 Growth API
Number of Students School Number of
Students LEA Number of Students State
All Students at the School 377 645 25,919 730 4,664,264 788
Black or African American 208 604 8,018 655 313,201 710American Indian or Alaska Native 0 91 702 31,606 742
Asian 5 4,029 826 404,670 905
Filipino 4 243 808 124,824 869
Hispanic or Latino 143 683 9,975 701 2,425,230 740Native Hawaiian or Pacific Islander 13 723 309 675 26,563 775
White 1 2,458 900 1,221,860 853
Two or More Races 2 529 869 88,428 849Socioeconomically Disadvantaged 254 647 16,312 692 2,779,680 737
English Learners 126 659 10,835 701 1,530,297 716
Students with Disabilities 60 470 2,741 558 530,935 607

Page 22 of 23
Adequate Yearly Progress The federal ESEA requires that all schools and districts meet the following Adequate Yearly Progress (AYP) criteria:
• Participation rate on the state’s standards-based assessments in ELA and mathematics • Percent proficient on the state’s standards-based assessments in ELA and mathematics • API as an additional indicator • Graduation rate (for secondary schools)
For detailed information about AYP, including participation rates and percent proficient results by student group, see the CDE AYP Web page at http://www.cde.ca.gov/ta/ac/ay/.
Adequate Yearly Progress Overall and by Criteria (School Year 2011–12) AYP Criteria School District
Made AYP Overall No No
Met Participation Rate - English-Language Arts Yes Yes
Met Participation Rate - Mathematics Yes Yes
Met Percent Proficient - English-Language Arts No No
Met Percent Proficient - Mathematics No No
Met API Criteria No Yes
Met Graduation Rate N/A No
Federal Intervention Program (School Year 2012–13) Schools and districts receiving federal Title I funding enter Program Improvement (PI) if they do not make AYP for two consecutive years in the same content area (ELA or mathematics) or on the same indicator (API or graduation rate). After entering PI, schools and districts advance to the next level of intervention with each additional year that they do not make AYP. For detailed information about PI identification, see the CDE PI Status Determinations Web page: http://www.cde.ca.gov/ta/ac/ay/tidetermine.asp.
Indicator School District
Program Improvement Status In PI In PI
First Year of Program Improvement 2004-2005 2004-2005
Year in Program Improvement Year 5 Year 3
Number of Schools Currently in Program Improvement 84
Percent of Schools Currently in Program Improvement 63.6% Note: Cells shaded in black do not require data.

Page 23 of 23
XI. School Completion and Postsecondary Preparation Not applicable for Middle Schools XII. Instructional Planning and Scheduling Professional Development This section provides information on the annual number of school days dedicated to staff development for the most recent three-year period. Frick Middle School encourages professional development among its entire staff. This includes summer retreats, in-services, conferences, additional course work, and peer-learning relationships. There are 3 full school days of professional development each year, and every Wednesday for one hour and a half. The in-service time is spent largely in Professional Learning Communities in which teachers teaching the same subject create common assessments, discuss student work, and plan interventions. In addition, teachers have additional collaboration time during monthly department and grade-level meetings. Support is provided to teachers who are working on improving their practice by a site instructional facilitator and a math coach. In addition, administrators observe classes and offer teachers additional support when necessary.
Frick Middle School Accountability Report Card, 2011-2012Oakland Unified Provided by the Ed-Data Partnership
For more information visit www.ed-data.org