state accountability report card
TRANSCRIPT

State Accountability Report Card
Reported Using Data from the 2018–19 School Year
The federal Elementary and Secondary Education Act (also referred to as ESEA) requires each state to produce an annual report card that summarizes data of
students statewide and disaggregated by student groups.
On December 10, 2015, President Obama signed the bipartisan Every Student Succeeds Act (also referred to as ESSA), which reauthorizes the ESEA of 1965, and
requires states to have a new multiple measures accountability system in effect by 2017–18.
The recent enactment of the ESSA gives states greater discretion to implement academic content standards, administer statewide and local assessments, and set ambitious performance goals to direct evidence-based improvement strategies and
interventions to improve student performance. ESSA requires each state to continue to implement the state report card requirements specified under Title I, Part A of the
ESEA, as amended by No Child Left Behind.
For further information regarding the ESSA, visit the U.S. Department of Education ESSA web page at https://www2.ed.gov/policy/elsec/leg/essa/index.html.
On September 8, 2016, the State Board of Education adopted a new accountability system and first released the California School Dashboard, referred to as the
Dashboard, in Spring 2017. The Dashboard shows how districts and schools are performing on test scores, graduation rates, and other measures of student success.
Questions about the State Accountability Report Card (also referred to as STARC) may be directed to the Data Visualization and Reporting Office
by phone at 916-319-0406.
California Department of Education Updated August 2021

Page 2 of 19
Accountability
2019 California School Dashboard Accountability System
The federal Elementary and Secondary Education Act (also referred to as ESEA) no longer requires states to produce Adequate Yearly Progress (also referred to as AYP), but requires states to develop a new accountability system by 2017–18. The California School Dashboard (also referred to as the Dashboard) was first released in Spring 2017.
The Dashboard was produced for California’s 10,000 public schools in over 1,000 local educational agencies1 (also referred to as LEAs). The Dashboard is California’s new accountability system that is based on multiple measures. These measures are used to determine LEA and school progress toward meeting the needs of their students. The measures are based on factors that contribute to a quality education, including high school graduation rates, college/career readiness, student test scores, English learner (also referred to as EL) progress, suspension rates, and parent engagement. In the Dashboard, charter schools’ (local funded and direct funded) data are not “rolled up” or included in the LEA-level data.
To view LEA and school information provided on the Dashboard, visit the California School Dashboard and System of Support web page at https://www.cde.ca.gov/ta/ac/cm/.
The Technical Guide to the 2019 California School Dashboard is located at https://www.cde.ca.gov/ta/ac/cm/documents/dashboardguide19.pdf.
1 A local educational agency (also referred to as LEA) is a school district or a county office of education.
Page 3 of 19
State Graduation Rate
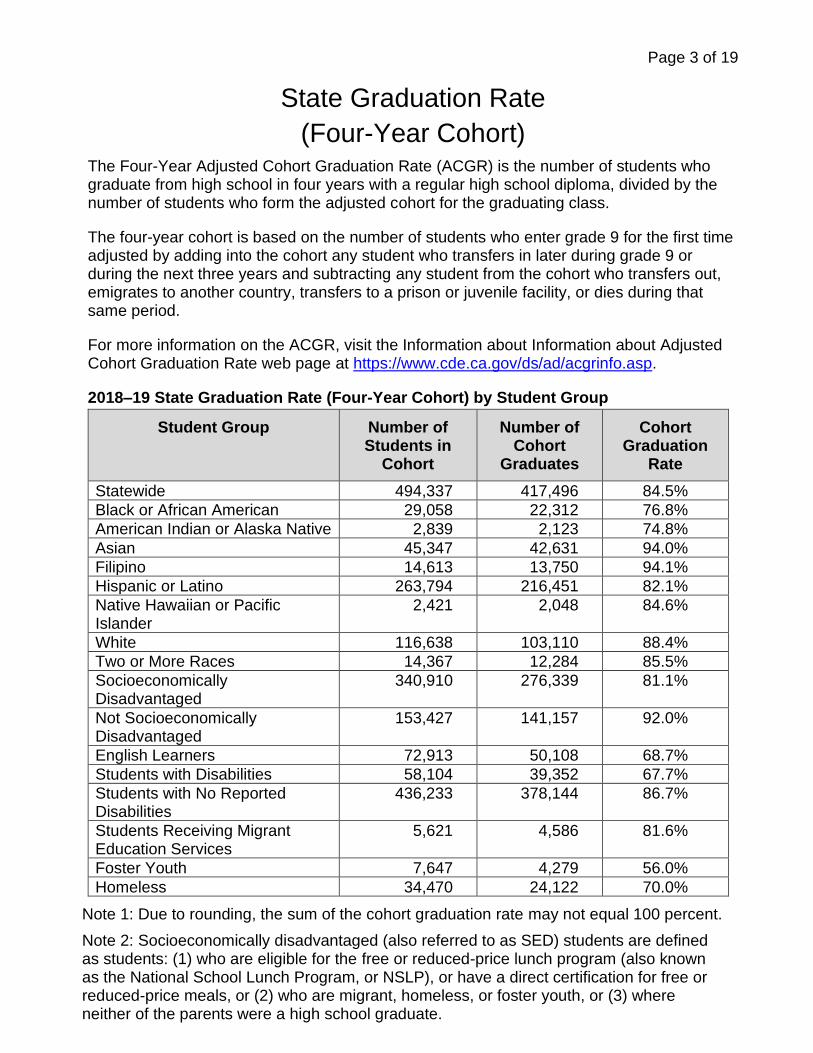
(Four-Year Cohort) The Four-Year Adjusted Cohort Graduation Rate (ACGR) is the number of students who graduate from high school in four years with a regular high school diploma, divided by the number of students who form the adjusted cohort for the graduating class.
The four-year cohort is based on the number of students who enter grade 9 for the first time adjusted by adding into the cohort any student who transfers in later during grade 9 or during the next three years and subtracting any student from the cohort who transfers out, emigrates to another country, transfers to a prison or juvenile facility, or dies during that same period.
For more information on the ACGR, visit the Information about Information about Adjusted Cohort Graduation Rate web page at https://www.cde.ca.gov/ds/ad/acgrinfo.asp.
2018–19 State Graduation Rate (Four-Year Cohort) by Student Group
Student Group Number of Students in
Cohort
Number of Cohort
Graduates
Cohort Graduation
Rate
Statewide 494,337 417,496 84.5%
Black or African American 29,058 22,312 76.8%
American Indian or Alaska Native 2,839 2,123 74.8%
Asian 45,347 42,631 94.0%
Filipino 14,613 13,750 94.1%
Hispanic or Latino 263,794 216,451 82.1%
Native Hawaiian or Pacific Islander
2,421 2,048 84.6%
White 116,638 103,110 88.4%
Two or More Races 14,367 12,284 85.5%
Socioeconomically Disadvantaged
340,910 276,339 81.1%
Not Socioeconomically Disadvantaged
153,427 141,157 92.0%
English Learners 72,913 50,108 68.7%
Students with Disabilities 58,104 39,352 67.7%
Students with No Reported Disabilities
436,233 378,144 86.7%
Students Receiving Migrant Education Services
5,621 4,586 81.6%
Foster Youth 7,647 4,279 56.0%
Homeless 34,470 24,122 70.0%
Note 1: Due to rounding, the sum of the cohort graduation rate may not equal 100 percent.
Note 2: Socioeconomically disadvantaged (also referred to as SED) students are defined as students: (1) who are eligible for the free or reduced-price lunch program (also known as the National School Lunch Program, or NSLP), or have a direct certification for free or reduced-price meals, or (2) who are migrant, homeless, or foster youth, or (3) where neither of the parents were a high school graduate.
Page 4 of 19
School Improvement Funds
The ESSA requires the California Department of Education (CDE) to determine school eligibility for comprehensive support and improvement (CSI) (ESSA Section 1003 funds) based on the criteria in California’s ESSA State Plan. This requirement went into effect for the first time in the 2018–19 school year. Schools were selected for the first time in January 2019 based on the 2018 California School Dashboard.
California’s ESSA State plan defines LEAs as school districts, county offices of education (COEs), and direct-funded charter schools.
The ESSA requires LEAs with schools that meet the criteria for CSI must partner with stakeholders to locally develop and implement a plan to improve student outcomes.
COEs that have LEAs within their county that serve schools eligible for CSI are required to:
• Support LEAs to meaningfully address the CSI prompts in the Plan Summary of the Local Control and Accountability Plan (LCAP) related to CSI activities.
• Review and approve the CSI prompts in the LEA LCAP Plan Summary.
For more information on the CSI visit the Comprehensive Support and Improvement web page at https://www.cde.ca.gov/sp/sw/t1/csi.asp.
2018–19 LEAs with School Improvement Funds
The 2018–19 LEAs with School Improvement Funds data is available within each 2018–19 LEA Accountability Report Card (LARC). The LARCs are located on the Local Educational Agency Accountability Report Card web page at https://www.cde.ca.gov/ta/ac/le/.
Page 5 of 19
California Assessment of Student Performance and Progress
The California Assessment of Student Performance and Progress (also referred to as CAASPP) System was established on January 1, 2014. The CAASPP System replaced the Standardized Testing and Reporting Program, which became inoperative on July 1, 2013.
California has adopted more rigorous academic standards that emphasize not only subject knowledge, but also the critical thinking, analytical writing, and problem-solving skills students need to be successful in college and career. These standards set a higher bar for California students to help ensure they are prepared to succeed in the future.
The primary purpose of the CAASPP System is to assist teachers, administrators, students, and parents by promoting high-quality teaching and learning through the use of a variety of assessment approaches and item types.
The CAASPP System encompasses the following assessments and student participation requirements:
1. Smarter Balanced Summative Assessments and California Alternative Assessments (also referred to as CAAs) for English language arts/literacy (also referred to as ELA) in grades three through eight and grade eleven.
2. Smarter Balanced Summative Assessments and CAAs for mathematics in grades three through eight and grade eleven.
3. California Science Test (also referred to as CAST) and CAAs for Science in grades five, eight, and once in high school (i.e., grade ten, eleven, or twelve).
Further CAASPP information can be found on the California Department of Education (also referred to as CDE) CAASPP System web page at https://www.cde.ca.gov/ta/tg/ca/.
The Smarter Balanced Summative Assessments are comprehensive end-of-year assessments for ELA and mathematics that are aligned with the Common Core State Standards (also referred to as CCSS) for ELA and mathematics of grade-level learning that measure progress toward college and career readiness.
Information on the Smarter Balanced Summative Assessments can be found at the CDE Smarter Balanced Summative Assessments web page at https://www.cde.ca.gov/ta/tg/sa/sbacsummative.asp.
CAA items are aligned with alternate achievement standards, which are linked with the CCSS for students with significant cognitive disabilities. The CAA was field tested during the 2014–15 school year and became operational during the 2015–16 school year.
Further CAA information can be found on the CDE California Alternative Assessments for ELA and Math web page at https://www.cde.ca.gov/ta/tg/ca/altassessment.asp.
The CDE developed a new science assessment called CAST based on the Next Generation Science Standards for California Public Schools (CA NGSS). The new CAST is aligned with these standards.

Page 6 of 19
Science assessments include both the CAST and the CAA for Science for students with an Individualized Education Program designating an alternate assessment. Students take the CAST or CAA for Science assessment in grades five, eight, and once in high school (i.e., grade ten, eleven, or twelve). The CAST was administered operationally during the 2018–19 school year. The 2018–19 field test administration of CAA for Science was a census administration and will not be included in the 2018–19 STARC. These data will be included in the 2019–20 STARC.
Information about the CAASPP System science assessments can be found at the CDE California Science Test web page at https://www.cde.ca.gov/ta/tg/ca/caasppscience.asp.
The data displayed in the State Accountability Report Card (also referred to as STARC) may differ from other data sources because the inclusion and exclusion rules are different for the STARC.
Page 7 of 19
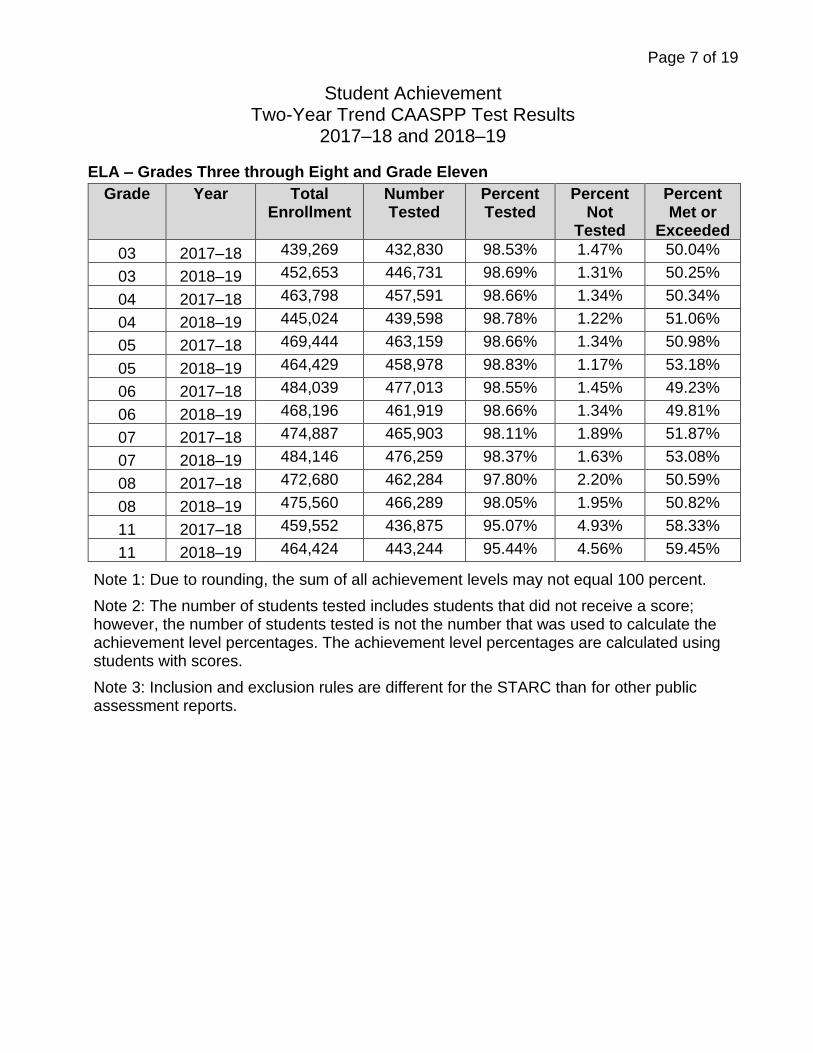
Student Achievement Two-Year Trend CAASPP Test Results
2017–18 and 2018–19
ELA – Grades Three through Eight and Grade Eleven
Grade Year Total Enrollment
Number Tested
Percent Tested
Percent Not
Tested
Percent Met or
Exceeded
03 2017–18 439,269 432,830 98.53% 1.47% 50.04%
03 2018–19 452,653 446,731 98.69% 1.31% 50.25%
04 2017–18 463,798 457,591 98.66% 1.34% 50.34%
04 2018–19 445,024 439,598 98.78% 1.22% 51.06%
05 2017–18 469,444 463,159 98.66% 1.34% 50.98%
05 2018–19 464,429 458,978 98.83% 1.17% 53.18%
06 2017–18 484,039 477,013 98.55% 1.45% 49.23%
06 2018–19 468,196 461,919 98.66% 1.34% 49.81%
07 2017–18 474,887 465,903 98.11% 1.89% 51.87%
07 2018–19 484,146 476,259 98.37% 1.63% 53.08%
08 2017–18 472,680 462,284 97.80% 2.20% 50.59%
08 2018–19 475,560 466,289 98.05% 1.95% 50.82%
11 2017–18 459,552 436,875 95.07% 4.93% 58.33%
11 2018–19 464,424 443,244 95.44% 4.56% 59.45%
Note 1: Due to rounding, the sum of all achievement levels may not equal 100 percent.
Note 2: The number of students tested includes students that did not receive a score; however, the number of students tested is not the number that was used to calculate the achievement level percentages. The achievement level percentages are calculated using students with scores.
Note 3: Inclusion and exclusion rules are different for the STARC than for other public assessment reports.

Page 8 of 19
Mathematics – Grades Three through Eight and Grade Eleven
Grade Year Total Enrollment
Number Tested
Percent Tested
Percent Not
Tested
Percent Met or
Exceeded
03 2017–18 442,977 436,105 98.45% 1.55% 50.87%
03 2018–19 456,678 450,310 98.61% 1.39% 52.10%
04 2017–18 467,446 460,770 98.57% 1.43% 44.61%
04 2018–19 448,949 443,049 98.69% 1.31% 46.60%
05 2017–18 472,764 466,009 98.57% 1.43% 37.31%
05 2018–19 467,987 462,008 98.72% 1.28% 39.23%
06 2017–18 487,078 479,429 98.43% 1.57% 38.68%
06 2018–19 471,591 464,676 98.53% 1.47% 39.77%
07 2017–18 478,018 468,346 97.98% 2.02% 38.66%
07 2018–19 487,692 478,926 98.20% 1.80% 39.28%
08 2017–18 475,310 463,885 97.60% 2.40% 38.08%
08 2018–19 478,538 468,104 97.82% 2.18% 37.88%
11 2017–18 461,870 436,798 94.57% 5.43% 32.78%
11 2018–19 466,924 442,652 94.80% 5.20% 33.59%
Note 1: Due to rounding, the sum of all achievement levels may not equal 100 percent.
Note 2: The number of students tested includes students that did not receive a score; however, the number of students tested is not the number that was used to calculate the achievement level percentages. The achievement level percentages are calculated using students with scores.
Note 3: Inclusion and exclusion rules are different for the STARC than for other public assessment reports.
Page 9 of 19
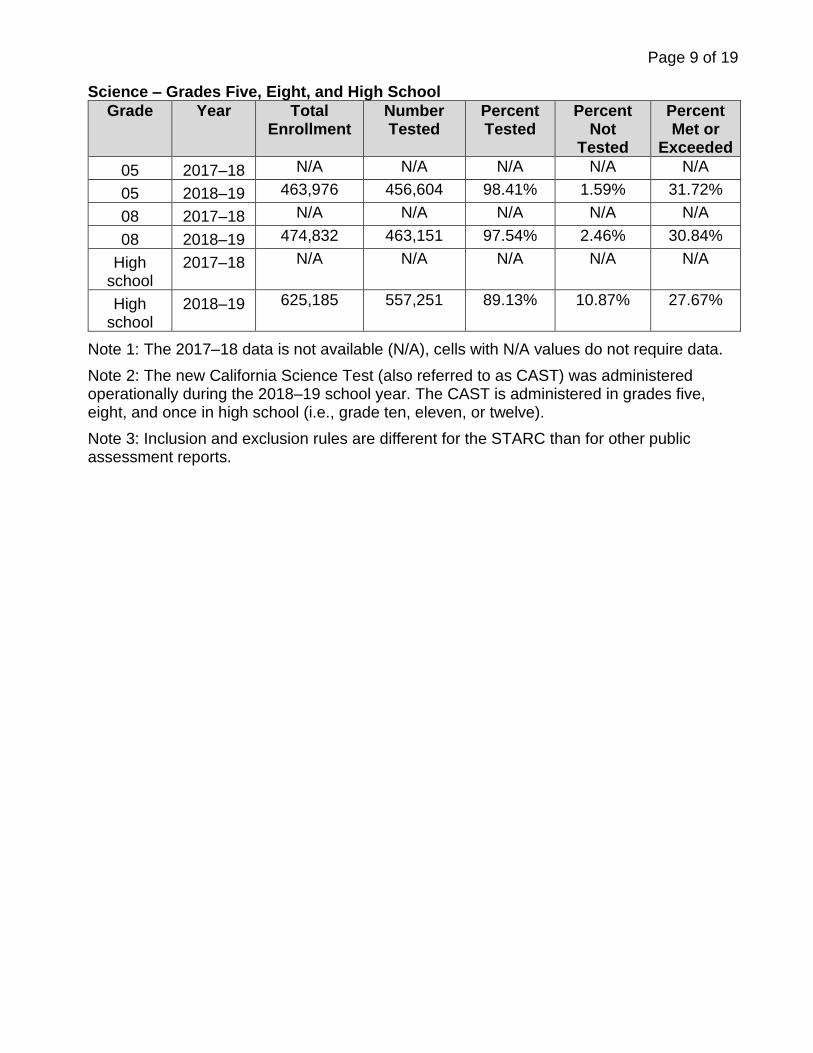
Science – Grades Five, Eight, and High School
Grade Year Total Enrollment
Number Tested
Percent Tested
Percent Not
Tested
Percent Met or
Exceeded
05 2017–18 N/A N/A N/A N/A N/A
05 2018–19 463,976 456,604 98.41% 1.59% 31.72%
08 2017–18 N/A N/A N/A N/A N/A
08 2018–19 474,832 463,151 97.54% 2.46% 30.84%
High school
2017–18 N/A N/A N/A N/A N/A
High school
2018–19 625,185 557,251 89.13% 10.87% 27.67%
Note 1: The 2017–18 data is not available (N/A), cells with N/A values do not require data.
Note 2: The new California Science Test (also referred to as CAST) was administered operationally during the 2018–19 school year. The CAST is administered in grades five, eight, and once in high school (i.e., grade ten, eleven, or twelve).
Note 3: Inclusion and exclusion rules are different for the STARC than for other public assessment reports.

Page 10 of 19
CAASPP Test Results in ELA Disaggregated by Student Group 2018–19
ELA – Grades Three through Eight and Grade Eleven
Student Group Total Enrollment
Number Tested
Percent Tested
Percent Not
Tested
Percent Met or
Exceeded
Statewide 3,255,857 3,194,191 98.11% 1.89% 50.57%
Male 1,671,203 1,637,489 97.98% 2.02% 45.67%
Female 1,584,654 1,556,702 98.24% 1.76% 55.72%
Black or African American 174,936 170,034 97.20% 2.80% 32.77%
American Indian or Alaska Native
16,413 15,854 96.59% 3.41% 37.95%
Asian 297,576 295,045 99.15% 0.85% 76.72%
Filipino 77,618 76,836 98.99% 1.01% 71.52%
Hispanic or Latino 1,783,931 1,758,661 98.58% 1.42% 40.39%
Native Hawaiian or Pacific Islander
14,885 14,583 97.97% 2.03% 43.18%
White 739,523 718,772 97.19% 2.81% 65.04%
Two or More Races 122,392 119,376 97.54% 2.46% 64.47%
Socioeconomically Disadvantaged
2,038,094 2,004,017 98.33% 1.67% 39.04%
Not Socioeconomically Disadvantaged
1,217,763 1,190,174 97.73% 2.27% 69.97%
English Learners 522,404 513,841 98.36% 1.64% 12.96%
Students with Disabilities 445,853 424,318 95.17% 4.83% 16.81%
Students with No Reported Disabilities
2,810,004 2,769,873 98.57% 1.43% 55.74%
Students Receiving Migrant Education Services
25,589 25,331 98.99% 1.01% 30.01%
Foster Youth 20,885 19,751 94.57% 5.43% 23.83%
Homeless 117,449 113,835 96.92% 3.08% 32.68%
Note 1: Due to rounding, the sum of all achievement levels may not equal 100 percent.
Note 2: ELA test results include the Smarter Balanced Summative Assessment and the CAA. The “Percent Met or Exceeded” is calculated by taking the total number of students who met or exceeded the standard on the Smarter Balanced Summative Assessment plus the total number of students who met the standard (i.e., achieved Level 3–Alternate) on the CAAs divided by the total number of students who participated in both assessments.
Note 3: Socioeconomically disadvantaged (SED) students are defined as students: (1) who are eligible for the free or reduced-price lunch program (also known as the National School Lunch Program, or NSLP), or have a direct certification for free or reduced-price meals, or (2) who are migrant, homeless, or foster youth, or (3) where neither of the parents were a high school graduate.

Page 11 of 19
Note 4: The number of students tested includes all students who participated in the test whether they received a score or not; however, the number of students tested is not the number that was used to calculate the achievement level percentages. The achievement level percentages are calculated using only students who received scores.
Note 5: Inclusion and exclusion rules are different for the STARC than for other public assessment reports.

Page 12 of 19
CAASPP Test Results in Mathematics Disaggregated by Student Group 2018–19
Mathematics – Grades Three through Eight and Grade Eleven
Student Group Total Enrollment
Number Tested
Percent Tested
Percent Not
Tested
Percent Met or
Exceeded
Statewide 3,279,793 3,210,894 97.90% 2.10% 39.36%
Male 1,684,056 1,646,722 97.78% 2.22% 39.53%
Female 1,595,737 1,564,172 98.02% 1.98% 39.18%
Black or African American 175,091 169,522 96.82% 3.18% 20.38%
American Indian or Alaska Native
16,447 15,826 96.22% 3.78% 26.34%
Asian 302,554 299,720 99.06% 0.94% 73.74%
Filipino 78,494 77,618 98.88% 1.12% 59.81%
Hispanic or Latino 1,799,474 1,770,219 98.37% 1.63% 27.84%
Native Hawaiian or Pacific Islander
14,973 14,611 97.58% 2.42% 32.23%
White 741,389 719,058 96.99% 3.01% 53.86%
Two or More Races 122,445 119,153 97.31% 2.69% 54.00%
Socioeconomically Disadvantaged
2,055,330 2,016,337 98.10% 1.90% 27.46%
Not Socioeconomically Disadvantaged
1,224,463 1,194,557 97.56% 2.44% 59.45%
English Learners 545,883 535,605 98.12% 1.88% 12.50%
Students with Disabilities 446,297 422,905 94.76% 5.24% 12.88%
Students with No Reported Disabilities
2,833,496 2,787,989 98.39% 1.61% 43.37%
Students Receiving Migrant Education Services
26,226 25,937 98.90% 1.10% 21.53%
Foster Youth 20,942 19,689 94.02% 5.98% 14.76%
Homeless 120,227 116,215 96.66% 3.34% 22.53%
Note 1: Due to rounding, the sum of all achievement levels may not equal 100 percent.
Note 2: Mathematics test results include the Smarter Balanced Summative Assessment and the California Alternative Assessment (also referred to as CAA). The “Percent Met or Exceeded” is calculated by taking the total number of students who met or exceeded the standard on the Smarter Balanced Summative Assessment plus the total number of students who met the standard (i.e., achieved Level 3–Alternate) on the CAAs divided by the total number of students who participated in both assessments.
Note 3: Socioeconomically disadvantaged (SED) students are defined as students: (1) who are eligible for the free or reduced-price lunch program (also known as the National School Lunch Program, or NSLP), or have a direct certification for free or reduced-price meals, or (2) who are migrant, homeless, or foster youth, or (3) where neither of the parents were a high school graduate.

Page 13 of 19
Note 4: The number of students tested includes all students who participated in the test whether they received a score or not; however, the number of students tested is not the number that was used to calculate the achievement level percentages. The achievement level percentages are calculated using only students who received scores.
Note 5: Inclusion and exclusion rules are different for the STARC than for other public assessment reports.

Page 14 of 19
CAASPP Test Results in Science Disaggregated by Student Group 2018–19
CAST – Grades Five, Eight and High School
Student Group Total Enrollment
Number Tested
Percent Tested
Percent Not
Tested
Percent Met or
Exceeded
Statewide 1,563,993 1,477,006 94.44% 5.56% 29.93%
Male 798,748 752,970 94.27% 5.73% 29.96%
Female 765,245 724,036 94.61% 5.39% 29.91%
Black or African American 85,376 78,167 91.56% 8.44% 13.60%
American Indian or Alaska Native
8,234 7,486 90.92% 9.08% 21.16%
Asian 145,598 141,013 96.85% 3.15% 58.68%
Filipino 38,377 36,890 96.13% 3.87% 44.35%
Hispanic or Latino 845,305 802,572 94.94% 5.06% 18.80%
Native Hawaiian or Pacific Islander
7,338 6,870 93.62% 6.38% 21.01%
White 366,641 341,893 93.25% 6.75% 44.42%
Two or More Races 56,801 53,277 93.80% 6.20% 44.93%
Socioeconomically Disadvantaged
926,779 877,811 94.72% 5.28% 18.76%
Not Socioeconomically Disadvantaged
637,214 599,195 94.03% 5.97% 46.30%
English Learners 203,009 190,718 93.95% 6.05% 2.90%
Students with Disabilities 181,098 160,762 88.77% 11.23% 8.10%
Students with No Reported Disabilities
1,382,895 1,316,244 95.18% 4.82% 32.60%
Students Receiving Migrant Education Services
12,008 11,475 95.56% 4.44% 12.21%
Homeless 55,001 50,767 92.30% 7.70% 14.84%
Note 1: Science assessments include both the new California Science Test (also referred to as CAST) and the California Alternative Assessment (also referred to as CAA) for Science for students with an Individualized Education Program designating an alternate assessment. Students take the CAST or CAA for Science assessment in grades five, eight, and once in high school (i.e., grade ten, eleven, or twelve). The CAST was administered operationally during the 2018–19 school year. The 2018–19 field test administration of CAA for Science was a census administration and will not be included in the 2018–19 STARC. These data will be included in the 2019–20 STARC. The formula for calculating the “Percent Met or Exceeded” is the total number of students who met or exceeded the standard on the CAST divided by the total number of students who participated in CAST assessments.
Note 2: Socioeconomically disadvantaged (SED) students are defined as students: (1) who are eligible for the free or reduced-price lunch program (also known as the National School Lunch Program, or NSLP), or have a direct certification for free or reduced-price meals, or (2) who are migrant, homeless, or foster youth, or (3) where neither of the parents were a high school graduate.
Note 3: Inclusion and exclusion rules are different for the STARC than for other public assessment reports.

Page 15 of 19
Teacher Qualifications
Information on teacher qualifications required by the federal ESEA can be found at the CDE Improving Teacher & Principal Quality web page at https://www.cde.ca.gov/nclb/sr/tq/.
Detailed information on teacher qualification data can be found on the CDE DataQuest web page at https://dq.cde.ca.gov/dataquest/.
Teacher Credentials, 2018–19
Type of Credential Percent*
Teachers with Full Credentials 92.97%
Teachers with Alternative routes to certification (District Internship/University Internship)**
2.88%
Teachers with Emergency Permits (not qualified for a credential or internship but meeting minimum requirements)**
3.40%
Teachers with Provisional Internship Permits** 0.65%
Teachers with Waivers** 0.26%
*Teacher credential data may not have been submitted or a teacher may hold more than one type of credential. As a result, percentages reported in this table may not equal 100 percent.
**Does not have a full credential.
Teacher Education Levels, 2018–19
Education Level Percent
Doctorate degree 0.87%
Master’s degree plus 30 or more semester hours 11.91%
Master’s degree 29.79%
Bachelor’s degree plus 30 or more semester hours 29.06%
Bachelor’s degree 26.46%
Less than Bachelor’s Degree 0.16%
None Reported 1.13%
Page 16 of 19
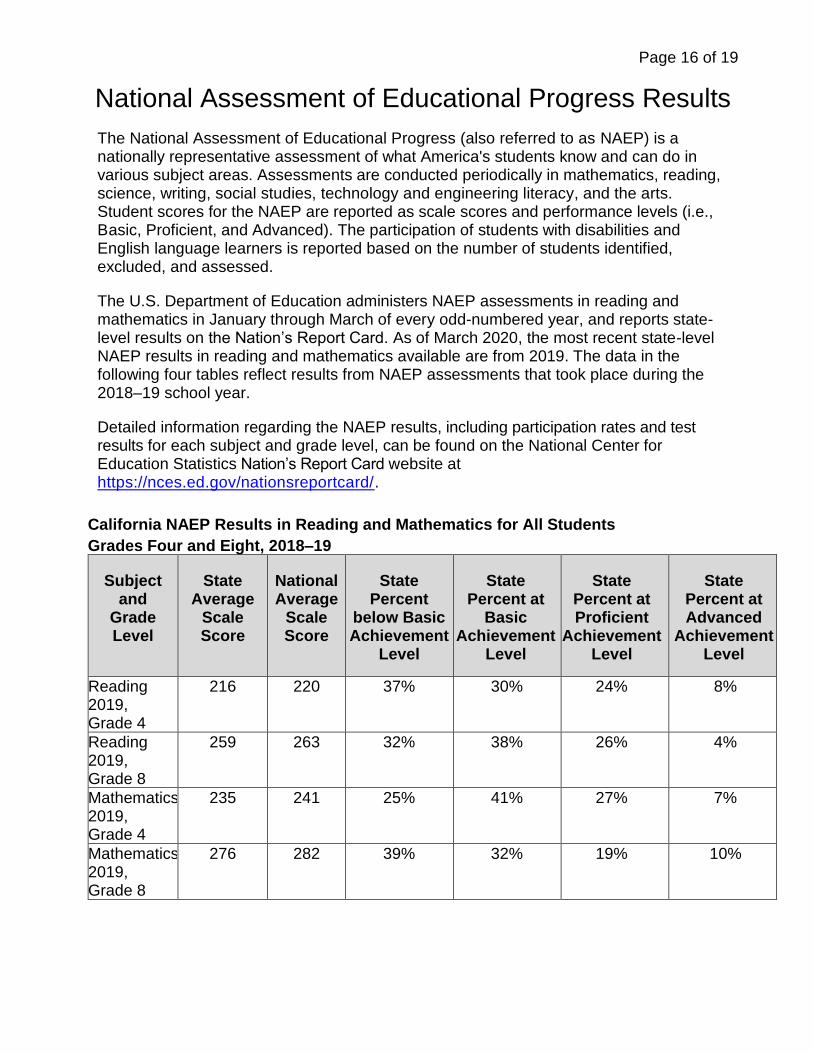
National Assessment of Educational Progress Results
The National Assessment of Educational Progress (also referred to as NAEP) is a nationally representative assessment of what America's students know and can do in various subject areas. Assessments are conducted periodically in mathematics, reading, science, writing, social studies, technology and engineering literacy, and the arts. Student scores for the NAEP are reported as scale scores and performance levels (i.e., Basic, Proficient, and Advanced). The participation of students with disabilities and English language learners is reported based on the number of students identified, excluded, and assessed.
The U.S. Department of Education administers NAEP assessments in reading and mathematics in January through March of every odd-numbered year, and reports state-level results on the Nation’s Report Card. As of March 2020, the most recent state-level NAEP results in reading and mathematics available are from 2019. The data in the following four tables reflect results from NAEP assessments that took place during the 2018–19 school year.
Detailed information regarding the NAEP results, including participation rates and test results for each subject and grade level, can be found on the National Center for Education Statistics Nation’s Report Card website at https://nces.ed.gov/nationsreportcard/.
California NAEP Results in Reading and Mathematics for All Students
Grades Four and Eight, 2018–19
Subject and
Grade Level
State Average
Scale Score
National Average
Scale Score
State Percent
below Basic Achievement
Level
State Percent at
Basic Achievement
Level
State Percent at Proficient
Achievement Level
State Percent at Advanced
Achievement Level
Reading 2019, Grade 4
216 220 37% 30% 24% 8%
Reading 2019, Grade 8
259 263 32% 38% 26% 4%
Mathematics 2019, Grade 4
235 241 25% 41% 27% 7%
Mathematics 2019, Grade 8
276 282 39% 32% 19% 10%

Page 17 of 19
California NAEP Results in Reading, Disaggregated by Student Group
Grades Four and Eight, 2018–19
Student Group and Grade Level
Percent below Basic Achievement
Level
Percent at Basic
Achievement Level
Percent at Proficient
Achievement Level
Percent at Advanced
Achievement Level
Black, Grade 4 58% 24% 16% 2%
Black, Grade 8 57% 33% 9% 1%
American Indian/Alaska Native, Grade 4
** ** ** **
American Indian/Alaska Native, Grade 8
** ** ** **
Asian/Pacific Islander, Grade 4
20% 24% 34% 22%
Asian/Pacific Islander, Grade 8
14% 30% 42% 13%
Hispanic, Grade 4 47% 31% 18% 4%
Hispanic, Grade 8 40% 40% 18% 1%
White, Grade 4 19% 32% 34% 15%
White, Grade 8 17% 38% 39% 6%
Eligible for National School Lunch, Grade 4
49% 31% 17% 3%
Eligible for National School Lunch, Grade 8
42% 39% 17% 1%
Not Eligible for National School Lunch, Grade 4
18% 30% 35% 17%
Not Eligible for National School Lunch, Grade 8
17% 36% 39% 8%
Students with Disabilities, Grade 4
75% 16% 7% 2%
Students with Disabilities, Grade 8
73% 23% 4% #
English Leaners, Grade 4
68% 23% 8% 1%
English Leaners, Grade 8
79% 19% 1% #
Male, Grade 4 42% 29% 22% 7%
Male, Grade 8 37% 38% 23% 3%
Female, Grade 4 33% 32% 25% 10%
Female, Grade 8 27% 38% 29% 5%
**Reporting standards were not met. # Equals less than 1% and rounds to zero.

Page 18 of 19
California NAEP Results in Mathematics, Disaggregated by Student Group
Grades Four and Eight, 2018–19
Student Group and Grade Level
Percent below Basic Achievement
Level
Percent at Basic
Achievement Level
Percent at Proficient
Achievement Level
Percent at Advanced
Achievement Level
Black, Grade 4 33% 47% 17% 2%
Black, Grade 8 61% 29% 8% 2%
American Indian/Alaska Native, Grade 4
** ** ** **
American Indian/Alaska Native, Grade 8
** ** ** **
Asian/Pacific Islander, Grade 4
9% 28% 42% 21%
Asian/Pacific Islander, Grade 8
15% 24% 28% 33%
Hispanic, Grade 4 34% 45% 18% 2%
Hispanic, Grade 8 51% 34% 12% 3%
White, Grade 4 11% 35% 41% 13%
White, Grade 8 20% 34% 33% 14%
Eligible for National School Lunch, Grade 4
35% 46% 17% 2%
Eligible for National School Lunch, Grade 8
51% 33% 13% 3%
Not Eligible for National School Lunch, Grade 4
10% 34% 41% 15%
Not Eligible for National School Lunch, Grade 8
19% 31% 30% 20%
Students with Disabilities, Grade 4
60% 28% 10% 3%
Students with Disabilities, Grade 8
77% 18% 3% 2%
English Leaners, Grade 4
54% 37% 8% 1%
English Leaners, Grade 8
81% 16% 2% 1%
Male, Grade 4 24% 40% 27% 8%
Male, Grade 8 40% 32% 18% 10%
Female, Grade 4 26% 42% 26% 6%
Female, Grade 8 38% 33% 20% 10%
**Reporting standards were not met. # Equals less than 1% and rounds to zero.
Page 19 of 19
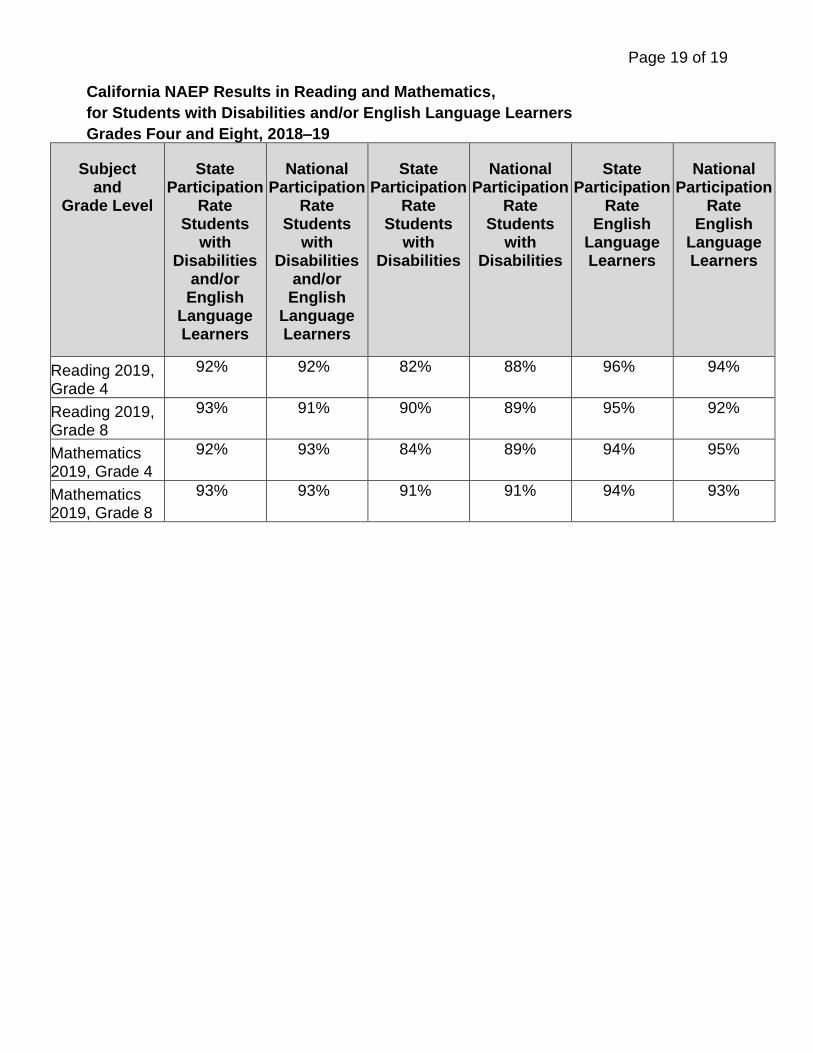
California NAEP Results in Reading and Mathematics,
for Students with Disabilities and/or English Language Learners
Grades Four and Eight, 2018–19
Subject and
Grade Level
State Participation
Rate Students
with Disabilities
and/or English
Language Learners
National Participation
Rate Students
with Disabilities
and/or English
Language Learners
State Participation
Rate Students
with Disabilities
National Participation
Rate Students
with Disabilities
State Participation
Rate English
Language Learners
National Participation
Rate English
Language Learners
Reading 2019, Grade 4
92% 92% 82% 88% 96% 94%
Reading 2019, Grade 8
93% 91% 90% 89% 95% 92%
Mathematics 2019, Grade 4
92% 93% 84% 89% 94% 95%
Mathematics 2019, Grade 8
93% 93% 91% 91% 94% 93%