excess leverage and productivity growth in emerging ...repec.iza.org/dp4834.pdfexcess leverage and...
TRANSCRIPT
DI
SC
US
SI
ON
P
AP
ER
S
ER
IE
S
Forschungsinstitut zur Zukunft der ArbeitInstitute for the Study of Labor
Excess Leverage and Productivity Growth inEmerging Economies: Is There A Threshold Effect?
IZA DP No. 4834
March 2010
Fabrizio CoricelliNigel Driffi eldSarmistha PalIsabelle Roland

Excess Leverage and Productivity Growth in Emerging Economies:
Is There A Threshold Effect?
Fabrizio Coricelli Paris School of Economics and CEPR
Nigel Driffield
Aston Business School
Sarmistha Pal
Brunel University and IZA
Isabelle Roland
London School of Economics
Discussion Paper No. 4834 March 2010
IZA
P.O. Box 7240 53072 Bonn
Germany
Phone: +49-228-3894-0 Fax: +49-228-3894-180
E-mail: [email protected]
Any opinions expressed here are those of the author(s) and not those of IZA. Research published in this series may include views on policy, but the institute itself takes no institutional policy positions. The Institute for the Study of Labor (IZA) in Bonn is a local and virtual international research center and a place of communication between science, politics and business. IZA is an independent nonprofit organization supported by Deutsche Post Foundation. The center is associated with the University of Bonn and offers a stimulating research environment through its international network, workshops and conferences, data service, project support, research visits and doctoral program. IZA engages in (i) original and internationally competitive research in all fields of labor economics, (ii) development of policy concepts, and (iii) dissemination of research results and concepts to the interested public. IZA Discussion Papers often represent preliminary work and are circulated to encourage discussion. Citation of such a paper should account for its provisional character. A revised version may be available directly from the author.

IZA Discussion Paper No. 4834 March 2010
ABSTRACT
Excess Leverage and Productivity Growth in Emerging Economies: Is There A Threshold Effect?*
The paper examines the relationship between leverage and growth in a group of emerging central and eastern European countries, who are at different levels of financial market development. We hypothesize a non-linear relationship in that moderate leverage could boost growth while very high leverage could lower it by increasing the likelihood of financial distress and bankruptcy. Estimates of a Threshold model confirm the non-linear relationship in our sample, after controlling for various firm, industry and financial market characteristics. We also endogenously determine a threshold level of leverage beyond which further increases in leverage could lower TFP growth. JEL Classification: G32, O16 Keywords: excess leverage, bank efficiency, market capitalization, TFP growth,
Threshold model, non-linear relationship, transition experience Corresponding author: Sarmistha Pal CEDI, Department of Economics and Finance Brunel University Uxbridge UB8 3PH United Kingdom E-mail: [email protected]
* Sarmistha Pal is grateful to Erik Berglof and his staff at EBRD for hospitality during the initial work on the paper. Financial support from ESRC grant RES-062-23-0986 is gratefully acknowledged. We are much grateful to an anonymous referee and the Managing Editor of this journal for very constructive suggestions and also to Stijn Claessens for FSDI data, Michael Landesman for the sectoral Price deflator data and Sourafel Girma and Michael Henry for assistance with the estimation of the threshold model. We thank Yama Temouri for research assitance and seminar participants at Aston Business School, UCL, EBRD and CICM conference London for comments and suggestions. The usual disclaimer applies.

1
Excess Leverage and Productivity Growth in Emerging Economies: Is There A Threshold Effect?
1. Introduction
Economists have long recognized that financial conditions in the private sector could
have a powerful effect on macroeconomic outcomes. Increases in leverage can lead to
greater probability of default, and in turn higher costs of external financing. This
could lower investment, cash flow and therefore output (Kyotaki and Moore, 1997).
Increases in corporate leverage could also induce severe slowdowns by
amplifying/propagating initial adverse shocks (e.g., demand) on the real economy
(Bernanke and Gertler, 1995). Despite the importance of this question, especially in
the current economic climate, we are not aware of any study that explores the link
between corporate leverage and the wider economy which we propose.
Corporate leverage decisions are among the most important decisions made
by firm executives. The current economic crisis has however highlighted the risks of
global boom-bust cycles driven by lending, which in turn raises the need to
understand the link between leverage decisions and the wider economy. Since
Modigliani and Miller (1958), research has focused on understanding/analysing
corporate financial choices and policies around the world, especially in the US. This
literature highlights the firm, market and industry characteristics determining
optimal leverage and also its dynamic adjustment process in case of a departure from
the optimal (e.g., Driffield and Pal, 2010). A parallel literature on financial
institutions has also paid attention to different aspects of problem loans and cost
inefficiency (e.g., see Berger and Humphrey 1992; Bonin et al. 2005). While there
is limited literature on the relationship between leverage and firm
value/performance (e.g., McConnell and Servaes, 1995; Berger and di Patti 2006;
2
Driffield, Mahambare and Pal, 2007), there is very little, if at all, understanding as to
how departure from optimal leverage could affect productivity growth, especially for
emerging economies with weak financial institutions.
In an attempt to bridge this gap in the literature we argue that higher leverage
may reduce the agency costs of outside equity, and increase firm value (and
efficiency) by encouraging managers to act more in the interests of shareholders
(McConnell and Servaes, 1995).1 Thus, higher leverage is likely to be associated with
higher total factor productivity (TFP) growth. We also highlight the non-linear
aspect of this relationship: while moderate leverage could undoubtedly boost TFP
and therefore the level of output, very high leverage may be responsible for an
economy’s vulnerability to unexpected shortfalls in demand and mistakes. This is
because excessive leverage could create excess capacity and lead to financial distress
and even bankruptcy in response to adverse shocks (Greenspan, 2002). Given that
the sample countries are at different stages of financial market development, the
likelihood of excess leverage and also its effect on TFP growth may vary across the
sample countries, even after controlling for various firm and industry level
characteristics. These are open empirical questions that we explore in the paper.
The analysis is based primarily (see section 2) on firm-level Orbis data from a
group of central and eastern European (CEE) transition countries. This sample is
interesting for several reasons. Even after more than a decade of reform, there is a
growing feeling that the reforms have failed to spur adequately the development of
corporate financing opportunities in the central and eastern European (CEE)
countries. Unlike much of the literature for developed countries (e.g., see Fischer, et
al, 1989; Goldstein, Ju and Leland 2001; Strebulaev 2007), the literature on capital
structure for developing and transition countries has highlighted the importance of
1 There can also be reverse causation. For example, more efficient firms may choose lower equity ratios (i.e., higher debt) than others, all else equal, because higher efficiency reduces the expected costs of financial distress and bankruptcy (Berger and di Patti, 2006). See further discussion in section 3.
3
excess leverage (e.g., see Driffield and Pal, 2010). An important aspect of our
analysis has been to take account of the nature of financial markets development in
the sample because weaknesses in financial sector operations and management have
been a major factor contributing to the current financial crisis across the globe. Our
analysis in this respect has been facilitated by the availability of the Financial Sector
Development Indicators or FSDI for short (see World Bank 2006).2 Among various
available indices, we particularly focus on banking efficiency and share of market
capital to gross domestic product, both of which tend to play an important role in
our analysis (see further discussion in section 2.4).
Following the well-developed literature on corporate leverage and its
dynamic adjustment (e.g., see Booth et al. 2001; Flannery and Rangan, 2006), we
start our analysis with the conventional approach of identifying firms with leverage in
excess of its optimal level (instrumented by the fitted values of leverage). This
analysis highlights the incidence of excess leverage among sample firms with access to
loans and also that the indices of financial market development, namely, low bank
efficiency and limited market capitalization significantly contribute to the likelihood
of excess leverage, after controlling for other firm and industry-level factors. Note,
however, that the conventional regression method does not allow us to endogenously
determine the particular leverage level that may harm total factor productivity
growth. Therefore, we follow Hansen (2000) to endogenously determine a threshold
level of leverage beyond which leverage has an adverse effect on productivity growth.
Indeed, there is some evidence from the threshold analysis that TFP growth increases
with leverage only up to a certain point. However, beyond a critical level, greater
leverage lowers TFP growth, even after controlling for various firm-level and
institutional characteristics. Results of our analysis also highlight the beneficial role of
greater financial market development, as signified by the positive effects of greater
2 See further discussion in section 2.
4
bank efficiency and market capitalization on TFP growth. These results hold
irrespective of the choice of leverage measures and also various sub-samples.
A better understanding of the causes and implications of capital structure
imbalances for TFP growth is important, especially in the wake of the current credit
crunch and the subsequent turmoil in many countries around the globe. Results of
our analysis may provide important insights into the problem and also implications
for future deleveraging policies. Our analysis has already been adapted in the
Transition Report (see EBRD 2009, P. 69-70), highlighting its relevance for policy
makers.
The analysis is developed in stages. Section 2 describes the data while section
3 explains the threshold model and the empirical analysis. Section 4 concludes.
2. Data Description
Data used for the analysis is primarily taken from Orbis, a rich firm-level dataset,
which is provided by Bureau van Dijk electronic publishing. Firm-level Orbis data has
been supplemented by country-level data obtained from the EBRD and the World
Bank. The World Bank (2006) has developed a range of indices to measure size,
efficiency and stability of the banking sector as well as the equity markets for a cross
section of countries, including the countries of our interest, for the period 2001-
2005. These are commonly known as the Financial Services Development Indices or
FSDI in short.
Our sample consists of manufacturing firms from twelve transition countries,
namely, Bulgaria, Croatia, Czech Republic, Hungary, Latvia, Poland, Romania,
Russia, Serbia, Slovakia, Slovenia and Ukraine over the period 2001-2005. Choice of
the sample period has been dictated by the fact that FSDI data is available only for this
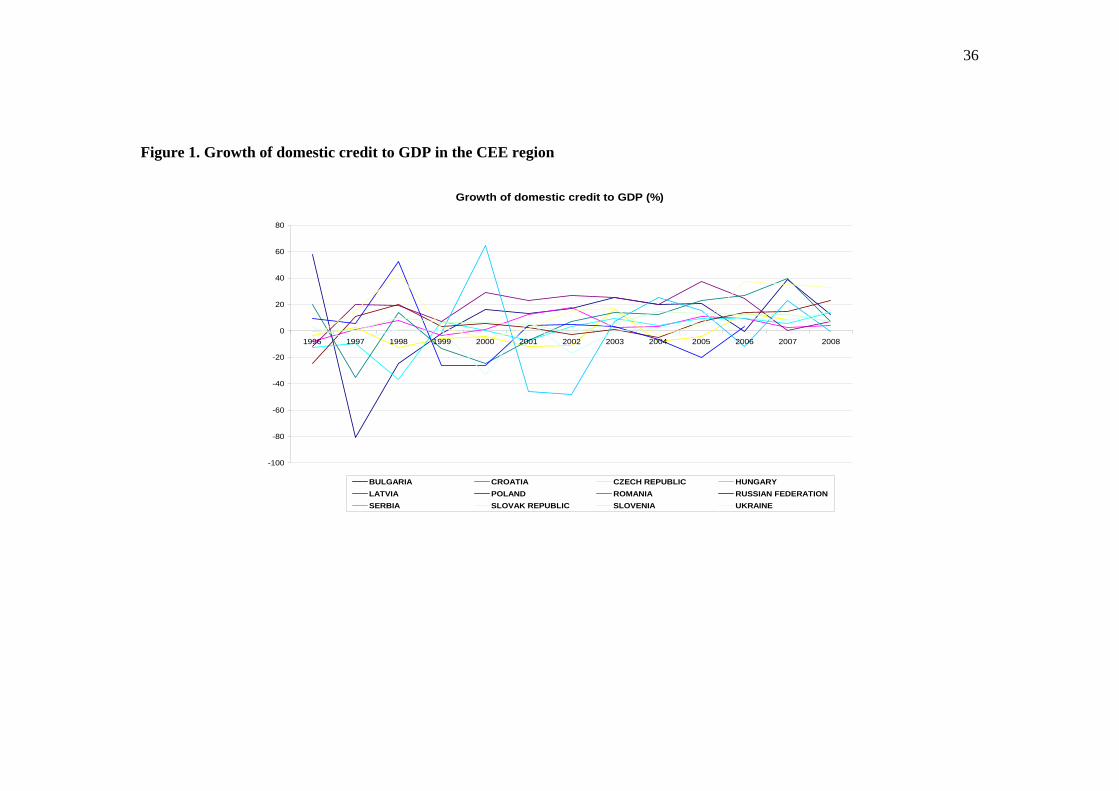
period. This has been a period of steady growth of domestic credit (as a share of
5
GDP) in the region, which stabilized around 2005 for most of the sample countries
(see Figure 1). The total number of observations for the period 2001-2005 is
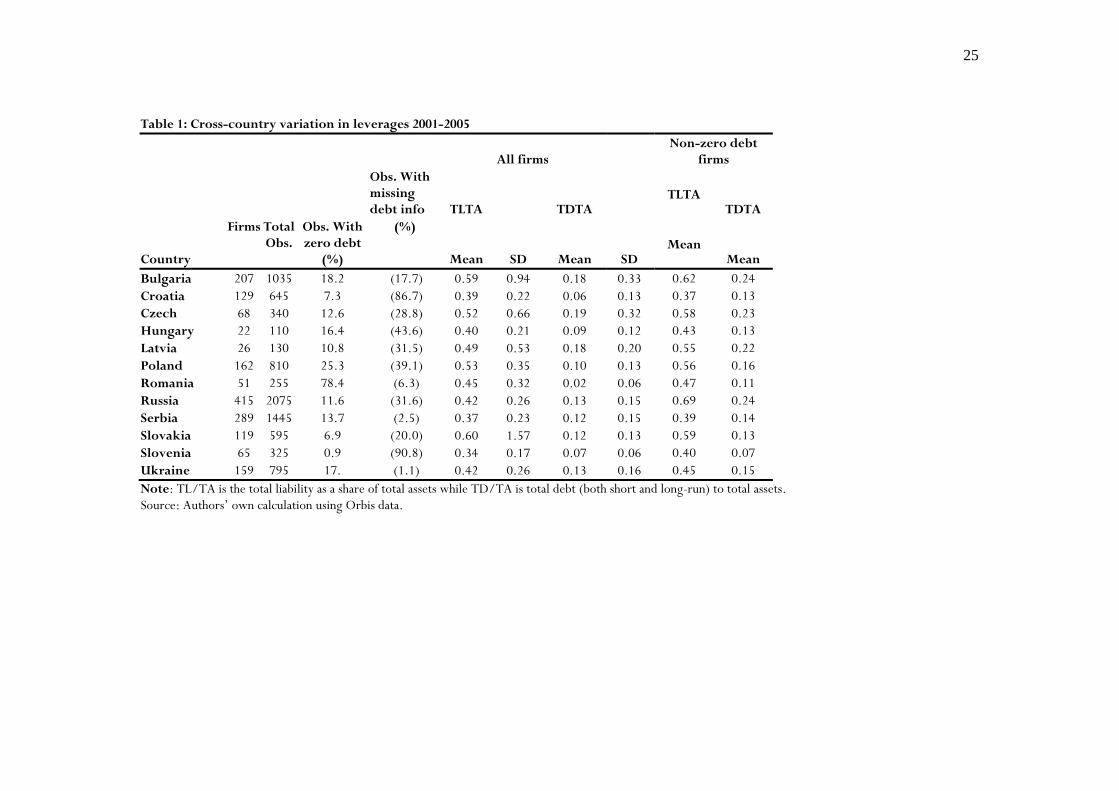
summarized in Table 1 for each sample country.
2.1. Leverage measures
We use different measures of leverage, generally dictated by the availability of
relevant information. First, we use the ratio of total debt (short and long-term debt)
to total assets (abbreviated as TDTA). As an alternative, we use the ratio of total
liabilities to total assets (abbreviated as TLTA), which is available for a larger
proportion of sample firms. Note however that a large proportion of firms do not use
any debt finance; thus the sample size is smaller when we use TDTA. While we do
not observe market value of equity, there is information on book value of equity;
there are however many missing observations, thus rendering the use of this rather
problematic.
Table 1 shows the average leverages between 2001 and 2005 for twelve
sample countries, using the leverage measures described above for all firms and also
for non-zero debt firms. There are some firms in each of these sample countries for
which no information on debt was available. Further, given limited use of external
finance in CEE countries, there is a significant proportion of firms with zero debt in
our sample,3 notably in Romania. This reflects the fact that many firms still do not
have access to debt markets in these economies and instead make heavy use of
internal finance, trade credit and other kinds of liabilities.
Among all firms, the average ratio of total liabilities to total assets ranges
between 0.34 (Slovenia) and 0.60 (Slovakia). The range for average debt ratio is
however much narrower, namely between 0.02 (Romania) and 0.19 (Czech
3 Note also that there are a number of cases when there was very little data for total debt in the sample countries, especially, Croatia and Slovenia (see Table 1).
6
Republic). Since a significant proportion of firms in each of these countries do not
have access to any debt, it may be pertinent to focus on indebted firms (i.e., those
with some non-zero debt) only. The average debt ratio goes up somewhat when we
consider the subsample of firms with non-zero debt. So we need to be cautious about
choosing between samples (all firms versus non-zero debt firms) while
analyzing/interpreting debt ratios.4
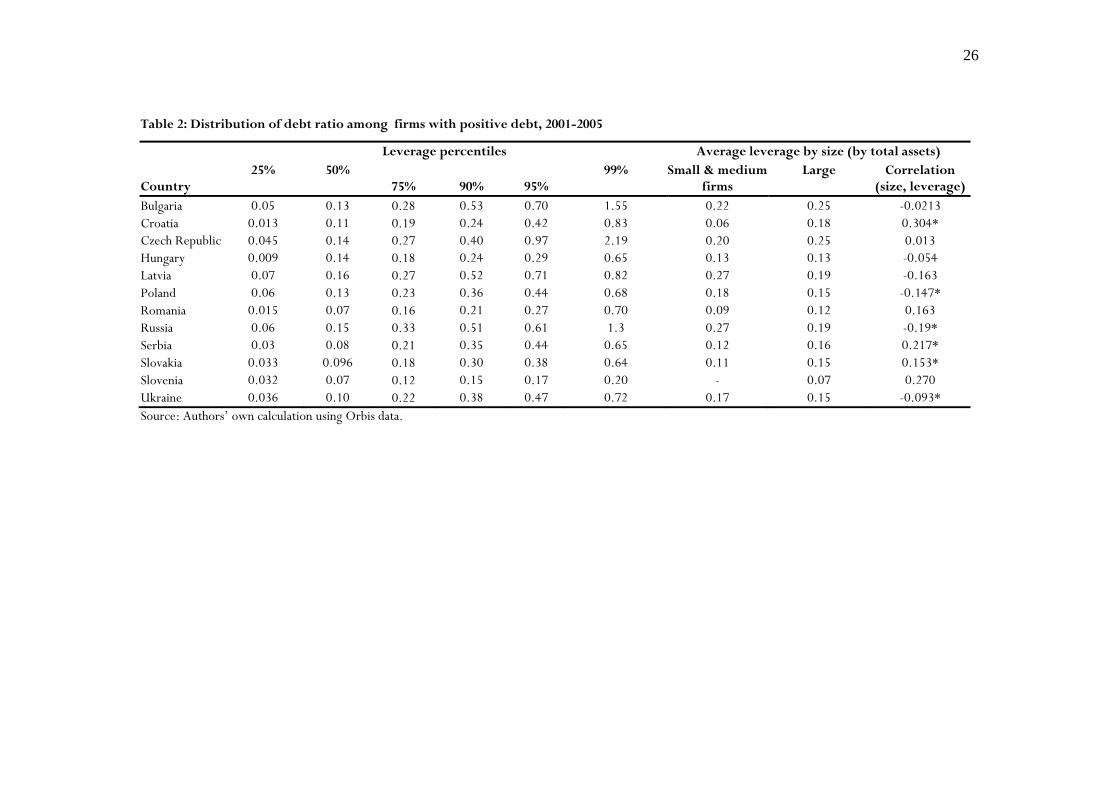
Table 2 shows debt ratio percentiles and the distribution of average debt ratios
by firm size (proxied by total assets). Clearly, the debt ratios of firms in the lowest
quartile are significantly lower from those in the top 5-10% of the distribution in
most sample countries. In fact the debt ratio exceeds 1 for the top 1% firms in
Bulgaria, the Czech Republic and Russia. While a large proportion of firms in the
sample countries are deprived of loans, there is evidence that some firms tend to have
access to too much loans. Second, while the larger firms tend to have higher leverage
in Bulgaria, Croatia, the Czech Republic, Romania, Serbia, Slovakia, the opposite
holds for the other sample countries. The correlation between firm size (measured by
log of total assets) and leverage, as shown in Table 2, suggests a significant positive
correlation for Croatia, Serbia and Slovakia while it is significantly negative for
Poland, Russia and Ukraine; the correlation coefficient however remains insignificant
for other sample countries.
2.2. Optimal leverage
In an attempt to understand the nature and extent of excess leverage, if any, we start
with the conventional literature (e.g., see Flannery and Rangan, 2006; Driffield and
Pal 2010) to determine the optimal leverage Lit* (alternatively labeled as capital
structure) of firms in individual countries. This allows us to have an estimate of the
4 We have also experimented with alternative leverage measures, namely, debt and liability ratio net of cash-flow, which yielded rather comparable results to those presented here.
7
leverage gap, i.e., the deviation of actual leverage from its optimal level (see section
2.3).
If leverage levels are relatively stable over time, then a simple average of the
fitted values for each firm across time may provide the best estimate of optimal
leverage. However, if the data are more volatile (as in our case), and firms are
responding to changes in the explanatory variables, or to other shocks (e.g., ongoing
reforms), then allowing the optimal level to vary year to year, and using the fitted
values on an annual basis is more appropriate, and this is what we do. Once one
allows for this, the best estimate of “optimal leverage” is conventionally taken to be
the fitted value5 derived from the following equation estimated individually for each
country:
Leverageit = β0 + β1 log(assets)it-1 + β2 Ageit-1 + β3 (fixed assets/total
assets)it-1 + β4 (Intangible Fixed Assets/Total Asset)it-1 + β5 (EBIT/Total
Assets)it-1 + β6 (shareholder’s funds/total asset) it-1 + β7 (growth of total
assets) it-1 + β8 inflation it-1 + β9 Industry Median Leverage t-1+ νi + uit (1)6
where i=1, 2,…, N refers to the i-th firm in period t=1, 2,…, T in a given country.
νi is the firm-specific fixed effects while uit refers to random errors independently
and identically distributed. Definitions of these variables are provided in a note to
Table 5. We use panel data fixed effects models to estimate the leverage equation
(1), using both debt and liability ratios as alternative measures of leverage. Choice of
fixed effects as opposed to random effects has been dictated by the sample data.
Choice of the explanatory variables has been guided by the existing literature (e.g.,
see Rajan and Zingales, 1995; Flannery and Rangan, 2006; Frank and Goyal, 2009;
Driffield and Pal 2010) and also data availability; e.g., we were unable to calculate
5 Later in the paper, we endogenously determine the optimal leverage, using a threshold model. 6 EBIT is the earnings before interest and taxes.
8
market to book ratio and therefore replace it by shareholders’ funds as a share of total
assets. All the explanatory variables are lagged by one period. We experiment with
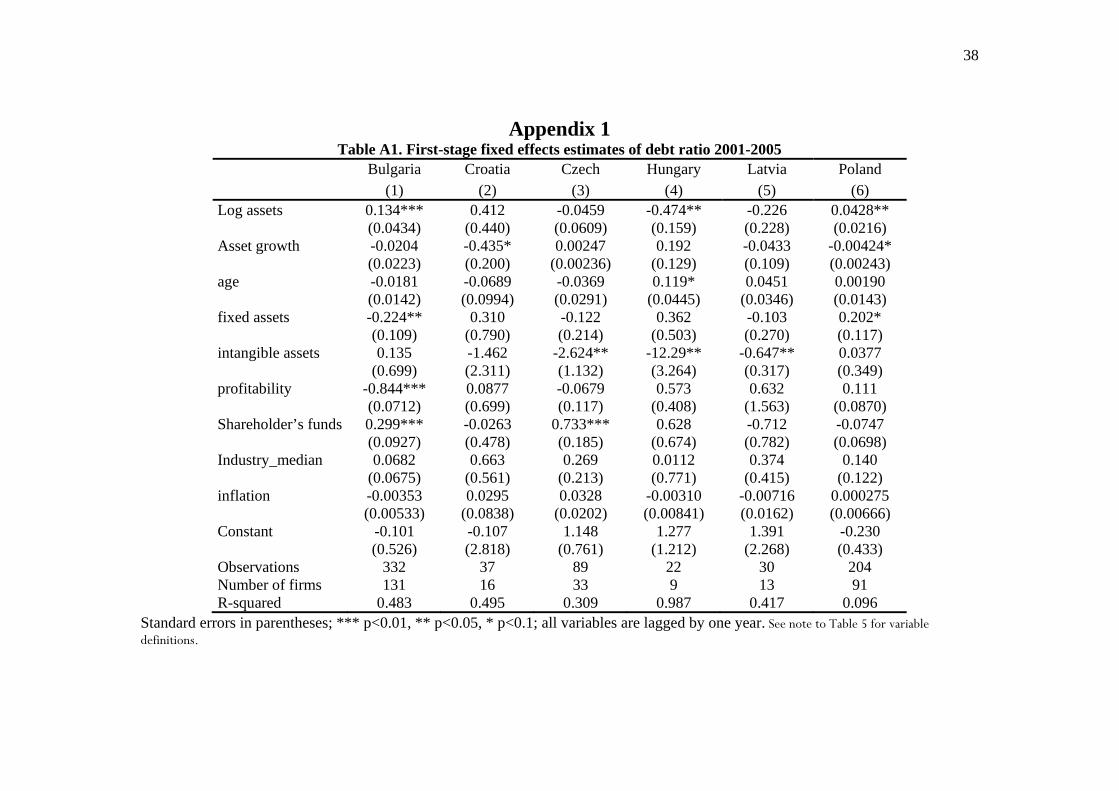
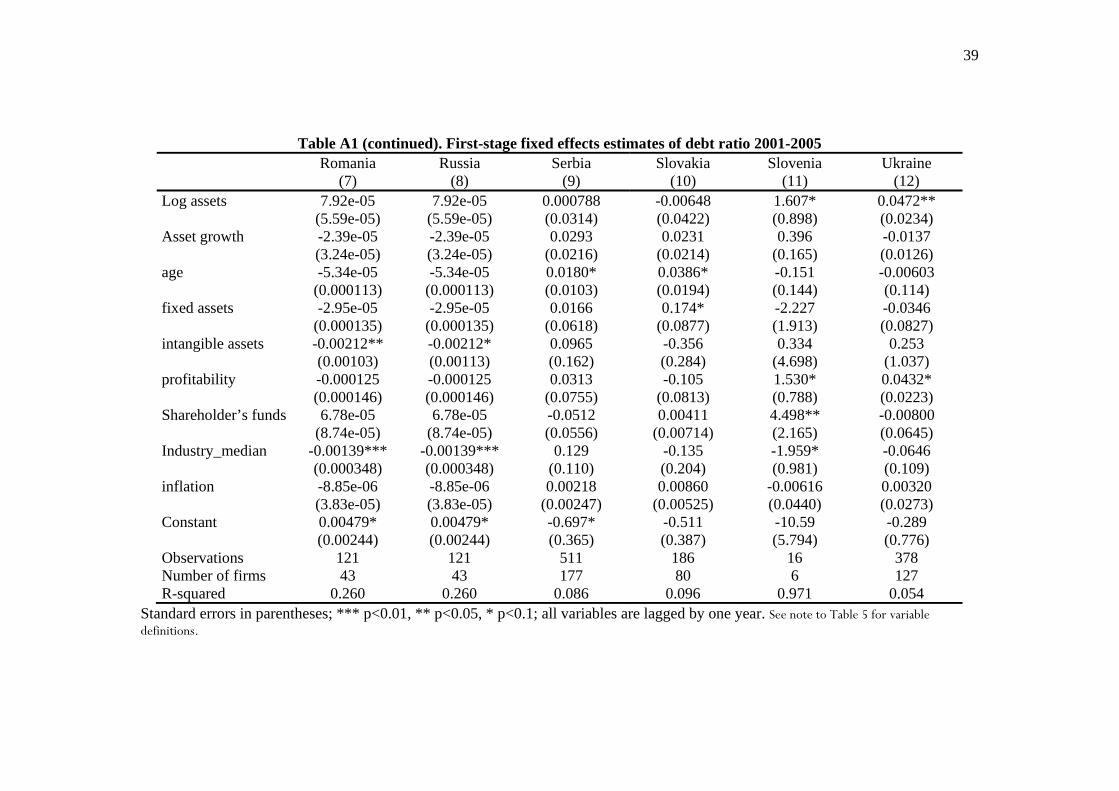
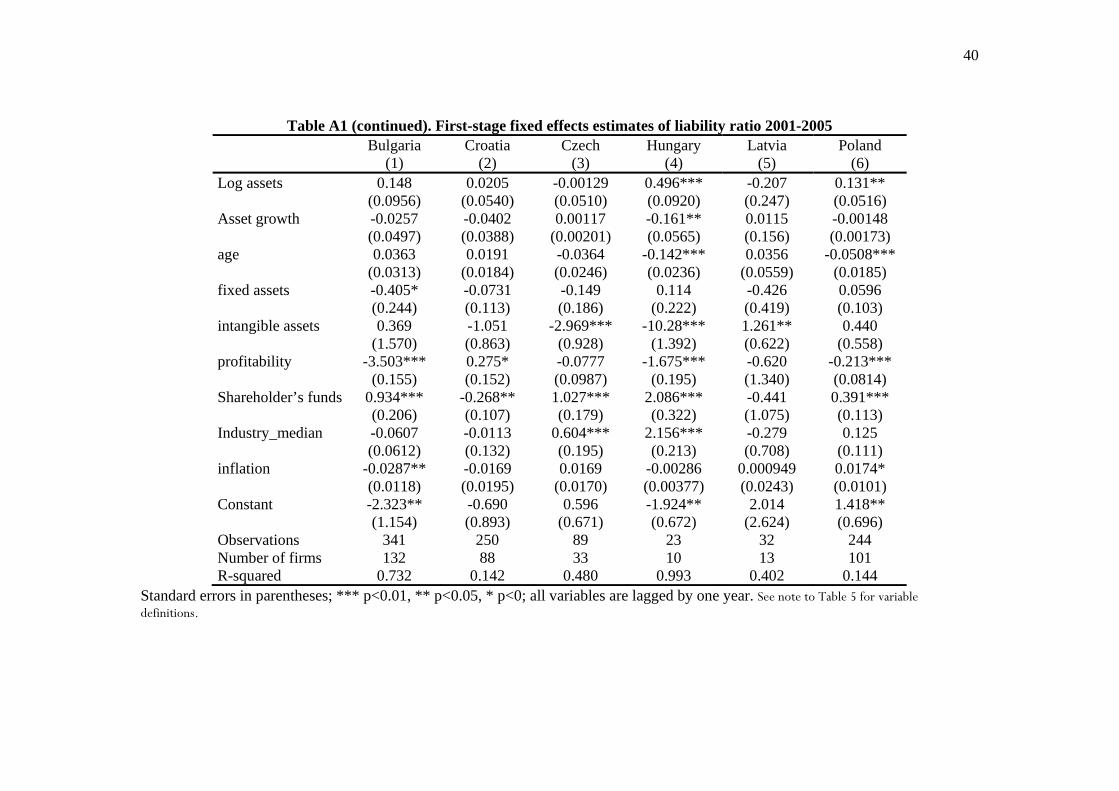
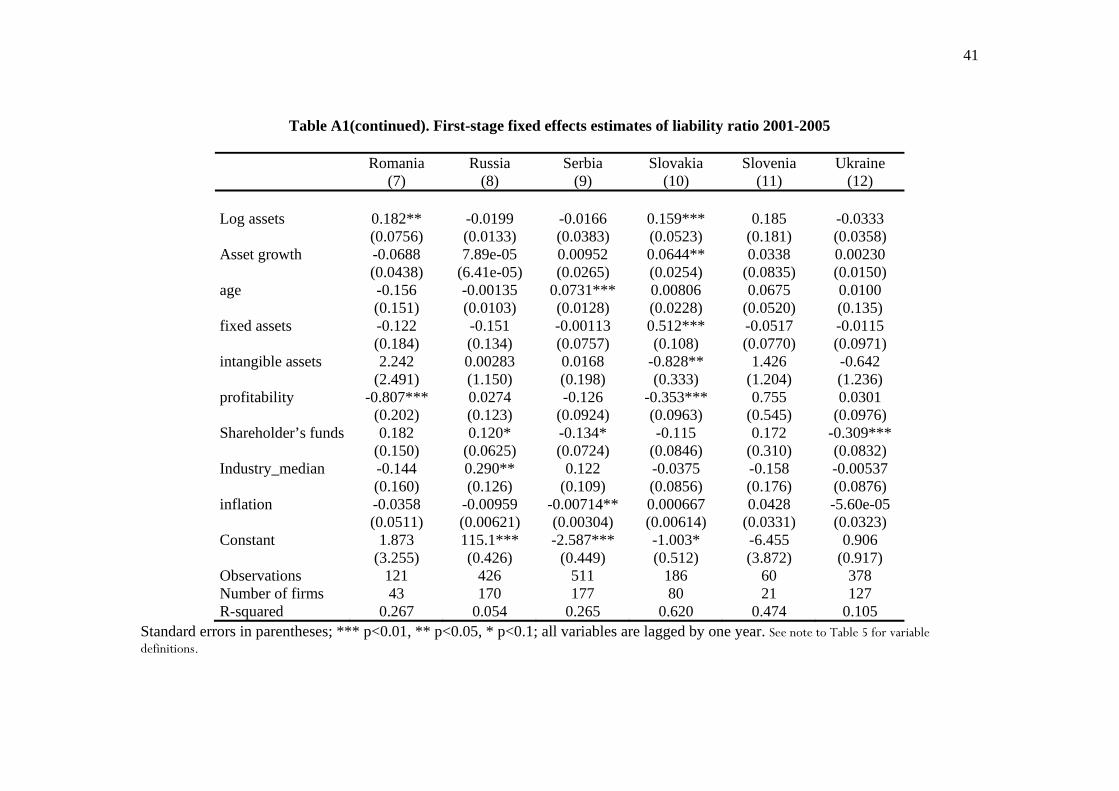
various specifications and show the estimates of debt and liability ratios for the best
fitted models in Appendix Table A1.7
Clearly these estimates are somewhat different for debt and liability ratios and
inter-country variation is also pronounced in these estimates. In general, firm size,
intangible fixed assets, profitability and shareholders’ funds tend to be generally
significant, although the size and sign of these coefficients vary.
2.3. Deviation from optimal leverage
We estimate equation (1) country by country and use the predicted values of
leverage ratios as the optimal target leverage Lit* of the i-th firm in year t. Estimation
of the optimal leverage Lit* allows us to compute the deviation of the actual leverage
from the corresponding optimal as (Lit-Lit*). In order to understand the pattern of
imbalance in corporate leverage, we distinguish between firms with a leverage deficit
(i.e., for which the actual debt or liability ratio is less than their corresponding
target) and those with excess leverage (i.e., for which the actual debt or liability ratio
exceeds the corresponding optimal level). No sample firm had exactly the optimal
leverage (debt or liability). Accordingly, we construct the following binary variable:
EXCESSit = 1 if the i-th firm has excess leverage in year t.
= 0 if the i-th firm has a leverage deficit in year t (since no firm has optimal
leverage in our sample)
Depending on the alternative measures of leverage, we generate two variables,
namely, the “excess debt ratio” (EXCESSTD) and the “excess liability ratio”
7 We also used alternative leverage indices, namely, net debt and net liability ratios, as discussed in section 2.1; we find that these alternative estimates are rather similar to the ones shown in Table A1. These estimates would be available on request.
9
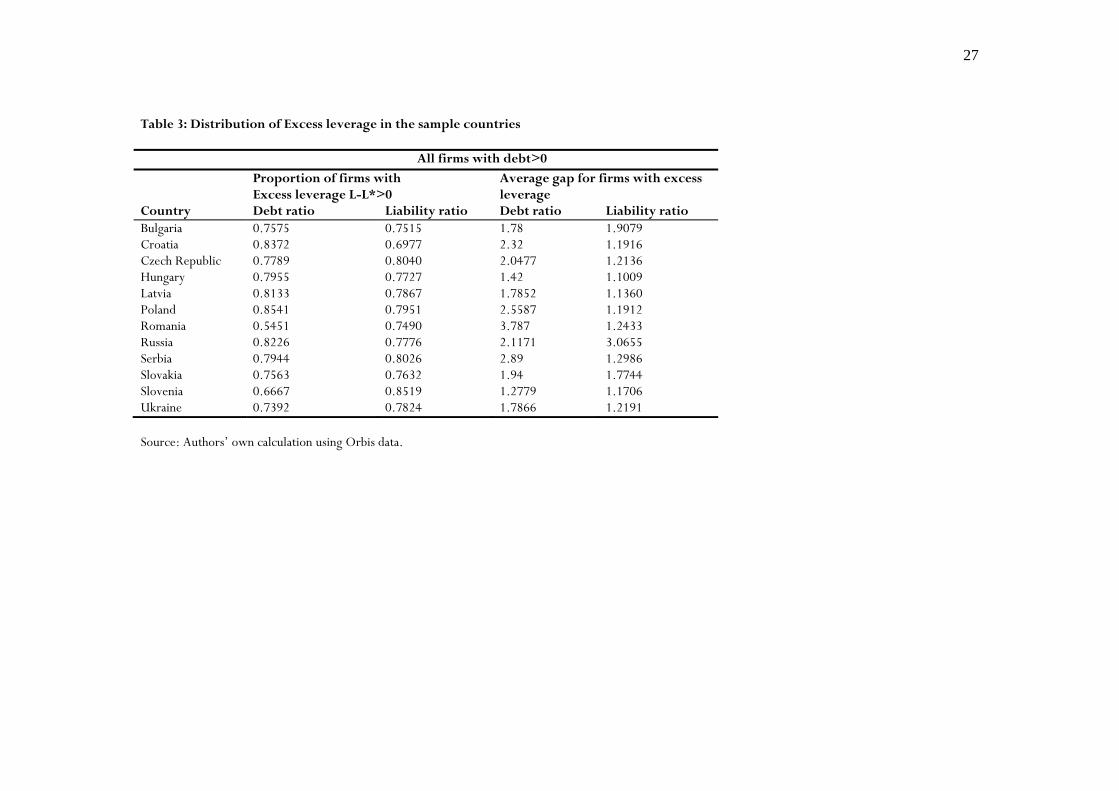
(EXCESSTL). Table 3 summarizes the proportion of firms with excess leverage and
the corresponding average gap for firms with excess leverage. The analysis is done
only for firms with some positive debt. Clearly a significant majority of firms in the
sample countries tend to have excess leverage and this transition experience contrasts
with much of the existing capital structure literature for developed countries (also
see Driffield and Pal, 2010).
It is interesting to compare the frequency of firms with excess leverage in the
sample CEE countries with those available for the East Asian Economies. Clearly,
countries from east Asia (vis-a-vis more developed OECD countries) are more
comparable to CEE countries: (i) bank-based finance dominates in both east Asia and
CEE countries; (ii) indices of financial market developments are more comparable
too. Clearly the proportions of firms with excess leverage for all the CEE sample
countries are higher than those for the east Asian countries (see Appendix Table A2)
studied by Driffield and Pal (2010), thus inducing us to examine the factors
determining the likelihood of excess leverage in the CEE region.
2.4. Financial institutions and excess leverage
Persistence of deviations from optimal leverage levels highlights the aspects of capital
market imperfections, which may prevent an instantaneous adjustment of the actual
leverage to the desired level (for example, see Fisher Heinkel and Zechner, 1989;
Goldstein, Ju and Leland, 2001; Strebulaev, 2007). While much of the transition
literature focuses on firm-level characteristics in understanding capital structure
dynamics, we argue that persistence of excess leverage could be a sign of regulatory
weaknesses in debt issuance, management and recovery. Even allowing for the fact
that a high proportion of firms in the sample countries do not have any bank loans, it
is perhaps surprising to find that the incidence of excess leverage among non-zero
10
debt firms in many CEE countries is higher than those in the worst affected countries
in East Asia (Driffield and Pal, 2010). Accordingly, we explore the role of financial
institutional indices, ceteris paribus, on the presence of excess leverage in the sample
countries.
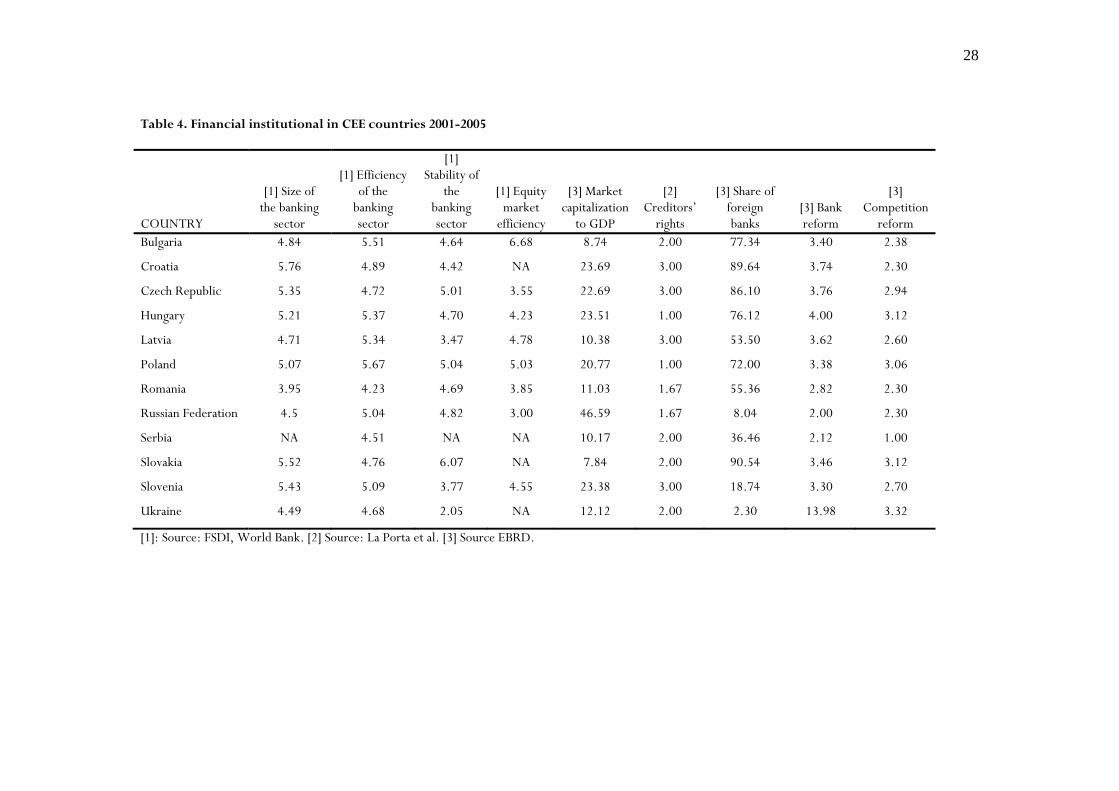
Table 4 summarizes the average characteristics of available financial and legal
indices in the region, prepared using information from the EBRD, the World Bank
FSDI indices and la Porta et al. (1998). Among others, the Table includes measures
of size, efficiency and stability of the banking sector (available from World Bank),
market capitalization to GDP, share of foreign banks (available from EBRD), and the
quality of creditors’ rights (available from la Porta et al. ,1998). Share of market
capitalization to GDP is generally limited in most of the sample countries, especially,
in Bulgaria, Latvia, Slovakia and Serbia. Firms’ external financing opportunities thus
depend crucially on the size and efficiency of the banking sector though the
experience varies widely among the sample countries. In particular, Romania not
only have the smallest banking sector, but efficiency of the banking sector is also the
lowest in our sample. It is however noteworthy that compared to Romania, scores
for average creditors’ rights are much higher in Serbia or Ukraine, which may
facilitate the growth of banking sector. The other important observation relates to
the predominance of foreign banks in countries like Poland, Romania or Hungary as
opposed to Serbia, Slovenia, Ukraine or Russia.
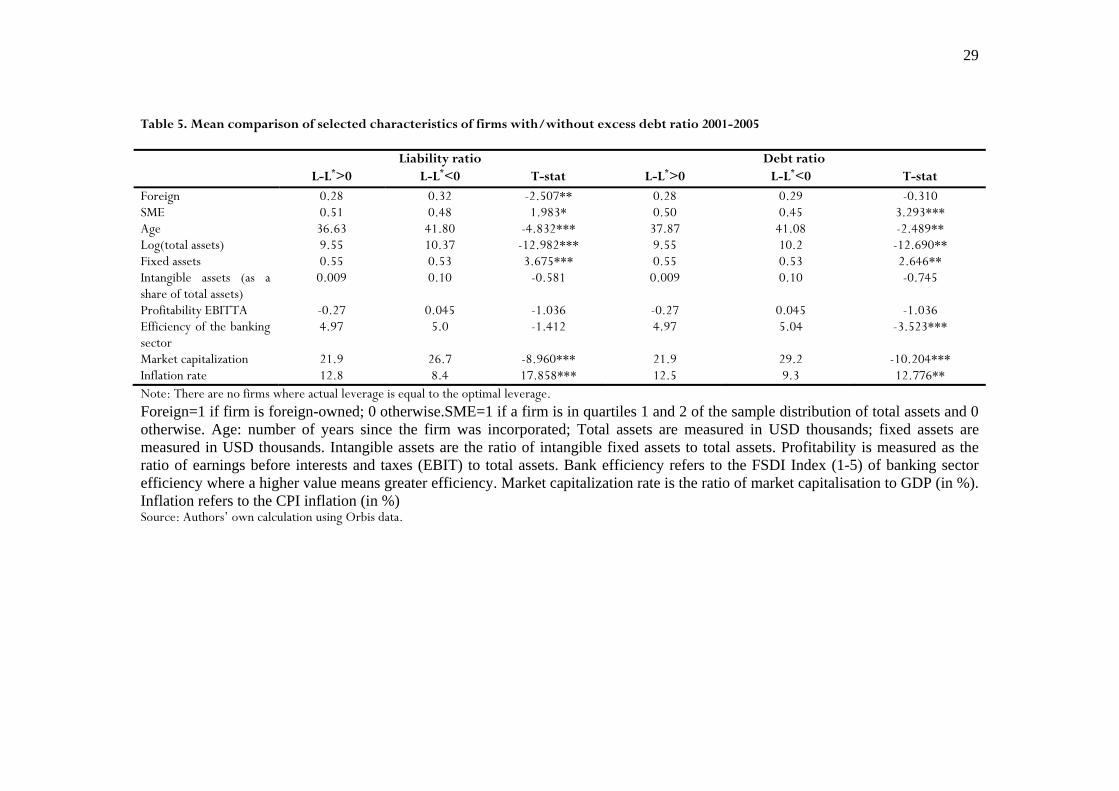
Table 5 summarizes the mean comparison of selected characteristics including
firm size (log of total assets), age, foreign ownership, fixed assets, intangible fixed
assets, earnings ratio (index of profitability), and the rate of CPI inflation. We also
include some characteristics of financial institutions in our analysis on the ground that
weaknesses in financial sector have been closely linked to the current financial and
economic crisis. Note however that these financial institutional indices are closely
correlated; our analysis thus includes measures of bank efficiency and market
11
capitalization (as a share of GDP), as these indices have highest correlations with
measures of excess leverage. On average, smaller firms (by total assets), younger
firms and firms with more fixed assets are significantly more likely to have excess
leverage. Firms from countries with higher inflation are also more likely to have
excess leverage. In terms of financial institutions, sample firms are significantly more
likely to have excess leverage, on average, if they come from countries with lower
bank efficiency, lower market capitalization rate.
Finally, we estimate a conditional fixed effects logit model to formally
determine the likelihood of having excess leverage (EXCESSTD and EXCESSTL) in
terms of various firm, industry and country level characteristics in our sample. We
choose fixed rather than random effects model to determine the likelihood of excess
leverage because the former reduces the potential endogeneity bias arising from
unobserved firm-specific heterogeneity in the data. Among the firm-level
characteristics, we include firm size (log of total assets), age (in years), share of fixed
assets in total assets (FATA), share of intangible assets in total assets (IFATA) and
profitability (EBIT as a share of total assets). In addition, we include country inflation
rate, efficiency of the banking sector (BANKEFF) and also the ratio of market
capitalization to GDP (MKTGDP) to control for country-level variations in these
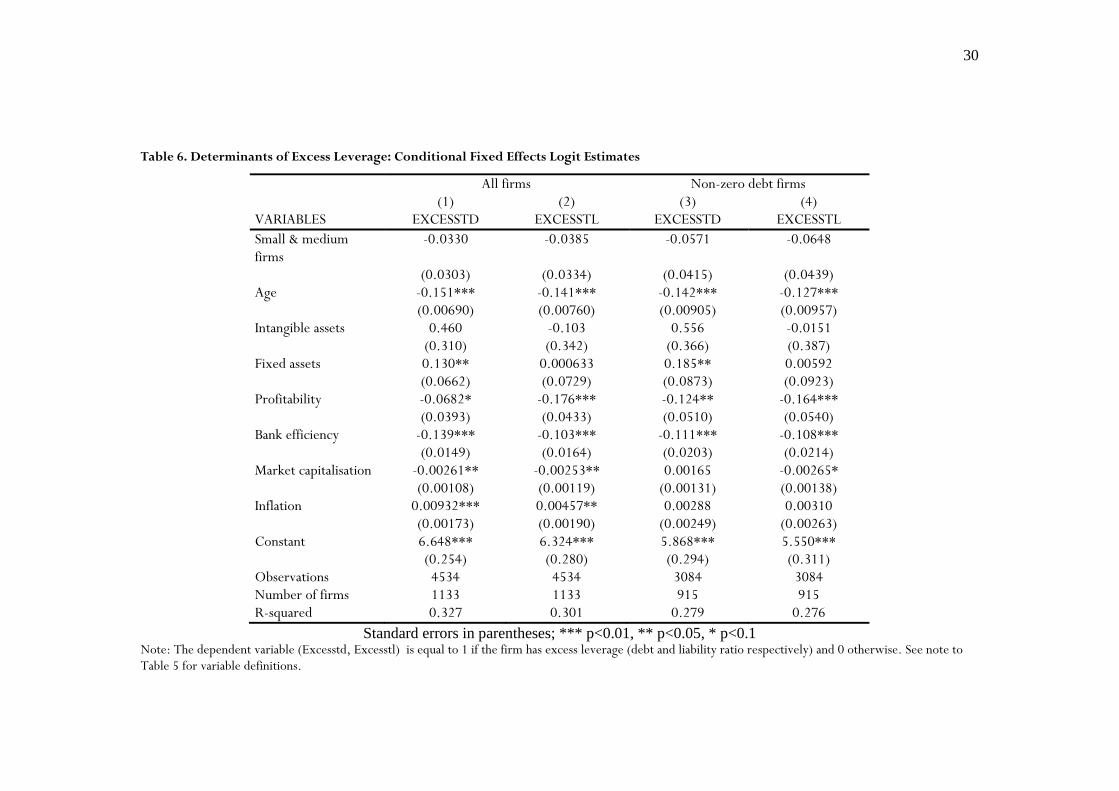
respects. Table 6 shows the conditional fixed effects logit estimates of excess debt
(EXCESSTD) and excess liability (EXCESSTL) ratios for the pooled panel data.
Naturally, the time invariant variables are dropped from the logit fixed effects
estimates. Two sets of estimates are shown here and these estimates correspond to
the choice of sample: (a) all firms and (b) non-zero debt firms. In line with Table 5,
these estimates establish the significant role of institutions on the presence and
persistence of excess leverage, after controlling for other covariates, in our sample.
While greater inflation enhances the probability of excess leverage, higher efficiency
of the banking sector and higher market capitalization to GDP are generally
12
associated with a lower probability of firms having excess leverage (note however
that the effect of market capitalization is insignificant in determining EXCESSTD
among non-zero debt firms). Clearly, a more efficient banking sector is able to
screen out bad loans while a greater degree of market capitalization not only offers an
alternative source of external finance, but could also contribute to improved
corporate governance practices. There is thus evidence that the incidence of excess
leverage among sample firms is linked to weaker financial institutions in our sample
of CEE countries.
3. Implications of Excess Leverage for TFP Growth
The analysis so far has shown that while access to loans is limited for a significant
proportion of firms in our sample, excess leverage is common among firms with
some positive loans. It has also been established that the presence and persistence of
excess leverage among sample firms is closely related to the quality of financial
markets and institutions. The final task in this paper is to examine the effect of excess
leverage, if any, on firm performance measured by total factor productivity (TFP)
growth. Our central hypothesis is that while moderate levels of debt can stimulate
TFP growth, through providing finance for new technology, innovation or new
capacity, after a given threshold, this debt becomes a drag on performance, as the
firm has to focus on cash flow in order to service the debt, rather than continued
improvements in productivity. As discussed above, firms with excess debt are
extremely vulnerable to unexpected adverse demand shocks.
In order to test this hypothesis one could possibly use a fixed-effects model to
regress total factor productivity growth on excess leverage and its non-linear terms,
after controlling for other covariates. But this may raise questions, especially because
the conventional method does not allow us to endogenously determine the particular
13
leverage level that may harm total factor productivity growth. All we could do is to
experiment with different leverage levels and try to identify some leverage that could
harm productivity growth. Accordingly, we employ the threshold regression analysis
of Hansen (2004) to the data. This identifies the threshold levels of leverage beyond
which further increases in leverage could lower total factor productivity growth. We
begin by examining this in the aggregate, and subsequently move on to some
comparisons across countries, and across different types of firms.
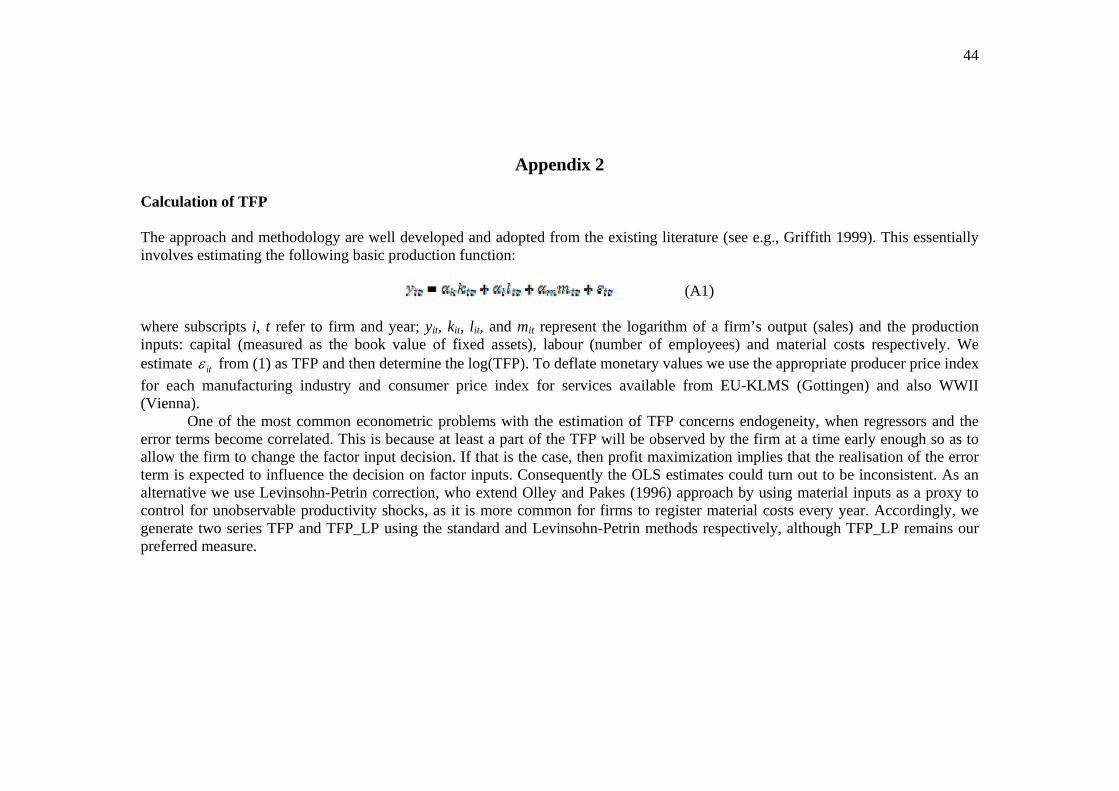
3. Leverage and Total Factor Productivity
Estimates of TFP are generated using the well understood Levinsohn-Petrin method
(a la Levinsohn and Petrin, 2003). Given that we were able to find industry-level
price deflators for only 9 out of 12 of the sample countries, this TFP measure could
be constructed for these 9 countries only, thus excluding firms from Croatia,
Romania and Serbia from our original sample analyzed in section 2.
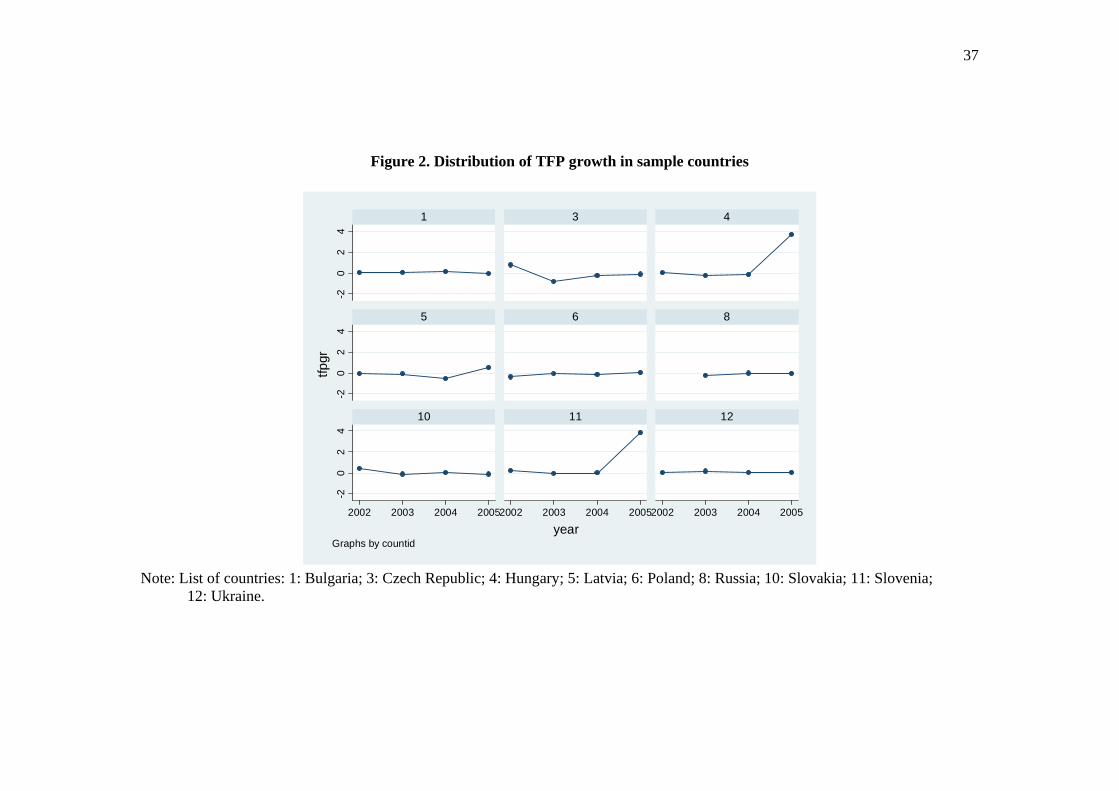
Figure 2 plots average TFP growth for these nine countries during 2001-
2005. Clearly, TFP growth rate has been rather stable in most countries with the
exception of Hungary and Slovenia during the sample period 2001-2005.
3.2. An Endogenous Threshold Model
The threshold model is particularly relevant to test our central hypothesis, as it
endogenously determines the existence and significance of one or more leverage
thresholds (and the corresponding confidence intervals), which in turn allows us to
assess the growth effects of leverage as a nonlinear process. Depending on whether
the leverage is less than, equal to or greater than the threshold, we could obtain
marginal effects associated with different bands of leverage in the model and also test
whether the marginal effects are significantly different.
14
Let us start with the simplest threshold model for total factor productivity
growth of the i-th firm for the period [t, t+1] as follows:
ΔTFPit+1 = α1 Lit + β’Xit+νit if Lit ≤γ (3a)
ΔTFPit+1 = α2 Lit + β’Xit+νit if Lit >γ (3b)
Combining (3a) and (3b), we could write:
ΔTFPit+1 = β’Xit+α1 Lit I(Lit ≤γ) + α2 Lit I(Lit >γ)+νit (4)
where Lit is the initial value of leverage (i.e., debt or liability ratio). I(.) represents
an indicator function, indicating whether leverage measure of the i-th firm at time t is
less than equal to or greater than a threshold parameter ; is the endogenous
threshold value to be estimated from the model (please see discussion in section
below). The errors νit are assumed to be independent and identically distributed with
mean zero and finite variance. Depending on whether the actual leverage is
smaller/equal to or larger than the threshold value ( ) to be estimated, observations
are divided into two “regimes” where the regimes are distinguished by differing
regression slopes, 1 and 2 .
Let Sn(β,α( )) represent the sum of squared errors for equation (4), where n
is the sample size. Given that the parameters α depend on the threshold parameters
, we denote them by α( )). Because of this dependence, S(.) is not linear in the
parameters but rather a step function where steps appear at some distinct values of
the threshold variable . But conditional on a given threshold value, say = 0, S(.)
is linear in β and α. Accordingly, S(β,α( 0)) can be minimised to yield the
conditional OLS estimates βˆ( 0) and αˆ( 0). Among all possible leverage values,
the estimate of the threshold corresponds to that value of α, which minimises the
sum of squared errors S(β,α( 0)) for =0. Following Girma (2005), this
minimisation problem is solved by a grid search over 393 leverage quantiles {1.00%,
15
1.25%, 1.50%, …, 98.75%, 99%}. Once the sample splitting value of is
identified, the estimates of the slope parameters are readily available.
If a threshold effect is identified, i.e.., α1≠α2, it is important to form a
confidence interval for the particular threshold value in this context. This
necessitates us to test the following null hypothesis:
Ho : γ= γ0
Under normality, the likelihood ratio (LR) test statistic is routinely used in standard
econometric applications to test for particular parametric values. But Hansen (2000)
shows that LRn(γ) does not have a standard chi-square distribution in the threshold
model. The correct distribution function and the appropriate asymptotic critical
values need to be obtained from the bootstrapped standard errors (see Girma 2005
for further details).
Suppose that the two confidence limits of the threshold are given
respectively by 1 (lower) and 2 (upper). This allows us to define three sets of
leverage variables as follows. Using debt ratio (TDTA) as the particular leverage
measure, we generate tdta- (i.e., tdta≤ 1), tdta= (i.e., 1<tdta≤ 2) and tdta+
(i.e., tdta> 2); similarly using the liability ratio as an alternative leverage measure,
we generate tlta- (i.e., tlta≤ 1), tlta= (i.e., 1<tlta≤ 2) and tlta+ (i.e., tlta> 2).
Accordingly, equation (4) is modified as follows:
ΔTFPit+1 = α1 Lit I(Lit ≤γ1) + α2 Lit I( 1<Lit ≤ 2) +α3 Lit I(Lit > 2)+ β’Xit +νit
(5)
In addition to different bands of leverage as shown in equation (5), we include initial
values of a number of other control variables Xit, namely, firm size (SME), age
(Young), share of intangible assets (IFATA), ownership (foreign) and also some
institutional characteristics, namely, efficiency of the banking sector and also the
16
extent of market capitalization to GDP.8 This is because the extent to which debt will
act to restrict productivity growth is expected to vary with the size/efficiency of the
financial market. The more effective the market, the less likely moral hazard would
lead to excess leverage, and the lower the level of debt the firms may accrue before
the servicing the debt acts as a constraint. Xit-1 also includes the initial value of TFP as
a control variable; significance of initial TFP will highlight the importance of Barro’s
conditional convergence hypothesis.
The final step in this estimation strategy is to establish the asymptotic
distribution of the slope coefficients. Although these parameters depend on the
estimated threshold limits 1 and 2, Hansen (2000) demonstrates that this
dependence is not of first-order asymptotic importance. Consequently, the usual
distribution theory (i.e. asymptotically normal) can be applied to the estimated slope
coefficients so that one could use the asymptotic p-values to test whether there is a
significant threshold effect, i.e., if α1= α2= α3=0 ; rejection of the null hypothesis
would confirm the presence of a significant threshold effect. 9
3.3. Threshold estimates
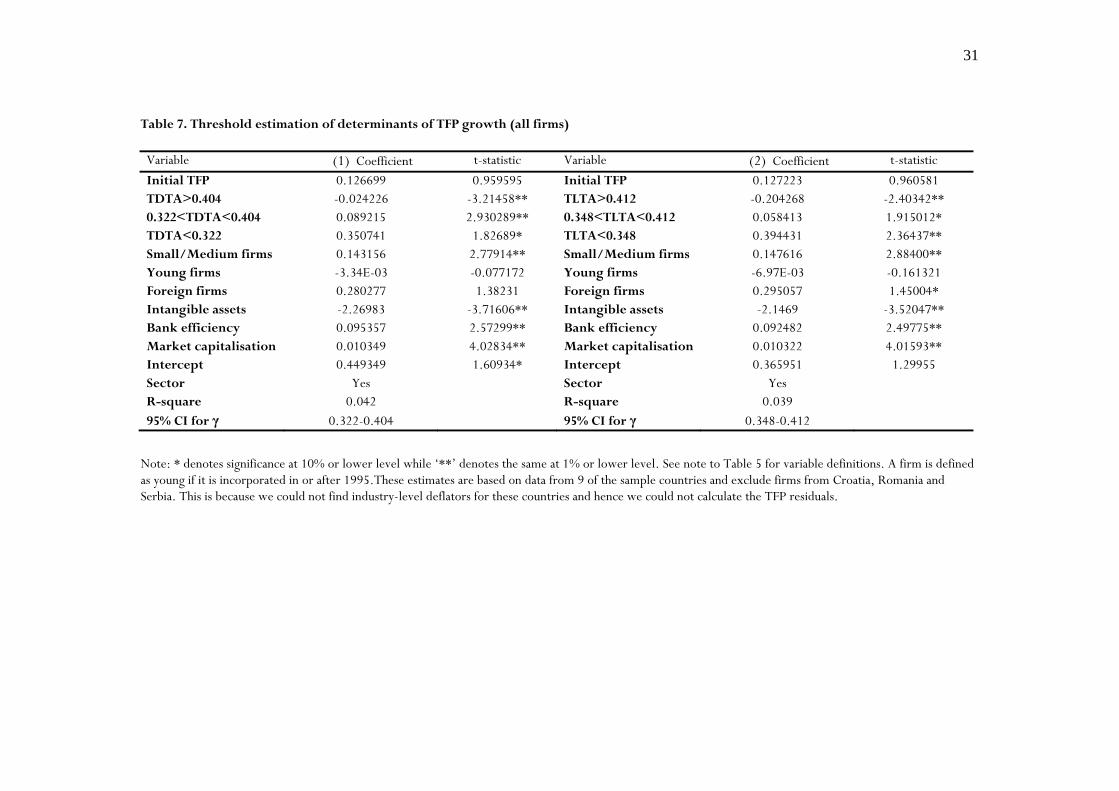
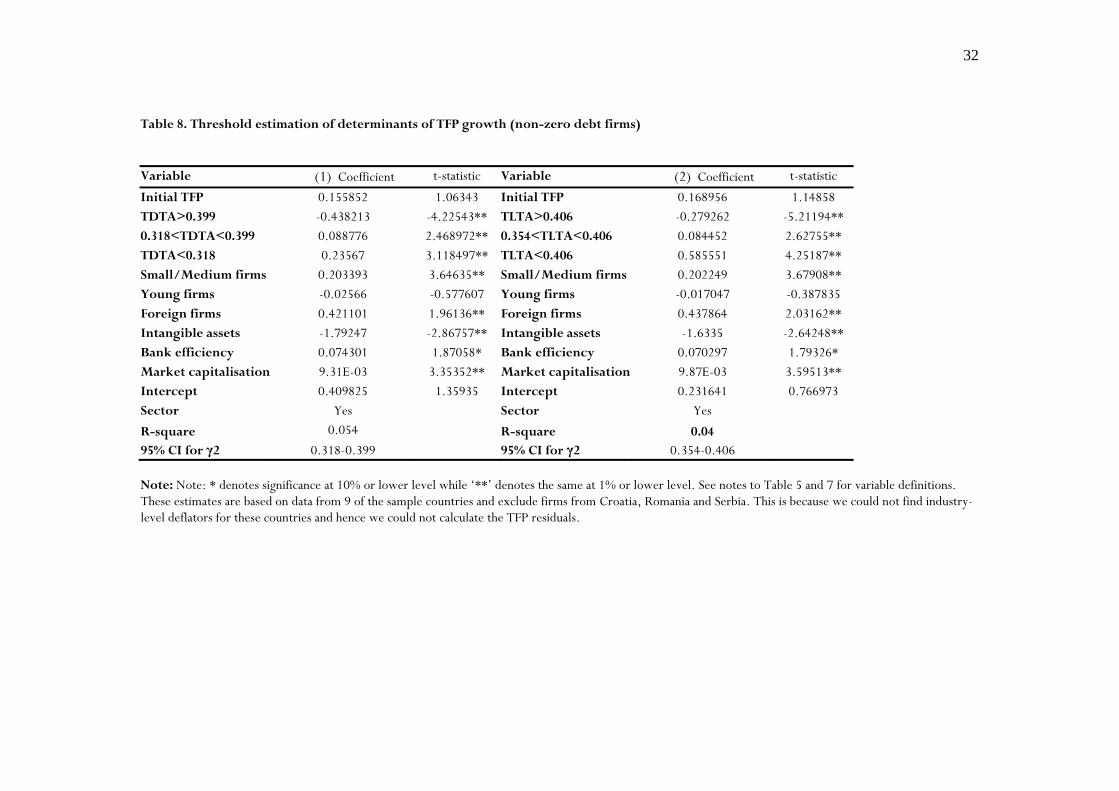
Threshold estimates for TFP growth are summarized in Table 7 and Table 8 for all
firms and non-zero debt firms respectively. We first estimate the 95% confidence
interval for the threshold parameter . The confidence interval varies somewhat for
debt and liability ratios while they tend to be robust irrespective of the choice of the
sample (all firms versus non-zero debt firms).
Initial value of TFP is insignificant; thus there is no evidence of convergence in
our sample. However all three leverage terms relating to different bands of the
leverage thresholds are statistically significant and this holds irrespective of the choice
8 See note to Table 6 for variable definitions. 9 This procedure is explained in detail in Henry et al. (2003) and Girma (2005).
17
of the leverage measure, debt or liability ratio. There is thus evidence that, after
controlling for all other factors, moderate leverage (leverage≤ 2) could boost TFP
growth, while excessive leverage (leverage> 2) lowers it. It is also evident that the
marginal effect of an increase in leverage is significantly different for different bands
of leverage and it decreases as we move from the lower leverage band to the higher
one. In particular, these estimates suggest that a debt or liability ratio of around 40%
or higher would lower TFP growth in our sample.
Among other results, the role of institutional factors is worth highlighting
here. In particular, higher efficiency of the banking sector and higher market
capitalization are both associated with higher TFP growth, thus confirming the
beneficial role of institutions on long-run economic growth. The effect of intangible
assets however turns out to be negative. While often intangible assets are taken to be
a measure of R&D, they also include overvalued goodwill and patents (which may
correspond to the expected future value of intangible assets). Thus it is not unusual
for intangible assets to have a negative effect on TFP growth.
Given the possibility of reverse causation (i.e., more efficient firms may
choose lower equity ratios and hence higher debt than others), it is also important to
test the robustness of our estimates for more/less efficient firms. In the absence of
any better indicator, we consider profitability as an index of efficiency and classify
firms according to (a) profit margin and (b) return on capital. In the light of our
sample distribution, we consider two benchmark values for (a) and (b): (1) whether
the firm has positive profit or rate of return on capital (ROCE) and (2) whether the
firm has profit margin or ROCE in excess of the median values (which are about 0.04
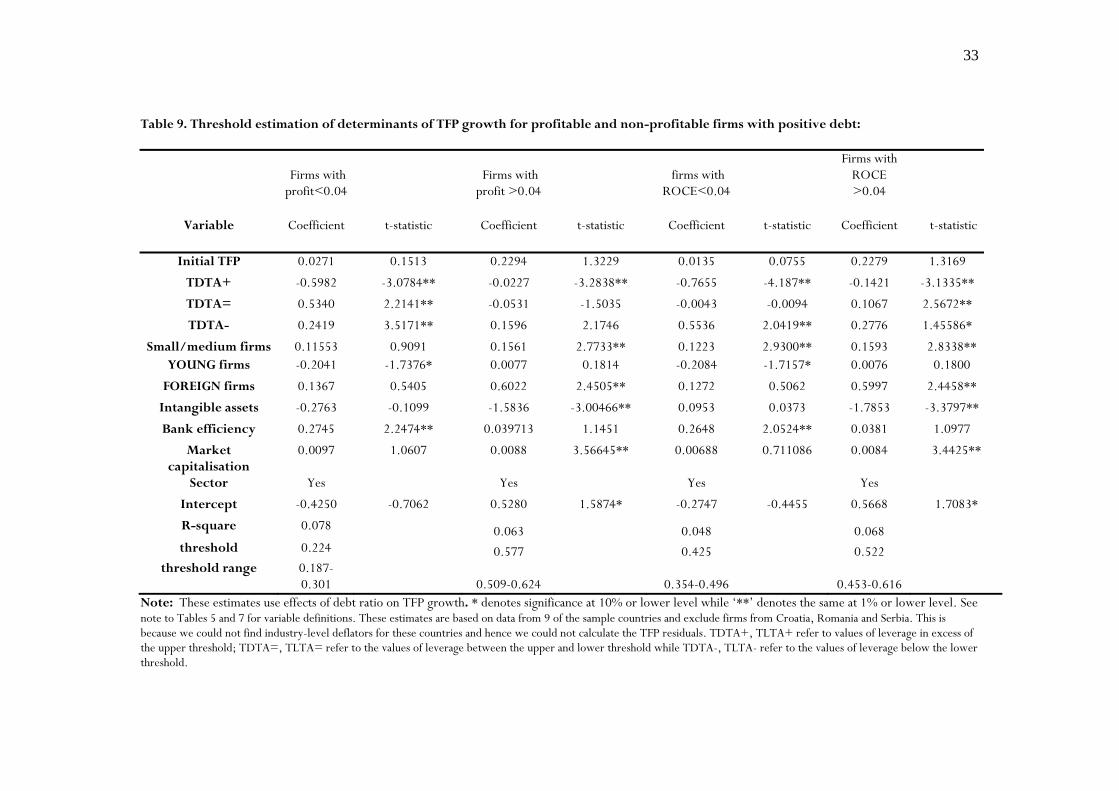
for both these variables in our sample). Threshold estimates for non-zero debt firms
for “profitable” and “non-profitable” firms are shown in Table 9. Naturally, the
estimated threshold parameters are somewhat different, but they are well in line with

18
the previous estimates for the pooled sample. As before, these estimates confirm the
significant adverse effect of excessive leverage (beyond the upper threshold) on TFP
growth in our sample. The contrast between profitable and non-profitable firms is
also interesting. First, the upper threshold value of leverage is higher for more
profitable firms. Second, the marginal adverse effects of excess leverage on TFP
growth are also different between these two groups of firms. The absolute marginal
effect of excessive leverage (beyond the upper threshold) is significantly higher for
non-profitable firms, thus suggesting that effects of excess leverage are particularly
bad for non-profitable firms.
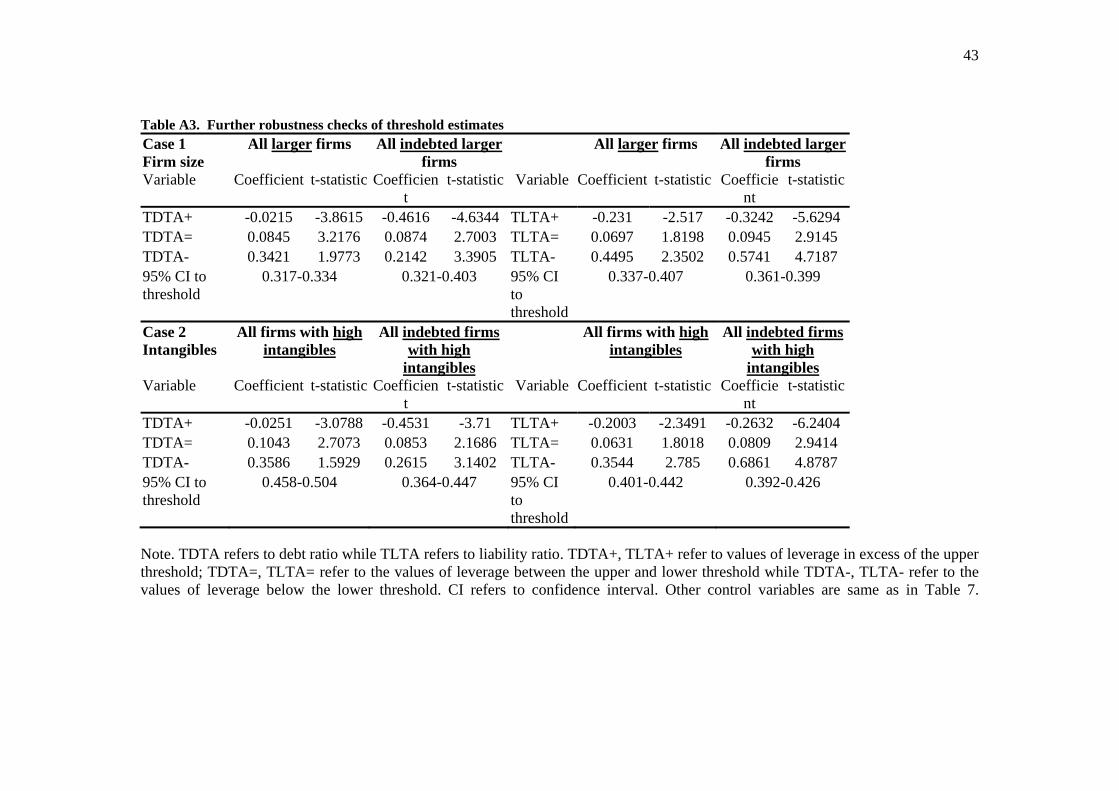
Further robustness checks are done by splitting the sample by median firm size
(defined by total assets) and median intangible assets ratio. In each case, we estimate
the threshold model for firms in the upper half of the distribution of each of these
variables. Threshold effects for each case are summarized in Appendix Table A3,
which highlights the robustness of our results. The threshold estimates are quite
stable across the various samples classified by firm size and intangible assets.
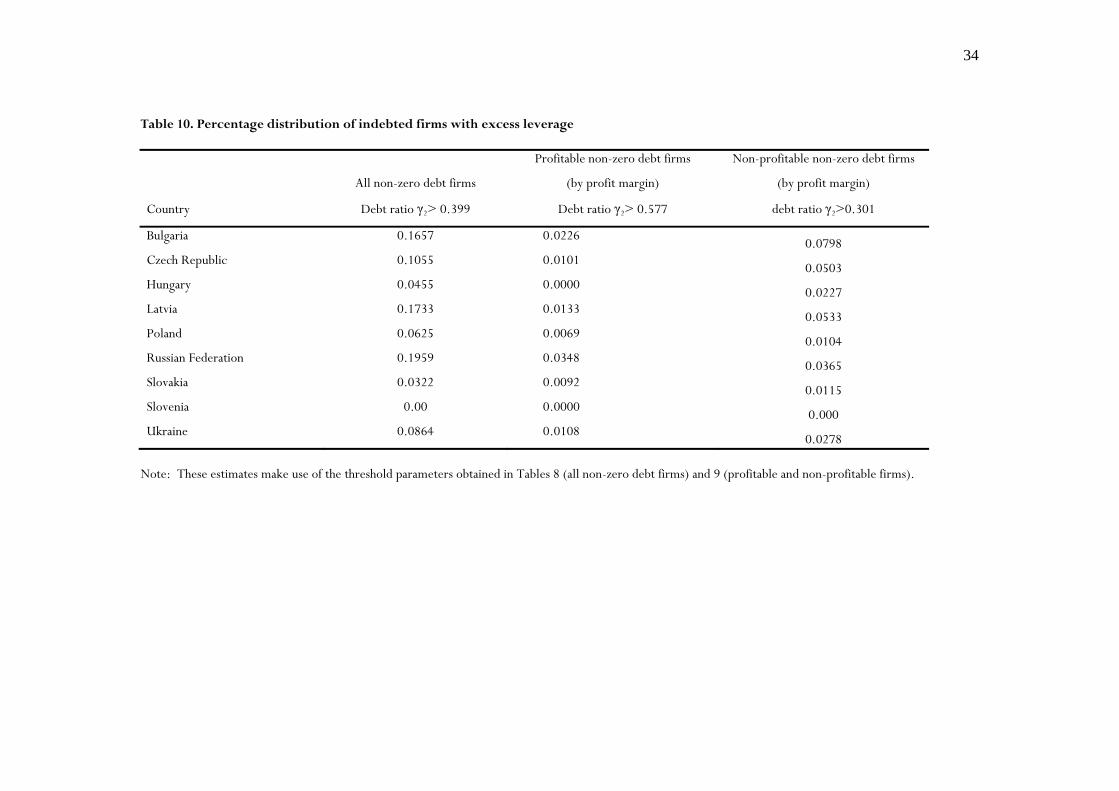
Finally, we use the leverage threshold estimates to calculate the percentage of
firms above the upper threshold for each sample country. In this respect, we
particularly focus on non-zero debt firms, distinguishing profitable firms (those with
above median profit margin) from others. Results of our analysis are summarized in
Table 10. Clearly, a significant proportion of all non-zero debt firms in many sample
countries tend to have debt ratios in excess of the upper threshold limits; the
proportion is significantly less when we consider more profitable non-zero debt
firms. Furthermore, excess leverage is also common among non-profitable firms in
most sample countries, with the exception of Slovenia. This is further highlighted in
the pronounced inter-country variation: the proportion of firms with excessive
leverage is zero in Slovenia while it is the highest in Russia. Results from our analysis
thus highlight the aspect of inefficient allocation of credit and also its adverse effects
19
on TFP growth, especially among non-profitable firms.
The upshot of our analysis is that unlike the conventional analysis one is able
to endogenously determine the 95% confidence interval for the leverage threshold .
This in turn allows us to test for the non-linearity in the relationship between
leverage and TFP growth, if any. While moderate leverage could boost TFP growth,
excessive leverage beyond the upper threshold limit would significantly lower TFP
growth and this result is robust across various subsamples considered. The estimated
upper leverage limit is about 40% irrespective of the leverage measure used. This is a
significant finding, especially in an economic climate where excessive corporate
leverage has been blamed for the current credit crunch. Our analysis allows the data
to identify the safe threshold limit of leverage for the sample countries, which could
guarantee significantly positive TFP growth. Our results have already been adapted in
the Transition Report (EBRD 2009, p. 69-70), highlighting the relevance of the
threshold model for policy making.
3.4. Role of Financial Institutions
Clearly the sample countries are heterogeneous in terms of efficiency of financial
markets and institutions and, among various indices, our analysis has particularly
highlighted the significant role of bank efficiency and market capitalization, not only
on the likelihood of excess leverage (e.g., see Table 6), but also on total factor
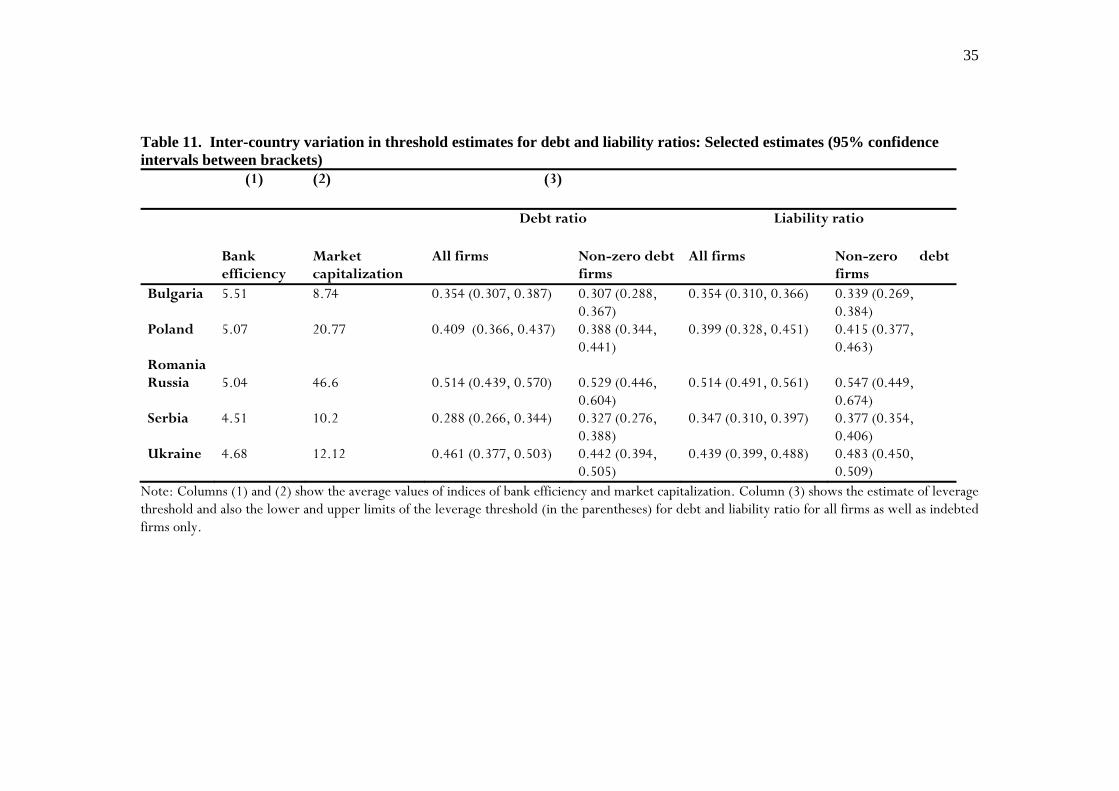
productivity growth (Tables 7-9). In order to explore the possible role of selected
indices of financial institutions further, we now estimate the threshold model for
individual countries, each characterized by given efficiency of financial institutions.
Table 11 summarizes the threshold estimates for five of the nine sample countries
namely Bulgaria, Poland, Russia, Serbia and Ukraine. We were unable to obtain
estimates for the remaining countries, as the grid search process failed to identify the
sample-splitting value of the threshold. We do not show the full set of estimates for
20
brevity, but they are available on request.
Our central results remain unchanged in that moderate leverage continues to
have a positive impact on TFP growth while high leverage (beyond the upper
threshold limit) affects TFP growth negatively and the result holds for all five
countries. Note, however, that the leverage thresholds tend to vary among these
five countries: Serbia has the lowest (0.288) while Russia has the highest (0.514)
leverage threshold in our sample. Given that these country-specific estimates are
available only for 5 countries, it is hard to derive a definite relationship between
financial institutions, as proxied by bank efficiency and market capitalization rate, and
the estimated upper leverage threshold (above which TFP growth is affected
negatively). As a rule of thumb, we calculate the correlation between the country-
specific threshold levels on the one hand and bank efficiency and market capitalization
on the other for the 5 countries included in Table 11. While the correlation
coefficients between bank efficiency and leverage threshold are negative (-0.15 and -
0.26 respectively for debt ratio and liability ratio), those between market
capitalization and the threshold level turn out to be positive (0.85 and 0.81
respectively for debt and liability ratios) for non-zero debt firms in our sample. These
simple correlation coefficients perhaps highlight several, possibly conflicting,
channels affecting the relationship between selected indices of financial markets and
the estimated leverage threshold.10 In particular, upper leverage threshold is lower
among firms from countries with greater bank efficiency, suggesting the beneficial
role banks can play to screen and monitor good loans so as to avoid the kind of
financial crisis that we experienced recently. We hope future research will shed
further light in this respect.
10 For example, greater market efficiency means that loans are channeled to the "right" firms, i.e. those with positive NPV projects that can sustain higher debt levels without running into difficulties (positive impact on upper threshold). In contrast, investors (be it banks or shareholders) in more efficient markets may start imposing discipline earlier, thus resulting in a negative impact on upper threshold (e.g., see ‘Bad Management hypothesis’ in Berger et al., 1997).
21
4. CONCLUSION
The sizeable literature on capital structure and its dynamics in developed countries
identifies the possible factors causing under-levering of firms and ways to adjust it. It
is however common among firms in many developing and transition economies to
maintain excess leverage though we know very little about the nature and
implications of excess leverage for TFP growth. This paper is an attempt to bridge
this gap in the literature, primarily using Orbis firm-level panel data from a group of
CEE emerging economies. This allows us to understand the way corporate financial
behavior could affect the wider economy.
We start with an analysis of excess leverage conventionally defined as the
deviation of actual leverage from an optimal level derived from the fitted leverage
values of a fixed-effects model. This analysis highlights that a significant proportion of
firms do not have access to any bank loans while excess leverage is common among
indebted firms and also that, ceteris paribus, the likelihood of firms being over-
levered is closely linked to low bank efficiency and market capitalization.
The central task of the paper is to test the hypothesis that moderate leverage
could boost productivity growth while very high leverage could lead to financial
distress and even bankruptcy in response to adverse shocks and could thus lower
productivity growth. In this respect, we use a threshold model (a la Hansen, 2000) to
endogenously determine the presence and significance of threshold effects of leverage
on TFP growth. Threshold estimates identify an upper threshold limit (about 40% of
total assets) beyond which further increases in leverage could adversely affect TFP
growth in the sample. Results are robust and hold not only in the full sample, but
also in various subsamples including large firms, firms with more intangible assets as
well as more profitable firms. Note however that the adverse effects of excessive
22
leverage are particularly high for non-profitable firms. There is also suggestion that
the leverage thresholds vary across the sample countries at different levels of financial
development, thus highlighting the possible role of financial institutions on
productivity growth.
Evidence of excess leverage reflects aspects of microeconomic inefficiencies in
credit allocation among firms in the sample countries, especially those with weaker
financial markets and institutions. While it is essential for firms to deleverage under
the circumstances, one also needs to be cautious so that ‘virtuous’ firms are not
starved of essential credit.
23
References
Almeida, H, M. Capello and M. Weisbach. (2005) ‘Cash Flow Sensitivity of Cash’, The Journal of Finance, vol.59, issue 4, 1777 – 1804.
Antoniou, A., Y. Guney and K. Poudiyal. (2008). ‘The Determinants of Capital Structure: Capital Market Oriented Versus Bank Oriented Institutions’, Journal of Finance and Quantitative Analysis 43(1).
Beck, T, A. Demirgüc-Kunt and V. Maksimovic. (2002). ‘Financing Patterns Around the World: The Role of Institutions’, World Bank Policy Research Working Paper 2905.
Berger, A.N. and D.B. Humphrey. 1992. ‘Measurement and Efficiency Issues in Commercial Banking’ in Z. Griliches (ed.) ‘Output Measurement in the Service Sectors’, NBER studies in Income and Wealth, Vol. 56, University of Chicago Press, Chicago, 245-79.
Berger, A., J.K. Johnson, W. Qinyu and R. De Young. 1997. ‘Problem Loans and Cost Efficiency in Commercial Banks’, Journal of Banking and Finance 21, 849-870.
Berger, A. and di Patti, E. B. (2006). ‘Capital structure and firm performance: a new approach to testing agency theory and an application to the banking industry’, Journal of Banking and Finance, 30(4) 1065-1102.
Bernanke, B. and M. Gertler. 1995. ‘Inside the Blackbox: Credit Channel of Monetary Policy Transmission’ Journal of Economic Perspectives 9, 27-48.
Bonin, J. P. Wachtel and I. Hasan. (2005). ‘Privatization Matters: Bank Efficiency in Transition Countries’, Journal of Banking and Finance 29(8/9) 2155-2178.
Booth, L. V. Aivazian, A. Demirgüc-Kunt and V. Maksimovic. (2001). ‘Capital Structure in Developing Countries’, Journal of Finance, 56.
De Haas R. and M. Peters. (2004). ‘The Dynamic Adjustment Towards Target Caital Structures of Firms in Transition Economies’, EBRD working paper No. 87.
Demirgüc-Kunt, A. and V. Maksimovic. (1995) ‘Stock Market Development and Firm Financing Choices’, Policy Research Working Paper 1461, The World Bank, Policy Research Department, Finance and Private Sector Development Division, Washington DC.
Driffield, N. and S. Pal. (2010) ‘Evolution of Capital Structure in East Asia: Corporate Inertia or Endeavours?, Journal of Royal Statistical Society (Series A), 173(1), 1–29.
Demirguc-Kunt, A. and V Maksimovic. (1998). Law, Finance, and Firm Growth, The Journal of Finance, 1998 - Blackwell Synergy.
EBRD (2009) Transition Report 2009: Transition in Crisis? Evans, D.S. (1987) ‘Tests of Alternative Theories of Firm Growth’, The Journal of Political Economy,
1987, vol. 95(4). Faria, A. and Paolo Mauro (2004) “Institutions and the External Capital Structure of Countries”,
IMF Working Paper WP/04/236. Fischer, E.O., Heinkel,R., Zechner,J. (1989) ‘Dynamic capital structure choice: theory and tests’.
Journal of Finance, 44, 19 –40. Flannery, M.J. and K. Rangan. (2006) ‘Partial Adjustment Toward Target Capital Structures’,
Journal of Financial Economics 79, 469-506. Frank, M. and B. Goyal. (2009). ‘Capital Structure Decisions: Which Factors are Reliably
Important?" (with Murray Z. Frank), Financial Management, 38(1), 1-37. Girma, S. (2005). ‘Absorptive Capacity and Productivity Spillovers from FDI: A Threshold
Regression Analysis’, Oxford Bulletin of Economics and Statistics 67(3) 281-306. Girma,S., M. Henry, R. Kneller and C. Milner (2003)Threshold and Interaction Effects in the
24
Openness-Productivity Growth Relationship: The Role of Institutions and Natural Barriers GEP working paper 2003/32, Nottingham.
Goldstein, R., N. Ju and H. Leland. (2001) An EBIT based Model of Dynamic Capital Structure’, Journal of Business 74(4).
Greenspan, A. (2002). Testimony of Chairman Alan Greenspan Federal Reserve Board’s Semi Annual Monetary Policy Report to the Congress Before the Committee on Financial Services, US House of Representatives February 27.
Griffith, R. (1999). Using the ARD establishment level data to look at foreign ownership and productivity in the United Kingdom. Economic Journal, 109, 416-42.
Hansen, B. E. (2000). ‘Sample splitting and threshold estimation’, Econometrica, Vol. 68, 575–603.
Hovakimian, A., G. Hovakimian., and H. Tehranian (2004) ‘Determinants of target capital structure: The case of dual debt and equity issues’. Journal of Financial Economics, Volume 71 (3), 517-540.
Kyotaki, N. and J. Moore. (1997). ‘Credit Cycles’, Journal of Political Economy, 105, 211-248. Lang, L., E. Ofek and R. M. Stulz (1996) “Leverage, investment, and firm growth”,
Journal of Financial Economics, 40, 3-29. Levinsohn, J. and Petrin, A. (2003). Estimating production functions using Inputs to control for unobservables. Review of Economic Studies, 70, 317-341. Myers, S.C. (1984) ‘Capital Structure Puzzles’, Journal of Finance, 39, 575-92. Myers, S.C. and N. Majluf. (1984). ‘Corporate Financing and Investment Decisions when Firms
Have Information Investors do not Have, Journal of Financial Economics, 13, 187-221. Nivrozhkin, E. (2005). ‘The Dynamics of Capital Structure in Transition Economies’, Economics of
Planning. Olley, S. and Pakes, A. (1996). The Dynamics of Productivity in the Telecommunications Equipment Industry. Econometrica, 64 (6), 1263-98. Rajan, R. and L. Zingales. (1995) ‘What Do We Know About Capital Structure? Some evidence
from international data,’ Journal of Finance, 50, 1421-1460. Rogoff, K. (1999). "International Institutions for Reducing Global Financial Instability," Journal of
Economic Perspectives, American Economic Association, 13(4), 2. Sarkar, S. and F. Zapatero. (2003). 'The Trade-off Model with Mean Reverting Earnings: Theory
and Empirical Tests', Economic Journal. Strebulaev, I. (2007). ‘Do Tests of Capital Structure Theory Mean What They Say?’, Journal of
Finance 62, 1747-1788.
25
Table 1: Cross-country variation in leverages 2001-2005
All firms Non-zero debt
firms
Obs. With missing debt info TLTA TDTA
TLTA
TDTA
Country
Firms Total Obs.
Obs. With zero debt
(%)
(%)
Mean SD Mean SD
Mean
Mean Bulgaria 207 1035 18.2 (17.7) 0.59 0.94 0.18 0.33 0.62 0.24 Croatia 129 645 7.3 (86.7) 0.39 0.22 0.06 0.13 0.37 0.13 Czech 68 340 12.6 (28.8) 0.52 0.66 0.19 0.32 0.58 0.23 Hungary 22 110 16.4 (43.6) 0.40 0.21 0.09 0.12 0.43 0.13 Latvia 26 130 10.8 (31.5) 0.49 0.53 0.18 0.20 0.55 0.22 Poland 162 810 25.3 (39.1) 0.53 0.35 0.10 0.13 0.56 0.16 Romania 51 255 78.4 (6.3) 0.45 0.32 0.02 0.06 0.47 0.11 Russia 415 2075 11.6 (31.6) 0.42 0.26 0.13 0.15 0.69 0.24 Serbia 289 1445 13.7 (2.5) 0.37 0.23 0.12 0.15 0.39 0.14 Slovakia 119 595 6.9 (20.0) 0.60 1.57 0.12 0.13 0.59 0.13 Slovenia 65 325 0.9 (90.8) 0.34 0.17 0.07 0.06 0.40 0.07 Ukraine 159 795 17. (1.1) 0.42 0.26 0.13 0.16 0.45 0.15 Note: TL/TA is the total liability as a share of total assets while TD/TA is total debt (both short and long-run) to total assets. Source: Authors’ own calculation using Orbis data.
26
Table 2: Distribution of debt ratio among firms with positive debt, 2001-2005
Leverage percentiles Average leverage by size (by total assets)
Country 25% 50%
75% 90% 95% 99% Small & medium
firms Large Correlation
(size, leverage) Bulgaria 0.05 0.13 0.28 0.53 0.70 1.55 0.22 0.25 -0.0213 Croatia 0.013 0.11 0.19 0.24 0.42 0.83 0.06 0.18 0.304* Czech Republic 0.045 0.14 0.27 0.40 0.97 2.19 0.20 0.25 0.013 Hungary 0.009 0.14 0.18 0.24 0.29 0.65 0.13 0.13 -0.054 Latvia 0.07 0.16 0.27 0.52 0.71 0.82 0.27 0.19 -0.163 Poland 0.06 0.13 0.23 0.36 0.44 0.68 0.18 0.15 -0.147* Romania 0.015 0.07 0.16 0.21 0.27 0.70 0.09 0.12 0.163 Russia 0.06 0.15 0.33 0.51 0.61 1.3 0.27 0.19 -0.19* Serbia 0.03 0.08 0.21 0.35 0.44 0.65 0.12 0.16 0.217* Slovakia 0.033 0.096 0.18 0.30 0.38 0.64 0.11 0.15 0.153* Slovenia 0.032 0.07 0.12 0.15 0.17 0.20 - 0.07 0.270 Ukraine 0.036 0.10 0.22 0.38 0.47 0.72 0.17 0.15 -0.093* Source: Authors’ own calculation using Orbis data.
27
Table 3: Distribution of Excess leverage in the sample countries All firms with debt>0 Proportion of firms with
Excess leverage L-L*>0 Average gap for firms with excess leverage
Country Debt ratio Liability ratio Debt ratio Liability ratio Bulgaria 0.7575 0.7515 1.78 1.9079 Croatia 0.8372 0.6977 2.32 1.1916 Czech Republic 0.7789 0.8040 2.0477 1.2136 Hungary 0.7955 0.7727 1.42 1.1009 Latvia 0.8133 0.7867 1.7852 1.1360 Poland 0.8541 0.7951 2.5587 1.1912 Romania 0.5451 0.7490 3.787 1.2433 Russia 0.8226 0.7776 2.1171 3.0655 Serbia 0.7944 0.8026 2.89 1.2986 Slovakia 0.7563 0.7632 1.94 1.7744 Slovenia 0.6667 0.8519 1.2779 1.1706 Ukraine 0.7392 0.7824 1.7866 1.2191 Source: Authors’ own calculation using Orbis data.
28
Table 4. Financial institutional in CEE countries 2001-2005
COUNTRY
[1] Size of the banking
sector
[1] Efficiency of the
banking sector
[1] Stability of
the banking sector
[1] Equity market
efficiency
[3] Market capitalization
to GDP
[2] Creditors’
rights
[3] Share of foreign banks
[3] Bank reform
[3] Competition
reform Bulgaria 4.84 5.51 4.64 6.68 8.74 2.00 77.34 3.40 2.38
Croatia 5.76 4.89 4.42 NA 23.69 3.00 89.64 3.74 2.30
Czech Republic 5.35 4.72 5.01 3.55 22.69 3.00 86.10 3.76 2.94
Hungary 5.21 5.37 4.70 4.23 23.51 1.00 76.12 4.00 3.12
Latvia 4.71 5.34 3.47 4.78 10.38 3.00 53.50 3.62 2.60
Poland 5.07 5.67 5.04 5.03 20.77 1.00 72.00 3.38 3.06
Romania 3.95 4.23 4.69 3.85 11.03 1.67 55.36 2.82 2.30
Russian Federation 4.5 5.04 4.82 3.00 46.59 1.67 8.04 2.00 2.30
Serbia NA 4.51 NA NA 10.17 2.00 36.46 2.12 1.00
Slovakia 5.52 4.76 6.07 NA 7.84 2.00 90.54 3.46 3.12
Slovenia 5.43 5.09 3.77 4.55 23.38 3.00 18.74 3.30 2.70
Ukraine 4.49 4.68 2.05 NA 12.12 2.00 2.30 13.98 3.32
[1]: Source: FSDI, World Bank. [2] Source: La Porta et al. [3] Source EBRD.
29
Table 5. Mean comparison of selected characteristics of firms with/without excess debt ratio 2001-2005 Liability ratio Debt ratio L-L*>0 L-L*<0 T-stat L-L*>0 L-L*<0 T-stat Foreign 0.28 0.32 -2.507** 0.28 0.29 -0.310 SME 0.51 0.48 1.983* 0.50 0.45 3.293*** Age 36.63 41.80 -4.832*** 37.87 41.08 -2.489** Log(total assets) 9.55 10.37 -12.982*** 9.55 10.2 -12.690** Fixed assets 0.55 0.53 3.675*** 0.55 0.53 2.646** Intangible assets (as a share of total assets)
0.009 0.10 -0.581 0.009 0.10 -0.745
Profitability EBITTA -0.27 0.045 -1.036 -0.27 0.045 -1.036 Efficiency of the banking sector
4.97 5.0 -1.412 4.97 5.04 -3.523***
Market capitalization 21.9 26.7 -8.960*** 21.9 29.2 -10.204*** Inflation rate 12.8 8.4 17.858*** 12.5 9.3 12.776** Note: There are no firms where actual leverage is equal to the optimal leverage. Foreign=1 if firm is foreign-owned; 0 otherwise.SME=1 if a firm is in quartiles 1 and 2 of the sample distribution of total assets and 0 otherwise. Age: number of years since the firm was incorporated; Total assets are measured in USD thousands; fixed assets are measured in USD thousands. Intangible assets are the ratio of intangible fixed assets to total assets. Profitability is measured as the ratio of earnings before interests and taxes (EBIT) to total assets. Bank efficiency refers to the FSDI Index (1-5) of banking sector efficiency where a higher value means greater efficiency. Market capitalization rate is the ratio of market capitalisation to GDP (in %). Inflation refers to the CPI inflation (in %) Source: Authors’ own calculation using Orbis data.
30
Table 6. Determinants of Excess Leverage: Conditional Fixed Effects Logit Estimates
All firms Non-zero debt firms (1) (2) (3) (4) VARIABLES EXCESSTD EXCESSTL EXCESSTD EXCESSTL Small & medium firms
-0.0330 -0.0385 -0.0571 -0.0648
(0.0303) (0.0334) (0.0415) (0.0439) Age -0.151*** -0.141*** -0.142*** -0.127*** (0.00690) (0.00760) (0.00905) (0.00957) Intangible assets 0.460 -0.103 0.556 -0.0151 (0.310) (0.342) (0.366) (0.387) Fixed assets 0.130** 0.000633 0.185** 0.00592 (0.0662) (0.0729) (0.0873) (0.0923) Profitability -0.0682* -0.176*** -0.124** -0.164*** (0.0393) (0.0433) (0.0510) (0.0540) Bank efficiency -0.139*** -0.103*** -0.111*** -0.108*** (0.0149) (0.0164) (0.0203) (0.0214) Market capitalisation -0.00261** -0.00253** 0.00165 -0.00265* (0.00108) (0.00119) (0.00131) (0.00138) Inflation 0.00932*** 0.00457** 0.00288 0.00310 (0.00173) (0.00190) (0.00249) (0.00263) Constant 6.648*** 6.324*** 5.868*** 5.550*** (0.254) (0.280) (0.294) (0.311) Observations 4534 4534 3084 3084 Number of firms 1133 1133 915 915 R-squared 0.327 0.301 0.279 0.276
Standard errors in parentheses; *** p<0.01, ** p<0.05, * p<0.1 Note: The dependent variable (Excesstd, Excesstl) is equal to 1 if the firm has excess leverage (debt and liability ratio respectively) and 0 otherwise. See note to Table 5 for variable definitions.
31
Table 7. Threshold estimation of determinants of TFP growth (all firms) Variable (1) Coefficient t-statistic Variable (2) Coefficient t-statistic Initial TFP 0.126699 0.959595 Initial TFP 0.127223 0.960581 TDTA>0.404 -0.024226 -3.21458** TLTA>0.412 -0.204268 -2.40342** 0.322<TDTA<0.404 0.089215 2.930289** 0.348<TLTA<0.412 0.058413 1.915012* TDTA<0.322 0.350741 1.82689* TLTA<0.348 0.394431 2.36437** Small/Medium firms 0.143156 2.77914** Small/Medium firms 0.147616 2.88400** Young firms -3.34E-03 -0.077172 Young firms -6.97E-03 -0.161321 Foreign firms 0.280277 1.38231 Foreign firms 0.295057 1.45004* Intangible assets -2.26983 -3.71606** Intangible assets -2.1469 -3.52047** Bank efficiency 0.095357 2.57299** Bank efficiency 0.092482 2.49775** Market capitalisation 0.010349 4.02834** Market capitalisation 0.010322 4.01593** Intercept 0.449349 1.60934* Intercept 0.365951 1.29955 Sector Yes Sector Yes R-square 0.042 R-square 0.039 95% CI for γ 0.322-0.404 95% CI for γ 0.348-0.412
Note: * denotes significance at 10% or lower level while ‘**’ denotes the same at 1% or lower level. See note to Table 5 for variable definitions. A firm is defined as young if it is incorporated in or after 1995.These estimates are based on data from 9 of the sample countries and exclude firms from Croatia, Romania and Serbia. This is because we could not find industry-level deflators for these countries and hence we could not calculate the TFP residuals.
32
Table 8. Threshold estimation of determinants of TFP growth (non-zero debt firms)
Note: Note: * denotes significance at 10% or lower level while ‘**’ denotes the same at 1% or lower level. See notes to Table 5 and 7 for variable definitions. These estimates are based on data from 9 of the sample countries and exclude firms from Croatia, Romania and Serbia. This is because we could not find industry-level deflators for these countries and hence we could not calculate the TFP residuals.
Variable (1) Coefficient t-statistic Variable (2) Coefficient t-statistic Initial TFP 0.155852 1.06343 Initial TFP 0.168956 1.14858 TDTA>0.399 -0.438213 -4.22543** TLTA>0.406 -0.279262 -5.21194** 0.318<TDTA<0.399 0.088776 2.468972** 0.354<TLTA<0.406 0.084452 2.62755** TDTA<0.318 0.23567 3.118497** TLTA<0.406 0.585551 4.25187** Small/Medium firms 0.203393 3.64635** Small/Medium firms 0.202249 3.67908** Young firms -0.02566 -0.577607 Young firms -0.017047 -0.387835 Foreign firms 0.421101 1.96136** Foreign firms 0.437864 2.03162** Intangible assets -1.79247 -2.86757** Intangible assets -1.6335 -2.64248** Bank efficiency 0.074301 1.87058* Bank efficiency 0.070297 1.79326* Market capitalisation 9.31E-03 3.35352** Market capitalisation 9.87E-03 3.59513** Intercept 0.409825 1.35935 Intercept 0.231641 0.766973 Sector Yes Sector Yes R-square 0.054 R-square 0.04 95% CI for γ2 0.318-0.399 95% CI for γ2 0.354-0.406
33
Table 9. Threshold estimation of determinants of TFP growth for profitable and non-profitable firms with positive debt:
Firms with profit<0.04
Firms with profit >0.04
firms with ROCE<0.04
Firms with ROCE >0.04
Variable Coefficient t-statistic Coefficient t-statistic Coefficient t-statistic Coefficient t-statistic
Initial TFP 0.0271 0.1513 0.2294 1.3229 0.0135 0.0755 0.2279 1.3169
TDTA+ -0.5982 -3.0784** -0.0227 -3.2838** -0.7655 -4.187** -0.1421 -3.1335** TDTA= 0.5340 2.2141** -0.0531 -1.5035 -0.0043 -0.0094 0.1067 2.5672** TDTA- 0.2419 3.5171** 0.1596 2.1746 0.5536 2.0419** 0.2776 1.45586*
Small/medium firms 0.11553 0.9091 0.1561 2.7733** 0.1223 2.9300** 0.1593 2.8338** YOUNG firms -0.2041 -1.7376* 0.0077 0.1814 -0.2084 -1.7157* 0.0076 0.1800
FOREIGN firms 0.1367 0.5405 0.6022 2.4505** 0.1272 0.5062 0.5997 2.4458** Intangible assets -0.2763 -0.1099 -1.5836 -3.00466** 0.0953 0.0373 -1.7853 -3.3797** Bank efficiency 0.2745 2.2474** 0.039713 1.1451 0.2648 2.0524** 0.0381 1.0977
Market capitalisation
0.0097 1.0607 0.0088 3.56645** 0.00688 0.711086 0.0084 3.4425**
Sector Yes Yes Yes Yes Intercept -0.4250 -0.7062 0.5280 1.5874* -0.2747 -0.4455 0.5668 1.7083* R-square 0.078 0.063 0.048 0.068 threshold 0.224 0.577 0.425 0.522
threshold range 0.187-0.301 0.509-0.624 0.354-0.496 0.453-0.616
Note: These estimates use effects of debt ratio on TFP growth. * denotes significance at 10% or lower level while ‘**’ denotes the same at 1% or lower level. See note to Tables 5 and 7 for variable definitions. These estimates are based on data from 9 of the sample countries and exclude firms from Croatia, Romania and Serbia. This is because we could not find industry-level deflators for these countries and hence we could not calculate the TFP residuals. TDTA+, TLTA+ refer to values of leverage in excess of the upper threshold; TDTA=, TLTA= refer to the values of leverage between the upper and lower threshold while TDTA-, TLTA- refer to the values of leverage below the lower threshold.
34
Table 10. Percentage distribution of indebted firms with excess leverage
All non-zero debt firms
Profitable non-zero debt firms
(by profit margin)
Non-profitable non-zero debt firms
(by profit margin)
Country Debt ratio γ2> 0.399 Debt ratio γ2> 0.577 debt ratio γ2>0.301
Bulgaria 0.1657 0.0226 0.0798
Czech Republic 0.1055 0.0101 0.0503
Hungary 0.0455 0.0000 0.0227
Latvia 0.1733 0.0133 0.0533
Poland 0.0625 0.0069 0.0104
Russian Federation 0.1959 0.0348 0.0365
Slovakia 0.0322 0.0092 0.0115
Slovenia 0.00 0.0000 0.000
Ukraine 0.0864 0.0108 0.0278
Note: These estimates make use of the threshold parameters obtained in Tables 8 (all non-zero debt firms) and 9 (profitable and non-profitable firms).
35
Table 11. Inter-country variation in threshold estimates for debt and liability ratios: Selected estimates (95% confidence intervals between brackets)
(1) (2) (3)
Debt ratio Liability ratio
Bank efficiency
Market capitalization
All firms Non-zero debt firms
All firms Non-zero debt firms
Bulgaria 5.51 8.74 0.354 (0.307, 0.387) 0.307 (0.288, 0.367)
0.354 (0.310, 0.366) 0.339 (0.269, 0.384)
Poland 5.07 20.77 0.409 (0.366, 0.437) 0.388 (0.344, 0.441)
0.399 (0.328, 0.451) 0.415 (0.377, 0.463)
Romania Russia 5.04 46.6 0.514 (0.439, 0.570) 0.529 (0.446,
0.604) 0.514 (0.491, 0.561) 0.547 (0.449,
0.674) Serbia 4.51 10.2 0.288 (0.266, 0.344) 0.327 (0.276,
0.388) 0.347 (0.310, 0.397) 0.377 (0.354,
0.406) Ukraine 4.68 12.12 0.461 (0.377, 0.503) 0.442 (0.394,
0.505) 0.439 (0.399, 0.488) 0.483 (0.450,
0.509) Note: Columns (1) and (2) show the average values of indices of bank efficiency and market capitalization. Column (3) shows the estimate of leverage threshold and also the lower and upper limits of the leverage threshold (in the parentheses) for debt and liability ratio for all firms as well as indebted firms only.
36
Figure 1. Growth of domestic credit to GDP in the CEE region
Growth of domestic credit to GDP (%)
-100
-80
-60
-40
-20
0
20
40
60
80
1996 1997 1998 1999 2000 2001 2002 2003 2004 2005 2006 2007 2008
BULGARIA CROATIA CZECH REPUBLIC HUNGARY
LATVIA POLAND ROMANIA RUSSIAN FEDERATION
SERBIA SLOVAK REPUBLIC SLOVENIA UKRAINE
37
Figure 2. Distribution of TFP growth in sample countries
-20
24
-20
24
-20
24
2002 2003 2004 20052002 2003 2004 20052002 2003 2004 2005
1 3 4
5 6 8
10 11 12
tfpgr
yearGraphs by countid
Note: List of countries: 1: Bulgaria; 3: Czech Republic; 4: Hungary; 5: Latvia; 6: Poland; 8: Russia; 10: Slovakia; 11: Slovenia;
12: Ukraine.
38
Appendix 1 Table A1. First-stage fixed effects estimates of debt ratio 2001-2005
Bulgaria Croatia Czech Hungary Latvia Poland (1) (2) (3) (4) (5) (6) Log assets 0.134*** 0.412 -0.0459 -0.474** -0.226 0.0428** (0.0434) (0.440) (0.0609) (0.159) (0.228) (0.0216) Asset growth -0.0204 -0.435* 0.00247 0.192 -0.0433 -0.00424* (0.0223) (0.200) (0.00236) (0.129) (0.109) (0.00243) age -0.0181 -0.0689 -0.0369 0.119* 0.0451 0.00190 (0.0142) (0.0994) (0.0291) (0.0445) (0.0346) (0.0143) fixed assets -0.224** 0.310 -0.122 0.362 -0.103 0.202* (0.109) (0.790) (0.214) (0.503) (0.270) (0.117) intangible assets 0.135 -1.462 -2.624** -12.29** -0.647** 0.0377 (0.699) (2.311) (1.132) (3.264) (0.317) (0.349) profitability -0.844*** 0.0877 -0.0679 0.573 0.632 0.111 (0.0712) (0.699) (0.117) (0.408) (1.563) (0.0870) Shareholder’s funds 0.299*** -0.0263 0.733*** 0.628 -0.712 -0.0747 (0.0927) (0.478) (0.185) (0.674) (0.782) (0.0698) Industry_median 0.0682 0.663 0.269 0.0112 0.374 0.140 (0.0675) (0.561) (0.213) (0.771) (0.415) (0.122) inflation -0.00353 0.0295 0.0328 -0.00310 -0.00716 0.000275 (0.00533) (0.0838) (0.0202) (0.00841) (0.0162) (0.00666) Constant -0.101 -0.107 1.148 1.277 1.391 -0.230 (0.526) (2.818) (0.761) (1.212) (2.268) (0.433) Observations 332 37 89 22 30 204 Number of firms 131 16 33 9 13 91 R-squared 0.483 0.495 0.309 0.987 0.417 0.096
Standard errors in parentheses; *** p<0.01, ** p<0.05, * p<0.1; all variables are lagged by one year. See note to Table 5 for variable definitions.
39
Table A1 (continued). First-stage fixed effects estimates of debt ratio 2001-2005
Romania Russia Serbia Slovakia Slovenia Ukraine (7) (8) (9) (10) (11) (12) Log assets 7.92e-05 7.92e-05 0.000788 -0.00648 1.607* 0.0472** (5.59e-05) (5.59e-05) (0.0314) (0.0422) (0.898) (0.0234) Asset growth -2.39e-05 -2.39e-05 0.0293 0.0231 0.396 -0.0137 (3.24e-05) (3.24e-05) (0.0216) (0.0214) (0.165) (0.0126) age -5.34e-05 -5.34e-05 0.0180* 0.0386* -0.151 -0.00603 (0.000113) (0.000113) (0.0103) (0.0194) (0.144) (0.114) fixed assets -2.95e-05 -2.95e-05 0.0166 0.174* -2.227 -0.0346 (0.000135) (0.000135) (0.0618) (0.0877) (1.913) (0.0827) intangible assets -0.00212** -0.00212* 0.0965 -0.356 0.334 0.253 (0.00103) (0.00113) (0.162) (0.284) (4.698) (1.037) profitability -0.000125 -0.000125 0.0313 -0.105 1.530* 0.0432* (0.000146) (0.000146) (0.0755) (0.0813) (0.788) (0.0223) Shareholder’s funds 6.78e-05 6.78e-05 -0.0512 0.00411 4.498** -0.00800 (8.74e-05) (8.74e-05) (0.0556) (0.00714) (2.165) (0.0645) Industry_median -0.00139*** -0.00139*** 0.129 -0.135 -1.959* -0.0646 (0.000348) (0.000348) (0.110) (0.204) (0.981) (0.109) inflation -8.85e-06 -8.85e-06 0.00218 0.00860 -0.00616 0.00320 (3.83e-05) (3.83e-05) (0.00247) (0.00525) (0.0440) (0.0273) Constant 0.00479* 0.00479* -0.697* -0.511 -10.59 -0.289 (0.00244) (0.00244) (0.365) (0.387) (5.794) (0.776) Observations 121 121 511 186 16 378 Number of firms 43 43 177 80 6 127 R-squared 0.260 0.260 0.086 0.096 0.971 0.054
Standard errors in parentheses; *** p<0.01, ** p<0.05, * p<0.1; all variables are lagged by one year. See note to Table 5 for variable definitions.
40
Table A1 (continued). First-stage fixed effects estimates of liability ratio 2001-2005 Bulgaria Croatia Czech Hungary Latvia Poland (1) (2) (3) (4) (5) (6) Log assets 0.148 0.0205 -0.00129 0.496*** -0.207 0.131** (0.0956) (0.0540) (0.0510) (0.0920) (0.247) (0.0516) Asset growth -0.0257 -0.0402 0.00117 -0.161** 0.0115 -0.00148 (0.0497) (0.0388) (0.00201) (0.0565) (0.156) (0.00173) age 0.0363 0.0191 -0.0364 -0.142*** 0.0356 -0.0508*** (0.0313) (0.0184) (0.0246) (0.0236) (0.0559) (0.0185) fixed assets -0.405* -0.0731 -0.149 0.114 -0.426 0.0596 (0.244) (0.113) (0.186) (0.222) (0.419) (0.103) intangible assets 0.369 -1.051 -2.969*** -10.28*** 1.261** 0.440 (1.570) (0.863) (0.928) (1.392) (0.622) (0.558) profitability -3.503*** 0.275* -0.0777 -1.675*** -0.620 -0.213*** (0.155) (0.152) (0.0987) (0.195) (1.340) (0.0814) Shareholder’s funds 0.934*** -0.268** 1.027*** 2.086*** -0.441 0.391*** (0.206) (0.107) (0.179) (0.322) (1.075) (0.113) Industry_median -0.0607 -0.0113 0.604*** 2.156*** -0.279 0.125 (0.0612) (0.132) (0.195) (0.213) (0.708) (0.111) inflation -0.0287** -0.0169 0.0169 -0.00286 0.000949 0.0174* (0.0118) (0.0195) (0.0170) (0.00377) (0.0243) (0.0101) Constant -2.323** -0.690 0.596 -1.924** 2.014 1.418** (1.154) (0.893) (0.671) (0.672) (2.624) (0.696) Observations 341 250 89 23 32 244 Number of firms 132 88 33 10 13 101 R-squared 0.732 0.142 0.480 0.993 0.402 0.144
Standard errors in parentheses; *** p<0.01, ** p<0.05, * p<0; all variables are lagged by one year. See note to Table 5 for variable definitions.
41
Table A1(continued). First-stage fixed effects estimates of liability ratio 2001-2005
Romania Russia Serbia Slovakia Slovenia Ukraine (7) (8) (9) (10) (11) (12) Log assets 0.182** -0.0199 -0.0166 0.159*** 0.185 -0.0333 (0.0756) (0.0133) (0.0383) (0.0523) (0.181) (0.0358) Asset growth -0.0688 7.89e-05 0.00952 0.0644** 0.0338 0.00230 (0.0438) (6.41e-05) (0.0265) (0.0254) (0.0835) (0.0150) age -0.156 -0.00135 0.0731*** 0.00806 0.0675 0.0100 (0.151) (0.0103) (0.0128) (0.0228) (0.0520) (0.135) fixed assets -0.122 -0.151 -0.00113 0.512*** -0.0517 -0.0115 (0.184) (0.134) (0.0757) (0.108) (0.0770) (0.0971) intangible assets 2.242 0.00283 0.0168 -0.828** 1.426 -0.642 (2.491) (1.150) (0.198) (0.333) (1.204) (1.236) profitability -0.807*** 0.0274 -0.126 -0.353*** 0.755 0.0301 (0.202) (0.123) (0.0924) (0.0963) (0.545) (0.0976) Shareholder’s funds 0.182 0.120* -0.134* -0.115 0.172 -0.309*** (0.150) (0.0625) (0.0724) (0.0846) (0.310) (0.0832) Industry_median -0.144 0.290** 0.122 -0.0375 -0.158 -0.00537 (0.160) (0.126) (0.109) (0.0856) (0.176) (0.0876) inflation -0.0358 -0.00959 -0.00714** 0.000667 0.0428 -5.60e-05 (0.0511) (0.00621) (0.00304) (0.00614) (0.0331) (0.0323) Constant 1.873 115.1*** -2.587*** -1.003* -6.455 0.906 (3.255) (0.426) (0.449) (0.512) (3.872) (0.917) Observations 121 426 511 186 60 378 Number of firms 43 170 177 80 21 127 R-squared 0.267 0.054 0.265 0.620 0.474 0.105
Standard errors in parentheses; *** p<0.01, ** p<0.05, * p<0.1; all variables are lagged by one year. See note to Table 5 for variable definitions.
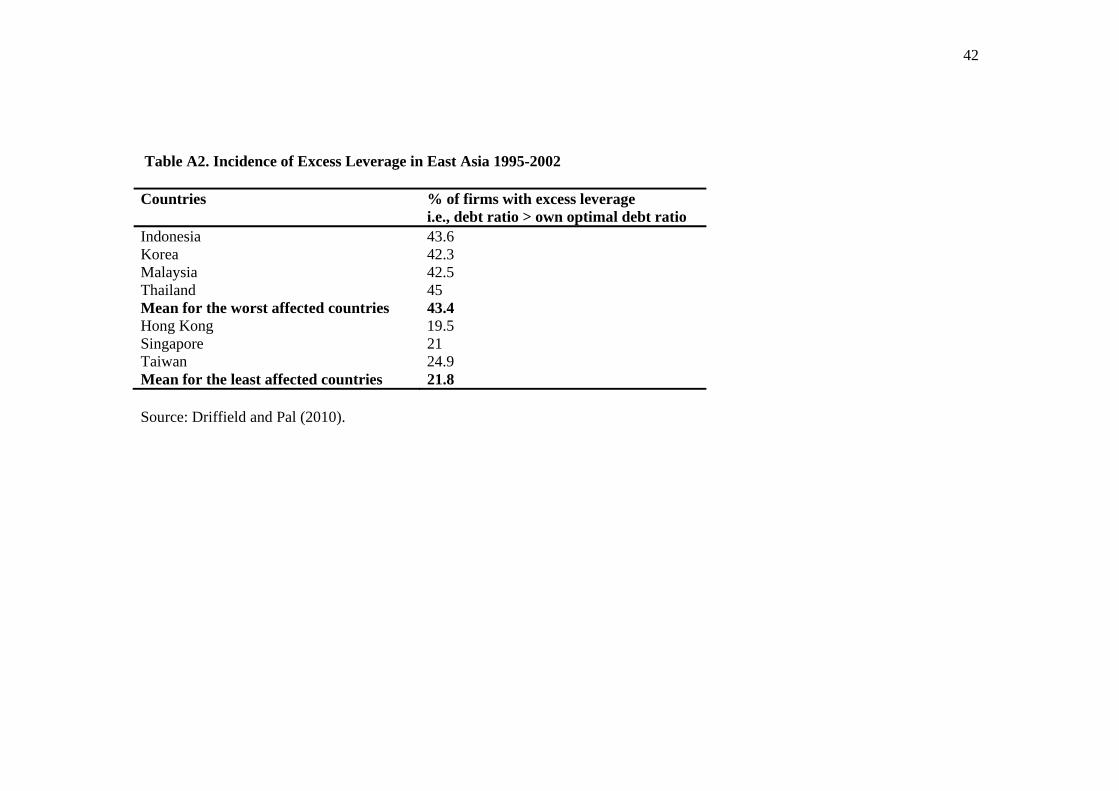
42
Table A2. Incidence of Excess Leverage in East Asia 1995-2002 Countries % of firms with excess leverage
i.e., debt ratio > own optimal debt ratio Indonesia 43.6 Korea 42.3 Malaysia 42.5 Thailand 45 Mean for the worst affected countries 43.4 Hong Kong 19.5 Singapore 21 Taiwan 24.9 Mean for the least affected countries 21.8 Source: Driffield and Pal (2010).
43
Table A3. Further robustness checks of threshold estimates Case 1 Firm size
All larger firms All indebted larger firms
All larger firms All indebted larger firms
Variable Coefficient t-statistic Coefficient
t-statistic Variable Coefficient t-statistic Coefficient
t-statistic
TDTA+ -0.0215 -3.8615 -0.4616 -4.6344 TLTA+ -0.231 -2.517 -0.3242 -5.6294 TDTA= 0.0845 3.2176 0.0874 2.7003 TLTA= 0.0697 1.8198 0.0945 2.9145 TDTA- 0.3421 1.9773 0.2142 3.3905 TLTA- 0.4495 2.3502 0.5741 4.7187 95% CI to threshold
0.317-0.334 0.321-0.403 95% CI to threshold
0.337-0.407 0.361-0.399
Case 2 Intangibles
All firms with high intangibles
All indebted firms with high
intangibles
All firms with high intangibles
All indebted firms with high
intangibles Variable Coefficient t-statistic Coefficien
t t-statistic Variable Coefficient t-statistic Coefficie
nt t-statistic
TDTA+ -0.0251 -3.0788 -0.4531 -3.71 TLTA+ -0.2003 -2.3491 -0.2632 -6.2404 TDTA= 0.1043 2.7073 0.0853 2.1686 TLTA= 0.0631 1.8018 0.0809 2.9414 TDTA- 0.3586 1.5929 0.2615 3.1402 TLTA- 0.3544 2.785 0.6861 4.8787 95% CI to threshold
0.458-0.504 0.364-0.447 95% CI to threshold
0.401-0.442 0.392-0.426
Note. TDTA refers to debt ratio while TLTA refers to liability ratio. TDTA+, TLTA+ refer to values of leverage in excess of the upper threshold; TDTA=, TLTA= refer to the values of leverage between the upper and lower threshold while TDTA-, TLTA- refer to the values of leverage below the lower threshold. CI refers to confidence interval. Other control variables are same as in Table 7.
44
Appendix 2 Calculation of TFP The approach and methodology are well developed and adopted from the existing literature (see e.g., Griffith 1999). This essentially involves estimating the following basic production function:
(A1) where subscripts i, t refer to firm and year; yit, kit, lit, and mit represent the logarithm of a firm’s output (sales) and the production inputs: capital (measured as the book value of fixed assets), labour (number of employees) and material costs respectively. We estimate it from (1) as TFP and then determine the log(TFP). To deflate monetary values we use the appropriate producer price index for each manufacturing industry and consumer price index for services available from EU-KLMS (Gottingen) and also WWII (Vienna).
One of the most common econometric problems with the estimation of TFP concerns endogeneity, when regressors and the error terms become correlated. This is because at least a part of the TFP will be observed by the firm at a time early enough so as to allow the firm to change the factor input decision. If that is the case, then profit maximization implies that the realisation of the error term is expected to influence the decision on factor inputs. Consequently the OLS estimates could turn out to be inconsistent. As an alternative we use Levinsohn-Petrin correction, who extend Olley and Pakes (1996) approach by using material inputs as a proxy to control for unobservable productivity shocks, as it is more common for firms to register material costs every year. Accordingly, we generate two series TFP and TFP_LP using the standard and Levinsohn-Petrin methods respectively, although TFP_LP remains our preferred measure.