evaluation and return on investment sm champs training ... · • develop a rounded understanding...
TRANSCRIPT

Evaluation and Return on Investment SM
June 2011
ChaMPs training course

The social marketing process
Reviewing and assessing the impact of
the intervention.

The social marketing process
Communicating outcomes and lessons
learned to funders, stakeholders and a
wider audience.
Learning objectives
• Develop a rounded understanding of the role of evaluation in
behaviour change work
• Understand the 3 different types and stages of evaluation –
formative, process and outcome
• Develop ability to plan an evaluation framework that is tailored
to your intervention ‘game plan’
• Build confidence to monitor and evaluate interventions
• Know pros and cons of different data collection methods
• Appreciate how evaluation links to cost effectiveness and
return on investment
• Know how to structure and write an Evaluation Report
• Recognise the importance of ‘Follow up’ and ‘Dissemination’

Session outline
• Warm up exercise (15 mins)
• Evaluation – what and why? – understanding & experience of ‘evaluation (15 mins)
• Terms and terminology (10 mins)
• Mapping out a ‘game plan’ – logic model framework (15 mins)
• Task 1 - Logic Model - resources, activities; outputs (20 mins)
– BREAK (15 mins)
• Types of evaluation – formative; process; and outcome (10 mins)
• Task 2 - Logic Model – outcomes (short/med/longer) (20 mins)
• Overview of data collection methods (15 mins)
• Task 3 - Logic Model – indicators and data sources (20 mins)
• Cost effectiveness – ROI and SROI (15 mins)
• Writing an Evaluation Report – structure and content (5 mins)
• Follow up & Dissemination – forward planning/sharing (5 mins)

Group warm up exercise
Take 10 minutes to think about
issues to consider in evaluating
the 3 candidates for budget cuts

Warm up exercise
Source:

Question - Why bother?

Value of evaluation
• Check how the intervention is going – on track?
• Is it making a difference?
• Is it worth the investment?
• Identify strengths and weaknesses
• Generate ideas/insight into behaviour
• Point up how to improve the intervention
• Support advocacy for continuation or extension
• Be accountable to funders and stakeholders
• Provide INSIGHT into what works and why

Has the intervention worked
as intended?
What impact and outcomes
have been achieved on the
target behaviours?
Where evaluation fits within NSMC’s
behaviour change model

Where ‘evaluate’ fits within the 6Es

Question – WHEN should you
start to think about evaluation?

Some terminology

…. to be comfortable with
Impact
assessment
Goals
Payback
&
Net payback Outcomes
Outputs
Return on
Investment
Cost effectiveness Baseline
Targets
Indicators Behavioural
goals
Indicators
Indicators
Your overall ‘Game Plan’
(your theory of how the
intervention will work)

Planning for success
Assess the
behavioural
challenge
facing you.
What are
you up
against?
What
resources
have you
got to do
the job?
How are
you going
to use
these
resources?
What
will/do you
actually
get– what’s
the ‘game
statistics’?
How
successful
has it been
– how well
did your
game plan
work out?
Are you on
track? Are
you half
way there?
Have you
achieved
the goal?
Think about intervention development-implementation-evaluation as building a ‘game plan’.
You are the ‘manager’ or the ‘planner’. What do you need to be thinking about? How do you plan to succeed? What do you need to do and when?
Problem,
challenge,
situation
Resources
to input to
intervention
Activities and Outputs Impacts and Outcomes

Outputs –
‘activities
into
practice’
Outcomes – ‘behavioural ones’ Goal – the
ultimate
‘end game’ short medium longer
sustained
Ultimate
outcome of
behavioural
changes
achieved

A developed example of a
game plan (or Logic Model)
US smoking cessation in the
workplace

Example


Ingredients of familiar interventions
Challenge
The behaviour
challenge – the
problem you want
to address.
Clear idea of what
you want to
achieve (GOAL)
and what you need
to do to get there,
or move towards
the ‘ultimate’ GOAL
NB – different
target audiences
Inputs Activities Outputs
The resources you
deploy to tackle the
challenge:
•Organisations
•People / staff
•Time
•Money
•‘In kind’ support
How you use the
resources. The things
you do - processes,
events, actions, tactics:
•Service change or
development
•Training courses or
workshops
•Awareness campaign
•Information materials
•Advisory group
How much, how
many, how often,
over what duration:
•New screening van
out twice a week
•Y number of training
places created
•Day course running
4 times over months
with 50 places
•5,000 leaflets in GP
practices
•Free swimming at
weekends
Insight gathering
and segmentation Development and implementation

Building your Logic Model –
1st task
Take a project or intervention you
know about and map out:
Resources-Activities-Outputs

Challenge Inputs Activities Outputs

Types of evaluation
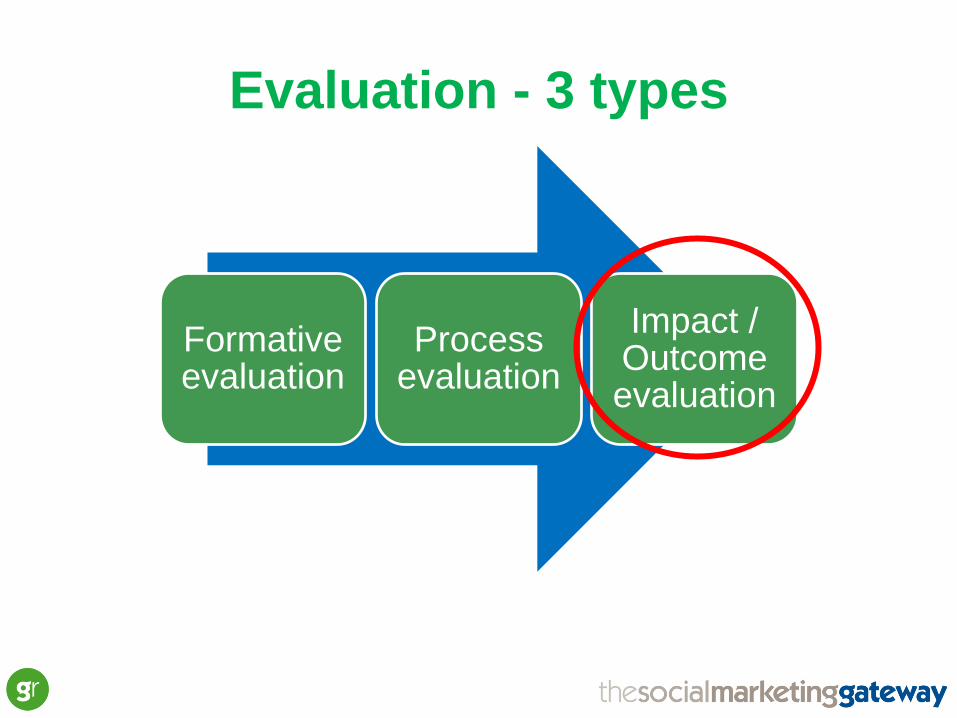
Evaluation - 3 types
Formative evaluation
Process evaluation
Impact / Outcome evaluation

Formative evaluation
• Carried out at an early stage of the process
• Helps develop the intervention, including
baseline and evaluation
• Finds out what is likely to motivate the target
audience
• Ensures that the intervention will be accessible
and understandable
• Tests if it is likely to work in way intended

Process evaluation
• Has the intervention worked (is it working) as planned?
• Concern with how it was implemented and functioned
• Can be done ‘during’ implementation’ (monitoring) and at
the ‘end’ of the intervention
• Otherwise - “It’s rather like a critic who reviews a
production on the basis of the script and the applause
meter readings, having missed the performance.”
• Has target audience been reached and received ‘dose’
intended?
• Has there been ‘project drift’?

Outcome evaluation
(Impact assessment) • Judge and demonstrate the success (or otherwise) of your
intervention
• Assess outcomes using indicators across short, medium and long-
term timescales
• Be as objective as possible – e.g. use several data sources to check
and validate your evaluative findings
– ‘Triangulation’ - do not rely solely on one data source, compare it
with others to see if you are getting a recurring and reliable
picture of the impact
– e.g. the target audience may report that it is eating more fresh
fruit and veg. Does this square with what local shopkeepers say
and with data on food sales?
• Cost-effectiveness, or the return on investment (ROI)

Goal/s
Reduced childhood
obesity, diabetes
etc
Greater prevention
of avoidable
illnesses
Reduced morbidity
and mortality as a
result of healthier
lifestyles and
prevention of
illness
Short-term Medium-Term Longer-term
Target audience
aware of how to (and
value of) changing
behaviour
Attendance on
training programme
Reading and
understanding
information materials
New skills acquired
Joining Stop Smoking
or Weight Loss club
Eating 2 pieces of
veg/fruit a day at
least 3 times a week
New motivation to
change developed
Greater confidence /
Self-efficacy acquired
Intention to change /
Change goals being set
Counting units of
alcohol / Drinking glass
of water between
alcohol drinks
Eating 5 a day 2-3
times a week
Quitting smoking for 3
months
Engaging in physical
activity 5 times a
week
Eating ‘5 a day’ every
day
Drinking responsibly
every night out
Staying quit for a
year or more
Going back to the
weight management
club when ‘the
pounds start to creep
on’
Outcomes
Achieving the desired social
change may take a lot
longer to achieve or work
through than the life of the
intervention
Ingredients of familiar interventions
Building your Logic Model–
2nd task
Now map out:
Outcomes (across short-medium-longer terms as appropriate)
&
Ultimate goal (if appropriate)

Goal/s Short-term Medium-Term Longer-term
Outcomes

How to collect data?
Overview of data collection methods
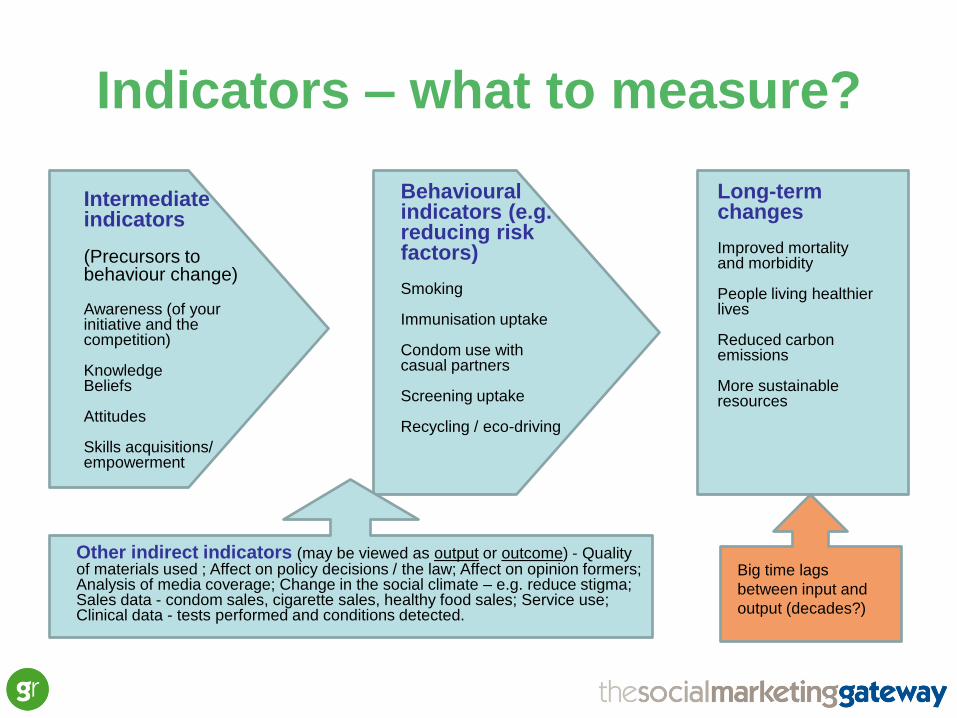
Indicators – what to measure?
Long-term changes Improved mortality and morbidity People living healthier lives Reduced carbon emissions More sustainable resources
Intermediate indicators (Precursors to behaviour change) Awareness (of your initiative and the competition) Knowledge Beliefs Attitudes Skills acquisitions/ empowerment
Behavioural indicators (e.g. reducing risk factors) Smoking Immunisation uptake Condom use with casual partners Screening uptake Recycling / eco-driving
Big time lags
between input and
output (decades?)
Other indirect indicators (may be viewed as output or outcome) - Quality of materials used ; Affect on policy decisions / the law; Affect on opinion formers; Analysis of media coverage; Change in the social climate – e.g. reduce stigma; Sales data - condom sales, cigarette sales, healthy food sales; Service use; Clinical data - tests performed and conditions detected.
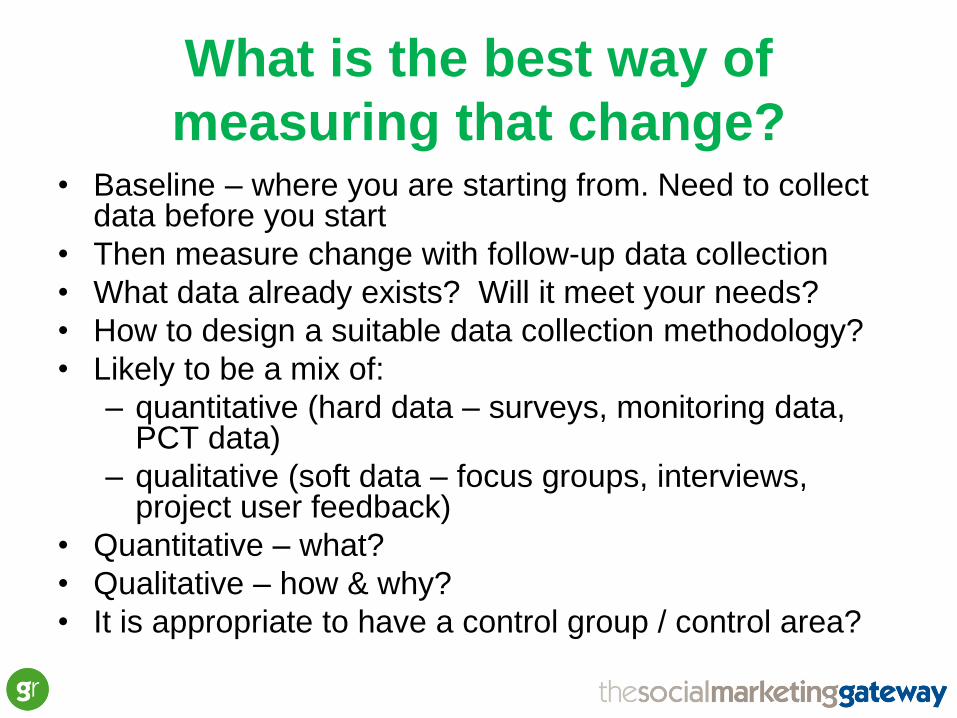
What is the best way of
measuring that change? • Baseline – where you are starting from. Need to collect
data before you start
• Then measure change with follow-up data collection
• What data already exists? Will it meet your needs?
• How to design a suitable data collection methodology?
• Likely to be a mix of:
– quantitative (hard data – surveys, monitoring data, PCT data)
– qualitative (soft data – focus groups, interviews, project user feedback)
• Quantitative – what?
• Qualitative – how & why?
• It is appropriate to have a control group / control area?

Typical Randomised Controlled Trial design
Test Group
Receives a dose of
the intervention
Control Group
Does not receive a
dose of the
intervention
People are randomly assigned to a test
group or a control group
Test sample interviewed
before intervention
Control sample interviewed
before intervention
Test sample interviewed
again after the intervention
Control sample interviewed
again before intervention
Results from test and control groups are
compared and any effects can be reliably
attributed to the intervention
Baseline
Follow-
up
Source:
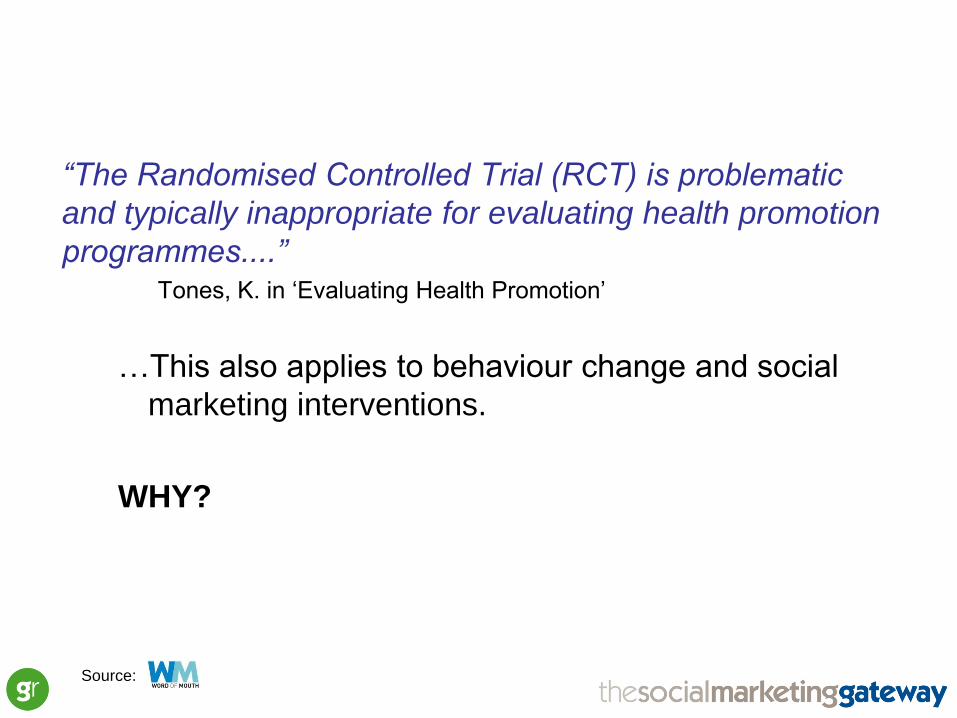
“The Randomised Controlled Trial (RCT) is problematic
and typically inappropriate for evaluating health promotion
programmes....” Tones, K. in ‘Evaluating Health Promotion’
…This also applies to behaviour change and social
marketing interventions.
WHY?
Source:

• Testing a relatively quick cure for specific illness.
• Larger effects achieved quickly
• Easier to gain agreement from health professionals and individuals to conduct trial
• Participants are usually seeking a cure/remedy
• External validity i.e. whether the findings can be generalised to the wider population. In clinical trials results are only valid for the groups tested.
• Prevent ill health in the future (sometimes 40 years in the future).
• Smaller effects achieved over a longer period
• Approval for trial can be more difficult to secure. There are more players involved and there are ethical issues when the need for social intervention is urgent e.g. HIV campaigns
• Participants currently well and may not perceive themselves as needing help - recruitment more difficult
• Participants more likely to be younger, higher social class and more likely to believe in and adopt a healthier lifestyle than non participants - External validity can be compromised. Also testing under unusual conditions may not be reproducible in the real world
Clinical trials Social marketing trials
Clinical v social marketing trials
Source:

• Clinical trials usually have a simpler biological basis (drugs, surgery, physio) and are easier to control
• Unit of randomisation – individual
• Internal validity (a measure of the extent to which the findings are real and not the result of bias). With RCTs this is not a problem. Control group placebo possible. Double blind possible
• Exposure of control group to intervention more easily controlled
• Can be multi-faceted, complex interventions which diffuse into the population to achieve behavioural change at the individual or societal level. There is a lot of extraneous ‘noise’ to control
• Unit of randomisation, individual, community or nation. Individual randomisation can be difficult
• Difficult to devise a placebo for a community development intervention. Impossible to blind people to the fact they have received a HP intervention
• High risk that the control group (e.g. neighbouring community) is exposed to intervention
Clinical trials Social marketing trials
Clinical v social marketing trials
Source:
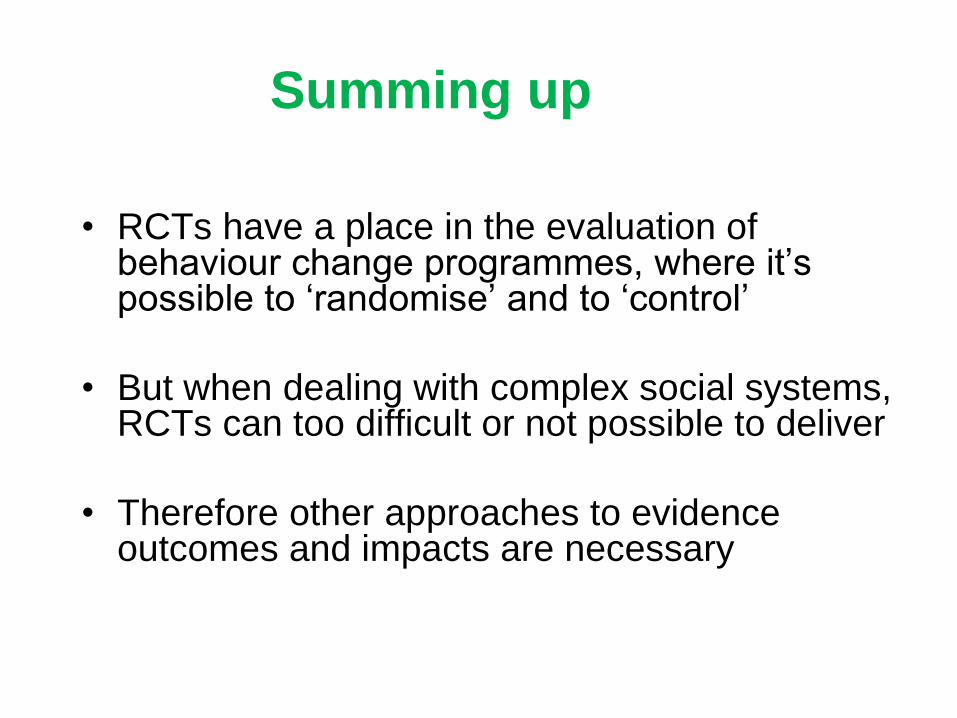
Summing up
• RCTs have a place in the evaluation of behaviour change programmes, where it’s possible to ‘randomise’ and to ‘control’
• But when dealing with complex social systems, RCTs can too difficult or not possible to deliver
• Therefore other approaches to evidence outcomes and impacts are necessary

Common data collection
methods
• The key part of any evaluation is selecting the
right methods
• Some of the main methods used in evaluation:
– Surveys
– Focus groups
– Semi-structured interviews
– Participatory approaches
• What’s the ‘pros’ and ‘cons’ of each?

Quick Group Refection
In your experience, what the
benefits / weaknesses – the pros
and cons – of each method?

Overview of data collection methods
Data collection
method
Benefits? Weaknesses?
Surveys
Semi-structured
interviews
Focus groups
Participatory
approaches
? ?

Surveys
Benefits Opportunities Weaknesses Top Tips
easy to get large
amount of data
from lots of
people
can provide good
overview – able to
generalise
good for scoping/
understanding
context
can ask for
contact details to
follow up
interviews or
focus groups
data is limited –
closed responses
questions can be
ambiguous and if
self-completed, no
opportunity for
clarification
low response rate
can limit validity of
data
e-surveys are
easy, quick and
get a better
response rate
incentives help
increase response
rate
piloting surveys
can help to pick
out inappropriate
or ambiguous
questions
Source: LGI&D

Semi-structured interviews
Benefits Opportunities Weaknesses Top Tips
more in-depth
data
can clarify
meaning of
questions
able to ask follow-
up questions for
more info
deeper
understanding of
issues and views
good for a clearer
understanding of
views across a
range of
stakeholders
more time-
consuming –
limited number of
people can speak
to
difficulties
standardising key
questions with
range of
interviewers and
analysing
evidence
getting a good
interview
schedule is v
important - got to
cover key
research Qs and
allow room for
follow-up
building a rapport
is key to getting
respondent to
trust you and
open up
Source: LGI&D
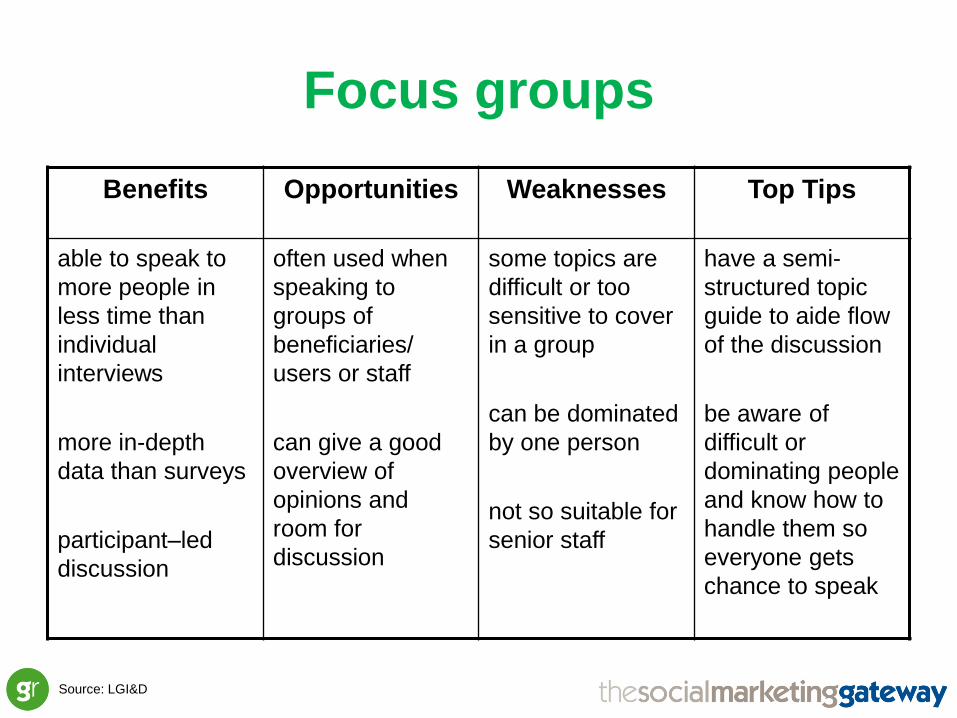
Focus groups
Benefits Opportunities Weaknesses Top Tips
able to speak to
more people in
less time than
individual
interviews
more in-depth
data than surveys
participant–led
discussion
often used when
speaking to
groups of
beneficiaries/
users or staff
can give a good
overview of
opinions and
room for
discussion
some topics are
difficult or too
sensitive to cover
in a group
can be dominated
by one person
not so suitable for
senior staff
have a semi-
structured topic
guide to aide flow
of the discussion
be aware of
difficult or
dominating people
and know how to
handle them so
everyone gets
chance to speak
Source: LGI&D

Participatory approaches
Benefits Opportunities Weaknesses Top Tips
more fun and
interactive
helps to break the
ice
includes everyone
– less chance for
one person to
dominate
good for use with
young people or
other specific
groups of
beneficiaries
can be fairly
closed – may
need to follow up
with a discussion
some topics
difficult or not
appropriate to ask
people about in
this way
make sure
activities are well
planned and you
know exactly what
you’re doing
beforehand
make sure it’s the
right method for
getting the info
you want
Source: LGI&D

Building your Logic Model –
3rd task
Returning to your game plan, what INDICATORS could be used to
measure outcomes and how might you gather the DATA?

Short-term Medium-Term Longer-term
Outcomes
Measurement
indicators?
How the data will
be collected?
Measurement
indicators?
How the data will
be collected?
Measurement
indicators?
How the data will be
collected?
Return on Investment
&
Social Return on Investment


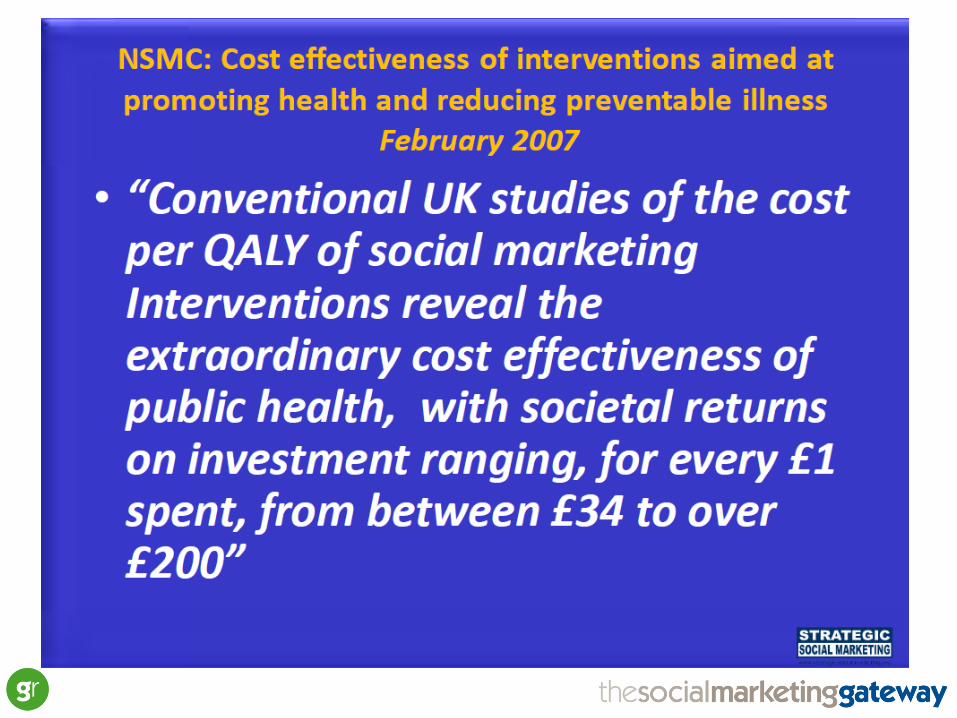
Prevention and the costs of ill health
• Need for effective prevention strategies is
clear
• Progress at the prevention end of spectrum
reduces more deep set problems requiring
more ‘expensive’ treatments
• The costs of not preventing ill health are
considerable
• Just look at the figures…

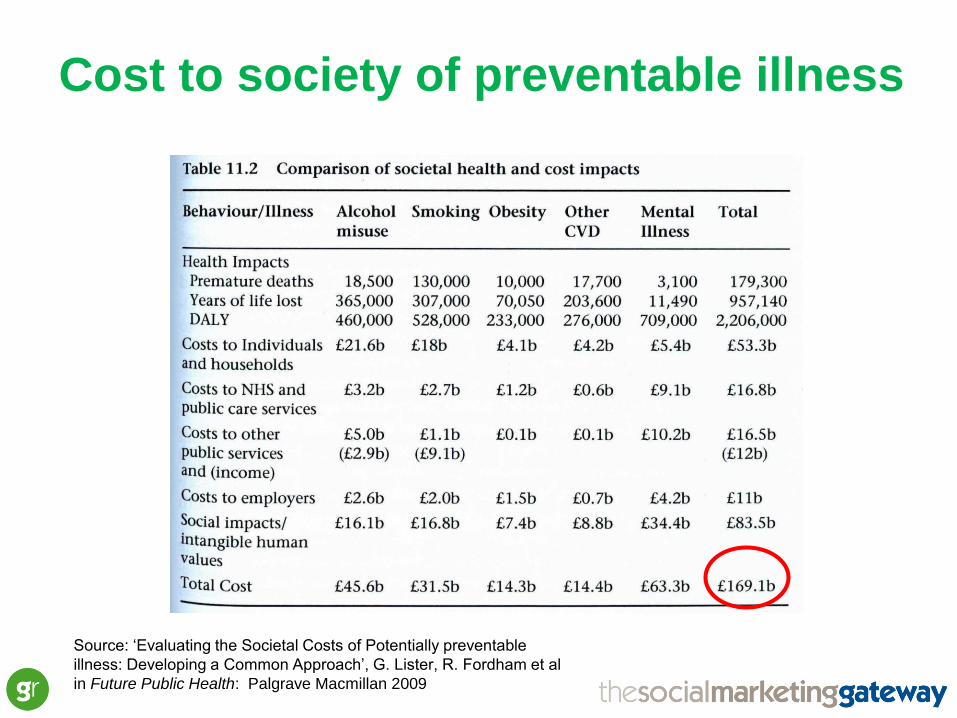
Cost to society of preventable illness
Source: ‘Evaluating the Societal Costs of Potentially preventable
illness: Developing a Common Approach’, G. Lister, R. Fordham et al
in Future Public Health: Palgrave Macmillan 2009
Source: ‘Evaluating the Societal Costs of Potentially preventable
illness: Developing a Common Approach’, G. Lister, R. Fordham et al
in Future Public Health: Palgrave Macmillan 2009
Cost to society of preventable illness

Return on Investment (ROI)
• Is it value for money? Is it cost effective?
• A performance measure used to evaluate efficiency and cost effectiveness.
• When assessing ROI - consider timeframes involved, in particular the long term implications for sustaining a return as well as comparing it against the relative impact of other interventions/ investments.
ROI =
(Net gain) _
(All associated intervention costs)
• Net gain = intervention cost reduction, saving or avoidance minus all associated intervention costs
• Expressed as a ratio or percentage
Numbers of current attendance annually 1,000
Percentage increase projected by increasing opening times 10%
Number of new clients 100
Percentage of new clients expected to quit 25%
Number of additional quitters 25
Average cost saving per quitter £3,000
Annual gross cost saving (25 x £3,000) £75,000
Annual costs of providing extended opening £20,000
Net cost savings £55,000
ROI (55,000/20,000) ?
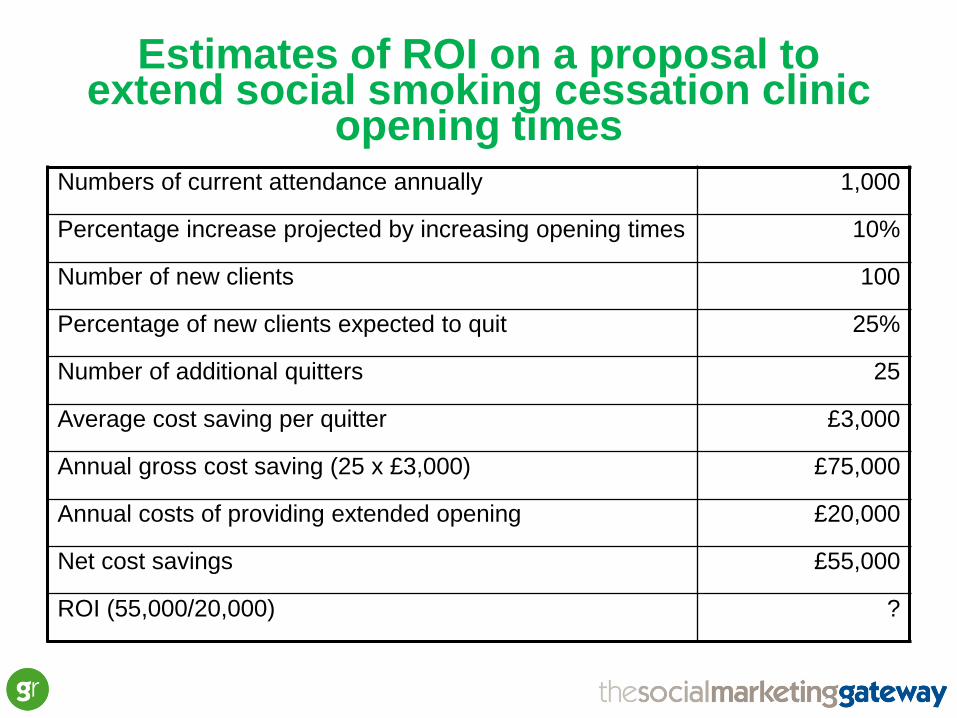
Estimates of ROI on a proposal to extend social smoking cessation clinic
opening times

Estimates of ROI on a proposal to extend social smoking cessation clinic
opening times Numbers of current attendance annually 1,000
Percentage increase projected by increasing opening times 10%
Number of new clients 100
Percentage of new clients expected to quit 25%
Number of additional quitters 25
Average cost saving per quitter £3,000
Annual gross cost saving (25 x £3,000) £75,000
Annual costs of providing extended opening £20,000
Net cost savings £55,000
ROI (55,000/20,000) 2.75 : 1 or 275%


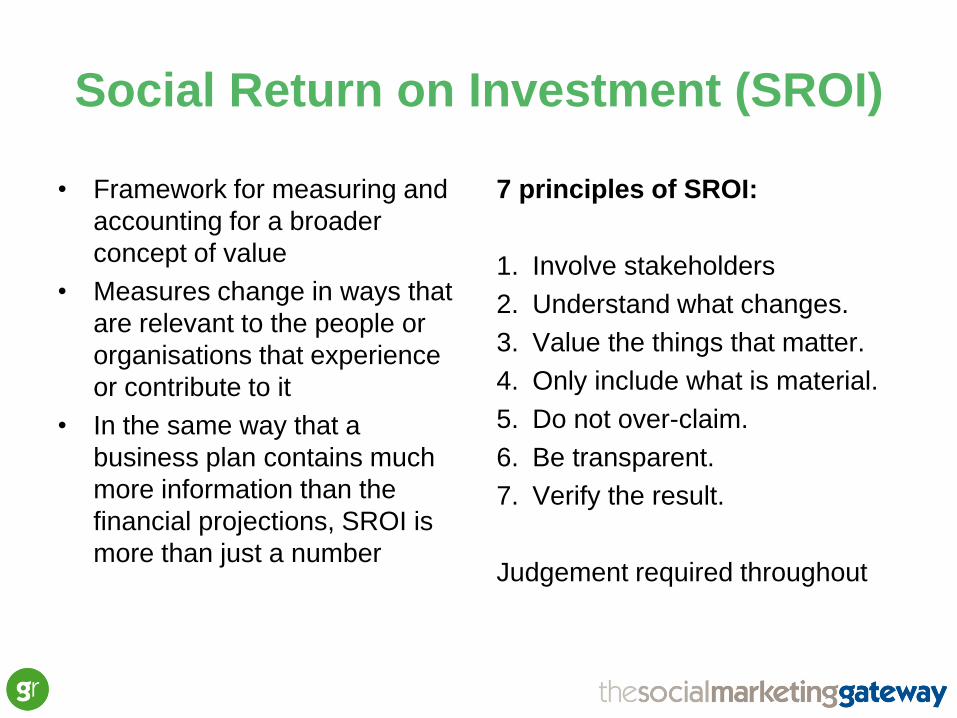
Social Return on Investment (SROI)
• Framework for measuring and
accounting for a broader
concept of value
• Measures change in ways that
are relevant to the people or
organisations that experience
or contribute to it
• In the same way that a
business plan contains much
more information than the
financial projections, SROI is
more than just a number
7 principles of SROI:
1. Involve stakeholders
2. Understand what changes.
3. Value the things that matter.
4. Only include what is material.
5. Do not over-claim.
6. Be transparent.
7. Verify the result.
Judgement required throughout

The stages in SROI
1.Establishing scope and identifying key
stakeholders
2.Mapping outcomes
3.Evidencing outcomes and giving them a value
4.Establishing impact
5.Calculating the SROI
6.Reporting, using and embedding


Writing the Evaluation
Report

Components of evaluation report
• Executive summary
• Overview of the project
• Project Objectives
• Baseline data
• Evaluation methodology
• Results
• Analysis of results
• Demonstration of return on investment and cost benefit
analysis
• Implications and recommendations for further activity

Follow up & Dissemination
Follow up
• What have you
learned from your
evaluation?
• What do you need to
do now?
• How will these
changes happen?

Embedding key learnings
Recommend-
ation
Action to be
taken
Responsibility
Completion
date
Review date
What do your
findings provide
evidence of?
What
improvements
should be made
as a result of
the findings and
learning from
the impact
assessment?
What activities
need to be
carried out to
make sure the
improvements
are made?
Who will be
accountable for
making sure the
actions
happen?
When do the
actions need to
be completed
by?
When will you
review this
action plan to
make sure it is
being
delivered?
Source: LGI&D

Dissemination planning
Audience Audience’s
interest
Dissemination
method
Which groups do you
need to share your
findings with?
What, from your
impact assessment,
will each group be
interested in?
How will you present
and share this
information with them?
Source: LGI&D

• What are the main things that people have
taken out of the session?
• What are the main learnings?
Key learning points

• Local Government Improvement and Development (2011),
Measuring impact in health improvement: An accessible guide for
health practitioners. London: LGI&D.
• COI (2009), Payback and Return on Investment on Marketing
Investment (ROMI) in the Public Sector.
• Cabinet Office (2009), Guide to Social Return on Investment (Office
of the Third Sector).
• Ellen Taylor-Powell, University of Wisconsin, ‘Logic Models to
Enhance Programme Performance’, web link:
http://www.uwex.edu/ces/pdande/evaluation/pdf/LMpresentation.pdf
• www.socialmarketing-toolbox.com
• www.socialmarketinggateway.co.uk
Resources


Contact details:
Mike Hope
Lead Associate
Social Marketing Gateway
Ingram House
227 Ingram Street
Glasgow
G1 1DA
M: 07941 401 699